

Abstract
The cortico-basal ganglia-thalamo-cortical feedback loops that consist of distinct white matter pathways are important for understanding in vivo imaging studies of functional and anatomical connectivity, and for localizing subthalamic white matter structures in surgical approaches for movement disorders, such as Parkinson’s disease. Connectomic analysis in animals has identified fiber connections between the basal ganglia and thalamus, which pass through the fields of Forel, where other fiber pathways related to motor, sensory, and cognitive functions co-exist. We now report these pathways in the human brain on ex vivo mesoscopic (250 μm) diffusion tensor imaging and on tractography. The locations of the tracts were identified relative to the adjacent gray matter structures, such as the internal and external segments of the globus pallidus; the zona incerta; the subthalamic nucleus; the substantia nigra pars reticulata and compacta; and the thalamus. The connectome atlas of the human subthalamic region may serve as a resource for imaging studies and for neurosurgical planning.
Keywords: diffusion, tractography, basal ganglia, thalamus, subthalamic, fields of Forel
Introduction
The brain consists of gray matter structures that bear basic units of brain functions, and white matter fiber tracts that connect these units to form purposeful and efficient functional modules or circuits. Major brain activities of the mammalian brain, including sensorimotor, memory, limbic and associative functions, are associated with different circuits, one group of which are described as the cortico-basal ganglia-thalamo-cortical feedback loops (DeLong and Wichmann 2010; Utter and Basso 2008; Squire et al. 2013; Alexander et al. 1986). The schematics of these loops have been suggested on the basis of animal studies, particularly those based on monkeys, and have been extrapolated to the human brain. The loops related to motor function include motor, premotor, and supplementary motor cortices, and parts of the putamen (Put), the globus pallidus internal (GPi) and external (GPe) segments, the subthalamic nucleus (STN), the substantial nigra pars reticulata (SNr) and compacta (SNc), and the ventral anterior and ventral lateral thalamic nuclei in the nomenclature of Jones (DeLong and Wichmann 2009; Alexander et al. 1995; Hirai and Jones 1989). These gray matter structures work as functional elements, and have served as targets for functional neurosurgery, such as deep brain stimulation (DBS) and ablation, and recently, MRI-guided focused ultrasound (Jones et al. 2019; Ghanouni et al. 2015; Schlesinger et al. 2015; Fasano et al. 2017; Tian et al. 2018; Lenz 2006). At present, the thalamic ventral lateral posterior nucleus (ventral intermediate, Vim of Hassler (Hassler 1959)) is known to be an effective target through which to reduce parkinsonian and essential tremor (Hirai and Jones 1989; Benabid et al. 1991; Schuurman et al. 2000; Yamamoto et al. 2019; Elias et al. 2016). The STN and GPi are established targets for the treatment of symptoms and drug-related complications of Parkinson’s disease and dystonia (Limousin and Foltynie 2019; Miocinovic et al. 2013; Lozano and Lipsman 2013; Kalia et al. 2013; Vercueil et al. 2001).
The H field of Forel, which contains many fiber pathways afferent to the thalamus, has been recently used as a target for surgical treatment. The production of lesions of the H field is called campotomy, and during the 1950 – 60s, was performed to treat movement disorders (tremor, rigidity, and athetotic movements) (Wycis and Spiegel 1969; Spiegel et al. 1963; Spiegel et al. 1962) and epilepsy (Jinnai 1966; Jinnai and Nishimoto 1963). Accumulating evidence has demonstrated the effectiveness of H field intervention in treating various movement disorders (Godinho et al. 2019; Neudorfer et al. 2017), leading to increased interest in the location and trajectory of fiber tracts that pass through the H field in the human brain (Lewis and Galetta 2019). Although the exact mechanism of the therapeutic effect is not entirely clear, inhibitory pallidothalamic outflow, which includes the ansa lenticularis (al) and the lenticular fasciculus (fl), is thought to be the target for the amelioration of movement disorders (DeLong 1990; Voges et al. 2002; Yelnik et al. 2003; Herzog et al. 2004; Plaha et al. 2004; Horisawa et al. 2019). The posterior subthalamic area (PSA), which is located in the middle-posterior aspect of the H field, is also considered an effective therapeutic target for the treatment of movement disorders, particularly tremor (Elble et al. 2018). The clinical improvement is attributed to the disruption of the cerebellothalamic tract (fct) that passes through the subthalamic region. However, numerous fiber tracts pass through the small volume of the H field, and therefore, fiber pathways affected by electric stimulation or ablation of the H field are uncertain, while it is clear that multiple pathways are included in lesions or electrical fields related to DBS.
Studies in monkeys have used numerous tracers to carry out connectomic analyses and have led to a model of fiber connections that pass through the H field in humans (Neudorfer and Maarouf 2018). In addition to the al, fl, and fct, the H field and the vicinity contains the amygdalofugal pathway, the fasciculus retroflexus (frf), the nigrostriatal pathway, the nigrothalamic pathway, the mammilothalamic tract (mtt), and the subthalamic fasciculus (stf). Major pathways posterior to this region transmit signals related to somatic stimuli, both innocuous [medial lemniscus, (ml) and trigeminal lemniscus (tl)] and noxious [spinothalamic tract, (stt) and the tract from the spinal trigeminal nucleus] (Neudorfer and Maarouf 2018; Apkarian and Hodge 1989; Lenz et al. 2010; Craig 2004). The locations of the al, fl, fct, mtt, ml, tl, stt, and amygdalofugal pathways have been documented in two-dimensional (2D) human histological sections (Schaltenbrand and Wahren 1977; Mai et al. 2015; DeArmond et al. 1989; Gallay et al. 2008), and the three-dimensional anatomic relationships have been described in schematic images for the most part (Fig. 1, adapted from (Neudorfer and Maarouf 2018)). Among these pathways, anatomical and diffusion MRIs have identified fiber bundles, such as the mtt (Mori and Aggarwal 2014; Kamali et al. 2018), ml, fct (Chazen et al. 2018; Yamada et al. 2010; Coenen et al. 2011), al (Lemaire et al. 2011), and amygdalofugal pathway (Kamali et al. 2016; Mori and Aggarwal 2014). However, given the resolution of most diffusion MRIs used in previous studies (1.25 – 2.5 mm), and the small diameters of these tracts estimated from histological sections of the subthalamic area (e.g., al, 2 mm; fl, < 2 mm; and mmt, 2 mm) (Gallay et al. 2008), accurate localization of thin tracts or fiber bundles has been challenging for low-resolution in vivo MRI because sub-voxel connectivity analysis is required. As recent high-angular-resolution diffusion imaging and probabilistic tract-tracing technologies allow high-resolution sub-voxel analysis, an ex vivo sub-millimeter (mesoscopic) resolution diffusion MRI atlas is anticipated as a precious resource with which to validate the results obtained from in vivo MRI experiments, particularly those that investigate the anatomical substrates of effective functional neurosurgery (Akram et al. 2017; Herrington et al. 2016; Vanegas-Arroyave et al. 2016; Pujol et al. 2016), or the pathophysiology of movement (Hess et al. 2013) or psychiatric disorders (Schafer et al. 2018; Klemm 2004).
Fig. 1:

Schematic view of the fiber tracts that pass through the H, H1 or H2 fields of Forel. a: coronal view of the anterior aspect of the H field of Forel. Blue lines indicate efferent fibers from the mammillary body. Red lines indicate the pallidothalamic connections. b: coronal view of the middle aspect of the H field of Forel. Blue lines indicate efferent fibers from the substantia nigra pars reticulata. Red lines indicate the cerebellothalamic fibers. Green lines indicate efferent fibers from the substantia nigra pars compacta. c: coronal view of the posterior aspect of the H field of Forel. Blue lines indicate the medial lemniscus. Red lines indicate the trigeminal lemniscus. al, ansa lenticularis; Amg, amygdala; AV, anteroventral thalamic nucleus; Cl, claustrum; CM, centromedian thalamic nucleus; fct, fasciculus cerebellothalamicus; fl, lenticular fasciculus; ft, thalamic fasciculus; GPe, external segment of the globus pallidus; GPi, internal segment of the globus pallidus; H, H field of Forel; H1, H1 field of Forel; H2, H2 field of Forel; Hi, hippocampus; IC, internal capsule; LG, lateral geniculate body; MD, mediodorsal thalamic nucleus; mep, mammillary efferent pathway; ml, medial lemniscus; mtt, mammillothalamic tract; mtg, mammillotegmental tract; ns, nigrostriatal tract; nt, nigrothalamic tract; P, putamen; PF, parafascicular thalamic nucleus; Pul, pulvinar nucleus; RN, red nucleus; RT, reticular thalamic nucleus; SNc, substantia nigra pars compacta; SNr, substantia nigra pars reticulata; STN, subthalamic nucleus; tl, trigeminal lemniscus; VA, ventral anterior thalamic nucleus; VL, ventral lateral thalamic nucleus; VP, ventral posterior thalamic nucleus; ZI, zona incerta. l, lateral; m, medial; d, dorsal; v, ventral. Adapted from (Neudorfer and Maarouf 2018) with permission.
The goal of this study was to create an ex vivo mesoscopic MRI atlas of the subthalamic area, and to investigate the trajectories of the thin fiber tracts that pass through the H field and the vicinity. A sub-millimeter resolution (250 μm) diffusion tensor imaging (DTI) was used to create the atlas. To serve as anatomical guidance for in vivo DTI studies, the fiber tracts generated on the ex vivo DTI were co-registered to an existing human brain DTI atlas in the Montreal Neurological Institute (MNI) space (JHU-MNI atlas). Our hypothesis is that there are discrete, minimally overlapping bundles of fibers that follow different trajectories for each of these pathways and tracts through the fields of Forel (Neudorfer and Maarouf 2018; Nieuwenhuys et al. 2008; Saint-Cyr et al. 2002).
Materials and Methods
Brain specimen
This study was performed under a protocol for the use of de-identified tissues for research purposes, approved by the Institutional Review Board of the School of Medicine, Johns Hopkins University. A de-identified postmortem specimen of the left cerebral hemisphere from a 34-year-old man without any known neurological conditions, who died of cardiac disease, was provided by the Brain Resource Center of the Department of Pathology, after standard pathologic examination. The brain was cut into coronal sections with a thickness of 10– 20 mm, using our in-house brain-cutting tool. The tool was made with an acrylic box to align the cerebral hemisphere according to the Talairach coordinates, in which the midsagittal plane is on the y-z plane, and the anterior commissure-posterior commissure (AC - PC) line is on the y-axis. This acrylic box has slits on the bilateral sides through which a knife can be slid to cut the coronal sections perpendicular to the AC - PC line. The brain tissue was fixed in 10% formaldehyde (Hydrol Chemical Company, Yeadon, PA, USA) for one week, then transferred to phosphate-buffered saline. A tissue block that contained the GPi, RN, SN, and STN, the size of which was approximately 40 × 24 mm in area, was provided for this study. The tissue was scanned 13 months after harvesting.
Image acquisition and processing
The sample was placed inside a 50ml conical tube and filled with proton-free liquid (Fomblin: Ausimont, Thorofare, NJ, USA). Air bubbles were removed by placing the sample in a vacuum chamber for more than 10 min. The diffusion-weighted image was acquired using an 11.7-Tesla NMR spectrometer (Bruker Biospin, Billerica, MA, USA). A single-channel 30 mm Bruker volume coil was used for both RF transmission and reception. A diffusion-weighted gradient and spin echo (GRASE) sequence with navigator phase correction was applied (Aggarwal et al., 2010) to scan the ex vivo specimen. The scan parameters were: echo time = 24, 34, 44, and 55 ms; repetition time = 0.7 s; two signal averages; two b0 images; and ten diffusion weighted images with a b-value of 2300 s/mm2. The temperature during the scan was 27 degrees Celsius. The field of view was 40 × 24 × 30 mm3 and the matrix size was 160 × 120 × 256, which was zero-filled to 320 × 240 × 128 after the spectral data were apodized using a 10% trapezoidal function. This resulted in an upscale of original isotropic resolution (250 × 250 × 250 μm3) to the final resolution of 125 × 125 × 125 μm3. The total scan time was 40 hours. The DtiStudio software package (Jiang et al. 2006) was used for the image registration and tensor calculation. The linear registration method minimizes a cost function based on mean square tensor fitting errors to correct eddy current distortion and motion of the tissue (Li et al. 2012). The pixels with artefactual signal was eliminated from the tensor calculation using the corrected Inter-Slice Intensity Discontinuity (Li et al. 2013) algorithm. From the tensor field, mean diffusivity (MD) and fractional anisotropy (FA) maps were calculated. The FA map was color-coded by the principal eigenvectors, shown in red (medial – lateral orientation), green (anterior – posterior orientation), and blue (superior – inferior orientation).
The b-value of 2300 s/mm2 was selected to ensure that signal attenuation in the diffusion-weighted images was approximately half that compared to b0 images. Due to the lower diffusion constant in the fixed tissue compared to in vivo tissues, mainly due to lower temperatures, the appropriate b-value ranges for fixed tissues are higher than those for in vivo studies. Our group has a large body of literature for DTI of fixed tissues (Mori et al. 2017; Aggarwal et al. 2013; Huang et al. 2009; Chang et al. 2017; Zhang et al. 2012; Chuang et al. 2011; Aggarwal et al. 2009; Zhang et al. 2006; Zhang et al. 2005) and this protocol has been successfully used in these past studies.
Identification of anatomical structures
Nine deep gray matter structures—the GPi, GPe, mammillary body, putamen, RN, SNc, SNr, STN, and ZI, as well as H, H1 and H2 fields of Forel—were manually identified by one of the authors (K.O.), using three histology atlases (Schaltenbrand and Wahren 1977; DeArmond et al. 1989; Mai et al. 2015) as references. The RoiEditor software package (www.MRIstudio.org) was used to delineate the boundary of these gray matter structures and the mean FA and MD values were calculated for each structure. Seven tracts that were identified through this study included the al, fl, fct, frf, mtt, ml-tl-stt complex, and stf. The criteria used to select these fibers were: those fibers listed in the reference atlases and those that pass through the subthalamic area. Note that the ml, tl, and stt are adjacent to each other to form a single cluster at the level of the mesencephalon. Therefore, in this article, we call this cluster the ml-tl-stt complex. Table 1 lists the origins and the terminations of these fibers, although the origins/terminations were not necessarily included in the tissue block. The ventral amygdalofugal pathway was not included in this study since the fiber pathway annotated in the histology atlases was outside the tissue block. The MD image was primarily used to identify these gray and white matter structures since it generates an image contrast very similar to that of the myelin-stained sections used in the reference atlases. As demonstrated in Fig. 2, anatomical structures (e.g., mtt, H, H1 and H2 fields of Forel, mtt, SNc, STN, thalamus, and ZI) are identifiable in the reference atlases (Fig. 2a – c) and the ex vivo MD image (Fig. 2d); the myelinated fibers appear dark and areas primarily occupied by cell bodies and intercellular matrix appear bright.
Table 1.
Anatomical features of the fiber tracts or fasciculi, and location of the seed points used for the fiber tracking. Note: the origins/terminations were not necessarily included in the tissue block.
| ansa lenticularis (al) | GPi | VApc, VLa, VLp | medial extension of the STN at the coronal planes: slices that included the MB (1st ROI) and the STN and SNc (2nd ROI) |
| cerebellothalamic tract (fct) | deep cerebellar nuclei (fastigial, dentate, and interposed) | VLp, VLa, central lateral intralaminar nucleus, CM-Pf complex | superior aspect of the RN at the coronal plane (1st ROI) and posterior extension of the mid portion of the RN at the axial plane (2nd ROI) |
| fasciculus retroflexus (frf) | medial habenular nucleus | interpeduncular nucleus | medial extension of the mid portion of the RN at the axial plane |
| mammillothalamic tract (mtt) | mammillary body | VA | superior extension of the MB at the axial plane |
| medial lemniscus - trigeminal lemniscus - spinothalamic tract (ml-tl-stt) complex | cuneate and gracile nuclei (ml) | VPL (ml) | lateral-posterior extension of the mid portion of the RN at the axial plane |
| subthalamic fasciculus (stf) | GPe | STN | lateral extension of the STN at the sagittal plane |
Fig. 2:

Comparison between myelin-stained sections and a mean diffusivity (MD) image. Coronal views at the level of the H field of Forel are demonstrated. The MD contrast was similar to that of the myelin-stained sections since the tightly packed myelinated fibers are visualized as a dark intensity on both images. a: a myelin stain section from (Schaltenbrand and Wahren 1977), b: a myelin stain section from (Mai et al. 2015), c: a Weil stain section from (DeArmond et al. 1989), d: mean diffusivity image of our mesoscopic DTI. Note that the A, B and D are coronal sections of specimens aligned to the anterior commissure - posterior commissure line, while C is not. Therefore, structures included in section C look different from those in A, B, and D. #, H field of Forel; <, H1 field of Forel; >, H2 field of Forel; ^, mammillothalamic tract; +, subthalamic nucleus; *, zona incerta; N, substantia nigra; T, thalamus. L, lateral; M, medial; P, posterior; S, superior. Adapted from (Schaltenbrand and Wahren 1977), (Mai et al. 2015), and (DeArmond et al. 1989).
Tract reconstruction
The fiber assignment by continuous tracking (FACT) algorithm (Mori et al. 1999), which is implemented in the DTIStudio, was used for the tractography. The major portions of the fibers annotated on the 2D histology planes of the atlases were used as the seed points (an OR operation for the first seed point, with an AND operation in some fibers with the second seed point) to determine the tracts (Table 1, seed points and Fig.3)(Oishi et al. 2010). An FA threshold of 0.22, an angle threshold of 80 degrees, and a minimum length of 7 pixels were applied to determine the fiber tracts. The FA threshold was determined based on our prior experience in ex vivo mesoscopic imaging (Mori et al. 2017) that accounted for a balance between the sensitivity to include as many target fibers as possible and the specificity to avoid the inclusion of false-positive fibers. Results of the tractography were validated by the continuity of the tracts between landmarks determined by the histology atlases. The deep gray matter parcellations and the H field were used as landmarks for the validation, although were not used as the seed points. Anatomically implausible fibers were removed using a NOT operation at this step. Note that the direction of axonal projections (the cell body to the axonal terminal) of the tracts cannot be judged from the tractogram (Mori and van Zijl 2002). To investigate the minimum spatial resolution that is required to track the fiber tracts, the tract reconstruction was performed on downsampled tensor fields with lower spatial resolutions (0.5 mm, 0.75 mm, 1.0 mm, and 1.5 mm). The downsampling was performed on the DiffeoMap software package (www.MRIstudio.org). Note that the lower the resolution, the higher the chance of including multiple fiber populations with different directionalities in each voxel. As a result, the fiber tracts on the downsampled images tended to have lower FA values compared to that on the original images. Therefore, we first applied an FA threshold of 0.22 to the 0.25 mm isotropic image, and if one or more tracts became difficult to delineate during the downsampling, the threshold was reduced to 0.11 in order to increase the sensitivity to detect the fiber tracts. The tracts were evaluated as “delineable” if the entire courses were reconstructable, “partially delineable” if a portion of the tracts, but not the entire courses, were reconstructable, “few fibers delineable” if only 1 – 3 fibers were reconstructable, and “no fibers delineable” if the reconstruction failed.
Fig. 3:

The regions of interests (ROIs) used for the tract-tracking and the seven tractograms identified in this study. Contours of the ROIs are visualized by yellow solid lines placed on the mean diffusivity image (left column) and the color-coded FA image (middle column). The tractograms and landmark structures are three-dimensionally visualized in the right column, in which the red squares indicate the planes on which the ROIs were placed. a: ansa lenticularis (yellow); b: lenticular fasciculus (orange); c: cerebellothalamic tract (light green); d: fasciculus retroflexus (cyan); e: mammillothalamic tract (red); f: medial lemniscus + trigeminal lemniscus + spinothalamic tract (gray); g: subthalamic fasciculus (pink). Abbreviations: GPi, internal segment of the globus pallidus (transparent blue); GPe, external segment of the globus pallidus (transparent purple); MB, mammillary body (transparent olive); RN, red nucleus (transparent red); SN, substantia nigra (transparent cyan); STN, subthalamic nucleus (transparent yellow). A, anterior; L, lateral; S, superior.
Co-registration of the tractograms to the in vivo DTI atlas in MNI stereotaxic coordinates
To make the detailed subthalamic fiber pathways available (Calabrese et al. 2015) for clinicians and researchers who use the standard MNI space, the tractograms obtained from the ex vivo mesoscopic DTI were co-registered to an in vivo whole-brain MRI/DTI atlas in MNI space (JHU-MNI atlas) (Oishi et al. 2009) using the method described previously (Aggarwal et al. 2013). The JHU-MNI atlas was cropped to select the area covered by the tissue block and was then registered to the ex vivo DTI using large deformation diffeomorphic metric mapping (Miller et al. 2002). An inverse transformation obtained through this process was applied to transform the tractograms to the JHU-MNI atlas space.
Results
Gray matter structures and the fields of Forel
The nine gray matter structures: GPi, GPe, mammillary body, putamen, RN, SNc, SNr, STN, and ZI, were identified based on the combination of b0, MD, and color-coded FA contrasts (Fig. 4). A summary of the anatomical features of the gray matter structures is listed in Table 2. The STN, SNc, and SNr were identified as dark structures on the b0 image and as granular structures on the MD image (Fig. 4b, slices 13, 12, 10, and 9 mm), although b0 image intensity of the SNc was higher than that of the SNr, as reported previously (Lehericy et al. 2014). On the coronal section of the MD image, the STN appeared as an almond-shaped structure surrounded by a dark fibrous area; the H2 field of Forel was located in the superior aspect and the stf was located in the inferior aspect of the area. The SNr contained very high FA (> 0.8) and very low FA (<0.15) granules. The STN and the SNc also contained high FA (> 0.5) and low FA (< 0.3) granules, but the contrast was less than that seen in the SNr. On the three-dimensional reconstruction image (3D image), the STN and the substantia nigra (SNr + SNc) both appeared as an object similar to an oblate ellipsoid (Figs 3 and 5, STN and SN). The ZI was identified as a sheet-like structure on the 3D image (Fig. 5, ZI), and the b0 intensity was slightly lower than that of surrounding areas on the b0 image (Fig. 4a, slice −1.8 mm). On the MD image, the superior surface was separated from other parts of the thalamus, with a higher MD compared to the ZI, or from the H1 field of Forel, with a lower MD compared to the ZI. The inferior surface was separated from the H2 field of Forel, with a lower MD compared to the ZI. The H field appeared as a medial continuation of the fl (H2 field) and was dominated by green granules with some red or blue granules scattered on the color-coded FA image (Fig. 4, surrounded by a yellow dotted line on each MD image). The mtt was located in the medial aspect, the H2 field was located in the lateral aspect, the al was located in the rostral aspect, and the ml-tl-stt complex was located in the caudal aspect. As a result of fibers incoming and outgoing from thalamic nuclei converging in this narrow area, we were unable to identify each fiber separately in the superior and central aspect of the H field. The GPi and GPe complex were observed as a dark structure medial to the putamen on the b0 image (Fig. 4a, slices −0.5, −1.8, −3.0, and −4.3 mm; and Fig. 4b slices 14, 13, and 12 mm). Note that the anterior aspect of the GPi and GPe was not included in the tissue block; therefore, the 3D shape of the GPi + GPe appeared as a wedge-shaped rather than a cone-shaped object in 3D image (Figs 3 and 5a, b and d). The medial medullary lamina of the globus pallidus appeared as a dark boundary that separated the GPi and GPe in the MD image. The GPi and GPe were characterized by a granular appearance in which each granule had a specific color (red, green, or blue) in the color-coded FA image (Fig. 4a, slices −0.5, −1.8, −3.0, and −4.3 mm). The putamen, located lateral to the GPe, was a structure brighter than the surrounding tissue on the b0 and MD images. The FA was lower than that of the GPi and GPe, and was characterized by a textile-like appearance on the color-coded FA image (best observed in Fig. 4b, slices 13, 12, and 10 mm). The medial aspect of the mammillary body was seen as an isointense oval in the coronal slices of b0 and MD images and the FA was lower than that of the other deep gray structures (Fig. 4b, slices 14 and 13 mm). The lateral aspect of the mammillary body was seen as a bright green structure on the color-coded FA image. The 3D shape was similar to an egg shape (Figs. 3 and 5a and c). The RN was seen as a low-intensity oval on the b0 and MD images, and was characterized by a granular appearance on MD and FA images. On the color-coded FA image, the inferior half and the most superior part of the RN were dominated by green granules. The middle part consisted of an anterolateral portion that was dominated by red granules, and a posteromedial portion that was dominated by blue granules (Fig. 4a, slice −5.5 mm). On the 3D image, the RN appeared as an object similar to a prolate ellipsoid (Figs 3 and 5b and c).
Fig. 4:


a: axial and b: coronal slices of the mesoscopic DTI. The color-coded fractional anisotropy (left column), mean diffusivity (MD, middle column), and b0 (right column) images are shown at five axial and five coronal slice levels. The number (mm) of each row represents the distance from the posterior commissure. For the axial slices, the distance was measured from the most superior aspect of the posterior commissure. For the coronal slices, the distance was measured from the most anterior aspect of the posterior commissure. The H field of Forel is surrounded by a yellow dotted line on each MD image. Abbreviations: al, ansa lenticularis; fl, lenticular fasciculus; fct, cerebellothalamic tract; frf, fasciculus retroflexus; mtt, mammillothalamic tract; ml, medial lemniscus + trigeminal lemniscus + spinothalamic tract; pyt, pyramidal tract; stf, subthalamic fasciculus; CM, centromedian nucleus; GPi, internal segment of the globus pallidus; GPe, external segment of the globus pallidus; LG, lateral geniculate body; MB, mammillary body; MG, medial geniculate body; Pf, parafascicular nucleus; Pla, pulvinar anterior nucleus; Put, putamen; RN, red nucleus; SNc, substantia nigra pars compacta; SNr, substantia nigra pars reticulata; STN, subthalamic nucleus; VA, ventral anterior nucleus; VLa, ventral lateral anterior nucleus; VLp, ventral lateral posterior nucleus; VM, ventral medial nucleus; VMb basal ventral medial nucleus; VPI, ventral posterior inferior nucleus; VPL, ventral posterolateral nucleus; VPM, ventral posteromedial nucleus; ZI, zona incerta. A, anterior; I, inferior; L, lateral; M, medial; P, posterior; S, superior.
Table 2.
image features of the fiber tracts or fasciculi and the gray matter structures.
| tracts and structures | Qualitative image features | Image quantification (mean, standard deviation) | |||||
|---|---|---|---|---|---|---|---|
| b0 intensity | mean diffusivity (MD) | color-coded FA | MD (mm2/s x 10−4) | FA | |||
| ansa lenticularis (al) | low (where it forms tight bundle) | low (where it forms tight bundle) | green (medial aspect) | 1.29 | 0.37 | 0.60 | 0.19 |
| lenticular fasciculus (fl) | difficult to distinguish from surrounding structures | difficult to distinguish from surrounding structures | orange (comb system), red (H2 field), green (H field) | 1.49 | 0.25 | 0.47 | 0.12 |
| cerebellothalamic tract (fct) | difficult to distinguish from surrounding structures | difficult to distinguish from surrounding structures | cyan (ascending portion), green (where it passes through the RN) | 1.95 | 0.49 | 0.38 | 0.14 |
| fasciculus retroflexus (frf) | difficult to distinguish from surrounding structures | difficult to distinguish from surrounding structures | blue (descending from the habenular nucleus), cyan (where it runs adjacent to the RN) | 2.19 | 0.71 | 0.44 | 0.14 |
| mammillothalamic tract (mtt) | lower than surrounding structures | lower than surrounding structures | blue (closer to the MB), cyan (closer to the thalamus) | 1.84 | 0.36 | 0.38 | 0.09 |
| medial lemniscus - trigeminal lemniscus - spinothalamic tract (ml-tl-stt complex) | difficult to distinguish from surrounding structures | difficult to distinguish from surrounding structures | dark blue | 2.26 | 0.38 | 0.39 | 0.16 |
| subthalamic fasciculus (stf) | difficult to distinguish from surrounding structures | difficult to distinguish from surrounding structures | orange (comb system), red (close to the STN) | 1.35 | 0.24 | 0.52 | 0.13 |
| subthalamic nucleus (STN) | low | granular | high FA and low FA granules | 1.53 | 0.29 | 0.35 | 0.11 |
| zona incerta (ZI) | slightly lower than surrounding structures | slightly higher than surrounding white matter fibers | green (anteromedial aspect), red (posterolateral aspect) | 1.73 | 0.23 | 0.38 | 0.07 |
| substantia nigra pars compacta (SNc) | low | granular | high FA and low FA granules | 2.20 | 0.46 | 0.34 | 0.11 |
| substantia nigra pars reticulata (SNr) | very low | granular | very high FA and very low FA granules | 1.86 | 0.64 | 0.44 | 0.18 |
| putamen (Put) | higher than surrounding structures | high | granular (anterior-superior aspect); textile-like (posterior-inferior aspect); lower FA compared to the GPi and the GPe | 3.03 | 0.35 | 0.20 | 0.06 |
| external segment of the globus pallidus (GPe) | low | granular | high FA and low FA granules | 1.67 | 0.59 | 0.42 | 0.17 |
| internal segment of the globus pallidus (GPi) | low | granular | high FA and low FA granules | 1.53 | 0.43 | 0.39 | 0.16 |
| mammillary body (MB) | higher than surrounding structures | homogeneous | low FA, blue (medial aspect); high FA, green (lateral aspect) | 2.71 | 0.64 | 0.20 | 0.09 |
| red nucleus (RN) | low | granular | dominated by green granules (inferior and the most superior aspects), dominated by red granules (anterolateral aspect), dominated by blue granules (posteromedial aspect) | 1.57 | 0.30 | 0.33 | 0.12 |
Fig. 5:

3D reconstruction of the basal ganglia, the zona incerta, and associated white matter tracts that pass through the H field of Forel. The locations of these nuclei and fiber tracts are visualized in a: anterior view with a coronal slice of the mean diffusivity (MD) image; b: posterior-lateral view with an axial slice of the MD image; c: medial view with a sagittal slice of the MD image; and d: superior-anterior view with an axial slice of the MD image. The axial and coronal sections are demonstrated in Fig. 4, using the same color scheme as the reconstructed fiber bundles. Abbreviations: al, ansa lenticularis (yellow); fl, lenticular fasciculus (orange); fct, cerebellothalamic tract (light green); frf, fasciculus retroflexus (cyan); mtt, mammillothalamic tract (red); ml, medial lemniscus + trigeminal lemniscus + spinothalamic tract (gray); stf, subthalamic fasciculus (pink); GPi, internal segment of the globus pallidus (transparent blue); GPe, external segment of the globus pallidus (transparent purple); MB, mammillary body (transparent olive); RN, red nucleus (transparent red); SN, substantia nigra (transparent cyan); STN, subthalamic nucleus (transparent yellow); ZI, zona incerta (transparent green). A, anterior; L, lateral; S, superior.
The ansa lenticularis (al)
The tissue block contained a portion of the al after it passed under the posterior limb of the internal capsule and projected to the H field. On the color-coded FA image, this portion of the al could be identified as a green bundle, as demonstrated in 2D slices (Fig. 4). The tractogram is demonstrated on the ex vivo images (Figs 3 and 5) and on the in vivo T2-weighted MRI atlas (Fig. 6). The al was delineable at the downsampled tensor field with a voxel size of 0.75 mm cubic and an FA threshold of 0.22, and was delineable at 1 mm cubic image with an FA threshold of 0.11 (Table 3).
Fig. 6:
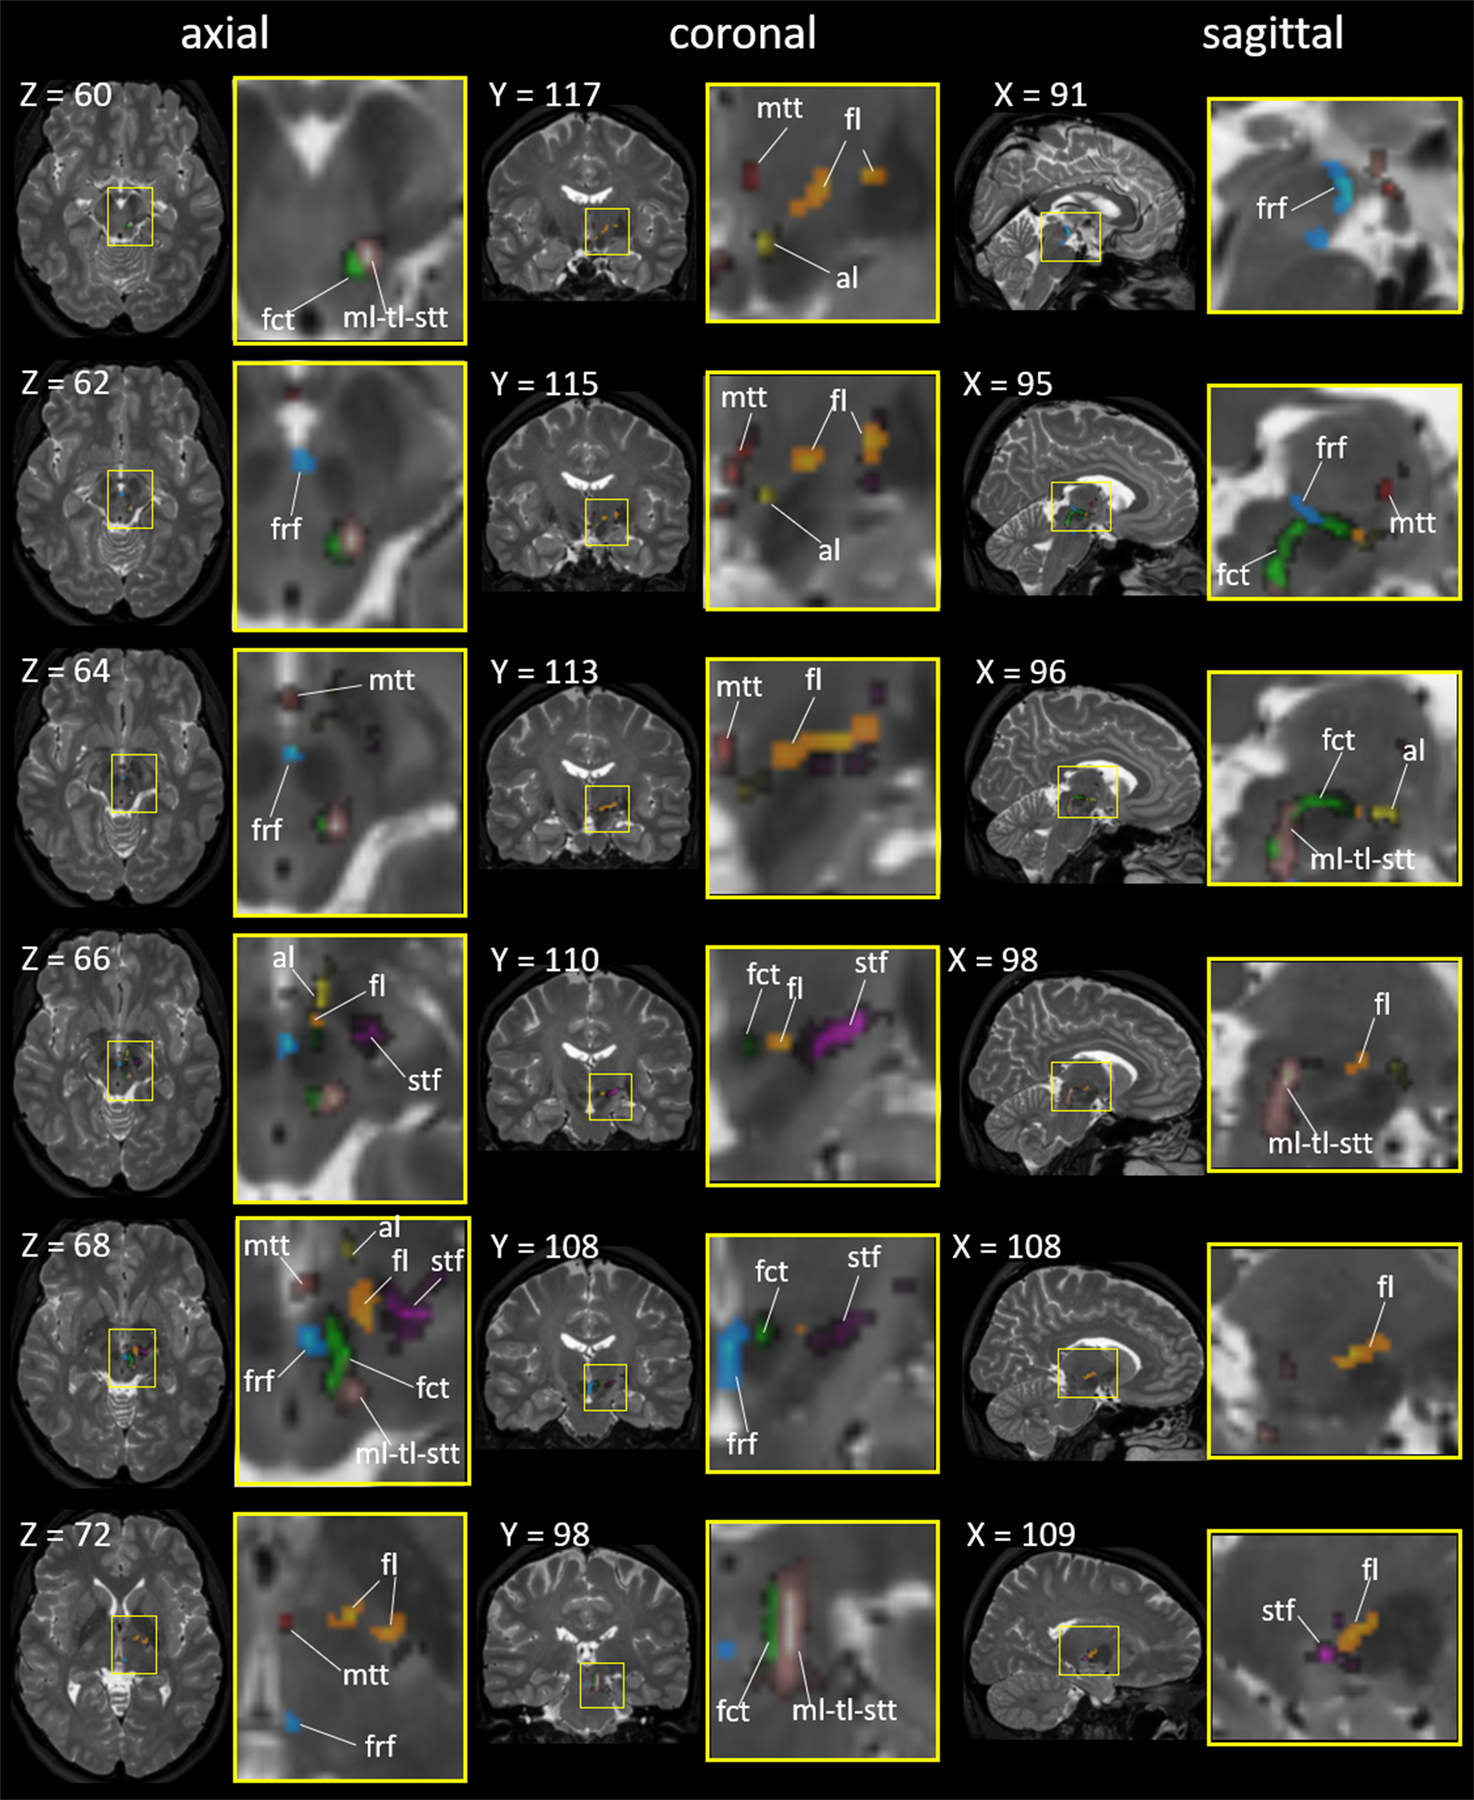
The seven fiber tracts superimposed on the in vivo T2-weighted brain MRI atlas in the Montreal Neurological Institute (MNI) coordinates. The areas surrounded by yellow rectangles (left) are magnified (right). The X, Y, and Z numbers indicate the slice numbers of the JHU-MNI atlas (Oishi et al. 2009). Abbreviations: al, ansa lenticularis (yellow); fl, lenticular fasciculus (orange); fct, cerebellothalamic tract (light green); frf, fasciculus retroflexus (cyan); mtt, mammillothalamic tract (red); ml-tl-stt, medial lemniscus + trigeminal lemniscus + spinothalamic tract (warm gray); and stf, subthalamic fasciculus (pink).
Table 3.
Resolution and FA threshold required to delineate the seven fiber pathways. +, delineable; * partially delineable; ^, few fibers delineable; -, no fibers delineable.
| voxel size (mm) | 0.25 × 0.25 × 0.25 | 0.5 × 0.5 × 0.5 | 0.75 × 0.75 × 0.75 | 1 × 1 × 1 | 1.5 × 1.5 × 1.5 | ||
|---|---|---|---|---|---|---|---|
| FA threshold | 0.22 | 0.22 | 0.22 | 0.11 | 0.22 | 0.11 | 0.11 |
| al | + | + | + | + | * | + | - |
| fl | + | + | + | + | + | + | ^ |
| fct | + | + | + | + | * | + | + |
| frf | + | + | * | * | - | - | - |
| mtt | + | + | + | + | - | + | - |
| ml - tl - stt | + | + | + | + | + | + | ^ |
| stf | + | + | + | + | * | * | - |
The lenticular fasciculus (fl)
The tissue block contained the entire fl from the GPi to the H field. On the color-coded FA image, the portion from the GPi to Forel’s H2 field was visualized as a red color, and then, a green color where the fasciculus turned anteriorly toward the H field, as demonstrated in Fig. 4. The tractography is demonstrated on the ex vivo images (Figs 3 and 5) and on the in vivo T2-weighted MRI atlas (Fig. 6). The fl was delineable at the downsampled tensor field with a voxel size of 1 mm cubic and an FA threshold of 0.22 or 0.11 (Table 3).
The cerebellothalamic fasciculus (fct)
The fct forms a thick vertical bundle that is adjacent to the posterolateral aspect of the RN from the inferior to superior direction. Then, it makes a horizontal turn anteriorly, and penetrates the superior aspect of the RN toward the H field. The vertical aspect was visualized as a blue bundle and the horizontal aspect was visualized as a green bundle on the color-coded FA image (Fig. 4). The tractography is demonstrated on the ex vivo images (Figs 3 and 5) and on the in vivo T2-weighted MRI atlas (Fig. 6). The fct was delineable at the downsampled tensor field with a voxel size of 0.75 mm cubic and an FA threshold of 0.22, and was delineable on the 1.5 mm cubic image with an FA threshold of 0.11 (Table 3).
The fasciculus retroflex (frf)
On the color-coded FA image, the frf was clearly seen as a pale blue string attached to the medial portion of the RN, but was difficult to identify on the b0 and MD images (Fig. 4a, slices −4.3 and −5.5 mm). The tractography could visualize the frf as a curved fasciculus that coursed along the medial portion of the RN on the ex vivo images (Figs 3 and 5b and d) and on the in vivo T2-weighted MRI atlas (Fig. 6). The frf was delineable at the downsampled tensor field with a voxel size of 0.5 mm cubic and an FA threshold of 0.22 (Table 3).
The mammillothalamic tract (mtt)
The tract is clearly visible as a low intensity string on the b0 and MD images (Fig. 2) that arises from the MB and projects to the anterior nucleus of the thalamus. The tract was visualized as a blue area on the color-coded FA image since the fiber bundle was mostly parallel to the superior-posterior direction. The tractography is demonstrated on the ex vivo images (Figs 3 and 5a, b and d) and on the in vivo T2-weighted MRI atlas (Fig. 6). The mtt was delineable at the downsampled tensor field with a voxel size of 0.75 mm cubic and an FA threshold of 0.22, and was delineable on the 1 mm cubic image with an FA threshold of 0.11 (Table 3).
The medial lemniscus – tegmental lemniscus – spinothalamic tract (ml-tl-stt) complex
The ml is located at the anterior aspect of the ml-tl-stt complex, but exact boundaries among the ml, tl, and stt were not visible at the level of the mesencephalon. The tract was visualized as a blue area on the color-coded FA image since the fiber bundle was mostly parallel to the inferior-superior direction (Fig. 4). The tractography is demonstrated on the ex vivo images (Figs 3 and 5b, c and d) and on the in vivo T2-weighted MRI atlas (Fig. 6). The ml-tl-stt complex was delineable at the downsampled tensor field with a voxel size of 1 mm cubic and an FA threshold of 0.22 or 0.11 (Table 3).
The subthalamic fasciculus (stf)
On the color-coded FA image, the stf was visualized as red fibers surrounding the STN, representing fibers that ran parallel to the medial-lateral direction, and green (anterior portion) or red (posterior portion) fibers that penetrated into the posterior limb of the internal capsule (Fig. 4). The tractography is demonstrated on the ex vivo images (Figs 3 and 5) and on the in vivo T2-weighted MRI atlas (Fig. 6). The stf was delineable at the downsampled tensor field with a voxel size of 0.75 mm cubic and an FA threshold of 0.22 or 0.11 (Table 3).
Discussion
Human ex vivo DTI for brain mapping
Postmortem DTI at the mesoscopic scale was applied to elucidate the trajectories of the white matter tracts that run within and in the vicinity of the H field of Forel, as well as to investigate mesoscopic anatomical features of the gray matter structures. The ex vivo DTI approach allowed visualization of the fine detail of the fiber connections and enabled us to bridge the knowledge gap between histological observations and in vivo MRI (Chazen et al. 2018; Yamada et al. 2010; Coenen et al. 2011; Lemaire et al. 2011; Hori et al. 2019). One of the limiting factors of in vivo diffusion MRI is the spatial resolution, which is limited to 1.25–2.5 mm at practical scanning times. Each voxel of in vivo DTI contains many white matter tracts with different orientations and connections. Among the tracts depicted here, the al, fl, frf, and stf are of thin diameter, and thus, are difficult to trace with in vivo deterministic tractography. Indeed, our results from downsampled ex vivo DTI suggested that at least a voxel resolution of 1 × 1 × 1 mm is required for a reliable delineation of the al, fl, and mtt, and even higher resolution is needed for the delineation of the frf and stf. Even for the thick fiber bundles, such as the pyramidal tract, the crossing fibers are rarely visualized. Fig. 4 demonstrates that mesoscopic DTI can visualize the fine fl and stf tracts the individual tines of which form the comb system (Nauta and Mehler 1966)) of the pyramidal tract as they penetrate it. As an attempt to incorporate the ex vivo findings into in vivo MRI, we co-registered the seven fiber pathways onto the JHU-MNI multi-contrast MRI atlas for the anatomical reference. The subthalamic fiber pathway atlas on the MNI coordinates is available through the website (http://lbam.med.jhmi.edu/).
Microscopic tissue sections can delineate anatomical structures at the microscopic level, although the orientation of fibrous structures is difficult to visualize. To overcome this limitation, several technologies, such as optical coherence tomography (Wang et al. 2014), polarized light imaging (Reckfort et al. 2015), and light sheet microscopy (Huisken et al. 2004), have been developed to visualize the cytoarchitecture and fiber organization at a micron-scale resolution. Ex vivo DTI, therefore, provides an interesting opportunity that complements histological observations, and can provide the delineation of white matter architecture at the mesoscale level.
Pallidothalamic projection
Pallidothalamic fibers originate from the medial portion of the GPi and traverse the H field toward the parvocellular part of the VA (VApc), VLa, and VLp (Nauta and Mehler 1966; Magnin et al. 2006) (Table 1). Autoradiographic studies in rhesus monkeys show that the ventral GPi gives rise to fibers that terminate in the medal and posterior aspects of the VLa and the lateral aspect of the VLp, while the dorsal aspect of the GPi projects upon the lateral and rostral VLa and VLp (Thach and Jones 1979; Asanuma et al. 1983; DeVito and Anderson 1982). The connections efferent to the GPi define two fiber pathways (al and fl) and three regions (H, H1, and H2 fields), as shown in Figs. 1 and 2. Congruent with a schematic figure in (Neudorfer and Maarouf 2018)(Fig. 1), our mesoscopic DTI demonstrated that the fl emerges from the posterior aspect of the GPi, crosses the posterior limb of the internal capsule, and proceeds between the STN and the ZI (H2 field). It then traverses the H field, which is anterior to the RN, medial to the ZI, and dorsal and posterior to the STN. In turn, the al emerges from the anterior – superior – medial aspect of the GPi and courses in front of and inferior to the medial aspect of the posterior limb of the internal capsule to gain the H field (Neudorfer and Maarouf 2018). Since the block used in our study did not contain the area anterior to the GPi, where the al emerges, the tractography could delineate only the al after it passes below the internal capsule and arrives at the H field.
Cerebellothalamic connections
The fct is presumed to be responsible for motor coordination. In addition, Increasing evidence suggests a vital role in cognitive functions, including working memory, planning, verbal fluency, behavior, and abstract thinking (Middleton and Strick 1997; Middleton and Strick 1998). The fct originates from the contralateral fastigial, dentate, and interposed deep cerebellar nuclei and traverses through the superior cerebellar peduncle. The majority of the fct fibers decussate at the level of the mesencephalon and ascend through the RN prior to reaching the H field. Traversing Forel’s fields H and H1 in a posteromedial to an anterolateral direction, the fct enters the thalamus lateral and posterior to the thalamic fasciculus (ft), which consists of the al and fl. The fct and ft remain clearly separated in the subthalamic region and do not converge; however, an exchange of fibers between the two tracts cannot be entirely excluded (Gallay et al. 2008). At the level of the thalamus, cerebellothalamic fibers primarily project to the VLp, with collaterals reaching the VLa, the central lateral intralaminar nucleus, and the centromedian-parafascicular nuclear complex (Asanuma et al. 1983; Percheron et al. 1993) (Table 1), with distinct neurochemistry (Calzavara et al. 2005). Our mesoscopic DTI enables visualization the fct at the level of midbrain where it ascends posterolaterally adjacent to the RN, and where it penetrates the superior aspect of the RN toward the H field. This trajectory, particularly the portion that penetrates the RN, has been difficult to visualize in previous studies using human in vivo DTI (Nowacki et al. 2018). However, our method could not visualize the intra-thalamic aspect of the fct, probably due to other fibers co-located in the thalamus.
Connections related to somatic sensation
Pathways subserving somatic sensation, both innocuous and pain-related, such as the ml, stt, and tl, traverse Forel’s fields. These three tracts run parallel to the inferior-superior direction, forming a single cluster in the midbrain; therefore, we created a single tract, the ml-tl-stt complex, using tractography. Microscopically, the fibers of the ml can be distinguished from those of the stt since their unstained fibers intermixed with fibers of the stt which stain for the calcium binding protein calbindin (Rausell and Jones 1991). A previous study based on in vivo DTI tractography could segregate the ml and stt by placing the seed points at the level of the pons (Kamali et al. 2009), where these two tracts can be clearly differentiated. Since our block did not contain the pons, the boundaries among these tracts were difficult to determine. The ml-tl-stt complex forms the posterior border of the H field. This posterior aspect of the subthalamic area also contains terminations of efferent fibers from the mesencephalic reticular formation (Asanuma et al. 1983). Animal studies of anterograde transport following injections demonstrated connections between the cuneate and the ZI through the ml (Hand and Van Winkle 1977), and between the trigeminal nuclei and the ventral posteromedial nucleus (VPM) through the tl, which loops diffusely into the medial H1 field (Jones et al. 1986). The tl and the stt pathways in primates project diffusely to the medial portion of H1 (Neudorfer and Maarouf 2018; Morel 2007) and enter into the ventral posterior nucleus of the thalamus (Neudorfer and Maarouf 2018; Mehler 1962) (Table 1). Our method could not track the distal portion of the ml, stt, and tl, probably because these fibers enter into the thalamic nuclei without forming a tight bundle, and the inferior-lateral aspect of the thalamus consists of massive thalamocortical efferent fibers that intersect the thalamic afferent fibers, including the ml-tl-stt complex.
Other fiber bundles within or adjacent to the H field
Interest in the fields of Forel has focused on the motor and somatosensory pathways to the thalamus, as described above. However, other important pathways may traverse through or adjacent to the H field. The mtt originates from the posteromedial mammillary body and defines the medial border of the H field as it projects toward the anteroventral thalamic nucleus and constitutes the medial border of the H and H1 fields (Veazey et al. 1982; Ricardo 1983; Irle et al. 1984) (Table 1). Our tractography could clearly demonstrate the entire course of the mtt from the mammillary body to the thalamus within the block, congruent with previous publications (Mori and Aggarwal 2014; Kamali et al. 2018).
The frf is located adjacent to the medial portion of the RN and consists of efferent fibers from the medial and lateral habenular nuclei (Herkenham and Nauta 1979). The fibers that originate from the medial habenular nucleus primarily project to the interpeduncular nucleus, while those that originate from the lateral habenular nucleus disperse mainly in three directions: rostral; lateral; and dorsocaudal; and project to various nuclei in the mesencephalon and diencephalon (Table 1). Although an increasing body of evidence has implicated the habenula and the projection through the frf in various psychiatric disorders (Fakhoury 2017), little attempt has been made to delineate the trajectory of the human frf using DTI. We demonstrated that the frf is clearly visible on the color-coded FA map of the mesoscopic DTI and the trajectory can be reconstructed using tractography.
The stf contains fibers from the GPe toward the STN (Kim et al. 1976) and fibers from the STN toward the GPi and GPe (Groenewegen and Berendse 1990). Our tractography demonstrated a trajectory very similar to that obtained from a radioactive label injection study performed on rhesus monkey brains (Kim et al. 1976), particularly where the stf penetrates the internal capsule through the comb system (Neudorfer and Maarouf 2018).
Limitations
Ultra-high field ex vivo DTI as experimental data
There are several issues related to the ex vivo mesoscopic DTI. Low temperature and tissue fixation are known to reduce the diffusion coefficient (Schmierer et al. 2008), which mandated the use of a high b-value to sensitively detect diffusion, although increasing b-values and resolutions are concomitant with a decrease in the signal-to-noise ratio (SNR). The ultra-high field (11.7 T) was required to obtain DTI with an SNR high enough to delineate detailed anatomical structures on a mesoscopic scale. Care should be taken to compare the FA and MD values reported in this manuscript to those obtained from other ex vivo or in vivo DTI studies because DTI-derived scalar values are affected by scan parameters and magnetic fields (Chung et al. 2013), as well as by tissue deformation that occurs during excision and fixation (Guilfoyle et al. 2003; Sun et al. 2005).
Limitations of the deterministic tractography
One of the known limitations of the deterministic FACT algorithm is the inability to estimate crossing fibers. The fiber-tracking is sensitive to spatial resolution because a larger voxel size (= lower resolution) is related to an increased chance of including multiple fiber populations with different directionalities in a given voxel, which results in the termination of the tractogram (Mori and Zhang 2006). To overcome this limitation, we adopted a super-high-resolution approach by which to reduce the amount of fiber populations within a voxel. Alternative approaches include the use of non-tensor models, such as high-angular-resolution diffusion imaging and probabilistic tractography algorithms (Behrens et al. 2003; Tuch et al. 2003; Tournier et al. 2007; Jeurissen et al. 2011). These approaches can increase the amount of within-voxel information about fiber orientations to ameliorate the fiber-crossing issue, although higher b-values that reduce the SNR and longer scan times to encode more diffusion directions, compared to those of DTI, are required. Diffusion MRI parameters and tractography methods optimized for ex vivo mesoscopic images are yet to be investigated.
Fibers unable to be visualized
Although the nigrothalamic and nigrostriatal pathways are located in the H field in the primate brain (Francois et al. 2002; Neudorfer and Maarouf 2018), the locations were not clearly demonstrated on the reference atlases (Schaltenbrand and Wahren 1977; DeArmond et al. 1989; Mai et al. 2015); therefore, we could not place seed points to determine these pathways. In primates, the nigrothalamic fibers arise from the whole mediolateral extent of the SNr, which projects through the H field and then gives rise to two branches as it proceeds dorsally (Francois et al. 2002; Neudorfer and Maarouf 2018). The medial component of the SNr gives rise to an anterior branch and projects medially to the VAmc and medial dorsal nuclei of the thalamus. The lateral component of the SNr gives rise to a posterior branch, which proceeds laterally to the posterior part of the VAmc, and to the densocellular, paralaminar, and parvocellular subdivisions of the medial dorsal nucleus. The nigrostriatal pathway originates from the dopaminergic SNc (Francois et al. 1984; Neudorfer and Maarouf 2018). Fibers initially proceed along the dorsal-medial aspect of the SNc as a tract that reaches the medial posterior aspect of the H field. Subsequently, projections to the caudal striatum separate from the principal bundle dorsolaterally, ascend over the STN, and traverse the internal capsule toward the putamen, following a course similar to that of the fl (Haber and Calzavara 2009). According to this a priori knowledge, an attempt was made to expand the surface of the SN (Fig. 5) to create a region of seed points to delineate the nigrothalamic and nigrostriatal pathways. We also placed seed points on the thalamus to inversely delineate the nigrothalamic pathway. However, both attempts failed in delineating these pathways, probably because these fibers traverse over many fibers within the H field and do not form a tightly packed bundle structure (see the Limitations section about deterministic tractography).
Conclusion
Mesoscopic anatomical features of gray and white matter structures in the subthalamic area were described in detail. As we hypothesized, the tractography could delineate discrete and minimally overlapping bundles of fibers, including the al; fct; frf; fl; mtt; ml-tl-stt complex; and the stf. These tracts or fasciculi follow different trajectories through the subthalamic area. The limitation includes difficulty in tracking fibers within or adjacent to the thalamus due to the existence of thalamocortical efferent fibers that intersect the thalamic afferent fibers. To acquire the mesoscopic image within the scan time (40 hours), the size of the tissue specimen was inevitably limited; therefore, the entire length of the tracts or fasciculus was unable to be visualized. Nevertheless, the ex vivo mesoscopic DTI approach allowed visualization of the fine detail of the fiber connections and enabled us to bridge the knowledge gap between histological observations and in vivo MRI.
Acknowledgment:
Some of the results presented here were the result of studies funded by grants from the National Institutes of Health - National Institute of Neurological Disorders and Stroke R56 NS038493, RO1 NS096007-01, and R01NS109298-01 to FAL, R01NS086888 to SM, and National Institute on Aging P50AG05146 to JCT. The contents of this paper are solely the responsibility of the authors and do not necessarily represent the official view of the NIH. We thank Mr. Zhipeng Hou, who prepared and scanned the tissue block, and Ms. Mary McAllister and Dr. Yvonne Lenz for their help with manuscript editing.
Funding:
Some of the results presented here were the result of studies funded by grants from the National Institutes of Health - National Institute of Neurological Disorders and Stroke R56 NS038493, RO1 NS096007-01, and R01NS109298-01 to FAL, R01NS086888 to SM, and National Institute on Aging P50AG05146 to JCT. The contents of this paper are solely the responsibility of the authors and do not necessarily represent the official view of the NIH.
Abbreviations
- al
ansa lenticularis
- CM
centromedian nucleus
- FA
fractional anisotropy
- fct
cerebellothalamic tract
- fl
lenticular fasciculus
- frf
fasciculus retroflexus
- GPe
external segment of the globus pallidus
- GPi
internal segment of the globus pallidus
- LG
lateral geniculate body
- MB
mammillary body
- MD
mean diffusivity
- MG
medial geniculate body
- ml
medial lemniscus
- mtt
mammillothalamic tract
- Pf
parafascicular nucleus
- Pla
pulvinar anterior nucleus
- PSA
posterior subthalamic area
- Put
putamen
- pyt
pyramidal tract
- RN
red nucleus
- SN
substantia nigra
- SNc
substantia nigra pars compacta
- SNr
substantia nigra pars reticulata
- stf
subthalamic fasciculus
- STN
subthalamic nucleus
- stt
spinothalamic tract
- tl
trigeminal lemniscus
- VA
ventral anterior nucleus
- VAmc
magnocellular part of the ventral anterior nucleus
- VApc
parvocellular part of the ventral anterior nucleus
- VLa
ventral lateral anterior nucleus
- VLp
ventral lateral posterior nucleus
- VM
ventral medial nucleus
- VMb
basal ventral medial nucleus
- VPI
ventral posterior inferior nucleus
- VPL
ventral posterolateral nucleus
- VPM
ventral posteromedial nucleus
- ZI
zona incerta
Footnotes
Disclosure of potential conflicts of interest:
SM is co-founder and CEO, and KO is a consultant for “AnatomyWorks.” This arrangement is being managed by the Johns Hopkins University in accordance with its conflict-of-interest policies.
Research involving Human Participants and/or Animals:
This study was performed under protocol IRB00101384 for retrospective use of de-identified tissues for research purposes, approved by the Institutional Review Board of the School of Medicine, Johns Hopkins University.
References
- Aggarwal M, Zhang J, Miller MI, Sidman RL, Mori S (2009) Magnetic resonance imaging and micro-computed tomography combined atlas of developing and adult mouse brains for stereotaxic surgery. Neuroscience 162 (4):1339–1350. doi: 10.1016/j.neuroscience.2009.05.070 [DOI] [PMC free article] [PubMed] [Google Scholar]
- Aggarwal M, Mori S, Shimogori T, Blackshaw S, Zhang J (2010) Three-dimensional diffusion tensor microimaging for anatomical characterization of the mouse brain. Magn Reson Med 64 (1):249–261. doi: 10.1002/mrm.22426 [DOI] [PMC free article] [PubMed] [Google Scholar]
- Aggarwal M, Zhang J, Pletnikova O, Crain B, Troncoso J, Mori S (2013) Feasibility of creating a high-resolution 3D diffusion tensor imaging based atlas of the human brainstem: a case study at 11.7 T. Neuroimage 74:117–127. doi: 10.1016/j.neuroimage.2013.01.061 [DOI] [PMC free article] [PubMed] [Google Scholar]
- Akram H, Sotiropoulos SN, Jbabdi S, Georgiev D, Mahlknecht P, Hyam J, Foltynie T, Limousin P, De Vita E, Jahanshahi M, Hariz M, Ashburner J, Behrens T, Zrinzo L (2017) Subthalamic deep brain stimulation sweet spots and hyperdirect cortical connectivity in Parkinson’s disease. Neuroimage 158:332–345. doi: 10.1016/j.neuroimage.2017.07.012 [DOI] [PMC free article] [PubMed] [Google Scholar]
- Alexander GE, Crutcher MD, DeLong MR (1995) Basal ganglia-thalamocortical circuits: parallel substrates for motor, oculomotor, “prefrontal” and “limbic” functions. Prog Brain Res 85:119–146 [PubMed] [Google Scholar]
- Alexander GE, DeLong MR, Strick PL (1986) Parallel organization of functionally segregated circuits linking basal ganglia and cortex. Annual review of neuroscience 9:357–381. doi: 10.1146/annurev.ne.09.030186.002041 [DOI] [PubMed] [Google Scholar]
- Apkarian AV, Hodge CJ (1989) Primate spinothalamic pathways: III. Thalamic terminations of the dorsolateral and ventral spinothalamic pathways. J Comp Neurol 288 (3):493–511 [DOI] [PubMed] [Google Scholar]
- Asanuma H, Thach WT, Jones EG (1983) Distribution of cerebellar terminations and their relation to other afferent terminations in the thalamic ventral lateral region of the monkey. Brain Res Rev 5:237–265 [DOI] [PubMed] [Google Scholar]
- Behrens TE, Woolrich MW, Jenkinson M, Johansen-Berg H, Nunes RG, Clare S, Matthews PM, Brady JM, Smith SM (2003) Characterization and propagation of uncertainty in diffusion-weighted MR imaging. Magn Reson Med 50 (5):1077–1088. doi: 10.1002/mrm.10609 [DOI] [PubMed] [Google Scholar]
- Benabid AL, Pollak P, Gervason C, Hoffman D, Dong MG, Hommel M, Perret JE, Rougemont JD (1991) Long term suppression of tremor by chronic stimulation of the ventral intermediate thalamic nucleus. Lancet 337:403–406 [DOI] [PubMed] [Google Scholar]
- Calabrese E, Hickey P, Hulette C, Zhang J, Parente B, Lad SP, Johnson GA (2015) Postmortem diffusion MRI of the human brainstem and thalamus for deep brain stimulator electrode localization. Hum Brain Mapp 36 (8):3167–3178. doi: 10.1002/hbm.22836 [DOI] [PMC free article] [PubMed] [Google Scholar]
- Calzavara R, Zappala A, Rozzi S, Matelli M, Luppino G (2005) Neurochemical characterization of the cerebellar-recipient motor thalamic territory in the macaque monkey. The European journal of neuroscience 21 (7):1869–1894. doi: 10.1111/j.1460-9568.2005.04020.x [DOI] [PubMed] [Google Scholar]
- Chang EH, Argyelan M, Aggarwal M, Chandon TS, Karlsgodt KH, Mori S, Malhotra AK (2017) Diffusion tensor imaging measures of white matter compared to myelin basic protein immunofluorescence in tissue cleared intact brains. Data Brief 10:438–443. doi: 10.1016/j.dib.2016.12.018 [DOI] [PMC free article] [PubMed] [Google Scholar]
- Chazen JL, Sarva H, Stieg PE, Min RJ, Ballon DJ, Pryor KO, Riegelhaupt PM, Kaplitt MG (2018) Clinical improvement associated with targeted interruption of the cerebellothalamic tract following MR-guided focused ultrasound for essential tremor. Journal of neurosurgery 129 (2):315–323. doi: 10.3171/2017.4.JNS162803 [DOI] [PubMed] [Google Scholar]
- Chuang N, Mori S, Yamamoto A, Jiang H, Ye X, Xu X, Richards LJ, Nathans J, Miller MI, Toga AW, Sidman RL, Zhang J (2011) An MRI-based atlas and database of the developing mouse brain. Neuroimage 54 (1):80–89. doi: 10.1016/j.neuroimage.2010.07.043 [DOI] [PMC free article] [PubMed] [Google Scholar]
- Chung AW, Thomas DL, Ordidge RJ, Clark CA (2013) Diffusion tensor parameters and principal eigenvector coherence: relation to b-value intervals and field strength. Magn Reson Imaging 31 (5):742–747. doi: 10.1016/j.mri.2012.11.014 [DOI] [PubMed] [Google Scholar]
- Coenen VA, Madler B, Schiffbauer H, Urbach H, Allert N (2011) Individual fiber anatomy of the subthalamic region revealed with diffusion tensor imaging: a concept to identify the deep brain stimulation target for tremor suppression. Neurosurgery 68 (4):1069–1075; discussion 1075–1066. doi: 10.1227/NEU.0b013e31820a1a20 [DOI] [PubMed] [Google Scholar]
- Craig AD (2004) Distribution of trigeminothalamic and spinothalamic lamina I terminations in the macaque monkey. J Comp Neurol 477 (2):119–148 [DOI] [PubMed] [Google Scholar]
- DeArmond SJ, De Armond SJ, Fusco PASMM, Fusco MM, Dewey MM, Dewey CPASMM, Press OU(1989) Structure of the Human Brain: A Photographic Atlas. Oxford University Press, [Google Scholar]
- DeLong M, Wichmann T (2009) Update on models of basal ganglia function and dysfunction. Parkinsonism & related disorders 15 Suppl 3:S237–240. doi: 10.1016/S1353-8020(09)70822-3 [DOI] [PMC free article] [PubMed] [Google Scholar]
- DeLong M, Wichmann T (2010) Changing views of basal ganglia circuits and circuit disorders. Clin EEG Neurosci 41 (2):61–67. doi: 10.1177/155005941004100204 [DOI] [PMC free article] [PubMed] [Google Scholar]
- DeLong MR (1990) Primate models of movement disorders of basal ganglia origin. Trends in neurosciences 13 (7):281–285. doi: 10.1016/0166-2236(90)90110-v [DOI] [PubMed] [Google Scholar]
- DeVito JL, Anderson ME (1982) An autoradiographic study of efferent connections of the globus pallidus in Macaca mulatta. Exp Brain Res 46 (1):107–117 [DOI] [PubMed] [Google Scholar]
- Elble RJ, Shih L, Cozzens JW (2018) Surgical treatments for essential tremor. Expert Rev Neurother 18 (4):303–321. doi: 10.1080/14737175.2018.1445526 [DOI] [PubMed] [Google Scholar]
- Elias WJ, Lipsman N, Ondo WG, Ghanouni P, Kim YG, Lee W, Schwartz M, Hynynen K, Lozano AM, Shah BB, Huss D, Dallapiazza RF, Gwinn R, Witt J, Ro S, Eisenberg HM, Fishman PS, Gandhi D, Halpern CH, Chuang R, Butts Pauly K, Tierney TS, Hayes MT, Cosgrove GR, Yamaguchi T, Abe K, Taira T, Chang JW (2016) A Randomized Trial of Focused Ultrasound Thalamotomy for Essential Tremor. The New England journal of medicine 375 (8):730–739. doi: 10.1056/NEJMoa1600159 [DOI] [PubMed] [Google Scholar]
- Fakhoury M (2017) The habenula in psychiatric disorders: More than three decades of translational investigation. Neuroscience and biobehavioral reviews 83:721–735. doi: 10.1016/j.neubiorev.2017.02.010 [DOI] [PubMed] [Google Scholar]
- Fasano A, Llinas M, Munhoz RP, Hlasny E, Kucharczyk W, Lozano AM (2017) MRI-guided focused ultrasound thalamotomy in non-ET tremor syndromes. Neurology 89 (8):771–775. doi: 10.1212/WNL.0000000000004268 [DOI] [PubMed] [Google Scholar]
- Francois C, Percheron G, Yelnik J (1984) Localization of nigrostriatal, nigrothalamic and nigrotectal neurons in ventricular coordinates in macaques. Neuroscience 13 (1):61–76. doi: 10.1016/0306-4522(84)90259-8 [DOI] [PubMed] [Google Scholar]
- Francois C, Tande D, Yelnik J, Hirsch EC (2002) Distribution and morphology of nigral axons projecting to the thalamus in primates. J Comp Neurol 447 (3):249–260. doi: 10.1002/cne.10227 [DOI] [PubMed] [Google Scholar]
- Gallay MN, Jeanmonod D, Liu J, Morel A (2008) Human pallidothalamic and cerebellothalamic tracts: anatomical basis for functional stereotactic neurosurgery. Brain structure & function 212 (6):443–463. doi: 10.1007/s00429-007-0170-0 [DOI] [PMC free article] [PubMed] [Google Scholar]
- Ghanouni P, Pauly KB, Elias WJ, Henderson J, Sheehan J, Monteith S, Wintermark M (2015) Transcranial MRI-Guided Focused Ultrasound: A Review of the Technologic and Neurologic Applications. Ajr 205 (1):150–159. doi: 10.2214/AJR.14.13632 [DOI] [PMC free article] [PubMed] [Google Scholar]
- Godinho F, Magnin M, Filho PT, Reis P, Moraes O, Nascimento M, Costa C, de Oliveira MO, Rocha MS (2019) Stereotactic Lesion in the Forel’s Field H: A 2-Years Prospective Open-Label Study on Motor and Nonmotor Symptoms, Neuropsychological Functions, and Quality of Life in Parkinson Disease. Neurosurgery 85 (4):E650–E659. doi: 10.1093/neuros/nyz039 [DOI] [PubMed] [Google Scholar]
- Groenewegen HJ, Berendse HW (1990) Connections of the subthalamic nucleus with ventral striatopallidal parts of the basal ganglia in the rat. J Comp Neurol 294 (4):607–622. doi: 10.1002/cne.902940408 [DOI] [PubMed] [Google Scholar]
- Guilfoyle DN, Helpern JA, Lim KO (2003) Diffusion tensor imaging in fixed brain tissue at 7.0 T. NMR in biomedicine 16 (2):77–81. doi: 10.1002/nbm.814 [DOI] [PubMed] [Google Scholar]
- Haber SN, Calzavara R (2009) The cortico-basal ganglia integrative network: the role of the thalamus. Brain Res Bull 78 (2–3):69–74 [DOI] [PMC free article] [PubMed] [Google Scholar]
- Hand PJ, Van Winkle T (1977) The efferent connections of the feline nucleus cuneatus. J Comp Neurol 171 (1):83–109. doi: 10.1002/cne.901710107 [DOI] [PubMed] [Google Scholar]
- Hassler R (1959) Anatomy of the thalamus. In: Schaltenbrand G, Bailey P (eds) Introduction to stereotaxis with an atlas of the human brain Thieme, Stuttgart, pp 230–290 [Google Scholar]
- Herkenham M, Nauta WJ (1979) Efferent connections of the habenular nuclei in the rat. J Comp Neurol 187 (1):19–47. doi: 10.1002/cne.901870103 [DOI] [PubMed] [Google Scholar]
- Herrington TM, Cheng JJ, Eskandar EN (2016) Mechanisms of deep brain stimulation. J Neurophysiol 115 (1):19–38. doi: 10.1152/jn.00281.2015 [DOI] [PMC free article] [PubMed] [Google Scholar]
- Herzog J, Fietzek U, Hamel W, Morsnowski A, Steigerwald F, Schrader B, Weinert D, Pfister G, Muller D, Mehdorn HM, Deuschl G, Volkmann J (2004) Most effective stimulation site in subthalamic deep brain stimulation for Parkinson’s disease. Mov Disord 19 (9):1050–1054. doi: 10.1002/mds.20056 [DOI] [PubMed] [Google Scholar]
- Hess CW, Ofori E, Akbar U, Okun MS, Vaillancourt DE (2013) The evolving role of diffusion magnetic resonance imaging in movement disorders. Curr Neurol Neurosci Rep 13 (11):400. doi: 10.1007/s11910-013-0400-1 [DOI] [PMC free article] [PubMed] [Google Scholar]
- Hirai T, Jones EG (1989) A new parcellation of the human thalamus on the basis of histochemical staining. Brain Res Rev 14:1–34 [DOI] [PubMed] [Google Scholar]
- Hori H, Yamaguchi T, Konishi Y, Taira T, Muragaki Y (2019) Correlation between fractional anisotropy changes in the targeted ventral intermediate nucleus and clinical outcome after transcranial MR-guided focused ultrasound thalamotomy for essential tremor: results of a pilot study. Journal of neurosurgery:1–6. doi: 10.3171/2018.10.JNS18993 [DOI] [PubMed] [Google Scholar]
- Horisawa S, Fukui A, Tanaka Y, Wendong L, Yamahata H, Kawamata T, Taira T (2019) Pallidothalamic Tractotomy (Forel’s Field H1-tomy) for Dystonia: Preliminary Results. World neurosurgery 129:e851–e856. doi: 10.1016/j.wneu.2019.06.055 [DOI] [PubMed] [Google Scholar]
- Huang H, Xue R, Zhang J, Ren T, Richards LJ, Yarowsky P, Miller MI, Mori S (2009) Anatomical characterization of human fetal brain development with diffusion tensor magnetic resonance imaging. J Neurosci 29 (13):4263–4273. doi: 10.1523/JNEUROSCI.2769-08.2009 [DOI] [PMC free article] [PubMed] [Google Scholar]
- Huisken J, Swoger J, Del Bene F, Wittbrodt J, Stelzer EH (2004) Optical sectioning deep inside live embryos by selective plane illumination microscopy. Science 305 (5686):1007–1009. doi: 10.1126/science.1100035 [DOI] [PubMed] [Google Scholar]
- Irle E, Sarter M, Guldin WO, Markowitsch HJ (1984) Afferents to the ventral tegmental nucleus of Gudden in the mouse, rat, and cat. J Comp Neurol 228 (4):509–541. doi: 10.1002/cne.902280406 [DOI] [PubMed] [Google Scholar]
- Jeurissen B, Leemans A, Jones DK, Tournier JD, Sijbers J (2011) Probabilistic fiber tracking using the residual bootstrap with constrained spherical deconvolution. Hum Brain Mapp 32 (3):461–479. doi: 10.1002/hbm.21032 [DOI] [PMC free article] [PubMed] [Google Scholar]
- Jiang H, van Zijl PC, Kim J, Pearlson GD, Mori S (2006) DtiStudio: resource program for diffusion tensor computation and fiber bundle tracking. Computer methods and programs in biomedicine 81 (2):106–116 [DOI] [PubMed] [Google Scholar]
- Jinnai D (1966) Clinical results and the significance of Forel-H-tomy in the treatment of epilepsy. Confin Neurol 27 (1):129–136 [DOI] [PubMed] [Google Scholar]
- Jinnai D, Nishimoto A (1963) Stereotaxic Destruction of Forel-H for Treatment of Epilepsy. Neurochirurgia (Stuttg) 6:164–176. doi: 10.1055/s-0028-1095439 [DOI] [PubMed] [Google Scholar]
- Jones EG, Schwark HD, Callahan PA (1986) Extent of the ipsilateral representation in the ventral posterior medial nucleus of the monkey thalamus. Exp Brain Res 63 (2):310–320 [DOI] [PubMed] [Google Scholar]
- Jones RM, Kamps S, Huang Y, Scantlebury N, Lipsman N, Schwartz ML, Hynynen K (2019) Accumulated thermal dose in MRI-guided focused ultrasound for essential tremor: repeated sonications with low focal temperatures. Journal of neurosurgery:1–8. doi: 10.3171/2019.2.JNS182995 [DOI] [PMC free article] [PubMed] [Google Scholar]
- Kalia SK, Sankar T, Lozano AM (2013) Deep brain stimulation for Parkinson’s disease and other movement disorders. Current opinion in neurology 26 (4):374–380. doi: 10.1097/WCO.0b013e3283632d08 [DOI] [PubMed] [Google Scholar]
- Kamali A, Kramer LA, Butler IJ, Hasan KM (2009) Diffusion tensor tractography of the somatosensory system in the human brainstem: initial findings using high isotropic spatial resolution at 3.0 T. Eur Radiol 19 (6):1480–1488. doi: 10.1007/s00330-009-1305-x [DOI] [PubMed] [Google Scholar]
- Kamali A, Sair HI, Blitz AM, Riascos RF, Mirbagheri S, Keser Z, Hasan KM (2016) Revealing the ventral amygdalofugal pathway of the human limbic system using high spatial resolution diffusion tensor tractography. Brain structure & function 221 (7):3561–3569. doi: 10.1007/s00429-015-1119-3 [DOI] [PubMed] [Google Scholar]
- Kamali A, Zhang CC, Riascos RF, Tandon N, Bonafante-Mejia EE, Patel R, Lincoln JA, Rabiei P, Ocasio L, Younes K, Hasan KM (2018) Diffusion tensor tractography of the mammillothalamic tract in the human brain using a high spatial resolution DTI technique. Scientific reports 8 (1):5229. doi: 10.1038/s41598-018-23452-w [DOI] [PMC free article] [PubMed] [Google Scholar]
- Kim R, Nakano K, Jayaraman A, Carpenter MB (1976) Projections of the globus pallidus and adjacent structures: an autoradiographic study in the monkey. J Comp Neurol 169 (3):263–290. doi: 10.1002/cne.901690302 [DOI] [PubMed] [Google Scholar]
- Klemm WR (2004) Habenular and interpeduncularis nuclei: shared components in multiple-function networks. Med Sci Monit 10 (11):RA261–273 [PubMed] [Google Scholar]
- Lehericy S, Bardinet E, Poupon C, Vidailhet M, Francois C (2014) 7 Tesla magnetic resonance imaging: a closer look at substantia nigra anatomy in Parkinson’s disease. Mov Disord 29 (13):1574–1581. doi: 10.1002/mds.26043 [DOI] [PubMed] [Google Scholar]
- Lemaire JJ, Cosnard G, Sakka L, Nuti C, Gradkowski W, Mori S, Hermoye L (2011) White matter anatomy of the human deep brain revisited with high resolution DTI fibre tracking. Neurochirurgie 57 (2):52–67. doi: 10.1016/j.neuchi.2011.04.001 [DOI] [PubMed] [Google Scholar]
- Lenz FA (2006) Ablative Procedures. In: Koller WC(ed) Parkinson’s disease and related disorders. Handbook of Neurology. Elsevier, Amsterdam, [Google Scholar]
- Lenz FA, Casey KL, Jones EG, Willis WDJ (2010) The Human Pain System: Experimental and Clinical Perspectives. 1 edn. Cambridge University Press, NY, NY. doi: 10.1017/CBO9780511770579 [DOI] [Google Scholar]
- Lewis A, Galetta S (2019) Editors’ note: DBS of the PSA and the VIM in essential tremor: A randomized, double-blind, crossover trial. Neurology 92 (20):974. doi: 10.1212/WNL.0000000000007520 [DOI] [PubMed] [Google Scholar]
- Li Y, Jiang H, Mori S (2012) Quantitative Assessment of Mis-registration Issues of Diffusion Tensor Imaging (DTI). Progress in Biomedical Optics and Imaging - Proceedings of SPIE 8314:66. doi: 10.1117/12.911129 [DOI] [Google Scholar]
- Li Y, Shea SM, Lorenz CH, Jiang H, Chou MC, Mori S (2013) Image corruption detection in diffusion tensor imaging for post-processing and real-time monitoring. PLoS One 8 (10):e49764. doi: 10.1371/journal.pone.0049764 [DOI] [PMC free article] [PubMed] [Google Scholar]
- Limousin P, Foltynie T (2019) Long-term outcomes of deep brain stimulation in Parkinson disease. Nat Rev Neurol 15 (4):234–242. doi: 10.1038/s41582-019-0145-9 [DOI] [PubMed] [Google Scholar]
- Lozano AM, Lipsman N (2013) Probing and regulating dysfunctional circuits using deep brain stimulation. Neuron 77 (3):406–424. doi: 10.1016/j.neuron.2013.01.020 [DOI] [PubMed] [Google Scholar]
- Magnin M, Jeanmonod D, Morel A, Siegemund M (2006) Surgical control of the human thalamocortical dysrhythmia: II. Pallidothalamic tractotomy in Parkinson’s disease. Thalamus & Related Systems 1 (1):81–89. doi: 10.1017/S1472928801000024 [DOI] [Google Scholar]
- Mai JK, Majtanik M, Paxinos G (2015) Atlas of the Human Brain. Elsevier Science, [Google Scholar]
- Mehler WR (1962) The anatomy of the so-called “pain tract” in man: an analysis of the course and distribution of the ascending fibers of the fasciculus anterolateralis In: French JD, Porter RW(eds) Basic Research in Paraplegia. Thomas, Springfield, pp 26–55 [Google Scholar]
- Middleton FA, Strick PL (1997) Cerebellar output channels. Int Rev Neurobiol 41:61–82 [DOI] [PubMed] [Google Scholar]
- Middleton FA, Strick PL (1998) Cerebellar output: motor and cognitive channels. Trends Cogn Sci 2 (9):348–354 [DOI] [PubMed] [Google Scholar]
- Miller MI, Trouve A, Younes L (2002) On the metrics and euler-lagrange equations of computational anatomy. Annual review of biomedical engineering 4:375–405. doi: 10.1146/annurev.bioeng.4.092101.125733 [DOI] [PubMed] [Google Scholar]
- Miocinovic S, Somayajula S, Chitnis S, Vitek JL (2013) History, applications, and mechanisms of deep brain stimulation. JAMA neurology 70 (2):163–171. doi: 10.1001/2013.jamaneurol.45 [DOI] [PubMed] [Google Scholar]
- Morel A (2007) Stereotactic atlas of the Thlamus and Basal Ganglia. Healthcare, NY, NY [Google Scholar]
- Mori S, Aggarwal M (2014) In vivo magnetic resonance imaging of the human limbic white matter. Frontiers in aging neuroscience 6:321. doi: 10.3389/fnagi.2014.00321 [DOI] [PMC free article] [PubMed] [Google Scholar]
- Mori S, Crain BJ, Chacko VP, van Zijl PC (1999) Three-dimensional tracking of axonal projections in the brain by magnetic resonance imaging. Annals of neurology 45 (2):265–269. doi: [DOI] [PubMed] [Google Scholar]
- Mori S, Kageyama Y, Hou Z, Aggarwal M, Patel J, Brown T, Miller MI, Wu D, Troncoso JC (2017) Elucidation of White Matter Tracts of the Human Amygdala by Detailed Comparison between High-Resolution Postmortem Magnetic Resonance Imaging and Histology. Frontiers in neuroanatomy 11:16. doi: 10.3389/fnana.2017.00016 [DOI] [PMC free article] [PubMed] [Google Scholar]
- Mori S, van Zijl PC (2002) Fiber tracking: principles and strategies - a technical review. NMR in biomedicine 15 (7–8):468–480. doi: 10.1002/nbm.781 [DOI] [PubMed] [Google Scholar]
- Mori S, Zhang J (2006) Principles of diffusion tensor imaging and its applications to basic neuroscience research. Neuron 51 (5):527–539 [DOI] [PubMed] [Google Scholar]
- Nauta WJH, Mehler WR (1966) Projections of the lentiform nucleus in the monkey. Brain Res 1:3–42 [DOI] [PubMed] [Google Scholar]
- Neudorfer C, El Majdoub F, Hunsche S, Richter K, Sturm V, Maarouf M (2017) Deep Brain Stimulation of the H Fields of Forel Alleviates Tics in Tourette Syndrome. Frontiers in human neuroscience 11:308. doi: 10.3389/fnhum.2017.00308 [DOI] [PMC free article] [PubMed] [Google Scholar]
- Neudorfer C, Maarouf M (2018) Neuroanatomical background and functional considerations for stereotactic interventions in the H fields of Forel. Brain structure & function 223 (1):17–30. doi: 10.1007/s00429-017-1570-4 [DOI] [PubMed] [Google Scholar]
- Nieuwenhuys R, Voogd J, Huijzen Cv (2008) The human central nervous system. 4th edn. Springer, New York [Google Scholar]
- Nowacki A, Schlaier J, Debove I, Pollo C (2018) Validation of diffusion tensor imaging tractography to visualize the dentatorubrothalamic tract for surgical planning. Journal of neurosurgery 130 (1):99–108. doi: 10.3171/2017.9.JNS171321 [DOI] [PubMed] [Google Scholar]
- Oishi K, Faria A, Jiang H, Li X, Akhter K, Zhang J, Hsu JT, Miller MI, van Zijl PC, Albert M, Lyketsos CG, Woods R, Toga AW, Pike GB, Rosa-Neto P, Evans A, Mazziotta J, Mori S (2009) Atlas-based whole brain white matter analysis using large deformation diffeomorphic metric mapping: application to normal elderly and Alzheimer’s disease participants. Neuroimage 46 (2):486–499. doi: 10.1016/j.neuroimage.2009.01.002 [DOI] [PMC free article] [PubMed] [Google Scholar]
- Oishi K, Faria AV, van Zijl PCM, Mori S (2010) MRI Atlas of Human White Matter. Elsevier Science, [Google Scholar]
- Percheron G, Francois C, Talbi B, Meder JF, Fenelon G, Yelnik J (1993) The primate motor thalamus analysed with reference to subcortical afferent territories. Stereotact Funct Neurosurg 60 (1–3):32–41 [DOI] [PubMed] [Google Scholar]
- Plaha P, Patel NK, Gill SS (2004) Stimulation of the subthalamic region for essential tremor. Journal of neurosurgery 101 (1):48–54. doi: 10.3171/jns.2004.101.1.0048 [DOI] [PubMed] [Google Scholar]
- Pujol S, Cabeen R, Sebille SB, Yelnik J, Francois C, Fernandez Vidal S, Karachi C, Zhao Y, Cosgrove GR, Jannin P, Kikinis R, Bardinet E (2016) In vivo Exploration of the Connectivity between the Subthalamic Nucleus and the Globus Pallidus in the Human Brain Using Multi-Fiber Tractography. Frontiers in neuroanatomy 10:119. doi: 10.3389/fnana.2016.00119 [DOI] [PMC free article] [PubMed] [Google Scholar]
- Rausell E, Jones EG (1991) Chemically distinct compartments of the thalamic VPM nucleus in monkeys relay principal and spinal trigeminal pathways to different layers of the somatosensory cortex. J Neurosci 11:226–237 [DOI] [PMC free article] [PubMed] [Google Scholar]
- Reckfort J, Wiese H, Pietrzyk U, Zilles K, Amunts K, Axer M (2015) A multiscale approach for the reconstruction of the fiber architecture of the human brain based on 3D-PLI. Frontiers in neuroanatomy 9:118. doi: 10.3389/fnana.2015.00118 [DOI] [PMC free article] [PubMed] [Google Scholar]
- Ricardo JA (1983) Hypothalamic pathways involved in metabolic regulatory functions, as identified by track-tracing methods. Advances in metabolic disorders 10:1–30 [DOI] [PubMed] [Google Scholar]
- Saint-Cyr JA, Hoque T, Pereira LC, Dostrovsky JO, Hutchison WD, Mikulis DJ, Abosch A, Sime E, Lang AE, Lozano AM (2002) Localization of clinically effective stimulating electrodes in the human subthalamic nucleus on magnetic resonance imaging. J Neurosurg 97 (5):1152–1166 [DOI] [PubMed] [Google Scholar]
- Schafer M, Kim JW, Joseph J, Xu J, Frangou S, Doucet GE (2018) Imaging Habenula Volume in Schizophrenia and Bipolar Disorder. Frontiers in psychiatry 9:456. doi: 10.3389/fpsyt.2018.00456 [DOI] [PMC free article] [PubMed] [Google Scholar]
- Schaltenbrand G, Wahren W (1977) Atlas for Stereotaxy of the Human Brain. Year Book Medical Publishers, [Google Scholar]
- Schlesinger I, Eran A, Sinai A, Erikh I, Nassar M, Goldsher D, Zaaroor M (2015) MRI Guided Focused Ultrasound Thalamotomy for Moderate-to-Severe Tremor in Parkinson’s Disease. Parkinsons Dis 2015:219149. doi: 10.1155/2015/219149 [DOI] [PMC free article] [PubMed] [Google Scholar]
- Schmierer K, Wheeler-Kingshott CA, Tozer DJ, Boulby PA, Parkes HG, Yousry TA, Scaravilli F, Barker GJ, Tofts PS, Miller DH (2008) Quantitative magnetic resonance of postmortem multiple sclerosis brain before and after fixation. Magn Reson Med 59 (2):268–277. doi: 10.1002/mrm.21487 [DOI] [PMC free article] [PubMed] [Google Scholar]
- Schuurman PR, Bosch DA, Bossuyt PM, Bonsel GJ, van Someren EJ, de Bie RM, Speelman JD (2000) A comparison of continuous thalamic stimulation and thalamotomy for suppression of severe tremor. New England Journal of Medicine 342 (7):461–468 [DOI] [PubMed] [Google Scholar]
- Spiegel EA, Wycis HT, Szekely EG, Adams DJ, Flanagan M, Baird HW 3rd, (1963) Campotomy in Various Extrapyramidal Disorders. Journal of neurosurgery 20:871–884. doi: 10.3171/jns.1963.20.10.0871 [DOI] [PubMed] [Google Scholar]
- Spiegel EA, Wycis HT, Szekely EG, Baird HW 3rd, Adams J , Flanagan M (1962) Campotomy. Trans Am Neurol Assoc 87:240–242 [PubMed] [Google Scholar]
- Squire L, Berg D, Bloom FE, du Lac S, Ghosh A, Spitzer NC (2013) Fundamental Neuroscience. Elsevier Science, [Google Scholar]
- Sun SW, Neil JJ, Liang HF, He YY, Schmidt RE, Hsu CY, Song SK (2005) Formalin fixation alters water diffusion coefficient magnitude but not anisotropy in infarcted brain. Magn Reson Med 53 (6):1447–1451. doi: 10.1002/mrm.20488 [DOI] [PubMed] [Google Scholar]
- Thach WT, Jones EG (1979) The cerebellar dentatothalamic connection: terminal field, lamallae, rods and somatotopy. Brain Res 169:168–172 [DOI] [PubMed] [Google Scholar]
- Tian Q, Wintermark M, Jeffrey Elias W, Ghanouni P, Halpern CH, Henderson JM, Huss DS, Goubran M, Thaler C, Airan R, Zeineh M, Pauly KB, McNab JA (2018) Diffusion MRI tractography for improved transcranial MRI-guided focused ultrasound thalamotomy targeting for essential tremor. NeuroImage Clinical 19:572–580. doi: 10.1016/j.nicl.2018.05.010 [DOI] [PMC free article] [PubMed] [Google Scholar]
- Tournier JD, Calamante F, Connelly A (2007) Robust determination of the fibre orientation distribution in diffusion MRI: non-negativity constrained super-resolved spherical deconvolution. Neuroimage 35 (4):1459–1472. doi: 10.1016/j.neuroimage.2007.02.016 [DOI] [PubMed] [Google Scholar]
- Tuch DS, Reese TG, Wiegell MR, Wedeen VJ (2003) Diffusion MRI of complex neural architecture. Neuron 40 (5):885–895. doi: 10.1016/s0896-6273(03)00758-x [DOI] [PubMed] [Google Scholar]
- Utter AA, Basso MA (2008) The basal ganglia: an overview of circuits and function. Neuroscience and biobehavioral reviews 32 (3):333–342. doi: 10.1016/j.neubiorev.2006.11.003 [DOI] [PubMed] [Google Scholar]
- Vanegas-Arroyave N, Lauro PM, Huang L, Hallett M, Horovitz SG, Zaghloul KA, Lungu C (2016) Tractography patterns of subthalamic nucleus deep brain stimulation. Brain 139 (Pt 4):1200–1210. doi: 10.1093/brain/aww020 [DOI] [PMC free article] [PubMed] [Google Scholar]
- Veazey RB, Amaral DG, Cowan WM (1982) The morphology and connections of the posterior hypothalamus in the cynomolgus monkey (Macaca fascicularis). I. Cytoarchitectonic organization. J Comp Neurol 207 (2):114–134. doi: 10.1002/cne.902070203 [DOI] [PubMed] [Google Scholar]
- Vercueil L, Pollak P, Fraix V, Caputo E, Moro E, Benazzouz A, Xie J, Koudsie A, Benabid AL (2001) Deep brain stimulation in the treatment of severe dystonia. J Neurol 248 (8):695–700 [DOI] [PubMed] [Google Scholar]
- Voges J, Volkmann J, Allert N, Lehrke R, Koulousakis A, Freund HJ, Sturm V (2002) Bilateral high-frequency stimulation in the subthalamic nucleus for the treatment of Parkinson disease: correlation of therapeutic effect with anatomical electrode position. Journal of neurosurgery 96 (2):269–279. doi: 10.3171/jns.2002.96.2.0269 [DOI] [PubMed] [Google Scholar]
- Wang H, Zhu J, Reuter M, Vinke LN, Yendiki A, Boas DA, Fischl B, Akkin T (2014) Cross-validation of serial optical coherence scanning and diffusion tensor imaging: a study on neural fiber maps in human medulla oblongata. Neuroimage 100:395–404. doi: 10.1016/j.neuroimage.2014.06.032 [DOI] [PMC free article] [PubMed] [Google Scholar]
- Wycis HT, Spiegel EA (1969) Campotomy in myoclonia. Journal of neurosurgery 30 (6):708–713. doi: 10.3171/jns.1969.30.6.0708 [DOI] [PubMed] [Google Scholar]
- Yamada K, Akazawa K, Yuen S, Goto M, Matsushima S, Takahata A, Nakagawa M, Mineura K, Nishimura T (2010) MR imaging of ventral thalamic nuclei. AJNR Am J Neuroradiol 31 (4):732–735. doi: 10.3174/ajnr.A1870 [DOI] [PMC free article] [PubMed] [Google Scholar]
- Yamamoto K, Ito H, Fukutake S, Kamei T, Yamaguchi T, Taira T (2019) Ventralis intermedius thalamotomy with focused ultrasound for patients with low skull density ratio. Mov Disord 34 (8):1239–1240. doi: 10.1002/mds.27726 [DOI] [PubMed] [Google Scholar]
- Yelnik J, Damier P, Demeret S, Gervais D, Bardinet E, Bejjani BP, Francois C, Houeto JL, Arnule I, Dormont D, Galanaud D, Pidoux B, Cornu P, Agid Y (2003) Localization of stimulating electrodes in patients with Parkinson disease by using a three-dimensional atlas-magnetic resonance imaging coregistration method. Journal of neurosurgery 99 (1):89–99. doi: 10.3171/jns.2003.99.1.0089 [DOI] [PubMed] [Google Scholar]
- Zhang J, Jones MV, McMahon MT, Mori S, Calabresi PA (2012) In vivo and ex vivo diffusion tensor imaging of cuprizone-induced demyelination in the mouse corpus callosum. Magn Reson Med 67 (3):750–759. doi: 10.1002/mrm.23032 [DOI] [PMC free article] [PubMed] [Google Scholar]
- Zhang J, Miller MI, Plachez C, Richards LJ, Yarowsky P, van Zijl P, Mori S (2005) Mapping postnatal mouse brain development with diffusion tensor microimaging. Neuroimage 26 (4):1042–1051. doi: 10.1016/j.neuroimage.2005.03.009 [DOI] [PubMed] [Google Scholar]
- Zhang J, van Zijl PC, Mori S (2006) Image contrast using the secondary and tertiary eigenvectors in diffusion tensor imaging. Magn Reson Med 55 (2):439–449. doi: 10.1002/mrm.20767 [DOI] [PubMed] [Google Scholar]