

Abstract
Most electrochemical processes are stochastic and discrete in nature. Yet experimental observables, e.g., i vs E, are typically smooth and deterministic, due to many events/processes, e.g., electron transfers, being averaged together. However, when the number of entities measured approaches a few or even one, stochasticity frequently emerges. Yet all is not lost! Probabilistic and statistical interpretation can generate insights matching or superseding those from macroscale/ensemble measurements, revealing phenomena that were hitherto averaged over. Herein, we review recent literature examples of stochastic processes in single-entity electrochemistry, highlighting strategies for interpreting stochasticity, contrasting them with macroscale measurements, and describing the insights generated.
Keywords: Randomness, probability, statistics, activated processes, Brownian motion
Introduction
A trend in electrochemistry is the measurement of ever smaller quantities and systems. This is driven by multiple factors, including a desire for improved analytical detection,[1] measurement of faster processes, [2] and to understand heterogeneity, both among populations and spatially.[2–4] Single-entity electrochemistry, the measurement of one entity at a time, where the entity may be a nanoparticle, vesicle, etc., even a single molecule, represents a limit of this endeavor.[5–7]
Measurement of single entities necessitates both isolation of the response of one entity (either spatially of temporally) and sufficient signal-to-noise to quantify smaller signals.[8] Numerous recent reports describe overcoming these challenges, indicating the viability and attractiveness of these measurements, with a typical strategy being the reduction of the measurement to the micro-or nanoscale.[2, 7]
In contrast to ensemble electrochemical measurements, single-entity measurements are frequently stochastic in nature, meaning the occurrence of individual events is non-deterministic but governed by probabilities.[9] A canonical example of stochasticity is radioactive decay. One cannot predict precisely when a single atom will decay, with the likelihood the decay occurs in a small time interval δt is ln2/t1/2 δt, with t1/2 the half-life. However, averaging over many (~NA) stochastic processes in a gram-scale sample guarantees almost exactly half of the radioactive atoms will have decayed by t1/2.
Interpretation of stochastic single-entity measurements requires different analyses to ensemble measurements. Yet, when principles from probability and statistics are applied, insights that match and surpass those from ensemble experiments are accessible. Herein, we introduce five examples of stochastic single-entity electrochemical measurements leading to new findings, describing the experiments, data, analyses, and insights.
1. Stochastic Collision Electrochemistry
Constant bombardment of particles or molecules in solution by solvent molecules causes the erratic trajectories characteristic of Brownian motion (Figure 1a).[10, 11] These trajectories are stochastic; the probability of finding a particle/molecule at a position (assuming no other interactions) is a Gaussian distribution centered on the initial position, with a width dependent on the elapsed time and diffusion coefficient. However, Fick’s laws, which describe fluxes and concentrations in many electrochemical experiments, are deterministic, and typical electrochemical currents vary smoothly, not erratically. This difference arises from typical measurements averaging the random trajectories of many molecules (consider that 1 nA ≈ 6×10⁹ electron transfers per second). Yet, when measuring one, or a few, entity(s) at any one time, the impact of Brownian motion can become apparent.
Figure 1.
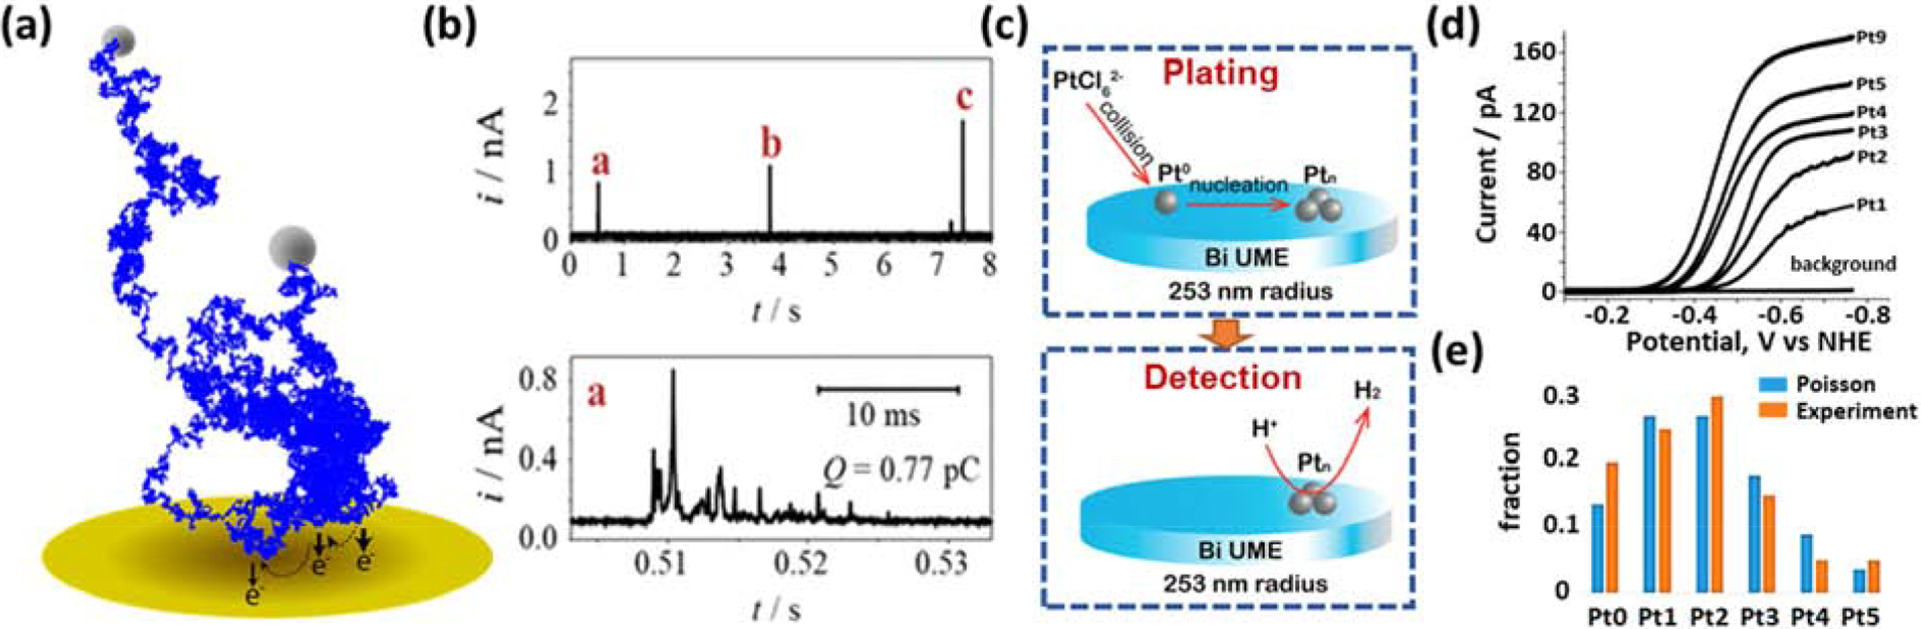
Stochastic collision electrochemistry of particles and atoms. (a) Simulated random walk and (b) experimental i-t trace of a Ag nanoparticle stochastically colliding with a Au microelectrode. Each collision results in partial electrooxidation and dissolution. (c) Schematic of two-step experiment and (d) voltammograms for characterizing proton reduction on Ptn (1≤n≤9). (e) Fraction of experiments with Ptn deposited (orange) vs prediction from Poisson distribution (blue). Particles/atoms not to scale. Reprinted adapted with permission from references [17] and [25]. Copyright 2017 American Chemical Society.
1.1. Nanoparticle Collisions
When a microelectrode is placed in a suitably dilute suspension of nanoparticles, Brownian motion manifests as discrete electrochemical responses separated by quiet periods, indicating serial collisions of individual particles with the electrode.[12] The electrochemical response can be potentiometric[13] or amperometric, e.g., blocking a reaction at the underlying electrode[14], oxidation/reduction of the particle,[15–19] or catalyzing an electrochemical reaction.[20] The response provides information on the motion and electrochemical reactions of particles as well as the particle-electrode interactions.
Figure 1a/b shows the collision of individual Ag nanoparticles with a Au microelectrode inducing electro-oxidation/dissolution (nAg(s)→nAg+(aq)+ne−).[15–17, 19, 21] The experimental i-t trace (Fig. 1b, upper) shows three distinct current bursts separated by several seconds, with each burst consisting of multiple subpeaks (see expanded timescale; Fig. 1b, lower). The frequency of current bursts varies proportionally to the particle concentration, while the characteristic statistics of subpeak groups are concentration independent. This indicates that each burst represents one particle, with subpeaks arising from the single particle’s interactions with the electrode.
Simulated trajectories calculated using Einstein’s description of Brownian motion coupled with electrodissolution (Fig. 1a)[17] suggest diffusing particles undergo 100s-1000s of collisions/electrooxidations with the electrode. When convoluted by the instrumental response, these give a handful of subpeaks,[22] from which the instantaneous current density and thus the electron transfer rate constant can be measured.[17] Altering the solution viscosity[23] or electrode dimensions[24] alters the statistics of subpeak groups, as predicted by Brownian motion simulations.[17]
1.2. Electrodeposition of single atoms and clusters
Figure 1c shows a two-part experiment representing a lower limit of collision experiments. In an initial plating step (top), a Bi microelectrode is placed in a very dilute (150 fM) H2PtCl6 solution and a reducing potential is applied for a short time period, e.g., 10 s. During this period, individual PtCl62− ions collide with the electrode surface and are reduced to Pt; however, the two-electron per PtCl62− reduction current is immeasurable. Next, the electrode is transferred into a 40 mM acid solution and voltammetry performed (lower part; Figure 1c). While the background current on the Bi microelectrode is essentially zero, due to the very sluggish kinetics of proton reduction on Bi and the small electrode area, proton reduction voltammograms on Ptn deposited on Bi (n=1 to 9) show clearly measurable currents (Fig 1d).[25]
The average number of Pt atoms deposited is determined by the PtCl62− concentration and diffusion coefficient, electrode size, and plating duration. Yet in repeated trials with identical conditions, a wide range of cluster sizes (Ptn, n = 0–5) were observed, as indicated by multiple discrete levels of voltammetric limiting current. As the arrival of individual PtCl62− ions is expected to be uncorrelated, the number of arrivals during a fixed period should follow a Poisson distribution. Figure 1e shows excellent agreement between experiment (orange bars) and this distribution (blue bars), verifying the determination of current levels for different size clusters in an inherently non-deterministic experiment. This strategy allowed the authors to characterize the proton reduction response of Ptn as a function of n and electrode material.[26]
Redox cycling between electrodes separated by a nano-gap can detect the presence of single molecules,[27–29] whose trajectories follow Brownian motion.[30] The distribution of occupancy times can be related to single-molecule random walks through statistical principles.[31, 32]
2. Nanobubble nucleation
The nucleation of new phases typically involves large energy barriers and the reorganization of tens to hundreds of molecules, making them rare stochastic events. Quantitative measurements of nucleation require high sensitivity to detect the small number of molecules involved. Inducing phase nucleation by perturbing the concentration at the surface of a nanoelectrode through an electrochemical reaction overcomes these challenges. The localized concentration perturbation and small electrode size ensure a single nucleation event occurs at the electrode surface, while the electrochemical response is sensitive to detect the associated small change at the electrode surface.
Electrochemically-induced nucleation at nanoelectrodes has been used to quantify nucleation of single gas bubbles,[33] metal particles[34] and ionic solids[35]. For reversible phase transitions, the stochasticity of nucleation can be characterized through repeated experiments, allowing determination of energetics and mechanism from measurements as a function of driving force, i.e., supersaturation/concentration, (vide infra).[36–38] An additional attractive feature of studying nucleation on tiny electrodes is that the small size of the nucleation region is amenable to molecular modelling.[39]
In the experiment shown in Figure 2, a cathodic current step, iapp, at a nanoelectrode in an acid solution (black line; Fig. 2b) induces proton reduction, creating a supersaturation of H2 at the electrode surface. Random fluctuations cause H2 clusters to spontaneously form and disperse. When a sufficiently large cluster forms, growth becomes energetically favorable and a bubble quickly grows, covering the electrode. Nucleation is indicated by a rapid rise in the potential (red curve; Fig. 2b) at a time denoted tind, the current is then stepped to zero and the bubble rapidly dissolves.
Figure 2.

Quantification of the stochastic nucleation of a single H2 nanobubble at a nanoelectrode. (a) Schematic of experiment. (b) Characteristic current and voltage transient measuring the induction time for a single bubble to nucleate, tind. (c) Repeated nucleation trials at a 41 nm radius Pt nanoelectrode indicating stochasticity and sensitivity on applied current (−30 nA, left; −33 nA, right). (d) Exponential fits to cumulative nucleation probabilities (7 applied currents) quantify nucleation rate vs concentration. (e) Measured geometry of a H2 nanobubble critical nucleus. Reprinted adapted with permission from references [36] and [38]. Copyright 2018 & 2019 American Chemical Society.
The wide distribution in tind upon application of identical currents indicates the stochasticity of nucleation (Fig. 2c), while its sensitivity to the surface concentration, which is proportional to iapp, manifests as a thousand-fold change in tind on changing iapp from −30 to −33 nA. Statistical analyses of 40 trials each at seven values of iapp is presented in a cumulative probability plot (Fig. 2d), where the x-intercept corresponding to P(tind) = 0.5, corresponding to when bubbles had formed in 50% of trials. Fits of single exponentials return a single nucleation rate for each iapp. From these rates and nucleation theory, the activation energy for nucleation and the shape and number of molecules in a critical nucleus (Fig 2e) are calculated.[36, 37]
3. Monitoring Single-Molecule Redox Processes
Shot noise precludes directly measuring the current from single electron transfers,[8] yet monitoring the oxidation state of single molecules can indirectly probe of single electron transfer reactions.[7, 40–42] Figure 3 shows an experiment from NJ Tao and coworkers[40] utilizing the conductance of single ferrocene molecules linked between a Au STM tip and a Au substrate to monitor stochastic redox transitions.[43]
Figure 3.
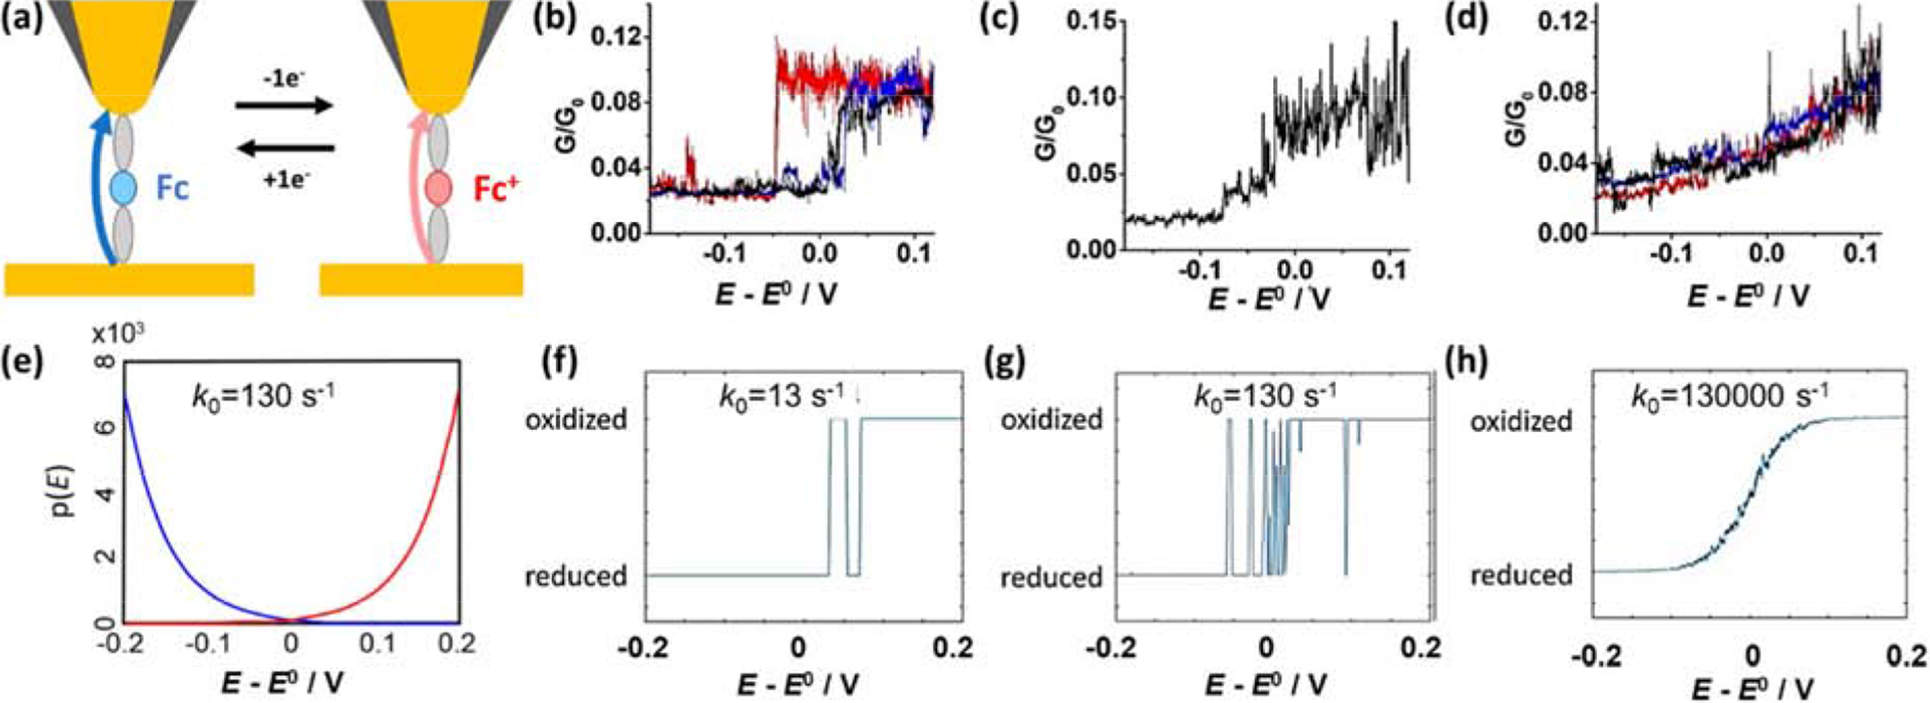
Single-molecule electrochemical STM break junction monitoring the redox state of a ferrocene (Fc) linked between a Au tip and Au substrate. (a) Schematic of experiment. (b-d). Conductance during electrochemical potential sweep differentiates Fc/Fc+ (=0.03/0.09 G/G0, respectively). Individual molecules (single traces) exhibit different switching behaviors. (e) Probability of oxidation (red) and reduction (blue) as a function of overpotential. (f-h) Simulated transitions between O and R at different k0. Reproduced with modification from Li et al.[40]
The experimental conductance traces of single molecules (Figure 3b–d) indicate a diverse range of responses as the electrochemical potential is swept positively. A step increase in conductance (Fig. 3b) indicates the oxidation of Fc to Fc+, which occurs at a range of potentials near E0. The trials in Figure 3c&d shows single molecules alternating between oxidized and reduced states around E0. While at any one time a single molecule is either oxidized or reduced, intermediate conductance levels are observed when redox switching is faster than the instrumental response time.
The potential-dependent probability for oxidation/reduction of a single Fc/Fc+ is described by Butler-Volmer kinetics (Figure 3e). From these probabilities, sequences alternating between the oxidation states vs. potential were simulated for different standard rate constants, k0. To facilitate comparison with experiment, simulations also incorporated the finite instrumental response time.
The comparison (Figure 3b–d vs. f–h) suggests that junctions formed by different Fc molecules possess different k0. The frequency of the redox transitions increases with k0. At sufficiently high rates, both oxidation and reduction are possible near E0, suggesting k0 and E0 of single molecules could be characterized by measuring the probabilities of oxidation and reduction at a suitable potential. At the highest k0 (130,000 cm/s), the transitions occur so rapidly that the instrumental response returns the average fraction of time a molecule spends in each state. While Figure 3h has the appearance of a steady-state Faradaic voltammogram, the two should not be confused, as the voltammograms reports the rate of change of oxidation state.
Reports from Van Duyne and co-workers describe using EC-TERS (electrochemical tip enhanced Raman spectroscopy) to monitor stochastic redox transitions of single Nile blue molecules.[41, 42] They also observed a distribution of oxidation and reduction potentials, indicating the stochasticity in single-molecule redox behavior. Hysteresis between the potentials where oxidation and reduction occurred on forward and backward voltammetric scans was predicted by probabilistic modelling and observed in experiments. Sources of variability, including the effect of the substrate binding on E0, were discussed.
4. Monitoring Molecular Motion Through Ion Conductivity
The ion current through a nanopore responds to molecules residing in and passing through it and can be used to quantify and classify single molecules.[45, 46] In recent experiments (Figure 4a) the motion of a mismatched based pair in double-stranded DNA was quantified using the ion conductance of an α-hemolysin nanopore.[44, 47, 48] Enhanced electrophoretic forces on a single-stranded DNA tail can trap the molecule for hours, holding a cytosine:cytosine mismatch at the narrow ‘latch zone’ of the pore. Spontaneous flipping of bases between intra- and extra-helical states, modulates the ion conductance between current levels i2 and i1, respectively (Fig. 4c).
Figure 4.

Measuring the kinetics of base flipping and protonation in a single DNA molecule through ion conductance measurements. (a) Schematic of a single DNA molecule (blue) with a C:C base pair mismatch (red) captured in α-hemolysin (α-HL). (b) Hidden Markov model (HMM) for the protonation/deprotonation and base flipping of a C:C mismatch. (c) Experimental i-t traces at different pHs show switching between two current levels. (d) Simulated i-t traces using the HMM. (e) log-histogram of duration of intra-helical (red) vs extra-helical (blue) states at pH 7.5 (bars are experiments; lines are simulations). Reprinted adapted with permission from reference [44]. Copyright 2018 American Chemical Society.
Base flipping, like nanobubble nucleation (Section 2), is an activated process, with a distribution of lifetimes (tintra and textra) observed for each state. However, as base-flipping reactions are spontaneous and reversible, passively monitoring a single molecule suffices to characterize the lifetimes of states.
Protonation of a cytosine introduces a second hydrogen bond, stabilizing the intra-helical state, resulting in longer intra-helical durations with decreasing pH, while extra-helical lifetimes remain unchanged (Figure 4c). The 4-state reaction pathway (protonated/deprotonated × intra-/extra-helical; Figure 4b) manifests as only two current states (intra-/extra- helical), indicated by the dashed boxes. However, the kinetics of all reactions, including those between ‘hidden states’, are accessible through careful analysis of lifetimes using hidden Markov modelling.[44] Initially, a sequence of four states is calculated from the kinetic model. These are then converted to two current levels, ‘hiding’ the protonation state (Figure 4d). Experimental lifetimes (bars; Figure 4e) are compared with those from simulations, with the best-fit kinetics showing excellent agreement (solid lines), which suggests the pronation occurs primarily while the cytosine is intrahelical, a mechanism that is hidden in the bulk measurement.
Pairs of lifetimes offer additional resolving power vs. pA current differences, which along with the high sensitivity of base-flipping kinetics to molecular structure, have allowed rapid discrimination of minor molecular differences.[49] Measurements in which temperature was swept were used to derive single-molecule thermodynamic (ΔH, ΔS) and kinetic (EA) parameters for cytosine:cytosine base flipping.[50]
Conclusions
We presented exemplar single-entity electrochemical systems displaying stochastic behavior, for which statistical and probabilistic consideration was necessary for interpretation. We highlighted strategies for characterizing stochasticity in transport and activated processes and for coping with unavoidable randomness when measuring deterministic processes at the single-entity level.
The frequent emergence of stochasticity from determinism when measurements are reduced from an ensemble-average to one or few entities, suggest that the approaches presented can find widespread use in single-entity electrochemistry. Readers encountering stochasticity in single-entity electrochemical measurements are encouraged to consider the opportunities offered by applying statistical techniques, as highlighted above, or borrowing from the mature fields of single-molecule measurements using optical and ion channel methods.[51, 52]
Highlights.
Electrochemical processes show randomness when the analyte number approaches unity.
Probabilistic models allow interpretation of randomness.
Single-entity measurements reveal phenomena hidden in ensemble averaging
Acknowledgments
ME thanks the support of start-up funding at the University of Arkansas. HR thanks the University of Miami, OH for start-up funding and acknowledges the support of the Donors of the American Chemical Society Petroleum Research Fund (PRF# 61155-DNI5) for partial support of this research. Studies reported in this work were performed at the University of Utah under the support of the Office of Naval Research (N00014-19-1-2331), the Air Force Office of Scientific Research (FA9550-14-1-0003), the National Institutes of Health (R01 GM093099)
Footnotes
Publisher's Disclaimer: This is a PDF file of an unedited manuscript that has been accepted for publication. As a service to our customers we are providing this early version of the manuscript. The manuscript will undergo copyediting, typesetting, and review of the resulting proof before it is published in its final form. Please note that during the production process errors may be discovered which could affect the content, and all legal disclaimers that apply to the journal pertain.
Declaration of interests
The authors declare that they have no known competing financial interests or personal relationships that could have appeared to influence the work reported in this paper.
References
- [1].Moazzenzade T, Huskens J, Lemay SG. Stochastic electrochemistry at ultralow concentrations: the case for digital sensors. Analyst 2020; 145:750–758. [DOI] [PubMed] [Google Scholar]
- [2].Edwards MA, Robinson DA, Ren H et al. Nanoscale electrochemical kinetics & dynamics: the challenges and opportunities of single-entity measurements. Faraday Discuss. 2018; 210:9–28. [DOI] [PMC free article] [PubMed] [Google Scholar]
- [3].Oja SM, Fan Y, Armstrong CM et al. Nanoscale Electrochemistry Revisited. Anal Chem 2016; 88:414–430. [DOI] [PubMed] [Google Scholar]
- [4].Bentley CL, Kang M, Unwin PR. Nanoscale Surface Structure-Activity in Electrochemistry and Electrocatalysis. J Am Chem Soc 2019; 141:2179–2193. [DOI] [PubMed] [Google Scholar]
- *[5].Baker LA. Perspective and Prospectus on Single-Entity Electrochemistry. J Am Chem Soc 2018; 140:15549–15559, [DOI] [PMC free article] [PubMed] [Google Scholar]; Perspective on single-entity electrochemistry assessing the possibilites and challenges.
- [6].Ying Y-L, Wang J, Leach AR et al. Single-Entity Electrochemistry at Confined Sensing Interfaces. SCIENCE CHINA Chemistry 2020. [Google Scholar]
- [7].Wang Y, Shan X, Tao N. Emerging tools for studying single entity electrochemistry. Faraday Discuss 2016; 193:9–39. [DOI] [PubMed] [Google Scholar]
- [8].Gao R, Edwards MA, Harris JM, White HS. Shot noise sets the limit of quantification in electrochemical measurements. Current Opinions of Electrochemistry 2020. [Google Scholar]
- *[9].Singh PS, Lemay SG. Stochastic Processes in Electrochemistry. Anal Chem 2016; 88:5017–5027, [DOI] [PubMed] [Google Scholar]; Accessible introduction to stochasticity in electrochemical systems
- [10].Einstein A Theoretical remarks on the Brownian motion. Zeitschrift für Elektrochemie und Angewandte Physikalische Chemie 1907; 13:41–42. [Google Scholar]
- *[11].Berg HC. Random walks in biology Princeton University Press; 1993. Approachable text introducing the physics and mathematics of random walks [Google Scholar]
- [12].Patrice FT, Qiu K, Ying YL, Long YT. Single Nanoparticle Electrochemistry. Annu Rev Anal Chem (Palo Alto Calif) 2019; 12:347–370. [DOI] [PubMed] [Google Scholar]
- [13].Zhou H, Park JH, Fan FR, Bard AJ. Observation of single metal nanoparticle collisions by open circuit (mixed) potential changes at an ultramicroelectrode. J Am Chem Soc 2012; 134:13212–13215. [DOI] [PubMed] [Google Scholar]
- [14].Quinn BM, Van ‘t Hof PG, Lemay SG. Time-resolved electrochemical detection of discrete adsorption events. J Am Chem Soc 2004; 126:8360–8361. [DOI] [PubMed] [Google Scholar]
- [15].Zhou YG, Rees NV, Compton RG. The electrochemical detection and characterization of silver nanoparticles in aqueous solution. Angew Chem Int Ed Engl 2011; 50:4219–4221. [DOI] [PubMed] [Google Scholar]
- [16].Oja SM, Robinson DA, Vitti NJ et al. Observation of Multipeak Collision Behavior during the Electro-Oxidation of Single Ag Nanoparticles. J Am Chem Soc 2017; 139:708–718. [DOI] [PubMed] [Google Scholar]
- *[17].Robinson DA, Liu Y, Edwards MA et al. Collision Dynamics during the Electrooxidation of Individual Silver Nanoparticles. J Am Chem Soc 2017; 139:16923–16931, [DOI] [PubMed] [Google Scholar]; Interpretations of single particle collision experiments using a random walk model
- [18].Ustarroz J, Kang M, Bullions E, Unwin PR. Impact and oxidation of single silver nanoparticles at electrode surfaces: one shot. Chem Sci 2017; 8:1841–1853. [DOI] [PMC free article] [PubMed] [Google Scholar]
- [19].Ma W, Ma H, Chen JF et al. Tracking motion trajectories of individual nanoparticles using time-resolved current traces. Chem Sci 2017; 8:1854–1861. [DOI] [PMC free article] [PubMed] [Google Scholar]
- [20].Xiao X, Bard AJ. Observing single nanoparticle collisions at an ultramicroelectrode by electrocatalytic amplification. J Am Chem Soc 2007; 129:9610–9612. [DOI] [PubMed] [Google Scholar]
- [21].Defnet PA, Anderson TJ, Zhang B. Stochastic collision electrochemistry of single silver nanoparticles. Current Opinions in Electrochemistry 2020. [Google Scholar]
- [22].Robinson DA, Edwards MA, Ren H, White HS. Effects of Instrumental Filters on Electrochemical Measurement of Single-Nanoparticle Collision Dynamics. ChemElectroChem 2018; 5:3059–3067. [Google Scholar]
- [23].Robinson DA, Edwards MA, Liu Y et al. Effect of Viscosity on the Collision Dynamics and Oxidation of Individual Ag Nanoparticles. J. Phys. Chem. C 2020. [Google Scholar]
- [24].Zhang F, Edwards MA, Hao R et al. Collision and Oxidation of Silver Nanoparticles on a Gold Nanoband Electrode. Journal of Physical Chemistry B 2017; 121:23564–23573. [Google Scholar]
- *[25].Zhou M, Dick JE, Bard AJ. Electrodeposition of Isolated Platinum Atoms and Clusters on Bismuth-Characterization and Electrocatalysis. J Am Chem Soc 2017; 139:17677–17682, [DOI] [PubMed] [Google Scholar]; Determination of the electrochemical behavior of single and few atom clusters in a non-deterministic experiment.
- [26].Zhou M, Bao S, Bard AJ. Probing Size and Substrate Effects on the Hydrogen Evolution Reaction by Single Isolated Pt Atoms, Atomic Clusters, and Nanoparticles. J Am Chem Soc 2019; 141:7327–7332. [DOI] [PubMed] [Google Scholar]
- [27].Fan FR, Bard AJ. Electrochemical detection of single molecules. Science 1995; 267:871–874. [DOI] [PubMed] [Google Scholar]
- [28].Sun P, Mirkin MV. Electrochemistry of individual molecules in zeptoliter volumes. J Am Chem Soc 2008; 130:8241–8250. [DOI] [PubMed] [Google Scholar]
- [29].Kang S, Nieuwenhuis AF, Mathwig K et al. Electrochemical single-molecule detection in aqueous solution using self-aligned nanogap transducers. ACS Nano 2013; 7:10931–10937. [DOI] [PubMed] [Google Scholar]
- [30].Feldberg SW, Edwards MA. Current response for a single redox moiety trapped in a closed generator-collector system: the role of capacitive coupling. Anal Chem 2015; 87:3778–3783. [DOI] [PubMed] [Google Scholar]
- [31].Kang S, Nieuwenhuis AF, Mathwig K et al. Single-molecule electrochemistry in nanochannels: probing the time of first passage. Faraday Discuss 2016; 193:41–50. [DOI] [PubMed] [Google Scholar]
- [32].Fan F-RF, Kwak J, Bard AJ. Single Molecule Electrochemistry. Journal of the American Chemical Society 1996; 118:9669–9675. [Google Scholar]
- [33].Luo L, White HS. Electrogeneration of Single Nanobubbles at Sub-50-nm-Radius Platinum Nanodisk Electrodes. Langmuir 2013; 29:11169–11175. [DOI] [PubMed] [Google Scholar]
- [34].Velmurugan J, Noel J-M, Nogala W, Mirkin MV. Nucleation and Growth of Metal on Nanoelectrodes. Chemical Science 2012; 3:3307–3314. [Google Scholar]
- [35].Blount B, Kilner K, Hu H et al. Electrochemically Induced Nucleation of Nanoscopic Ionic Solid. Journal of Physical Chemistry C 2020:ASAP. [Google Scholar]
- *[36].German SR, Edwards MA, Ren H, White HS. Critical Nuclei Size, Rate, and Activation Energy of H2 Gas Nucleation. J. Am. Chem. Soc 2018; 140:4047–4053, [DOI] [PubMed] [Google Scholar]; Quantifying the nucleation of single bubbles through repeated characterization of this stochastic process.
- [37].Moreno Soto Á, German SR, Ren H et al. The Nucleation Rate of Single O2 Nanobubbles at Pt Nanoelectrodes. Langmuir 2018; 34:7309–7318. [DOI] [PMC free article] [PubMed] [Google Scholar]
- [38].Edwards MA, White HS, Ren H. Voltammetric Determination of the Stochastic Formation Rate and Geometry of Individual H2, N2, and O2 Bubble Nuclei. ACS Nano 2019; 13:6330–6340. [DOI] [PubMed] [Google Scholar]
- [39].Perez Sirkin YA, Gadea ED, Scherlis DA, Molinero V. Mechanisms of Nucleation and Stationary States of Electrochemically Generated Nanobubbles. J Am Chem Soc 2019; 141:10801–10811. [DOI] [PubMed] [Google Scholar]
- *[40].Li Y, Wang H, Wang Z et al. Transition from stochastic events to deterministic ensemble average in electron transfer reactions revealed by single-molecule conductance measurement. Proc. Natl. Acad. Sci. U.S.A 2019; 116:3407–3412, [DOI] [PMC free article] [PubMed] [Google Scholar]; Monitoring single redox processes through molecular conductivity. Interpretation through a probabalistic model.
- [41].Kurouski D, Mattei M, Van Duyne RP. Probing Redox Reactions at the Nanoscale with Electrochemical Tip-Enhanced Raman Spectroscopy. Nano Lett 2015; 15:7956–7962. [DOI] [PubMed] [Google Scholar]
- *[42].Mattei M, Kang G, Goubert G et al. Tip-Enhanced Raman Voltammetry: Coverage Dependence and Quantitative Modeling. Nano Lett 2017; 17:590–596, [DOI] [PubMed] [Google Scholar]; Tip enhanced Raman spectroscopy is used to monitor redox transitions in single molecules. A probabistic model is introduced to interpret these stochastic processes.
- [43].Hromadová M, Vavrek F. Electrochemical electron transfer and its relation to charge transport in single molecule junctions. Curr. Opin. Electrochem 2020; 19:63–70. [Google Scholar]
- *[44].Ren H, Cheyne CG, Fleming AM et al. Single-Molecule Titration in a Protein Nanoreactor Reveals the Protonation/Deprotonation Mechanism of a C:C Mismatch in DNA. J. Am. Chem. Soc 2018; 140:5153–5160, [DOI] [PMC free article] [PubMed] [Google Scholar]; Determination of the the kinetics of a reaction pathway at the single molecule level using ion channel conductivity to probe molecular configuration. A hidden state modelling strategy is used to interpret reactions, including those that do not result in a change in the experimental measurement.
- [45].Deamer D, Akeson M, Branton D. Three decades of nanopore sequencing. Nat. Biotechnol 2016; 34:518–524. [DOI] [PMC free article] [PubMed] [Google Scholar]
- [46].Shi W, Friedman AK, Baker LA. Nanopore Sensing. Anal. Chem 2017; 89:157–188. [DOI] [PMC free article] [PubMed] [Google Scholar]
- [47].Jin Q, Fleming AM, Johnson RP et al. Base-excision repair activity of uracil-DNA glycosylase monitored using the latch zone of α-hemolysin. J Am Chem Soc 2013; 135:19347–19353. [DOI] [PMC free article] [PubMed] [Google Scholar]
- [48].Johnson RP, Fleming AM, Beuth LR et al. Base Flipping within the α-Hemolysin Latch Allows Single-Molecule Identification of Mismatches in DNA. J. Am. Chem. Soc 2016; 138:594–603. [DOI] [PMC free article] [PubMed] [Google Scholar]
- [49].Johnson RP, Fleming AM, Perera RT et al. Dynamics of a DNA Mismatch Site Held in Confinement Discriminate Epigenetic Modifications of Cytosine. J Am Chem Soc 2017; 139:2750–2756. [DOI] [PMC free article] [PubMed] [Google Scholar]
- [50].Johnson RP, Perera RT, Fleming AM et al. Energetics of base flipping at a DNA mismatch site confined at the latch constriction of α-hemolysin. Faraday Discuss 2016; 193:471–485. [DOI] [PMC free article] [PubMed] [Google Scholar]
- [51].Neher E, Sakmann B. Single-channel recording. Plenum Press; 1995. [Google Scholar]
- [52].Qian H, Kou SC. Statistics and Related Topics in Single-Molecule Biophysics. Annu Rev Stat Appl 2014; 1:465–492. [DOI] [PMC free article] [PubMed] [Google Scholar]