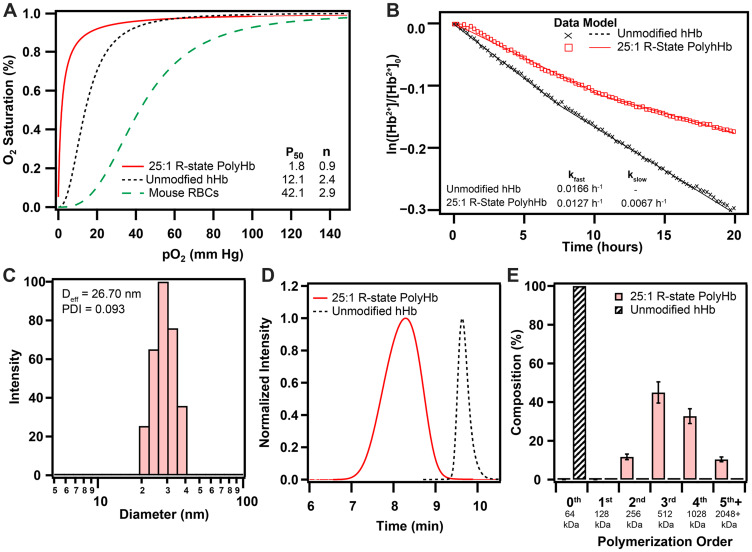
Figure 1. Biophysical properties of 25:1 R-state PolyHb used for this study.
(A) O2 equilibrium curves for 25:1 R-state PolyHb, hHb, and mouse RBCs. (B) Auto-oxidation kinetics of hHb and 25:1 R-state PolyHb (1.25 g/dL). (C) Intensity distributions of hydrodynamic diameter of 25:1 R-State PolyHb. (D) Normalized SEC-HPLC intensity distributions of R-state PolyHb compared to unmodified hHb. (E) Polymer order distribution for 25:1 R-State PolyHbs. Polymer distribution was calculated on a percent by heme basis via analysis of the 413 nm absorbance wavelength. The corresponding approximate sizes of the polymer orders are shown below each group.

