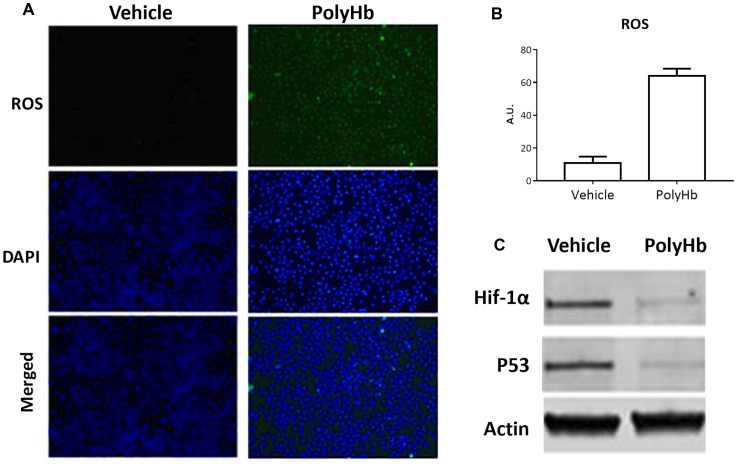
Figure 2. Effects of 0.05 g/dL PolyHb on ROS levels in A549 cells after 24 hours.
(A) ROS (DCFH-DA) and DAPI stain are shown for PolyHb and a vehicle control. (B) ROS (DCFH-DA) fluorescent intensity of digested A549 cells after 24 hour exposure to PolyHb and a vehicle control. (C) Effects of PolyHb and a vehicle control on expression of HIF-1α, p53, and actin, as assessed by western blot.

