Abstract
The existence of temperature optima in enzyme catalysis that occur before protein melting sets in can be described by different types of kinetic models. Such optima cause distinctly curved Arrhenius plots and have, for example, been observed in several cold-adapted enzymes from psychrophilic species. The two main explanations proposed for this behavior either invoke conformational equilibria with inactive substrate-bound states or postulate differences in heat capacity between the reactant and transition states. Herein, we analyze the implications of the different types of kinetic models in terms of apparent activation enthalpies, entropies, and heat capacities, using the catalytic reaction of a cold-adapted α-amylase as a prototypic example. We show that the behavior of these thermodynamic activation parameters is fundamentally different between equilibrium and heat capacity models, and in the α-amylase case, computer simulations have shown the former model to be correct. A few other enzyme-catalyzed reactions are also discussed in this context.
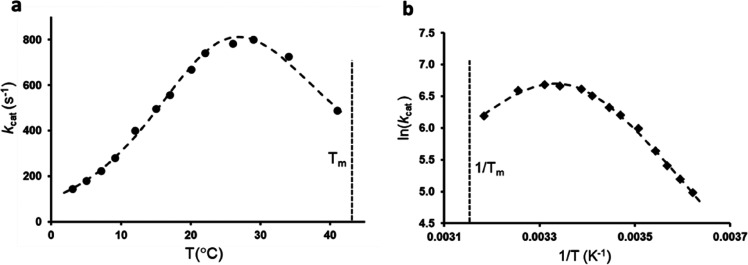
There has recently been renewed interest in the fact that some enzymes show an anomalous temperature dependence of their catalytic rate constant (kcat). This is generally manifested by nonlinear Arrhenius plots and, in some cases, by a distinct rate maximum at some particular temperature. That enzymes should have a rate optimum is, of course, trivial as long as that optimum reflects the eventual unfolding of the protein at higher temperatures. However, there are a number of examples in which the catalytic rate peaks at a temperature significantly lower than the independently measured melting temperature Tm, in which case the Arrhenius plot becomes strongly curved in the regime where the enzyme remains folded (Figure 1). In particular, this seems to be case for some (but certainly not all) cold-adapted enzymes from psychrophilic species that thrive at temperatures near the freezing point of liquid water.1−3 In contrast, for mesophilic and thermophilic enzymes, one usually finds that the rate maximum more or less coincides with the onset of protein melting, thus reflecting a trivial optimum.
Figure 1.
Anomalous behavior of the catalytic rate vs temperature for the psychrophilic α-amylase AHA illustrated by (a) the rate optimum lying ∼15 °C below the melting temperature (Tm) and (b) the corresponding Arrhenius plot being strongly curved. Data were taken from ref (6).
For cold-adapted enzymes in general, the melting temperature is shifted toward values lower than those of their mesophilic counterparts, typically by 5–20 °C.1−3 This is presumably the result of random genetic drift because the evolutionary pressure on protein stability must have diminished considerably at their low physiological temperatures.3 Moreover, as noted above, in some cases the rate optimum has moved toward even lower temperatures than Tm and this is the key problem we address here. It should, however, be pointed out that the rate optimum Topt for cold-adapted enzymes generally lies in the range of 25–45 °C, and Tm possibly in a slightly higher range, which emphasizes the point that the (physiological) working temperature of these enzymes is far from the optimum and the onset of melting. From an evolutionary perspective, it is thus not a problem that both Tm and Topt have drifted downward because what matters is the catalytic rate at the working temperature (typically 0–10 °C). Here the situation is different from that of mesophilic and thermophilic enzymes, which generally work much closer to their optima and will consequently experience a higher evolutionary pressure on protein stability, presumably involving a trade-off between rate and stability. Another seemingly universal rule is that cold-adapted enzymes have shifted the thermodynamic activation parameters of the catalyzed reaction so that the activation enthalpy (ΔH⧧) is decreased, while the activation entropy penalty is increased (ΔS⧧ is more negative).2,4
In addressing the origin of anomalous enzyme temperature optima, we will use here the catalytic reaction of α-amylase from the Antarctic bacterium Pseudoalteromonas haloplanktis (AHA) as a typical example. This enzyme has been extensively studied experimentally by Gerday, Feller, and co-workers,1,5,6 and we have recently shown that molecular dynamics (MD)-based empirical valence bond (EVB) simulations do indeed capture the experimental temperature optimum at ∼28 °C for this enzyme.7 The melting temperature of the free enzyme is 44 °C, which is considerably higher than Topt and ∼10 °C lower than the Tm for the orthologous mesophilic porcine pancreatic enzyme (PPA).5 The rate-limiting glycosylation step in AHA yields a covalent enzyme–substrate intermediate, via a mechanism common to many of the glucosidases.7−10 It involves nucleophilic attack of the Asp174 carboxylate group on the anomeric carbon of α-1,4 saccharide linkages, concerted with leaving oxygen protonation by the carboxylic acid Glu200.
Herein, we analyze different kinetic models to account for the anomalous temperature dependence of enzyme catalytic rates, in general, and particularly for the psychrophilic α-amylase. In that case, computer simulations have revealed the protein structural changes that cause the rate optimum and the situation is best described by an equilibrium with an inactive enzyme–substrate complex. We show that several different solutions of such a model yield identical rate curves, and we analyze these in terms of apparent activation enthalpies, entropies, and heat capacities. It is further shown that a recently proposed model, which postulates a significant heat capacity change associated with a single rate-limiting chemical reaction step,11,12 yields a very similar temperature dependence but fundamentally different behavior of the thermodynamic activation parameters.
Methods
MD/EVB simulations13,14 of the rate-limiting glycosylation step in the psychrophilic (AHA) and mesophilic (PPA) α-amylases, at eight different temperatures, have been reported previously.7 Briefly, an uncatalyzed reference reaction free energy surface in water was first obtained using density functional theory (DFT) calculations on a cluster model encompassing the reacting fragments, with a continuum solvent model. MD/EVB free energy perturbation simulations of the same reference reaction in an 18 Å radius sphere of explicit water molecules were then carried out to calibrate the EVB free energy profile against the DFT results.7 This calibrated EVB potential was then used in the simulations of the two enzyme reactions. These were carried out with a 45 Å radius spherical droplet encapsulating the entire protein. Free energy profiles for the two enzyme-catalyzed reactions were calculated at eight different temperatures, with ∼300 independent replicas for each enzyme at each temperature. The resulting activation free energies were used to construct computational Arrhenius plots15 to extract activation enthalpies and entropies.
Additional simulations of PPA in the reactant state at 323 and 333 K were carried out here using the same protocol as described previously.7 These calculations utilized the 1.38 Å resolution crystal structure in complex with an acarbose inhibitor 1HX0(16) as the starting point, where the inhibitor was modified to represent a five-residue glucose oligomer, linked by α-1,4 glycosidic bonds. The enzyme–substrate complex was solvated with a 45 Å radius spherical water, and MD/EVB simulations were carried out with the Q program17,18 utilizing the OPLS-AA/M force field.19 Nonbonded interactions beyond a 10 Å cutoff were treated by a local reaction field multipole expansion method,20 except for the reacting groups for which all interactions were explicitly calculated, and a 1 fs MD time step was used. After initial heating and equilibration at the final temperature, probability distributions for the Asp300 Oδ2–substrate O2 distance were calculated from 15 ns of sampling at each temperature.
Fitting of calculated and experimental catalytic rates to kinetic models was done with Gnuplot (http://www.gnuplot.info), and experimental rate constants were extracted from published data using WebPlotDigitizer (https://automeris.io/WebPlotDigitizer/).
Theory and Results
The simple Michaelis–Menten scheme for the rate-limiting step with the quasi-steady state assumption is written as
| 1 |
where according to transition state theory the catalytic rate constant is given by
| 2 |
assuming a transmission factor of unity (this is, in fact, a standard assumption because there is no experimental or computational evidence for significant deviations from unity in enzyme reactions involving bond making and/or breaking between heavy atoms). Here, the activation free energy, enthalpy, and entropy for the elementary chemical step are denoted by ΔG2⧧, ΔH2, and ΔS2⧧, respectively. It is thus clear that this expression for kcat cannot account for any temperature optimum if ΔH2 and ΔS2⧧ are temperature-independent constants. Two fundamental ways to allow a more complex temperature dependence of kcat and account for the type of optima observed experimentally (Figure 1) have been considered. One is to invoke chemical equilibria between different states of the enzyme–substrate complex,7,21 and the other is to assume a constant non-zero difference in heat capacity (ΔCp) between ES and the transition state (TS) associated with k2 in eq 1.11,12 Both of these alternatives will effectively yield temperature-dependent values of the apparent activation enthalpy and entropy, as will be discussed below.
Equilibrium with Inactive States
The perhaps most intuitive way to introduce a more complex temperature dependence of kcat is to allow ES to interconvert with an inactive state, ES′, according to the scheme
 |
3 |
in which case the expression for kcat becomes
| 4 |
where the equilibrium constant Keq = k2/k–2. It should be noted here that if one instead would consider an inactivation equilibrium for only the free enzyme (E ⇌ E′), there is no change in kcat compared to eq 2, but kcat/KM is reduced by probability factor 1/(1 + Keq). The fit of the above dead-end model to our calculated kcat curve from MD/EVB simulations of the AHA-catalyzed reaction is shown Figure 2. The corresponding enthalpy and entropy values are listed in Table 1, where ΔHeq and ΔSeq denote those associated with the ES ⇌ ES′ equilibrium. The kinetic equation always has two solutions obtained by a change in sign for thermodynamic parameters of the equilibrium (ΔHeq′ = −ΔHeq, and ΔSeq = −ΔSeq), and the activation parameters are related by the equations ΔH3⧧′ = ΔH3 – ΔHeq and ΔS3⧧′ = ΔS3 – ΔSeq (Table 1). For α-amylase, the second solution, with a large negative activation enthalpy and a free energy barrier caused solely by a large entropy penalty, can be deemed unphysical because it agrees with neither experimental data for this type of reaction nor quantum mechanical calculations.5,7 Fitting the equilibrium model of eq 4 instead to the experimental data extracted from ref (6). also yields similar parameters (ΔHeq = 33.7 kcal/mol, ΔSeq = 0.11081 kcal/mol/K, ΔH3⧧ = 11.9 kcal/mol, and ΔS3 = −0.00482 kcal/mol/K), which illustrates the reasonably good agreement between the calculations and experiment. Here, the enzyme temperature optimum arises because the equilibrium shifts from the ES state to ES′ as the temperature is increased, with an equal population at ∼25 °C (first entry of Table 1). Thus, at higher temperatures, the system has to climb from ES′ back to ES and the positive free energy of this process, entirely caused by the entropy penalty, adds to the overall free energy barrier.
Figure 2.
Fit of the results from MD/EVB simulations7 of the AHA reaction at different temperatures (●) to (a) the two-state equilibrium model (eq 4) and (b) the one-state heat capacity model (eqs 8 and 9). (c) Difference between the two kinetic models that becomes visible only when comparing a wider temperature range.
Table 1. Parameters Obtained from Fitting the Equilibrium and Heat Capacity Models to the Calculated Rate for AHA at Different Temperatures7 (units of kilocalories per mole and kilocalories per mole per Kelvin).
| ΔHeq | ΔSeq | ΔH2⧧ | ΔS2⧧ | ΔH–2⧧ | ΔS–2⧧ | ΔH3⧧ | ΔS3⧧ | rlsa | |
|---|---|---|---|---|---|---|---|---|---|
| eq 3 | 32.0 | 0.10746 | – | – | – | – | 10.2 | –0.00925 | k3 |
| eq 3 | –32.0 | –0.10746 | – | – | – | – | –21.8 | –0.11671 | k3 |
| eq 5 | –32.0 | –0.10748 | –17.6 | –0.08459 | 14.4 | 0.02289 | 10.2 | –0.00924 | k3 |
| eq 5 | 32.0 | 0.10748 | –17.6 | –0.08459 | –49.6 | –0.19207 | –21.8 | –0.11672 | k3 |
| eq 5 | –27.8 | –0.07535 | –21.8 | –0.11672 | 6.0 | –0.04137 | 10.2 | –0.00924 | k3/k2 |
| eq 5 | 27.8 | 0.07535 | –21.8 | –0.11672 | –49.6 | –0.19207 | –17.6 | –0.08459 | k3/k2 |
| eq 5 | –4.2 | –0.03212 | 10.2 | –0.00924 | 14.4 | 0.02289 | –17.6 | –0.08459 | k2/k3 |
| eq 5 | 4.2 | 0.03212 | 10.2 | –0.00924 | 6.0 | –0.04137 | –21.8 | –0.11672 | k2/k3 |
Rate-limiting step at low/high temperatures.
Alternatively, one could consider the case in which the substrate binds to the ES′ state instead, in which case we get the linear reaction scheme
| 5 |
with interchanged k2 and k–2 arrows compared to eq 3. This yields
| 6 |
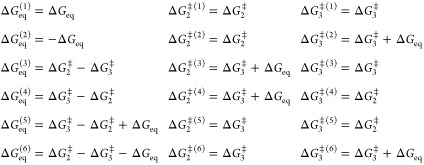
and we are then basically opening up for a change in the rate-limiting step. Due to the additive terms in the denominator, the corresponding equation for the activation free energies (and its components) becomes transcendental and one gets n! equivalent solutions for such rate expressions, where n is the number of terms in the denominator. Hence, in our case, there are six equivalent solutions that are related by
 |
7 |
where ΔGeq = −RT ln(k2/k–2), ΔG2⧧ and ΔG3 denote one particular solution, and the same equations also hold for the corresponding enthalpies and entropies.
The parameters for these six solutions that reproduce the theoretical curve (eq 4) in Figure 2a are also listed in Table 1. One can see that the first case is kinetically equivalent to that of the first solution for the scheme in eq 3. That is, the second step will always be rate-limiting and its activation parameters are identical to those of the dead-end scheme, as are the equilibrium enthalpy and entropy apart from the sign change due to the reverse definition of Keq. The same goes for the second solution of eq 5, which is equivalent to the second solution of eq 3. The four remaining solutions of eq 5 correspond to a change in the rate-limiting step when the temperature is increased, and among these solutions, solution 5 has the forward activation parameters simply interchanged for the two steps, which yields a much less temperature dependent ES′ ⇌ ES equilibrium. In that case, the first step is rate-limiting at low temperatures while the second barrier becomes the highest above 25 °C. However, as noted above, the concept of negative activation enthalpies is obviously somewhat strange when considering an elementary chemical step. However, if the chemical conversion of S to P instead occurs in the first step (ES′ ⇌ EP), the second step would correspond to product release, which could perhaps conceivably have a TS completely dictated by an unfavorable entropy and a negative enthalpy. This type of scenario is, however, not applicable to the glycosylation step of α-amylases, or similar glucosidases, where the rate-limiting step yields a covalent enzyme–substrate intermediate.7−10 It can also be noted that solution 3 of eq 5 has the same values of ΔH3⧧ and ΔS3 as the dead-end scheme but slightly shifted absolute values of the equilibrium parameters. This is enough to shift the rate-limiting step from k3 to k2 when the temperature is increased but produces exactly the same overall curve for kcat. It may also be worth mentioning here that the addition of an extra (irreversible) path from ES′ to E + P in eq 3, thus effectively combining eqs 3 and 5, does not yield any solution with significant flow through both branches leading to products.
Heat Capacity Model
An alternative explanation for an anomalous temperature dependence of the simple scheme in eq 1 does not invoke any additional conformational states in equilibrium with ES. Instead, a temperature optimum for kcat in eq 2 is attained by postulating a constant non-zero difference in heat capacity between ES and the following TS associated with k2. That is, for the elementary chemical step, one assumes that the transition state has a more negative heat capacity than the reactant state (ES) so that ΔCp⧧ < 0.11,12 This would yield temperature-dependent expressions for both activation enthalpies and entropies according to
| 8 |
| 9 |
where the subscript 0 denotes ΔH⧧ and ΔS⧧ values at an arbitrary reference temperature T0. Here, it is the fact that ΔCp⧧ is negative that ensures the convex nature of the rate curve. The fit of this ΔCp model to our calculated MD/EVB rate curve for the psychrophilic α-amylase is shown in Figure 2b and can be seen to be basically indistinguishable from that of eq 4 within the examined temperature range (parameters listed in Table 1). It is only if we look at a wider temperature range that we can observe a difference between heat capacity and equilibrium models, but that would involve freezing and protein denaturation temperatures (Figure 2c).
Are the Two Models Equivalent?
On the basis of the analysis presented above, one might draw the conclusion that the two kinetic models are equivalent because they yield essentially the same rate curves in the relevant temperature region. However, it turns out that they make very different predictions for the behavior of the effective or apparent activation enthalpy, entropy, and heat capacity as a function of temperature. The equilibrium model (eq 3) yields an apparent activation free energy of
| 10 |
where the enthalpy and entropy contributions cannot strictly be disentangled analytically because the equation is transcendental. However, approximate first-order solutions are obviously
| 11 |
and
| 12 |
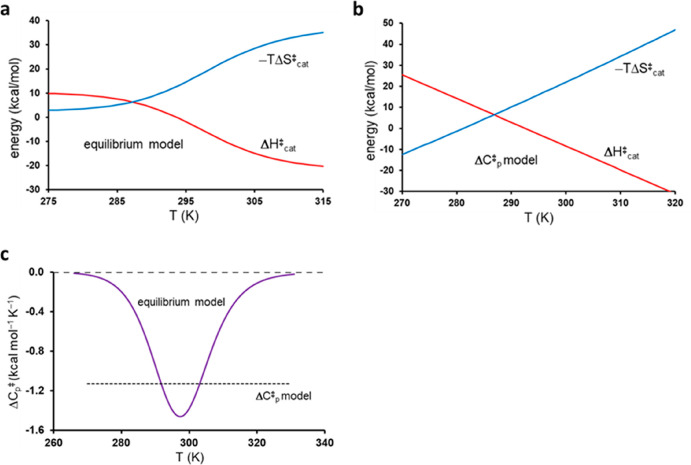
where the term Keq/(1 + Keq) = P(ES′) in the two equations corresponds to the fractional population of ES′, for which −ΔHeq and −ΔSeq will sum to the activation parameters of the chemical step. The temperature dependence of the apparent activation enthalpy and entropy for this model is shown in Figure 3a, using the parameters from the first entry in Table 1. It is evident from eqs 11 and 12 that ΔHcat⧧ and ΔScat reach limiting values of ΔHcat⧧ = ΔH3 and ΔScat⧧ = ΔS3 at low temperatures and ΔHcat⧧ = ΔH3 – ΔHeq and ΔScat⧧ = ΔS3 – ΔSeq at high temperatures. This thus reflects that the ground state shifts from ES to ES′ as the temperature is increased. It can be noted here that a similar behavior of the activation parameters was obtained for a thermophilic alcohol dehydrogenase in ref (22). From the derivative of eq 11 with respect to temperature, we also obtain the apparent heat capacity difference between transition and ground states as
| 13 |
where it is important to note that ΔCp⧧ becomes temperature-dependent, in contrast to the assumption of eqs 8 and 9, where it is a constant. It is further interesting to note that eq 13 is exact, although the expression for ΔHcat is an approximation. That is, eq 13 is identical to the exact expression obtained from eq 10, ΔCp⧧(T) = −T[∂2ΔGcat(T)/∂T2].
Figure 3.
Plots of the different behavior of activation enthalpy and entropy for the (a) equilibrium and (b) heat capacity models as a function of temperature, utilizing the fitted functions in Figure 2. (c) Predicted activation heat capacity as a function of temperature for the two models.
The heat capacity difference in the equilibrium model is thus zero at low and high temperatures but dips in the region around 25 °C where the population shift from ES to ES′ occurs (Figure 3c). Because the TS is taken as the reference here, this reflects a peak in the Cp for the ground state when two reactant substates become thermally available. This behavior is thus similar to that encountered in protein folding, where ΔCp peaks as the unfolded state starts to become populated, the difference being that in protein folding there is a remaining constant positive ΔCp between the unfolded and folded states at high temperatures.23 Note, however, that in the equilibrium model of eq 3 the apparent ΔCp⧧ is not the cause of the anomalous temperature dependence, but just a consequence of the ES ⇌ ES′ equilibrium. Hence, the ΔCp for each of the two separate reactant states is zero, and it is only the shifting population between them that gives rise to the apparent non-zero quantity (Figure 3c).
The heat capacity model of eqs 8 and 9 predicts a fundamentally different behavior both of the thermodynamic activation parameters and of ΔCp⧧ itself, which is thus assumed to be a negative constant. It is the fact that ΔCp is taken as a constant over the whole temperature range that renders ΔH⧧(T) linear in temperature, high and positive at low T, and high and negative at high T, while the −TΔS⧧ term behaves in an opposite manner (Figure 3b). The physical origin of such a behavior appears to be rather obscure, and the fitted parameters in Table 1 would predict an enormous activation enthalpy (energy) (ΔH⧧) of 330 kcal/mol at 0 K. Conversely, already at 310 K (37 °C) the activation enthalpy would have reached a large negative ΔH⧧ value of −20 kcal/mol. How this behavior should be interpreted for a single elementary chemical step appears to be rather unclear.
The Equilibrium Model Is the Correct One for Psychrophilic α-Amylase
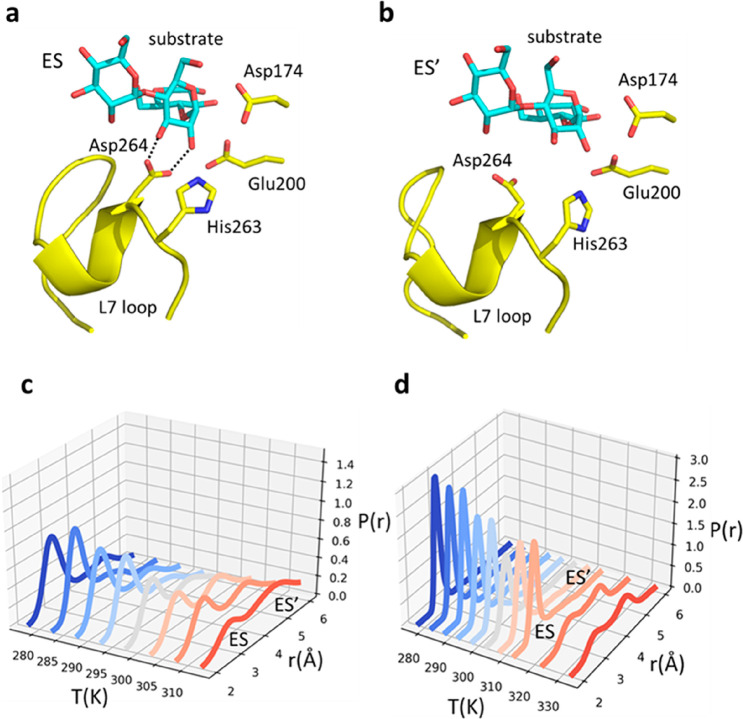
In case of the psychrophilic α-amylase AHA, our earlier computer simulations could unambiguously identify the equilibrium model as the correct one.7 That is, here the two reactant states ES and ES′ were found to correspond to different conformational states, differing primarily with respect to the presence of a key enzyme–substrate binding interaction between Asp264 and the 2-OH and 3-OH hydroxyl groups of the −1 position of the oligosaccharide substrate (Figure 4a,b). The temperature dependence of this ionic interaction was found to be such that it starts to break at around room temperature, thus predominantly populating a different reactant state at higher temperatures (Figure 4c). The mesophilic porcine ortholog PPA did not show this type of behavior in the examined temperature range (5–40 °C)7 and does not show a rate optimum occurring before Tm (∼54 °C).5
Figure 4.
Average MD structures of the (a) ES and (b) ES′ states in AHA, with the key interaction between Asp264 and the substrate hydroxyls present and absent, respectively. (c) Calculated probability density7 of the Asp264 Oδ2–substrate O2 distance as a function of temperature. (d) Calculated probability density for the same interaction (Asp300–substrate) in the mesophilic PPA ortholog, where it breaks at higher temperatures.
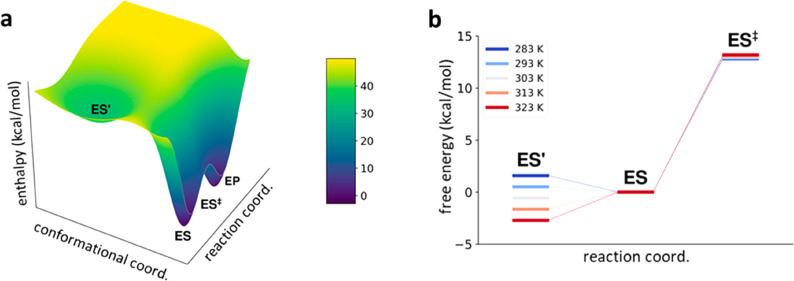
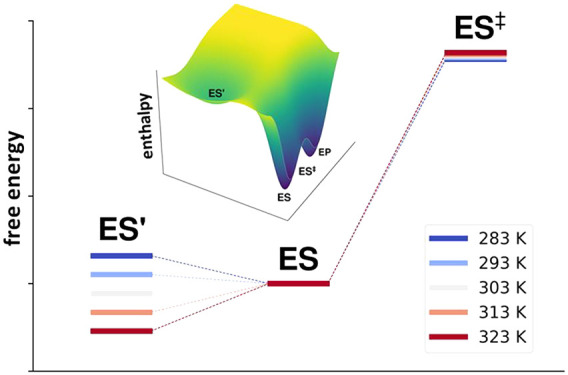
To examine whether the same type of structural transition may occur also in PPA near its temperature optimum of ∼54 °C, we carried out additional MD simulations here of the reactant state at 50 and 60 °C. These simulations clearly show that the ES′ state becomes significantly populated (Figure 4d) above 50 °C (323 K), which further supports a direct connection between the Asp–substrate interaction and the temperature optimum. Moreover, it was found earlier that the application of distance restraints to this interaction in the MD/EVB simulations of the AHA reaction completely abolished the temperature optimum seen for the unrestrained system and produced a straight instead of curved Arrhenius plot.7 It was also argued that the numerical values of ΔHeq and ΔSeq obtained from fitting to the calculated data (first entry of Table 1) agree well in terms of magnitude with the breaking of ionic hydrogen bonds. That is, the strong interaction enthalpy of around −30 kcal/mol in ES eventually (at ∼25 °C) becomes overtaken by the entropy gain associated with breaking the interaction and the entropy term becomes dominating at high temperatures. Hence, in the case of AHA, there is no doubt that an ES ⇌ ES′ equilibrium is involved and is responsible for the anomalous temperature optimum. The situation is illustrated in terms of the enthalpy and free energy diagrams in Figure 5.
Figure 5.
(a) Schematic enthalpy diagram for the AHA-catalyzed reaction using the values obtained from fitting to the equilibrium model of eq 3. (b) Corresponding free energy diagram in the temperature range between 283 K (blue) and 323 K (red), where it can be seen that the lowest-energy reactant state shifts from ES to ES′ around room temperature.
What about Strange Temperature Optima in Other Enzymes?
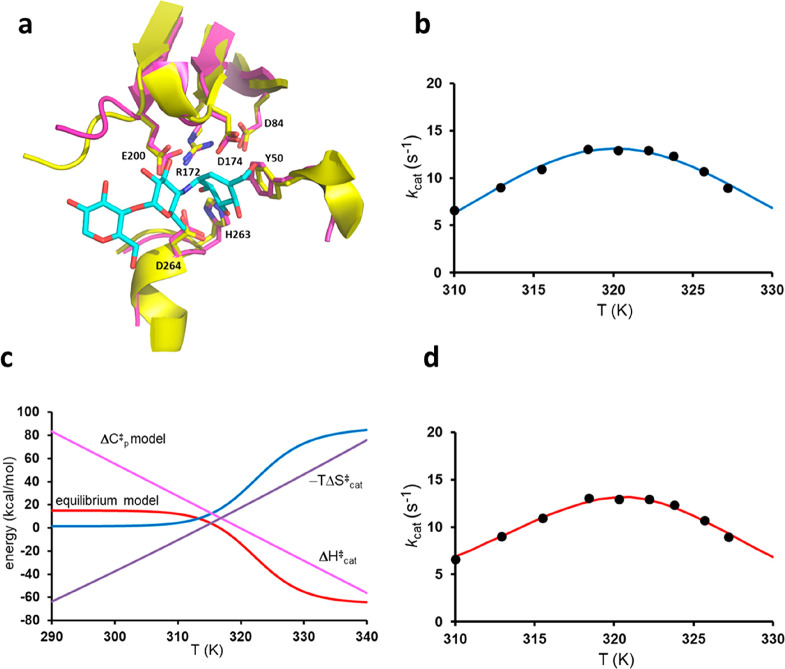
One of the prime examples that has been invoked in support of the heat capacity model is the MalL enzyme from Bacillus subtilis, which is also an α-glucosidase that catalyzes the breakdown of various maltose substrates.11,12 MalL thus also cleaves α-1,4 glycosidic bonds and has an active site that is very similar to AHA (Figure 6a). It is a mesophilic enzyme with a reported temperature optimum for kcat at 49 °C.11 Its melting temperature from DSC measurements is around 48 °C, but because the unfolding rate is several orders of magnitude slower than kcat, the latter can be measured above Tm by fast kinetics.11 Early biochemical characterization of the enzyme similarly showed an optimal reaction temperature of 42 °C, whereafter a rapid decay of activity was observed after incubation for several minutes.24 Hence, the temperature optimum for MalL is rather similar to that observed for the mesophilic α-amylase PPA.5
Figure 6.
(a) Overlay of the crystal structures of the active sites of MalL (Protein Data Bank entry 4M56, purple carbons)11 and AHA (Protein Data Bank entry 1G94, yellow carbons),27 with substrate conformation (cyan carbons) taken from the latter structure. (b and d) Fits of the experimentally measured rate values at different temperatures to the heat capacity model and the equilibrium model, respectively. (c) Predicted behavior of the apparent activation enthalpy and entropy terms for the two models (red and blue, equilibrium model; pink and purple, heat capacity model).
The rate curve extracted for MalL with the chromogenic PNPG substrate12 is shown in Figure 6b together with the fit to the heat capacity model. The relatively low kcat values here compared to those of the α-amylases6 reflect the fact that PNPG is 20–100 times slower as a substrate than native disaccharides, such as maltose and sucrose.25 The fit yields a very large negative ΔCp⧧ value of −2.79 kcal mol–1 K–1, which is basically identical to that reported in ref (12) (−2.77 kcal mol–1 K–1), and the corresponding reference values of ΔH0 and ΔS0⧧ at 25 °C are 61.0 kcal/mol and 0.14428 kcal/mol/K, respectively. Fitting the same data to the equilibrium model of eq 3 yields a fit of similar quality (Figure 6d) with the following resulting values: ΔHeq = 53.0 kcal/mol, ΔSeq = 0.16457 kcal/mol/K, ΔH3 = 20.0 kcal/mol, and ΔS3⧧ = 0.01012 kcal/mol/K. Here, it may be noted that the values of ΔH3 and ΔS3⧧ from the equilibrium model are in the typical region observed for enzymes, yielding a free energy barrier of 17.0 kcal/mol at room temperature, while ΔH0 (25 °C) in the heat capacity model is ultrahigh. It thus again seems difficult to chemically rationalize where such a high activation energy would originate.
The corresponding apparent activation enthalpies and entropy terms for MalL are shown in Figure 6c, and one can see how qualitatively different the predictions of the two models are, where the equilibrium model reaches asymptotic values of ΔHcat⧧ and ΔScat, while the heat capacity model does not. What the two models have in common is, of course, that the reaction is characterized by an unfavorable enthalpy at low temperatures and an unfavorable entropy at high temperatures. It can further be noted that the magnitudes of the ΔHeq and TΔSeq terms of the equilibrium model are in this case large and approaching the order that would maybe be expected for folding–unfolding transitions.23,26 If this model is correct, it could indicate that some partial unfolding process is at play near the rate optimum, which is not inconceivable in view of the fact that Topt is very close to Tm, even if kunfold is known to be slow. At any rate, because the active sites of AHA, PPA, and MalL are very similar the key Asp–substrate interaction discussed above (Asp332 in MalL) might be expected to break at high temperatures also in MalL, thereby suddenly decreasing the apparent activation enthalpy as shown in Figure 6c.
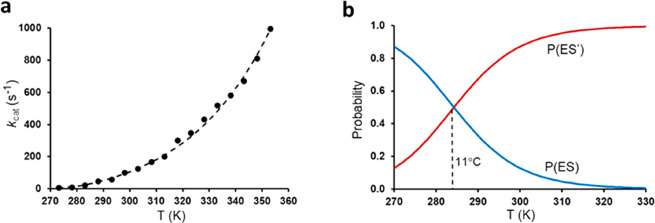
Another enzyme in which the heat capacity model has been proposed as an explanation for curved Arrhenius plots is adenylate kinase (Adk).28 This enzyme differs from those discussed above in that its rate is limited by a conformational change leading to product release, and this transition thus masks the preceding chemical step (phosphoryl transfer).29 In the case of Adk, curved Arrhenius plots (although not anomalous rate optima) were observed both for some hypothetical reconstructed ancestral enzymes and for extant hyperthermophilic Adks from Copelatus subterraneus and Aquifex aeolicus. It was also shown that the curvature is not caused by thermal denaturation as the melting regime at higher temperatures was excluded from the analysis. It was further argued that the curved Arrhenius plots for the most “ancient” hyperthermophilic enzymes have some evolutionary meaning with regard to thermoadaptation.28 The ANC1 variant of Adk was taken as an example, with the highest melting temperature Tm of 89 °C, a Topt of ≈80 °C, and a distinctly curved Arrhenius plot in the wide temperature range of 0–80 °C. Here again, the rate curve can be equally well fitted by the equilibrium and heat capacity models, but it was argued that the latter in this case is the correct one.28 This assertion was based on two-dimensional (2D) NMR HSQC spectra between 15 and 45 °C, where chemical shift cross-peaks were seen to move linearly with temperature rather than exponentially as would be predicted from the ES ⇌ ES′ population shift in the equilibrium model.
Our fit of the ANC1 data (extracted from ref (28)) to the equilibrium model is shown in Figure 7a, and the resulting parameters (Table 2) are basically the same as in ref (28) (apart from misprints for ΔS3⧧ therein). As noted above, there are two solutions to eq 4, in this case with a ΔHeq of ±20.5 kcal/mol and a ΔSeq of ±0.07197 kcal/mol/K. These were denoted as “hot inactivation” (+ sign) and “cold inactivation” (− sign), respectively,28 reflecting whether the free energy difference between ES and ES′ adds a penalty to the overall free energy barrier at high or low temperatures. Without any knowledge of what the structural transition associated with a putative inactivation equilibrium would be, it is not meaningful to speculate about which solution is most reasonable. However, it can be noted that all three of the hyperthermophilic Adks (ANC1, C. subterraneus, and A. aeolicus) have similar solutions to eq 4, where ΔH3 for the “cold inactivation” is in the range of 8–10 kcal/mol and ΔH3⧧ for the “hot inactivation” solution is ∼30 kcal/mol. The latter high value might perhaps be considered consistent with the general trend for heat-adapted enzymes,2,3 where rigidification of the protein would give rise to higher enthalpy penalties.30 Whatever the case may be, one can see from Figure 7b that the temperature at which the ES and ES′ populations become equal for ANC1 is as low as 11 °C. Hence, in the temperature range of the NMR experiments (15–45 °C), the favored population (ES or ES′, depending on which solution is chosen) increases from 62% to 98%. It would thus seem very difficult to capture the exact temperature dependence (linear or exponential) of such a small population shift by 2D NMR, particularly if the underlying conformational transition involves the movement of only a single or a few enzyme side chains, as in the case of AHA described above. Moreover, there are four solutions (3–6 in Table 2) to the alternative linear kinetic scheme of eq 5 that have ES′ ⇌ ES transition temperatures well above the range measured by NMR, in which case no population shift should be seen at all. Overall, we would thus regard the experimental evidence in favor of the heat capacity model to be rather weak in the case of Adk.
Figure 7.
(a) Fit of the experimental rate data for ANC128 to the equilibrium model using either of the parameter sets for eqs 3 and 5 in Table 2. (b) Probabilities of the ES and ES′ states for the equilibrium model (first entry in Table 2) as a function of temperature. Note that the second entry of Table 2 just interchanges the labels of the two states.
Table 2. Parameters Obtained from Fitting the Equilibrium and Heat Capacity Models to the Experimental Rate for ANC1 at Different Temperatures28 (units of kilocalories per mole and kilocalories per mole per Kelvin).
| ΔHeq | ΔSeq | ΔH2⧧ | ΔS2⧧ | ΔH–2⧧ | ΔS–2⧧ | ΔH3⧧ | ΔS3⧧ | rlsa | |
|---|---|---|---|---|---|---|---|---|---|
| eq 3 | 20.5 | 0.07197 | – | – | – | – | 28.1 | 0.04861 | k3 |
| eq 3 | –20.5 | –0.07197 | – | – | – | – | 7.6 | –0.02336 | k3 |
| eq 5 | –20.5 | –0.07202 | –6.2 | –0.04607 | 14.2 | 0.02595 | 28.1 | 0.04867 | k3 |
| eq 5 | 20.5 | 0.07202 | –6.2 | –0.04607 | –26.7 | –0.11809 | 7.6 | –0.02335 | k3 |
| eq 5 | –34.4 | –0.09474 | 7.6 | –0.02335 | 42.0 | –0.07139 | 28.1 | 0.04867 | k3/k2 |
| eq 5 | 34.4 | 0.09474 | 7.6 | –0.02335 | –26.7 | –0.11809 | –6.2 | –0.04607 | k3/k2 |
| eq 5 | 13.9 | 0.02272 | 28.1 | 0.04867 | 14.2 | 0.02595 | –6.2 | –0.04607 | k2/k3 |
| eq 5 | –13.9 | –0.02272 | 28.1 | 0.04867 | 42.0 | –0.07139 | 7.6 | –0.02335 | k2/k3 |
Rate-limiting step at low/high temperatures.
More Complex Equilibrium Models
The simple equilibrium models of eqs 3 and 5 can, of course, be made more complex by adding additional equilibria with inactive states. A prototypic example would be
 |
14 |
in which case we obtain the rate expression
| 15 |
and the corresponding apparent activation free energy
| 16 |
As presented above, the apparent activation enthalpy is approximately given by
| 17 |
where P(ES′) = Keq/(1 + Keq + KeqKeq′) and P(ES″) = KeqKeq/(1 + Keq + KeqKeq′). This would in turn give rise to the apparent heat capacity difference
| 18 |
where both ΔHcat⧧(T) and ΔCp(T) can now adopt more complex shapes as shown in Figure 8. For ΔCp⧧(T) to display several minima, it is necessary for the two equilibria to have different transition temperatures (midpoints) and that there also be a region where all three states (ES, ES′, and ES″) have significant probabilities (Figure 8c). Here, the theoretical rate curve for AHA (Figure 2a), obtained with the parameters from the first entry in Table 1, does not fulfill these criteria. Hence, fitting to eq 15 will always yield a high-temperature and a low-temperature transition, whose average is 298 K, but with P(ES′) being essentially zero over the entire temperature range due to the large overlap between P(ES) and P(ES″).
Figure 8.
Plots of the temperature dependence of (a) ΔCp⧧, (b), ΔHcat, and (c) the probabilities of the three states ES, ES′, and ES″ in the more complex equilibrium model of eq 14. In this hypothetical case, ΔH3⧧, ΔHeq, and ΔHeq are given numerical values of 10, 20, and 20 kcal/mol, respectively, and ΔSeq and ΔSeq′ are given values of 0.07143 and 0.0625 kcal/mol/K, respectively.
A Note on the ΔHcat⧧ and ΔScat Approximations
Examining eq 18 and comparing it to the exact expression obtained from the temperature derivatives of eq 16, ΔCp⧧(T) = −T[∂2ΔGcat(T)/∂T2], one again finds that the heat capacity difference obtained from the approximate activation enthalpy is exact, just as for the two-state equilibrium of eq 3. What is then the difference between the apparent activation enthalpies and entropies and the “exact” ones? The latter can be obtained from numerical integration of the exact heat capacities as
| 19 |
and
| 20 |
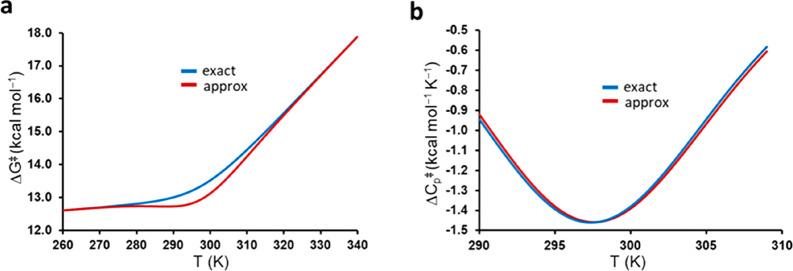
For the two-state equilibrium model (eq 3), the error caused by the approximations of ΔHcat⧧ and ΔScat (eqs 11 and 12) is shown in Figure 9a in terms of the resulting true and approximate activation free energies. One can see there that ΔGcat⧧(T) is asymptotically exact, as expected, but that there is an underestimation of the barrier near the midpoint of the equilibrium. It may also be noted that the entropy approximation in eq 12 gives a heat capacity that is close to but does not exactly agree with the true ΔCp(T) function. Instead of eq 13, the temperature derivative of ΔScat⧧(T) gives
| 21 |
with the difference being that one of the ΔHeq factors is substituted with TΔSeq. This leads to a very slight shift of the ΔCp⧧(T) curve as one can see in Figure 9b. Nevertheless, it is thus clear that the approximations of eqs 11 and 12 are sufficiently accurate for most purposes because , in our case of the AHA enzyme, the maximum free energy error is only ∼0.4 kcal/mol.
Figure 9.
(a) Comparison of the exact (eq 10) and approximate activation free energies (obtained from eqs 11 and 12) for the AHA reaction using the parameters from the first entry of Table 1. (b) Illustration of how the activation entropy approximation of eq 12 gives a slightly incorrect activation heat capacity compared to the exact function obtained from the second temperature derivative of the activation free energy.
Discussion
Herein, we have analyzed different kinetic models that can account for the curved Arrhenius plots and anomalous temperature optima observed for a number of enzymes, particularly several cold-adapted ones.5,30−32 It is evident that both simple schemes, which involve equilibria with nonproductive enzyme–substrate complexes, and the recently proposed heat capacity model can reproduce this type of behavior. Instead of equilibria with inactive states, the latter model postulates that there is a constant heat capacity difference between the transition and reactant states in a single (rate-limiting) chemical step. An interesting case in which one can actually distinguish between different kinetic models is the psychrophilic α-amylase AHA. For this enzyme, earlier computer simulations clearly showed that an inactive reactant state starts to become populated at room temperature and will dominate upon further heating. Hence, while the equilibrium and heat capacity models give virtually identical kcat curves in the relevant temperature region, the former can be judged to be the correct one for AHA.
Depending on whether the nonproductive ES′ state is a dead end or lies on the path from E + S to products, one obtains two or six equivalent solutions to the equilibrium scheme, each specified by a set of equilibrium and activation enthalpies and entropies. Hence, some additional knowledge regarding the magnitude and sign of the activation parameters for the rate-limiting step would be required to distinguish between the different solutions, as is the case for the α-amylase. The ΔCp⧧ model, on the other hand, because it pertains to a single chemical step, involves only three constant parameters, namely ΔH0, ΔS0⧧, and ΔCp. Although the two models can be seen to give almost identical rate curves, it is clear that they make very different predictions in terms of apparent activation enthalpies and entropies. Hence, while the equilibrium model yields asymptotic values of ΔHcat⧧ and ΔScat that reflect the population of the ES ⇌ ES′ equilibrium, a constant non-zero ΔCp⧧ essentially predicts a linear behavior of ΔHcat and TΔScat⧧ over the entire temperature range. Moreover, the apparent ΔCp can be calculated exactly for the equilibrium model and, instead of being constant, shows a characteristic dip in the region where the ES ⇌ ES′ transition occurs, thus reflecting an apparent increase in Cp for the reactant state.
Besides the α-amylase, we also examined some relevant experimental data that are available for other enzymes with curved Arrhenius plots. In the case of both the α-glucosidase MalL11 and an ancient reconstructed adenylate kinase (ANC1),28 our conclusion is that it seems to be difficult to discriminate between the equilibrium and heat capacity models at present, based on experimental data. By analogy with the psychrophilic and mesophilic α-amylases, which share the same active site as MalL, one could perhaps expect a similar behavior of these enzymes, but that would have to be verified by computer simulations of the MalL-catalyzed reaction. Here, van der Kamp and co-workers attempted to directly calculate the reactant and transition state heat capacities from the total potential energy fluctuations from MD simulations, where the TS was represented by an inhibitor complex.12 Such calculations are difficult to converge because the total energy is truly huge, even for a typical microscopic enzyme simulation system, and the solvent contributions thus had to be excluded from the analysis. Nevertheless, calculations of the total energy fluctuations might be a viable approach, also for identifying possible bimodal distributions indicative of multiple conformational states, but they would also have to include the solvent contributions to represent true enthalpies and heat capacities.21,33,34
The adenylate kinases are also particularly interesting from a thermoadaptation viewpoint because they are rate-limited, not by chemical steps but by conformational changes (lid opening) that allow subsequent product release. Here, it seems to be somewhat unclear whether the conformation of the TS is really invariant with respect to temperature, which is the usual assumption for transition states reflecting a chemical step. Interestingly, however, for those Adks that show linear Arrhenius plots,28,35 there is no obvious correlation between the typical habitat temperature of the bacterium (or the enzyme Tm) and the thermodynamic activation parameters ΔH⧧ and ΔS⧧. That is, the general rule of a lower activation enthalpy and a more negative entropy, as the habitat temperature decreases,1−5 does not seem to be obeyed by the Adks (Bacillus stearothermophilus, Escherichia coli, B. subtilis, and Bacillus marinus). One interpretation of this would be that evolution has not operated on the thermodynamics of conformational changes in the same way as on the rate-limiting chemical steps for some interesting reason. Another obvious interpretation is simply that the Adks are less important for bacterial growth rates, in which case the evolutionary pressure on enzyme adaptation decreases. The fact that the allegedly psychrophilic B. marinus Adk is reported as being significantly slower at low temperatures than it mesophilic and thermophilic counterparts28 would support the notion that this is not a cold-adapted enzyme by the regular criteria.1−5 Hence, further analysis of truly cold-adapted Adks, showing high catalytic activity at low temperature, would be most interesting.
While it is clear that both the equilibrium model involving hidden reactant states and the heat capacity model can explain anomalous temperature optima in enzymes, the question of whether the assumption of a constant negative value of ΔCp⧧ is reasonable in the latter case remains. It is important to emphasize here that, in strict terms, linear Arrhenius plots should be expected for only elementary chemical steps,36 unless other rate constants are completely masked in the expression for kcat, by virtue of their magnitude. Hence, Arrhenius plots of kcat/Km do not fulfill this criterion as this quantity, per definition, involves an additional binding step. In such a case, there may well be a difference in heat capacity between the free enzyme and enzyme–substrate complex,34,37,38 which will also be reflected at the transition state. If Arrhenius plots for kcat/Km are found to be curved,39 this may also, of course, be explained by E ⇌ E′ or ES ⇌ ES′ equilibria. In enzyme catalysis, the key question is thus whether there could be a heat capacity change for the elementary step where the system moves from the ES state to the TS, which generally takes place on the subpicosecond time scale if we are talking about a chemical reaction coordinate. This would seem to imply some type of rapid enzyme conformational change and/or a significant shift of vibrational frequencies along the reaction coordinate. It appears that computer simulations of relevant enzymatic reactions with curved Arrhenius plots will be the only way to determine whether this could be true. Finally, it should also be noted that data for the binding of trisaccharides to lectin,34 relatively large thrombin inhibitors38 and cytidine 2′-monophosphate to RNase A37 show that typical values of ΔCp for ligand binding to proteins are not more negative than approximately −0.4 kcal mol–1 K–1. Hence, negative ΔCp values on the order of several kilocalories per mole per kelvin for an elementary chemical reaction step would be highly surprising.
Acknowledgments
Computational resources were provided by the Swedish National Infrastructure for Computing (SNIC).
Support from the Swedish Research Council (VR) and the Knut and Alice Wallenberg Foundation is gratefully acknowledged.
The authors declare no competing financial interest.
References
- Feller G.; Gerday C. (2003) Psychrophilic enzymes: hot topics in cold adaptation. Nat. Rev. Microbiol. 1, 200–208. 10.1038/nrmicro773. [DOI] [PubMed] [Google Scholar]
- Siddiqui K. S.; Cavicchioli R. (2006) Cold-adapted enzymes. Annu. Rev. Biochem. 75, 403–433. 10.1146/annurev.biochem.75.103004.142723. [DOI] [PubMed] [Google Scholar]
- Åqvist J.; Isaksen G. V.; Brandsdal B. O. (2017) Computation of enzyme cold adaptation. Nat. Rev. Chem. 1, 0051. 10.1038/s41570-017-0051. [DOI] [PMC free article] [PubMed] [Google Scholar]
- Low P. S.; Bada J. L.; Somero G. N. (1973) Temperature adaptation of enzymes: roles of the free energy, the enthalpy, and the entropy of activation. Proc. Natl. Acad. Sci. U. S. A. 70, 430–432. 10.1073/pnas.70.2.430. [DOI] [PMC free article] [PubMed] [Google Scholar]
- D’Amico S.; Marx J.-C.; Gerday C.; Feller G. (2003) Activity-stability relationships in extremophilic enzymes. J. Biol. Chem. 278, 7891–7896. 10.1074/jbc.M212508200. [DOI] [PubMed] [Google Scholar]
- Gerday C. (2013) Psychrophily and catalysis. Biology 2, 719–741. 10.3390/biology2020719. [DOI] [PMC free article] [PubMed] [Google Scholar]
- Socan J.; Purg M.; Åqvist J. (2020) Computer simulations explain the anomalous temperature optimum in a cold-adapted enzyme. Nat. Commun. 11, 2644. 10.1038/s41467-020-16341-2. [DOI] [PMC free article] [PubMed] [Google Scholar]
- Pinto G. P.; Bras N. F.; Perez M. A. S.; Fernandes P. A.; Russo N.; Ramos M. J.; Toscano M. (2015) Establishing the catalytic mechanism of human pancreatic α-amylase with QM/MM methods. J. Chem. Theory Comput. 11, 2508–2516. 10.1021/acs.jctc.5b00222. [DOI] [PubMed] [Google Scholar]
- Kosugi T.; Hayashi S. (2012) Crucial role of protein flexibility in formation of a stable reaction transition state in an α-amylase catalysis. J. Am. Chem. Soc. 134, 7045–7055. 10.1021/ja212117m. [DOI] [PubMed] [Google Scholar]
- Bowman A. L.; Grant I. M.; Mulholland A. J. (2008) QM/MM simulations predict a covalent intermediate in the hen egg white lysozyme reaction with its natural substrate. Chem. Commun. 37, 4425–4427. 10.1039/b810099c. [DOI] [PubMed] [Google Scholar]
- Hobbs J. K.; Jiao W.; Easter A. D.; Parker E. J.; Schipper L. A.; Arcus V. L. (2013) Change in heat capacity for enzyme catalysis determines temperature dependence of enzyme catalyzed rates. ACS Chem. Biol. 8, 2388–2393. 10.1021/cb4005029. [DOI] [PubMed] [Google Scholar]
- van der Kamp M. W.; Prentice E. J.; Kraakman K. L.; Connolly M.; Mulholland A. J.; Arcus V. L. (2018) Dynamical origins of heat capacity changes in enzyme-catalysed reactions. Nat. Commun. 9, 1177. 10.1038/s41467-018-03597-y. [DOI] [PMC free article] [PubMed] [Google Scholar]
- Warshel A. (1991) Computer Modeling of Chemical Reactions in Enzymes and Solutions, John Wiley & Sons, New York. [Google Scholar]
- Åqvist J.; Warshel A. (1993) Simulation of enzyme reactions using valence bond force fields and other hybrid quantum/classical approaches. Chem. Rev. 93, 2523–2544. 10.1021/cr00023a010. [DOI] [Google Scholar]
- Kazemi M.; Åqvist J. (2015) Chemical reaction mechanisms in solution from brute force computational Arrhenius plots. Nat. Commun. 6, 7293. 10.1038/ncomms8293. [DOI] [PMC free article] [PubMed] [Google Scholar]
- Qian M.; Nahoum V.; Bonicel J.; Bischoff H.; Henrissat B.; Payan F. (2001) Enzyme-catalyzed condensation reaction in a mammalian α-amylase. High-resolution structural analysis of an enzyme–inhibitor complex. Biochemistry 40, 7700–7709. 10.1021/bi0102050. [DOI] [PubMed] [Google Scholar]
- Marelius J.; Kolmodin K.; Feierberg I.; Åqvist J. (1998) Q: a molecular dynamics program for free energy calculations and empirical valence bond simulations in biomolecular systems. J. Mol. Graphics Modell. 16, 213–225. 10.1016/S1093-3263(98)80006-5. [DOI] [PubMed] [Google Scholar]
- Bauer P.; Barrozo A.; Purg M.; Amrein B. A.; Esguerra M.; Wilson P. B.; Major D. T.; Åqvist J.; Kamerlin S. C. L. (2018) Q6: A comprehensive toolkit for empirical valence bond and related free energy calculations. SoftwareX 7, 388–395. 10.1016/j.softx.2017.12.001. [DOI] [Google Scholar]
- Robertson M. J.; Tirado-Rives J.; Jorgensen W. L. (2015) Improved peptide and protein torsional energetics with the OPLS-AA force field. J. Chem. Theory Comput. 11, 3499–3509. 10.1021/acs.jctc.5b00356. [DOI] [PMC free article] [PubMed] [Google Scholar]
- Lee F. S.; Warshel A. (1992) A local reaction field method for fast evaluation of long-range electrostatic interactions in molecular simulations. J. Chem. Phys. 97, 3100–3107. 10.1063/1.462997. [DOI] [Google Scholar]
- Daniel R. M.; Danson M. J. (2010) A new understanding of how temperature affects the catalytic activity of enzymes. Trends Biochem. Sci. 35, 584–591. 10.1016/j.tibs.2010.05.001. [DOI] [PubMed] [Google Scholar]
- Roy S.; Schopf P.; Warshel A. (2017) Origin of the non-Arrhenius Behavior of the rates of enzymatic reactions. J. Phys. Chem. B 121, 6520–6526. 10.1021/acs.jpcb.7b03698. [DOI] [PMC free article] [PubMed] [Google Scholar]
- Prabhu N. V.; Sharp K. A. (2005) Heat capacity in proteins. Annu. Rev. Phys. Chem. 56, 521–548. 10.1146/annurev.physchem.56.092503.141202. [DOI] [PubMed] [Google Scholar]
- Schönert S.; Buder T.; Dahl M. K. (1999) Properties of maltose-inducible α-glucosidase MalL (sugar-isomaltase-maltase) in Bacillus subtilis: evidence for its contribution to maltodextrin utilization. Res. Microbiol. 150, 167–177. 10.1016/S0923-2508(99)80033-3. [DOI] [PubMed] [Google Scholar]
- Schönert S.; Buder T.; Dahl M. K. (1998) Identification and enzymatic characterization of the maltose-inducible α-glucosidase MalL (sugar-isomaltase-maltase) of Bacillus subtilis. J. Bacteriol. 180, 2574–2578. 10.1128/JB.180.9.2574-2578.1998. [DOI] [PMC free article] [PubMed] [Google Scholar]
- Fersht A. (1999) Structure and Mechanism in Protein Science, W. H. Freeman & Co., New York. [Google Scholar]
- Aghajari N.; Roth M.; Haser R. (2002) Crystallographic evidence of a transglycosylation reaction: ternary complexes of a psychrophilic α-amylase. Biochemistry 41, 4273–4280. 10.1021/bi0160516. [DOI] [PubMed] [Google Scholar]
- Nguyen V.; Wilson C.; Hoemberger M.; Stiller J. B.; Agafonov R. V.; Kutter S.; English J.; Theobald D. L.; Kern D. (2017) Evolutionary drivers of thermoadaptation in enzyme catalysis. Science 355, 289–294. 10.1126/science.aah3717. [DOI] [PMC free article] [PubMed] [Google Scholar]
- Kerns S. J.; Agafonov A.; Cho Y. J.; Pontiggia F.; Otten R.; Pachov D. V.; Kutter S.; Phung L. A.; Murphy P. N.; Thai V.; Alber T.; Hagan M. F.; Kern D. (2015) The energy landscape of adenylate kinase during catalysis. Nat. Struct. Mol. Biol. 22, 124–131. 10.1038/nsmb.2941. [DOI] [PMC free article] [PubMed] [Google Scholar]
- Isaksen G. V.; Åqvist J.; Brandsdal B. O. (2016) Enzyme surface rigidity tunes the temperature dependence of catalytic rates. Proc. Natl. Acad. Sci. U. S. A. 113, 7822–7827. 10.1073/pnas.1605237113. [DOI] [PMC free article] [PubMed] [Google Scholar]
- Georlette D.; Damien B.; Blaise V.; Depiereux E.; Uversky V. N.; Gerday C.; Feller G. (2003) Structural and functional adaptations to extreme temperatures in psychrophilic, mesophilic, and thermophilic DNA ligases. J. Biol. Chem. 278, 37015–37023. 10.1074/jbc.M305142200. [DOI] [PubMed] [Google Scholar]
- Collins T.; Meuwis M.-A.; Gerday C.; Feller G. (2003) Activity, stability and flexibility in glycosidases adapted to extreme thermal environments. J. Mol. Biol. 328, 419–428. 10.1016/S0022-2836(03)00287-0. [DOI] [PubMed] [Google Scholar]
- Perozzo R.; Folkers G.; Scapozza L. (2004) Thermodynamics of protein-ligand interactions: history, presence and future aspects. J. Recept. Signal Transduction Res. 24, 1–52. 10.1081/RRS-120037896. [DOI] [PubMed] [Google Scholar]
- Cooper A. (2005) Heat capacity effects in protein folding and ligand binding: a re-evaluation of the role of water in biomolecular thermodynamics. Biophys. Chem. 115, 89–97. 10.1016/j.bpc.2004.12.011. [DOI] [PubMed] [Google Scholar]
- Saavedra H. G.; Wrabl J. O.; Anderson J. A.; Li J.; Hilser V. J. (2018) Dynamic allostery can drive cold adaptation in enzymes. Nature 558, 324–328. 10.1038/s41586-018-0183-2. [DOI] [PMC free article] [PubMed] [Google Scholar]
- Truhlar D. G.; Kohen A. (2001) Convex Arrhenius plots and their interpretation. Proc. Natl. Acad. Sci. U. S. A. 98, 848–851. 10.1073/pnas.98.3.848. [DOI] [PMC free article] [PubMed] [Google Scholar]
- Naghibi H.; Tamura A.; Sturtevant J. M. (1995) Significant discrepancies between van’t Hoff and calorimetric enthalpies. Proc. Natl. Acad. Sci. U. S. A. 92, 5597–5599. 10.1073/pnas.92.12.5597. [DOI] [PMC free article] [PubMed] [Google Scholar]
- Geschwindner S.; Ulander J.; Johansson P. (2015) Ligand binding thermodynamics in drug discovery: still a hot tip?. J. Med. Chem. 58, 6321–6335. 10.1021/jm501511f. [DOI] [PubMed] [Google Scholar]
- Bunzel H. A.; Kries H.; Marchetti L.; Zeymer C.; Mittl P. R. E.; Mulholland A. J.; Hilvert D. (2019) Emergence of a negative activation heat capacity during evolution of a designed enzyme. J. Am. Chem. Soc. 141, 11745–11748. 10.1021/jacs.9b02731. [DOI] [PubMed] [Google Scholar]


