Abstract
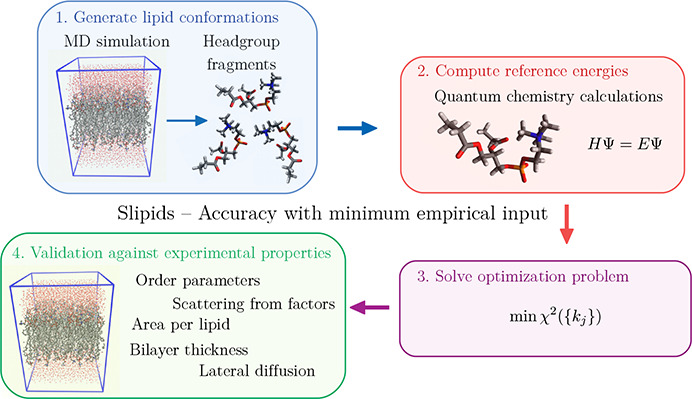
The molecular mechanics force field Slipids developed in a series of works by Jämbeck and Lyubartsev (J. Phys. Chem. B2012, 116, 3164–3179; J. Chem. Theory Comput.2012, 8, 2938–2948) generally provides a good description of various lipid bilayer systems. However, it was also found that order parameters of C–H bonds in the glycerol moiety of the phosphatidylcholine headgroup deviate significantly from NMR results. In this work, the dihedral force field parameters have been reparameterized in order to improve the agreement with experiment. For this purpose, we have computed energies for a large amount of lipid headgroup conformations using density functional theory on the B3P86/cc-pvqz level and optimized dihedral angle parameters simultaneously to provide the best fit to the quantum chemical energies. The new parameter set was validated for three lipid bilayer systems against a number of experimental properties including order parameters, area per lipid, scattering form factors, bilayer thickness, area compressibility and lateral diffusion coefficients. In addition, the order parameter dependence on cholesterol content in the POPC bilayer was investigated. It is shown that the new force field significantly improves agreement with the experimental order parameters for the lipid headgroup while keeping good agreement with other experimentally measured properties.
Introduction
Lipids are key components of biological membranes which are crucial parts of all cells.1 Due to their amphiphilic character, lipids in water assemble into bilayer structures with polar headgroups facing the aqueous phase and aliphatic tails forming a hydrophobic core in the bilayer center. Together with other biomolecules, including proteins and carbohydrates, they constitute a barrier between the cytosol and the extracellular space. Furthermore, biological membranes are responsible for compartmentalization within the cell separating functional units called organelles.2 In addition, they play a crucial role in the transport of molecular cargo in and out of cells and organelles by the processes of endo- and exocytosis3 and by accommodating transmembrane gates and pumps.4 Although the composition of biological membranes found in nature is diverse5 and varies between different types of cells, studies of one-component lipid bilayers can give valuable insight. In the biologically relevant Lα phase,6 the membrane structure is highly dynamic where lipids change conformation, rotate, diffuse in the lateral plane, and undergo collective motion. The time scales of these processes cover several orders of magnitude from the picosecond to the microsecond and millisecond range.7 Although the lipid molecules that constitute the membrane reorient and wobble as they diffuse in the lateral plane, they possess orientational order with respect to the membrane normal. In addition, bonds within the lipid molecules have different degrees of orientatinal order. Bonds located in more or less rigid parts of the lipid possess a high degree of order, while others exist in flexible regions and are for this reason less ordered. The degree of orientational order is an essential feature of the bilayer structure that has important consequences for the properties of biological membranes.
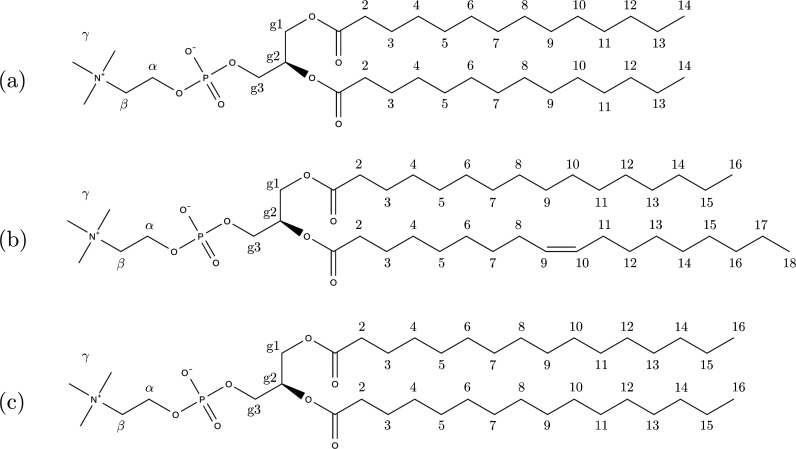
Experimentally, NMR spectroscopy is the primary source of information for orientational order8 and dynamics9 in lipid bilayers, while small-angle X-ray (SAXS) and neutron (SANS) scattering10,11 are considered the most accurate tools for determination of bilayer thickness and area per lipid.12,13 Furthermore, molecular dynamics (MD) simulation is a powerful complement to experimental studies that can inform about the structure and dynamics of lipid bilayers in atomistic detail. The results obtained from MD are however limited by the quality of available force fields that describe atomic interactions. This includes popular force fields such as Berger modification of the united atom GROMOS force field,14 CHARMM36,15 and GAFFlipid.16 The force field Slipids, developed in a series of works17−19 by Jämbeck and Lyubartsev, has used partial atom charges and parameters of lipid tails optimized against accurate quantum chemistry calculations, while torsion and Lennard-Joned parameters for the lipid headgroups were inherited from the CHARMM36 force field. It has been shown that the Slipids force field generally provides a good description of lipid bilayers in agreement with experiment for many structural and dynamical properties.12 A benchmark study20 comparing the membrane/water partition coefficients obtained using different force fields, including GAFFlipid,16 Berger,14 CHARMM36,15 and Slipids,17 showed that Slipids and CHARMM36 gave the closest agreement to experiment. However, it has also been found that the order parameters for C–H vectors in the glycerol moiety (g1, g2, and g3 in Figure 1) calculated with Slipids are in poor agreement with accurate NMR experiments.21 This shows that these C–H bonds do not sample the correct orientational distributions which are sensitive to the dihedral terms in the force field. CHARMM36 dihedral parameters were tuned empirically15 to provide good agreement with the order parameters from NMR. A problem with this approach is that the order parameter is an average over the orientational distribution function, and since different distributions can give the same average, this approach does not guarantee that the correct orientational distribution is sampled. Slipids has been developed using a different procedure where the force field parameters are first fitted to quantum chemistry data, without empirical input, and then validated against experimental data. A realistic description of the lipid bilayer structure is crucial in order to better understand scientific questions including the formation and role of lipid microdomains22 (rafts), interaction between pharmaceuticals and biological membranes,23 and how lipid–protein interactions affect protein function.24 For this reason, a large amount of scientific work has been devoted to improving force fields used in simulations of lipid bilayers.12 An overview of the development, validation, and comparison of force fields for lipids and lipid bilayers has been presented in a number of publications.12,21,25,26 The ability of force fields to reproduce experimental properties, including order parameters, has been subject to extensive investigation within the NMRlipids project.21,27−29 However, to the best of our knowledge, there is yet no parameter set available that is capable of reproducing order parameters of all C–H vectors in phosphatidylcholine lipids within experimental error bars. In this work, Slipids dihedral force field parameters have therefore been reparametrized against quantum chemical calculations with the purpose of achieving better agreement with experiment. The next section “Methods and Models” will describe the strategy that was undertaken for parameter optimization and how the obtained parameters were validated against experimental data. In the section “Results and Discussion”, results are presented and the performance of the new parameter set is discussed. The last section “Conclusion” provides the concluding remarks.
Figure 1.
Phosphatidylcholine lipids studied in this work: (a) 1,2-dimyristoyl-sn-glycero-3-phosphatidylcholine (DMPC), (b) 1-palmitoyl-2-oleoyl-sn-glycero-3-phosphatidylcholine (POPC), and (c) 1,2-dipalmitoyl-sn-glycero-3-phosphatidylcholine (DPPC).
Methods and Models
Parameterization Strategy
In the Slipids force field, the potential energy has the standard functional form shown in eq 1
 |
1 |
where the first three terms are contributions from bonds, angles, and dihedral angles and the last two terms describe short-range repulsion, van der Waals attraction, and electrostatic interactions. In this work, we focus on the dihedral part and it is therefore convenient to express the force field energy as in eq 2
| 2 |
where Edihedral is the dihedral contribution and Eother contains all of the other interactions.
In the force field, each atom in a molecule is mapped to an atom type representing a chemically distinct environment. A sequence of four atom types i, j, k, and l defines a dihedral interaction which is modeled by a sum of cosine terms each having a multiplicity, m, a dihedral force field parameter km,ijkl, and a phase shift, δm,ijkl; see eq 1. For symmetry reasons, the phase term is restricted to 0 and 180° and can therefore be removed if the dihedral force field parameter is allowed to take both positive and negative values. For this reason, phase shifts are not fitted in the present work. An approach for fitting also the phase terms is described in ref (30). Previously, some dihedral interactions in the Slipids force field were modeled using cosine terms of multiplicity 4 and 6. In this work, we only include cosine functions with multiplicity mmax ≤ 3.
The most popular approach for parametrizing dihedral angles has previously been to fit parameters to an energy profile obtained by carrying out incremental rotations about dihedral angles, one at a time, and evaluating the quantum chemical energy at each point.31 Frequently, such calculations have been performed using small “model compounds” to reduce computational cost.15 A serious drawback with such procedures is that dihedral angles are optimized one by one and are hence treated as independent. This work attempts to overcome this problem by taking a different approach where all dihedrals of a lipid headgroup are optimized simultaneously. For this purpose, a representative set of lipid conformations was extracted form a well-equilibrated MD trajectory of a DMPC lipid bilayer (303 K, 1.013 bar, 128 lipids, 30 TIP3P water molecules per lipid) described with the current version of the Slipids force field. In order to simplify computationally intense quantum chemistry calculations, the hydrocarbon tails of lipids were replaced by ethyl groups bonded to the carbonyl carbon. For each conformation, two energies were calculated: (1) the single point quantum chemical energy, EQC, computed at the DFT B3P86/cc-pvqz level of theory and (2) the force field energy with all dihedral force field parameters set to zero, Eother. Justification for the choice of this level of quantum chemical theory is given in the section “Quantum Chemistry Test Calculations” in the Supporting Information. Extracting N conformations from the trajectory and computing the corresponding energies gives a set of reference energies, eq 3:
| 3 |
The goal of the parametrization is to find the set of M dihedral force field paramters {kj} that best reproduce the reference energies. This was done by minimizing the objective function in eq 4
| 4 |
where the first term is the sum of squared deviations between reference energies, Ri, and the corresponding force field energy, Edihedral,i({kj}). A constant, c, is introduced, since only relative energies are fitted. Since some dihedral angles (or their combinations) can have little effect on the conformational energy, minimizing the sum of squared deviations between the reference energies and the model may lead to unphysically high parameters for some dihedrals. For this reason, the second term is included in eq 4, intended to reduce overfitting by adding a quadratic penalty to the objective function when parameters rise. A regularization parameter, λ, determines the strength of this penalty. The regularized optimization problem was solved using the LSMR method,32 as implemented in the lsmr function from the SciPy package sparse.linalg.
In order to investigate the effect of replacing the hydrocarbon tails with ethyl groups, we carried out additional optimization on a smaller PC headgroup fragment where the tails were replaced by propyl groups and the bond Cg3–O was replaced by a terminal Cg3–H. The results of these substitutions are further discussed in the text.
Validation of Fitted Parameters
In order to test the performance of the fitted parameters, MD simulations were carried out for fully hydrated bilayers consisting of three different lipids (DMPC, POPC, and DPPC); see Figure 1. Each system consisted of 128 lipids, arranged in a bilayer periodic in the XY-direction and hydrated by 30 water molecules per lipid for DMPC and DPPC and 40 waters per lipid for POPC. Furthermore, POPC bilayers were simulated with the addition of different amounts of cholesterol. In Figure 1, we have also introduced labels that will be used later on in the discussion of order parameters. DMPC and POPC systems were simulated at T = 303 K, while for DPPC the temperature was set to T = 323 K. For each system, properties including order parameters, area per lipid, area compressibility, lateral diffusion coefficients, and scattering form factors were calculated and compared with experimental data. The aim of the validation was twofold: (1) show that the new force field gives order parameters in better agreement with NMR experiments and (2) demonstrate that other properties described correctly by the unmodified force field are also reproduced by the new parameter set. All simulations were performed using Gromacs 2019,33 and the trajectories were analyzed using the tranal utility from the MDynaMix package.34 The computational details are presented in Table 1.
Table 1. Computational Parameters Used in All MD Simulations.
| integrator | Leap-frog35 |
| time step | 2 fs |
| cut-off electrostatics | 1.4 nm |
| electrostatics method | particle mesh Ewald36 |
| Fourier spacing | 0.2 nm |
| cut-off scheme | Verlet37 |
| dispersion correction | energy and pressure |
| neighbor list update | 10 steps |
| thermostat | v-rescale38 |
| thermostat relax. time | 0.5 ps |
| barostat | semi-isotropic Berendsen39 |
| pressure | 1.013 bar |
| barostat time constant | 10 ps |
| constraints | all bonds |
| water model | TIP3P40 |
Results and Discussion
Optimization of Torsion Angle Parameters
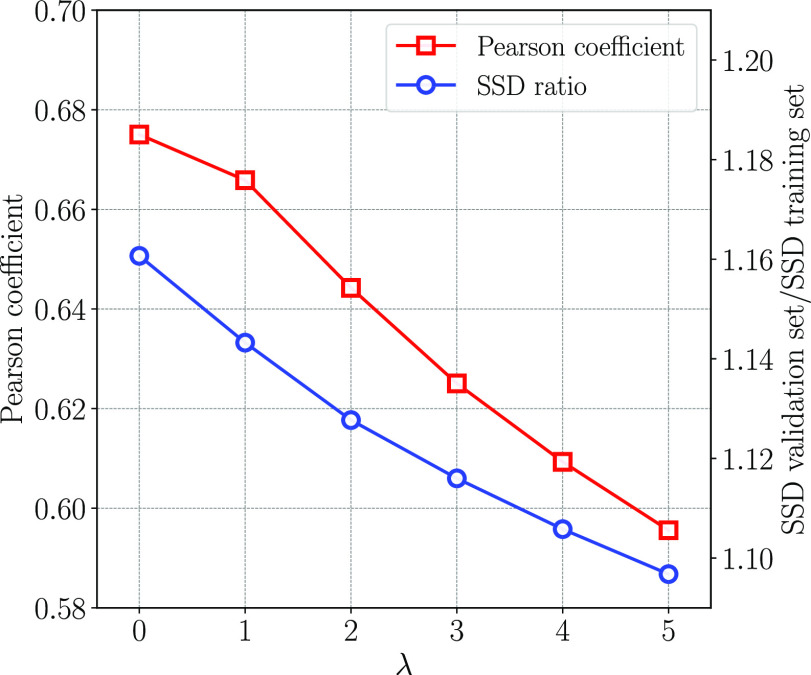
Several computations of the optimized force field parameters using different values of the penalty factor λ were carried out. The quality of fit was quantified by the Pearson coefficient, indicating the correlation between the force field energies and the reference energies, and by the sum of squared deviations (SSD) between same quantities. Furthermore, we divided the whole set of conformations into two parts of equal size, a training set and a validation set. Parameters were fitted against the energies in the training set, and the sum of squared deviations (SSD) between force field energies and quantum chemical energies was then calculated, both for the training and the validation sets. Figure 2 shows how the Pearson coefficient and the ratio of the SSD for the validation set to that of the training set varies as function of λ. If a small λ is used, the obtained parameters fit the quantum chemical energies better compared to parameters obtained using a larger λ. The ratio of the SSD between the validation set and training set quantifies overfitting and decreases upon the initial increase of λ. For the model to describe the real trends in the data, it is desirable to increase λ to reduce overfitting. However, increasing λ eventually deteriorates the quality of fit, which is reflected by a lower Pearson coefficient. In order to achieve a compromise between these trends, we selected λ = 2 and fitted parameters using this penalty factor for the whole data set. In addition, we have investigated how the number of lipid headgroup conformations, N, affects the resulting optimized parameters. We found that increase of N up to several hundreds of conformations significantly reduces the variations, although fluctuations remain up to 2000 conformations. Further details are given in the “Parameter Convergence” section of the Supporting Information. The final force field parameters were optimized using λ = 2 and N = 2000 and used throughout the work.
Figure 2.
Pearson coefficient and ratio of SSD between the validation set and the training set as a function of λ.
Fine-Tuning of Lennard-Jones Parameters
Initial test simulations showed that the fitted dihedral force field parameters, while improving values of the order parameters in lipid headgroups, have led to underestimation of the experimental area per lipid by roughly 0.01–0.02 nm2. Although this deviation is small, it falls outside the experimental error bars. We found that increasing the Lennard-Jones repulsion parameter, A = 4εσ12, of atoms in the PC headgroup improves the results. Increasing σ by 0.02 Å for atoms in the choline group (atom types CTL5 and HL) while keeping the dispersion coefficient, B = 4εσ6, constant (by a corresponding adjustment of ε) gave results in good agreement with experiment. Further details on fine-tuning of the Lennard-Jones parameters and their effect on the results is given in the section “Effect of Tuning Lennard-Jones Parameters” of the Supporting Information.
Effect of Replacing Lipid Tails
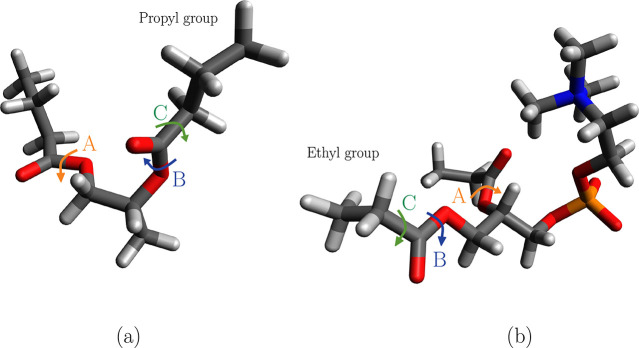
In order to better understand the effect of replacing full lipid tails by ethyl groups, quantum chemistry calculations were performed on smaller lipid fragments where the tails instead were replaced by propyl groups, but choline and phosphate groups were cut and replaced by a methyl group. This fragment is shown in Figure 3a, while the fragment in Figure 3b is the one for which optimization of all dihedral parameters for the lipid headgroup was carried out as described in the sections above. Parameters for the fragment in Figure 3a were optimized using the same procedure as that described previously. Table 2 shows force field parameters for backbone dihedral angles for the fragments shown in Figure 3a and b. It follows from Table 2 that optimized parameters for the dihedrals labeled A and B in Figure 3 around the CL–OSL bond are different for the two fragments. This can be related to the fact that in the fragment in Figure 3a the zwitterionic part of the lipid headgroup was substituted by a methyl group. However, the result also shows that the force field parameters describing the dihedral labeled C (around the CL–CTL2 bond, that is closest to the termination of the tail) are qualitatively the same for the two fragments. This gives confidence that replacing the lipid tails by ethyl groups does not influence our results significantly. For the final force field, we used the fragment shown in Figure 3b which includes the whole lipid headgroup with the lipid tails replaced by ethyl groups.
Figure 3.
Lipid fragments with hydrocarbon chains replaced by (a) propyl and (b) ethyl groups. Relevant dihedral angles in the proximity of the cutting point have been labeled with letters A–C.
Table 2. Force Field Parameters in kJ/mol Optimized Using Lipid Fragments Shown in Figure 3a and ba.
| dihedral | multiplicity | FF parameter frag. (b) | FF parameter frag. (a) |
|---|---|---|---|
| A | 2 | 2.04 | –9.09 |
| B | 2 | –3.56 | –12.43 |
| C | 1 | –0.17 | –1.18 |
| C | 2 | –5.27 | –5.02 |
| C | 3 | 0.35 | 0.30 |
Dihedral angle A is CTL2 CL OSL CTL2, B is CTL2 CL OSL CTL1, and C is CTL3 CTL2 CL OSL.
Order Parameters for C–H Vectors
Since the main motivation of this work was to improve the description of the orientational order of lipids in a fluid phase bilayer, it is relevant to start analysis from the order parameters of C–H vectors, which are computed according to eq 5
| 5 |
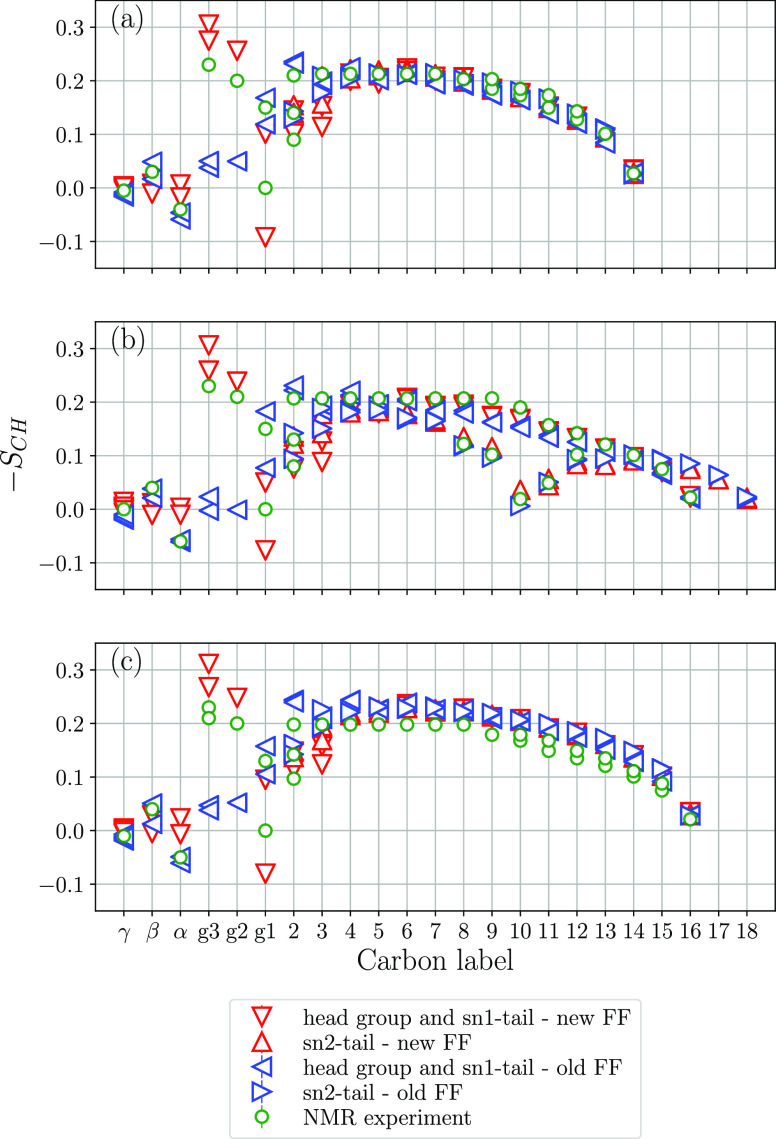
where θ is the angle between the C–H vector and the bilayer normal. Figure 4 shows order parameters for all C–H vectors in the three lipid bilayer systems calculated using the new and old parameter sets together with order parameters from NMR.7,41−46 For the C–H vectors in the headgroups of POPC and DPPC, only the magnitudes of order parameters have been measured45,46 and we have interpreted the signs to be consistent with those reported for DMPC in refs (43 and 44), as done in the NMRlipids project;21 i.e., all C–H vectors have negative sign or are equal to zero except for Cα–H that is positive. This means that the signs of the order parameters from 2H NMR, shown in Figure 4, have been interpreted and not measured in the experiment. The uncertainty in the NMR data is ±0.02, and for the simulation results, the errors are all within ±0.01. One can see that the old force field strongly deviates from the NMR results for g1, g2, and g3, while the new parameter set provides significantly better agreement for these order parameters. Still for g1 the new parameter set overestimates the forking (splitting of the order parameters for the two C–H vectors), and results for POPC are not in full agreement with NMR.
Figure 4.
Order parameters from simulations and experiment:7,41−44,46 (a) DMPC, (b) POPC, and (c) DPPC. The uncertainty in the NMR data is ±0.02, and for the simulation results, the errors are all within ±0.01.
For the γ and β order parameters, both force fields are in good agreement with experiments, while the α order parameter is somewhat closer to zero in the new parameter set, indicating that these C–H vectors have orientations closer to θ = 54.7°. Both force fields perform well for the order parameters in the lipid tails; however, those in the lipid headgroup are more challenging to reproduce. Still, overall, the new parameter set provides a substantially better description of the order parameters in the glycerol region of lipids and thus more correctly reproduces the conformational ensemble and ordering of lipids in the considered bilayers.
Area per Lipid and Bilayer Thickness
An important property often compared between experiments and simulations of lipid bilayers is the area per lipid. This quantity can be accurately determined from scattering experiments. From MD simulations, the area per lipid is calculated according to eq 6
| 6 |
where LX and LY are the dimensions of the simulation box in the plane of the bilayer and nlipids is the number of lipids in one leaflet. Since the box dimensions vary during a MD simulation in the NPT ensemble, the area per lipid fluctuates. The instantaneous area per lipid is shown as a function of simulation time in Figure 5, and average values over the trajectory are presented in Table 3. Both the new and old force fields give the area per lipid in perfect agreement with experiment for DMPC and POPC. For DPPC, the two parameter sets underestimate the area per lipid by roughly 0.01 nm2, but this difference is within the experimental and computational uncertainty.
Figure 5.
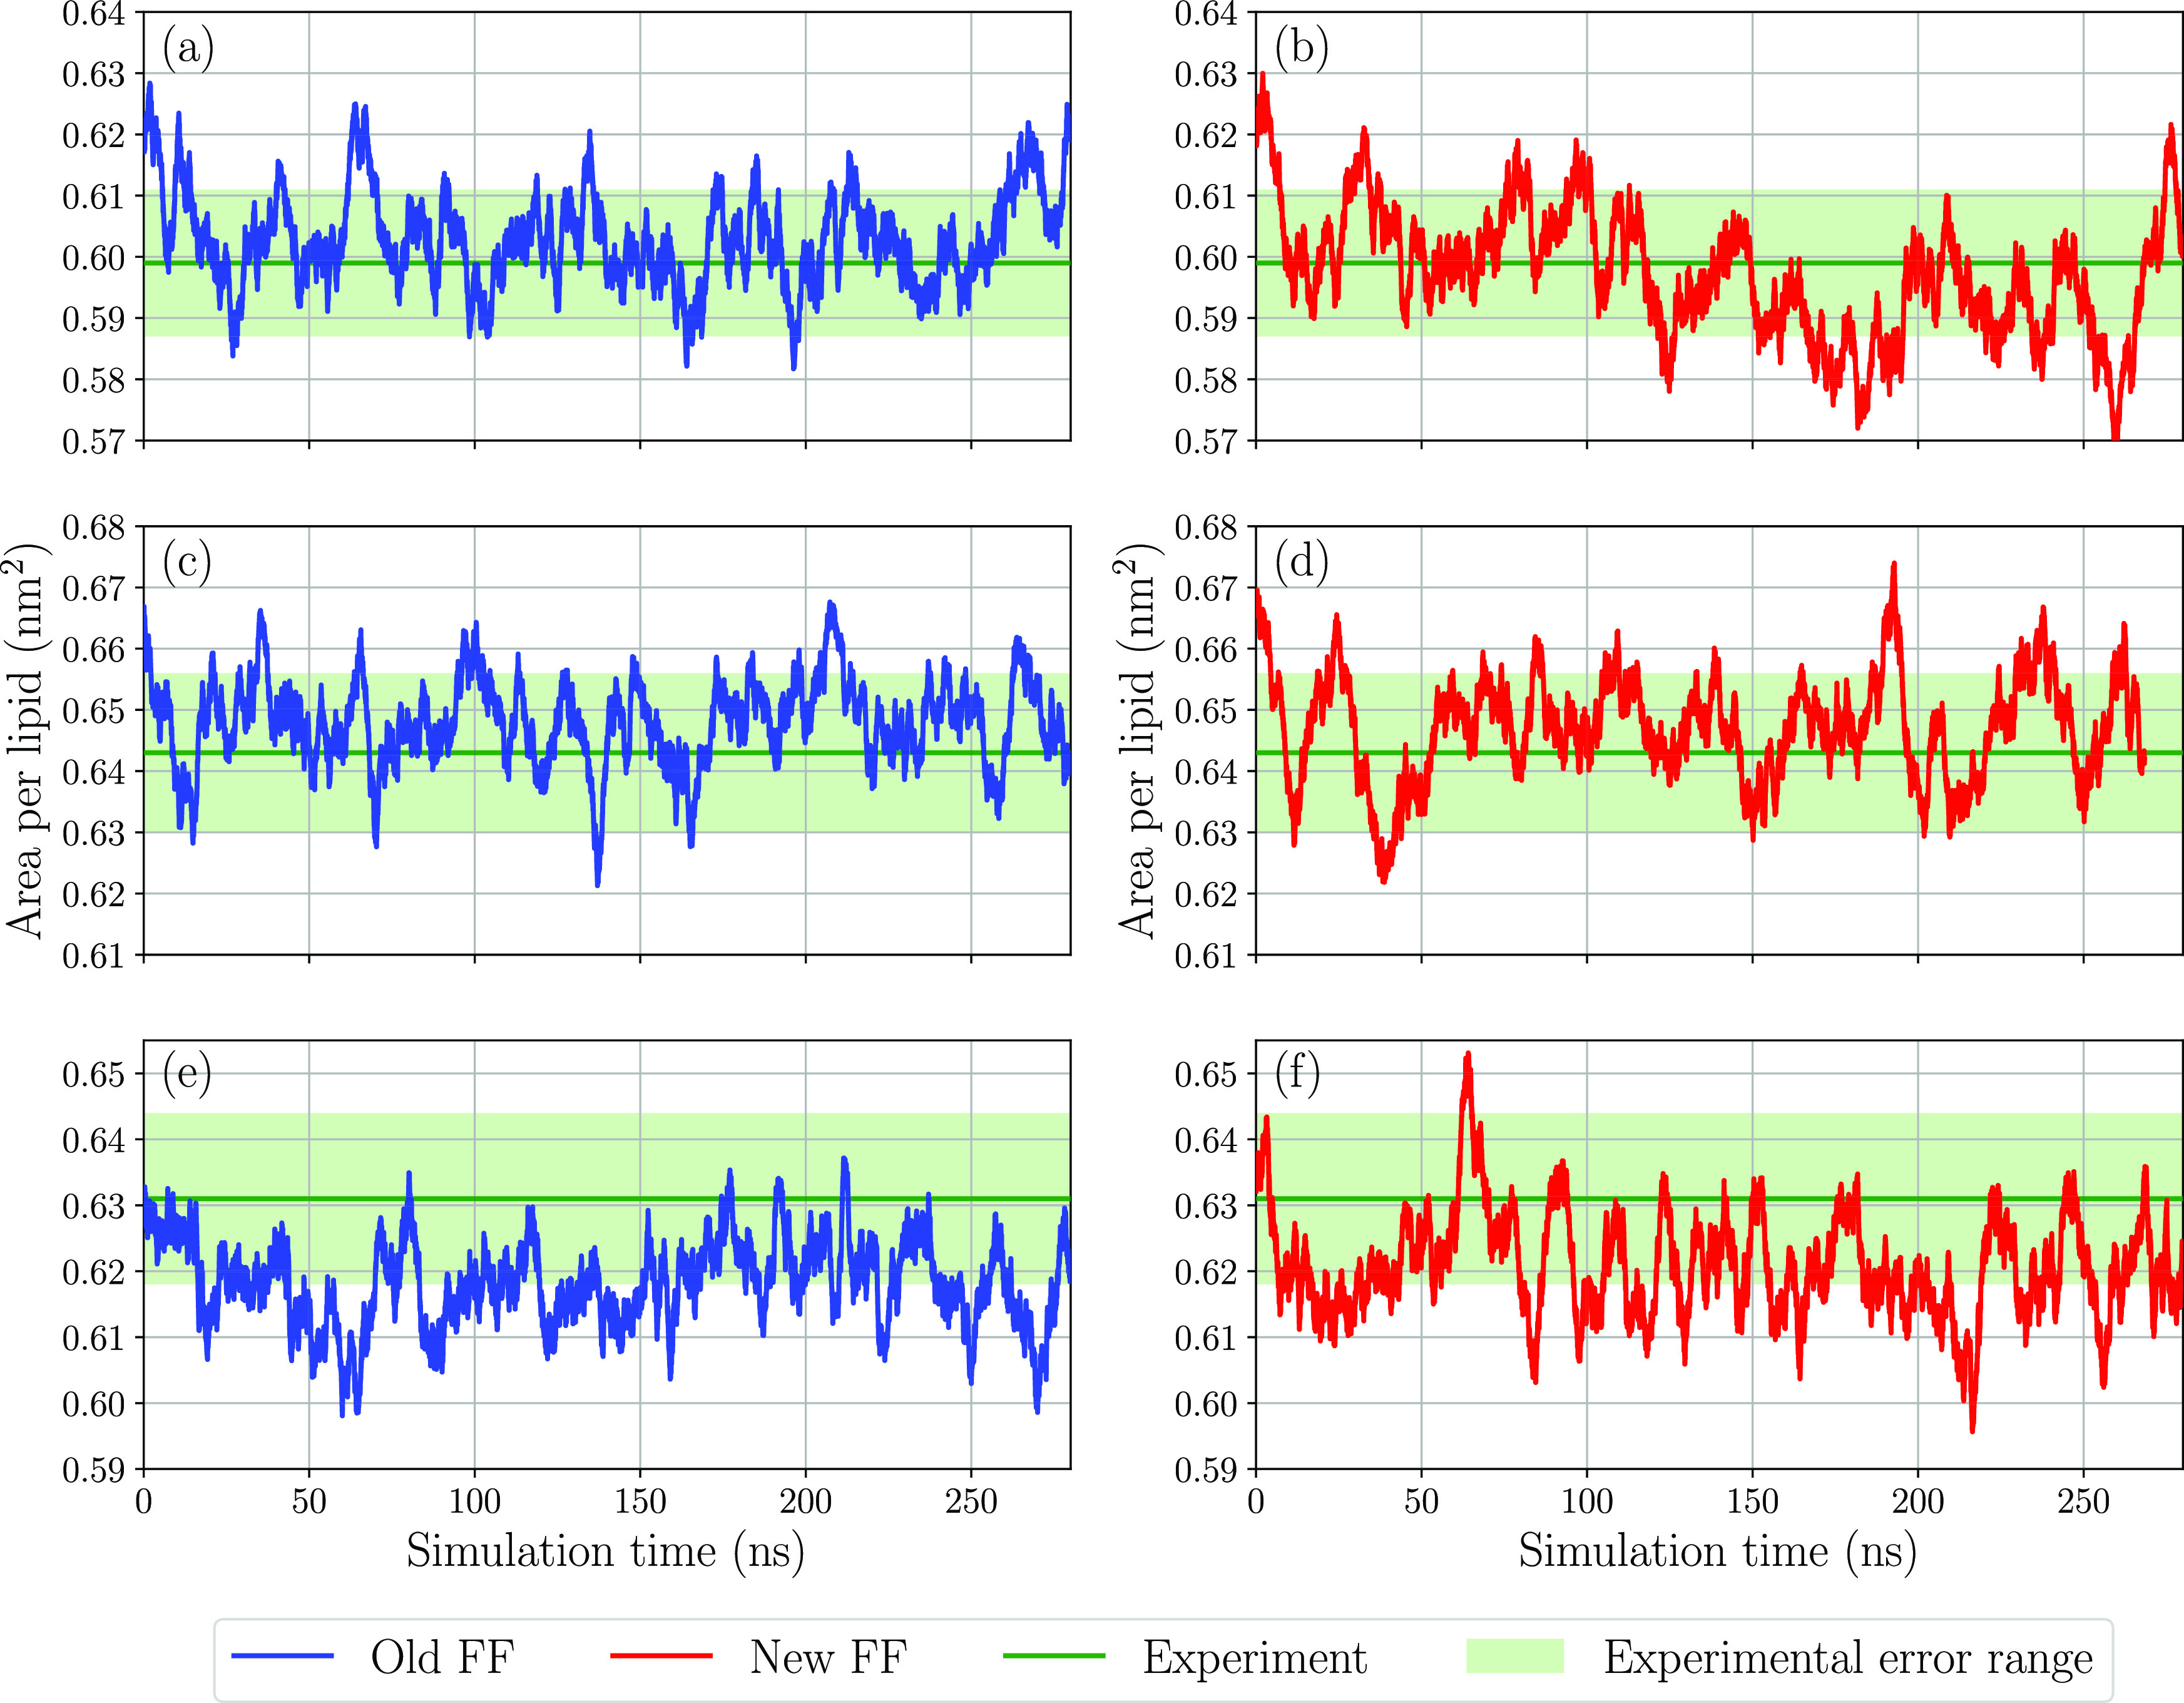
Area per lipid as a function of simulation time for (a) DMPC old FF, (b) DMPC new FF, (c) POPC old FF, (d) POPC new FF, (e) DPPC old FF, and (f) DPPC new FF. Experimental10 values and error ranges are shown in green.
Table 3. Area per Lipid for Bilayer Systems Simulated Using the New and Old Force Field and the Corresponding Experimental Values10a.
| area per
lipid (nm2) |
||||
|---|---|---|---|---|
| lipid | temp. (K) | old FF | new FF | exp. |
| DMPC | 303 | 0.603 | 0.596 | 0.599 |
| POPC | 303 | 0.648 | 0.647 | 0.643 |
| DPPC | 323 | 0.619 | 0.620 | 0.631 |
The uncertainties in area per lipid are within ±0.011 and ±0.013 nm2 for the values from simulations and experiments, respectively.
In addition to the area per lipid, another important property that governs the insertion of biomolecules, including membrane proteins, into the cell membrane is the bilayer thickness. From our simulations, we calculated the thickness according to two conventions both of which can be determined experimentally. The first is the distance between phosphate peaks in the electron density (DHH) and the second is the Luzzati thickness (DB) which is calculated according to eq 7
| 7 |
where dz is a distance along the z-direction (membrane normal) that is greater than the membrane thickness and ρw is the probability distribution of water. Table 4 shows the Luzzati thickness and the distance between the phosphate peaks, respectively, for the three studied systems together with experimental data.10,47−49 The new force field gives the Luzzati thickness in better agreement with experiment for DMPC and DPPC, while for POPC both models give the same result. Although the results from MD do not fall within the experimental error bars, they are all within 0.2 nm of the experimental values. For the distance between the phosphate peaks, it can be noted from Table 4 that the experimental values are within the error bars of the results obtained using the new force field for all systems. The experimental values are also within the error bars of the results obtained with the old force field for POPC and DPPC, but for DMPC the experimental value is just outside the error interval.
Table 4. Luzzati Thickness (DB) and Distance between Phosphate Units in the Headgroups (DHH) for the New and Old Force Field and Results from Experiment10,47−49 a.
|
DB (nm) |
DHH (nm) |
||||||
|---|---|---|---|---|---|---|---|
| lipid | temp. (K) | old FF | new FF | exp. | old FF | new FF | exp. |
| DMPC | 303 | 3.50 | 3.58 | 3.67 | 3.49 | 3.56 | 3.53 |
| POPC | 303 | 3.75 | 3.75 | 3.91 | 3.71 | 3.76 | 3.70 |
| DPPC | 323 | 3.82 | 3.84 | 3.90 | 3.79 | 3.83 | 3.80 |
The errors in the Luzzati and phosphate thickness from simulations are all less than ±0.04 and ±0.05 nm, respectively. The uncertainties in the experimental Luzzati thickness are all within ±0.08 nm.
Electron Density Profiles and Scattering Form Factors
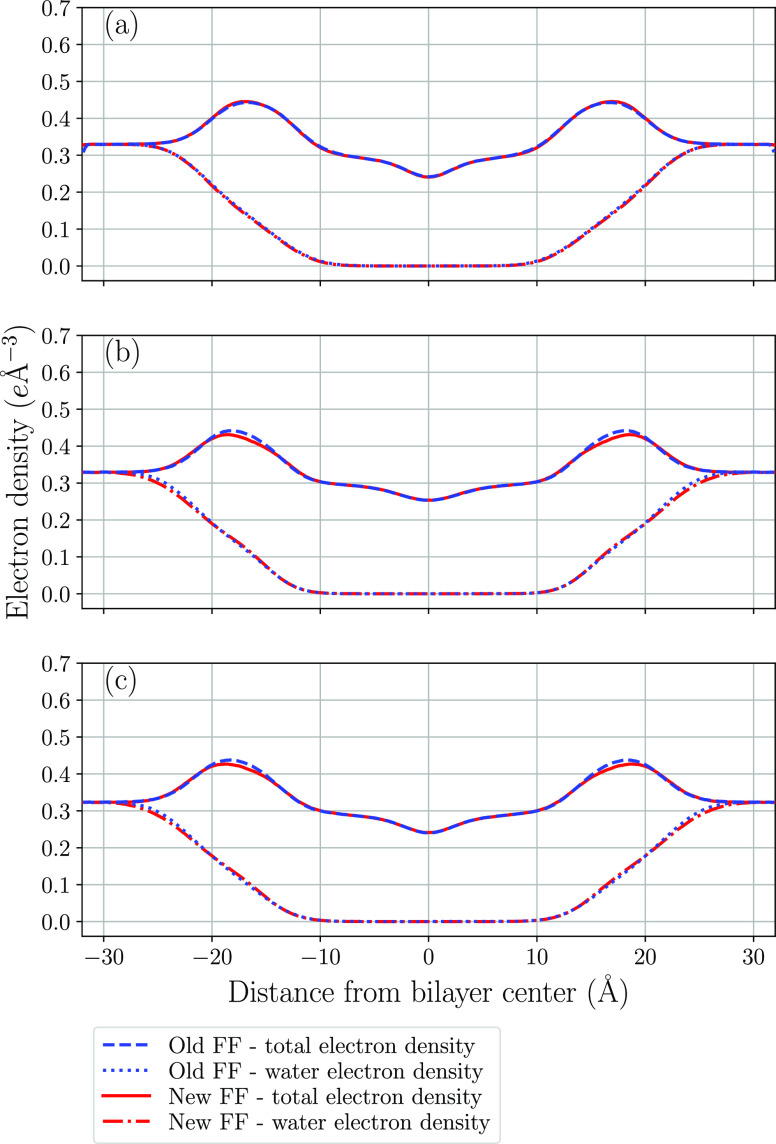
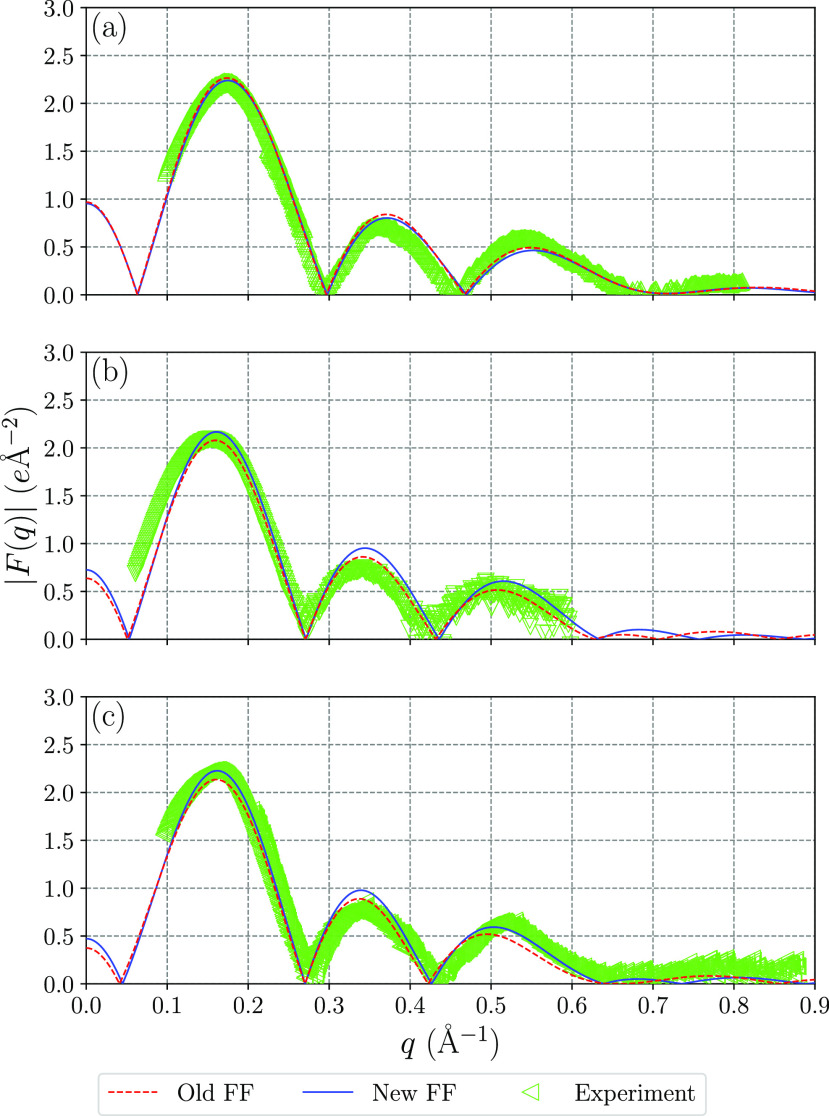
In order to investigate how well the new force field describes the overall structure of the lipid bilayer, electron density distributions were computed along the direction normal to the bilayer plane. Figure 6 shows the total electron density distribution and the contribution from water calculated with the new and old force fields for all three lipid bilayers. It can be noted that the results obtained using the two parameter sets are in close agreement with each other for the three investigated systems. Although X-ray scattering experiments probe these electron density distributions, obtaining them experimentally requires use of models which makes the comparison with simulations ambiguous. However, form factors are obtained by Fourier transformation of electron density according to eq 8 and can be directly compared with the scattered intensity observed experimentally
| 8 |
where ρ(z) is the electron density at distance z from the bilayer center along the normal and ρw is the electron density in bulk water. Figure 7 shows form factors calculated from the electron density distributions in Figure 6 together with experimental data. These results show that for the lipid bilayer systems investigated in this work both the old and new force fields give form factors in close agreement with X-ray scattering experiments.
Figure 6.
Electron density profiles for (a) DMPC, (b) POPC, and (c) DPPC.
Figure 7.
X-ray scattering form factors from simulations and experiment10,47,48 for (a) DMPC, (b) POPC, and (c) DPPC.
Area Compressibility
In order to investigate if the new force field correctly describes the area compressibility of the simulated lipid bilayers, we calculated it from fluctuations in the bilayer surface area A according to eq 9
| 9 |
where ⟨A⟩ is
the mean bilayer area,  is
the variance of the area, T is the temperature, and kB = 1.380649
× 10–23 J/K is Boltzmann’s constant.
This was done from 200 ns simulations performed using the Parinello–Rahman
barostat50 that gives the correct fluctuations
for the NPT ensemble. The area compressibilities from our MD simulations
are presented in Table 5 together with experimental values.51−53 The new force field
gives a lower area compressibility than the old parameter set. When
comparing the results from our simulations with experiments, it is
observed that the old force field gives closer agreement for DMPC
while the new parameter set performs better for DPPC. For POPC, the
area compressibilities obtained from both force fields are within
the range reported from experiment.
Table 5. Area Compressibility from Simulations and Experiments51−53.
| area compressibility (mN/m) |
||||
|---|---|---|---|---|
| lipid | temp. (K) | old FF | new FF | exp. |
| DMPC | 303 | 222 | 169 | 234 ± 23 |
| POPC | 303 | 300 | 212 | 180–330 |
| DPPC | 323 | 294 | 182 | 231 ± 20 |
Lateral Diffusion
In order to investigate how the new force field describes dynamics in the lipid bilayer, we calculated lateral diffusion coefficients. The diffusion coefficient was obtained from the mean square displacement (MSD) of lipids according to
| 10 |
where r(0) and r(t) are the positions of a lipid molecule’s center of mass in the plane of the bilayer at a time origin and at a later time t, respectively. The average is taken over all molecules and time origins on the trajectory. Experimentally, lateral diffusion coefficients are often measured using NMR spectroscopy54,55 or fluorescence recovery after photobleaching (FRAP).56 Lateral diffusion coefficients calculated from our and MD simulations are shown in Table 6 together with experimental values.54−56 It is noted that the diffusion coefficients calculated for DMPC and POPC using the new force field underestimate the experimental values reported in ref (54) by a factor of 3.3 and 4.3, respectively. This can be an artifact introduced by the periodic boundary conditions used in the simulations.57 Venable et al.58 have suggested an approach to estimate the periodic boundary condition effect based on the Saffman–Delbrük model for a cylinder of radius R diffusing in a lipid membrane. This analysis, described in the “Effect of Periodic Boundary Conditions on Lateral Diffusion Coefficients” section of the Supporting Information, suggested that diffusion under periodic boundary conditions is about 3 times slower compared to an infinite nonperiodic system. This indicates that the diffusion coefficients reported here can be in closer agreement with the NMR results54 than suggested by a direct comparison. Lateral diffusion coefficients for DMPC, POPC, and DPPC reported in the literature are scattered, for reasons described in ref (59), which complicates the comparison with the results obtained from MD. However, both the new and old force fields give diffusion coefficients on the order of 10–8 cm2/s, which is consistent with both NMR and FRAP results.54−56 This gives confidence that the new force field realistically describes lateral diffusion of lipids.
Table 6. Lateral Diffusion Coefficients from Simulations and Corresponding Experimental Values54−56 a.
| lateral
diffusion coefficient (10–8 cm2/s) |
||||
|---|---|---|---|---|
| lipid | temp. (K) | old FF | new FF | exp. |
| DMPC | 303 | 4.1 | 2.7 | 9.0; 1.6b |
| POPC | 303 | 3.9 | 2.5 | 10.7 |
| DPPC | 323 | 7.3 | 5.4 | 7; 1.0b |
The uncertainties in the calculated diffusion coefficients are all within ±1.1 cm2/s.
Measurement was conducted above the phase transition temperature (296 K for DMPC and 315 K for DPPC).
Cholesterol Content
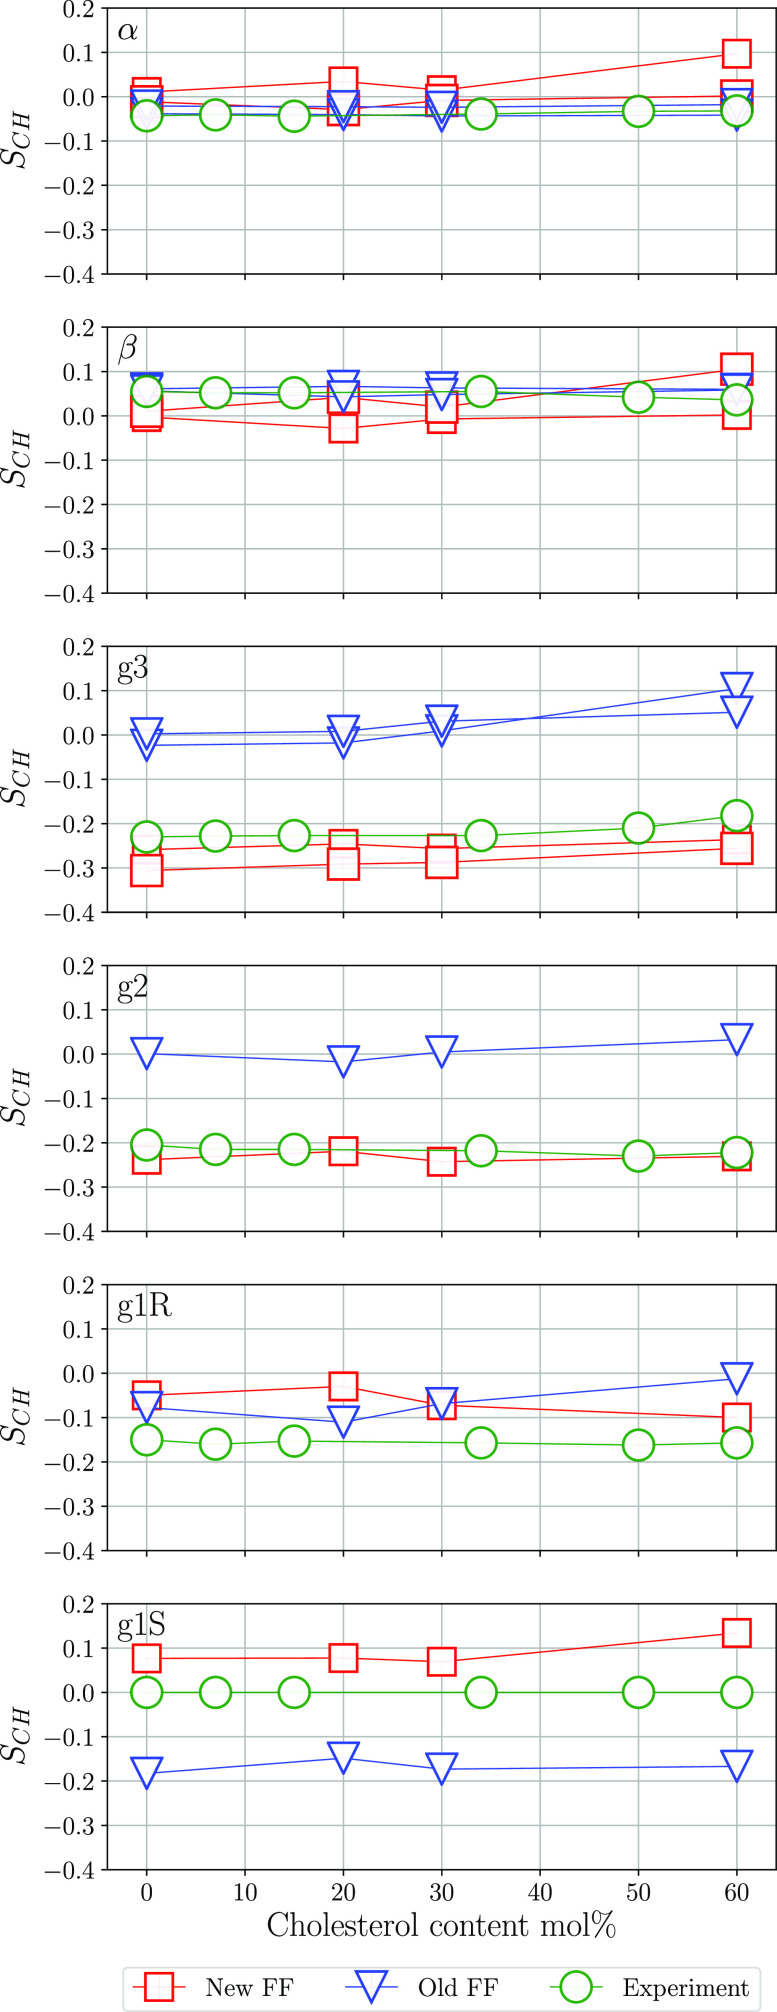
Cholesterol is an important component of the cell membrane that can make up to 30–50 mol % of its total lipid content in some tissues.60 Furthermore, cholesterol is known to rigidify and increase the ordering of hydrocarbon chains in lipid bilayers.19,45 However, order parameters in lipid headgroups show only a weak dependence on the cholesterol content45 which is not described correctly by force fields currently available.21 In order to investigate how the new force field describes these effects, we calculated order parameters for POPC bilayers with different cholesterol contents (20, 30, and 60 mol %). As expected, addition of cholesterol increases order parameters in the lipid tails, and this is discussed in the section “Effect of Cholesterol Content” of the Supporting Information. The results for the order parameters in the headgroup region of lipids as a function of cholesterol content are presented in Figure 8. It shows that both the old and new force fields have only a weak dependence of order parameters on cholesterol content, but the values of the order parameters obtained with the new parameter set show significantly better agreement with NMR experiments.45 This is most clearly seen for the g2 and g3 order parameters. The new force field is also closer to the experimental result45 for the g1S order parameter, while for g1R both models perform well. Also, α and β order parameters show reasonably good agreement with NMR data. Notably, for a cholesterol content of 20 and 60 mol %, a small forking of the α and β order parameters is obtained which is not observed experimentally.45
Figure 8.
Order parameters in the headgroup of POPC simulated using the new and old force fields at different cholesterol content and data from NMR experiment.45
Conclusion
In this work, a new strategy, based on simultaneous optimization of parameters to fit quantum chemical energies for an extensive set of molecular conformations, has been applied for deriving force field parameters for dihedral angles in headgroups of phosphatidylcholine lipids. The force field obtained using this scheme underwent extensive validation against a number of experimental properties including order parameters, area per lipid, area compressibility, bilayer thickness, scattering form factors, and lateral diffusion coefficients. Furthermore, we investigated the effect of cholesterol content on order parameters. It was shown that the new force field provides generally good agreement with experiment for all of these properties. Although the new parameter set does not succeed to reproduce all order parameters within experimental uncertainties, it gives significantly better agreement for order parameters in the glycerol moiety compared to the previous version of the Slipids force field. An important point is that the new parameters were derived exclusively on the basis of high quality quantum chemical (DFT) computations. We note that the lipid headgroup conformations used in this work were sampled from a trajectory simulated using the original version of the Slipids force field. These conformations can therefore be biased by the initial parameters that were used to generate them. For this reason, force field parametrization using the approach undertaken in this work should ideally be carried out as an iterative process. This will however require quantum chemical energies to be recalculated which is the most computationally expensive part in the parametrization procedure. Further development can include update of partial atomic charges and Lennard-Jones terms consistently using the same quantum chemistry method. Furthermore, a larger data set will give better statistics and reduce fluctuations in the energy surfaces with respect to the number of lipid fragments used in the optimization. The recent emergence of large databases of quantum chemical computations61 opens new possibilities for data-driven force field parametrization procedures. Such approaches will likely become increasingly important tools for constructing accurate force fields for various molecular systems in the future. Our work shows that such an approach carried out even on a limited scale can provide substantial improvement in force field development.
Acknowledgments
This work has been supported by the Swedish Research Council (Vetenskapsrådet). The computations were performed on resources provided by the Swedish National Infrastructure for Computing (SNIC) through High Performance Computer Center North (HPC2N).
Supporting Information Available
The Supporting Information is available free of charge at https://pubs.acs.org/doi/10.1021/acs.jpcb.0c06386.
The authors declare no competing financial interest.
Supplementary Material
References
- Singer S. J.; Nicolson G. L. The Fluid Mosaic Model of the Structure of Cell Membranes. Science 1972, 175, 720–731. 10.1126/science.175.4023.720. [DOI] [PubMed] [Google Scholar]
- Cohen S.; Valm A. M.; Lippincott-Schwartz J. Interacting Organelles. Curr. Opin. Cell Biol. 2018, 53, 84–91. 10.1016/j.ceb.2018.06.003. [DOI] [PMC free article] [PubMed] [Google Scholar]
- Wu L.-G.; Hamid E.; Shin W.; Chiang H.-C. Exocytosis and Endocytosis: Modes, Functions, and Coupling Mechanisms. Annu. Rev. Physiol. 2014, 76, 301–331. 10.1146/annurev-physiol-021113-170305. [DOI] [PMC free article] [PubMed] [Google Scholar]
- Gadsby D. C. Ion Channels Versus Ion Pumps: the Principal Difference, in Principle. Nat. Rev. Mol. Cell Biol. 2009, 10, 344–352. 10.1038/nrm2668. [DOI] [PMC free article] [PubMed] [Google Scholar]
- Harayama T.; Riezman H. Understanding the Diversity of Membrane Lipid Composition. Nat. Rev. Mol. Cell Biol. 2018, 19, 281–296. 10.1038/nrm.2017.138. [DOI] [PubMed] [Google Scholar]
- Rappolt M. In Chapter 9 The Biologically Relevant Lipid Mesophases as “Seen” by X-Rays; Liu A. L., Ed.; Advances in Planar Lipid Bilayers and Liposomes; Academic Press: 2006; Vol. 5, pp 253–283. [Google Scholar]
- Leftin A.; Brown M. F. An NMR Database for Simulations of Membrane Dynamics. Biochim. Biophys. Acta, Biomembr. 2011, 1808, 818–839. 10.1016/j.bbamem.2010.11.027. [DOI] [PMC free article] [PubMed] [Google Scholar]
- Seelig J.; Waespe-Sarcevic N. Molecular Order in cis and trans Unsaturated Phospholipid Bilayers. Biochemistry 1978, 17, 3310–3315. 10.1021/bi00609a021. [DOI] [PubMed] [Google Scholar]
- Brown M. F.; Ribeiro A. A.; Williams G. D. New View of Lipid Bilayer Dynamics from 2H and 13C NMR Relaxation Time Measurements. Proc. Natl. Acad. Sci. U. S. A. 1983, 80, 4325–4329. 10.1073/pnas.80.14.4325. [DOI] [PMC free article] [PubMed] [Google Scholar]
- Kucerka N.; Nieh M.-P.; Katsaras J. Fluid Phase Lipid Areas and Bilayer Thicknesses of Commonly Used Phosphatidylcholines as a Function of Temperature. Biochim. Biophys. Acta, Biomembr. 2011, 1808, 2761–2771. 10.1016/j.bbamem.2011.07.022. [DOI] [PubMed] [Google Scholar]
- Kučerka N.; Kiselev M. A.; Balgavý P. Determination of Bilayer Thickness and Lipid Surface Area in Unilamellar Dimyristoylphosphatidylcholine Vesicles from Small-Angle Neutron Scattering Curves: A Comparison of Evaluation Methods. Eur. Biophys. J. 2004, 33, 328–334. 10.1007/s00249-003-0349-0. [DOI] [PubMed] [Google Scholar]
- Lyubartsev A. P.; Rabinovich A. L. Force Field Development for Lipid Membrane Simulations. Biochim. Biophys. Acta, Biomembr. 2016, 1858, 2483–2497. 10.1016/j.bbamem.2015.12.033. [DOI] [PubMed] [Google Scholar]
- Pabst G.; Kučerka N.; Nieh M.-P.; Rheinstädter M.; Katsaras J. Applications of Neutron and X-ray Scattering to the Study of Biologically Relevant Model Membranes. Chem. Phys. Lipids 2010, 163, 460–479. 10.1016/j.chemphyslip.2010.03.010. [DOI] [PubMed] [Google Scholar]
- Berger O.; Edholm O.; Jähnig F. Molecular Dynamics Simulations of a Fluid Bilayer of Dipalmitoylphosphatidylcholine at Full Hydration, Constant Pressure, and Constant Temperature. Biophys. J. 1997, 72, 2002–2013. 10.1016/S0006-3495(97)78845-3. [DOI] [PMC free article] [PubMed] [Google Scholar]
- Klauda J. B.; Venable R. M.; Freites J. A.; O’Connor J. W.; Tobias D. J.; Mondragon-Ramirez C.; Vorobyov I.; MacKerell A. D. Jr; Pastor R. W. Update of the CHARMM All-Atom Additive Force Field for Lipids: Validation on Six Lipid Types. J. Phys. Chem. B 2010, 114, 7830–7843. 10.1021/jp101759q. [DOI] [PMC free article] [PubMed] [Google Scholar]
- Dickson C. J.; Rosso L.; Betz R. M.; Walker R. C.; Gould I. R. GAFFlipid: A General Amber Force Field for the Accurate Molecular Dynamics Simulation of Phospholipid. Soft Matter 2012, 8, 9617–9627. 10.1039/c2sm26007g. [DOI] [Google Scholar]
- Jämbeck J. P. M.; Lyubartsev A. P. Derivation and Systematic Validation of a Refined All-Atom Force Field for Phosphatidylcholine Lipids. J. Phys. Chem. B 2012, 116, 3164–3179. 10.1021/jp212503e. [DOI] [PMC free article] [PubMed] [Google Scholar]
- Jämbeck J. P. M.; Lyubartsev A. P. An Extension and Further Validation of an All-Atomistic Force Field for Biological Membranes. J. Chem. Theory Comput. 2012, 8, 2938–2948. 10.1021/ct300342n. [DOI] [PubMed] [Google Scholar]
- Jämbeck J. P. M.; Lyubartsev A. P. Another Piece of the Membrane Puzzle: Extending Slipids Further. J. Chem. Theory Comput. 2013, 9, 774–784. 10.1021/ct300777p. [DOI] [PubMed] [Google Scholar]
- Paloncýová M.; Fabre G.; DeVane R. H.; Trouillas P.; Berka K.; Otyepka M. Benchmarking of Force Fields for Molecule–Membrane Interactions. J. Chem. Theory Comput. 2014, 10, 4143–4151. 10.1021/ct500419b. [DOI] [PubMed] [Google Scholar]
- Botan A.; Fernando F.; Francois P.; Fuchs J.; Javanainen M.; Kanduc M.; Kulig W.; Lamberg A.; Loison C.; Lyubartsev A. P.; et al. Towards Atomistic Resolution Structure of Phosphatidylcholine Headgroup and Glycerol Backbone at Different Ambient Conditions. J. Phys. Chem. B 2015, 119, 15075–15088. 10.1021/acs.jpcb.5b04878. [DOI] [PMC free article] [PubMed] [Google Scholar]
- Niemelä P. S.; Ollila S.; Hyvönen M. T.; Karttunen M.; Vattulainen I. Assessing the Nature of Lipid Raft Membranes. PLoS Comput. Biol. 2007, 3, e34. 10.1371/journal.pcbi.0030034. [DOI] [PMC free article] [PubMed] [Google Scholar]
- Högberg C.-J.; Lyubartsev A. P. Effect of Local Anesthetic Lidocaine on Electrostatic Properties of a Lipid Bilayer. Biophys. J. 2008, 94, 525–531. 10.1529/biophysj.107.104208. [DOI] [PMC free article] [PubMed] [Google Scholar]
- Kasimova M. A.; Tarek M.; Shaytan A. K.; Shaitan K. V.; Delemotte L. Voltage-Gated Ion Channel Modulation by Lipids: Insights from Molecular Dynamics Simulations. Biochim. Biophys. Acta, Biomembr. 2014, 1838, 1322–1331. 10.1016/j.bbamem.2014.01.024. [DOI] [PubMed] [Google Scholar]
- Leonard A. N.; Wang E.; Monje-Galvan V.; Klauda J. B. Developing and Testing of Lipid Force Fields with Applications to Modeling Cellular Membranes. Chem. Rev. (Washington, DC, U. S.) 2019, 119, 6227–6269. 10.1021/acs.chemrev.8b00384. [DOI] [PubMed] [Google Scholar]
- Poger D.; Caron B.; Mark A. E. Validating Lipid Force Fields Against Experimental Data: Progress, Challenges and Perspectives. Biochim. Biophys. Acta, Biomembr. 2016, 1858, 1556–1565. 10.1016/j.bbamem.2016.01.029. [DOI] [PubMed] [Google Scholar]
- Antila H.; Buslaev P.; Favela-Rosales F.; Ferreira T. M.; Gushchin I.; Javanainen M.; Kav B.; Madsen J. J.; Melcr J.; Miettinen M. S.; et al. Headgroup Structure and Cation Binding in Phosphatidylserine Lipid Bilayers. J. Phys. Chem. B 2019, 123, 9066–9079. 10.1021/acs.jpcb.9b06091. [DOI] [PubMed] [Google Scholar]
- Catte A.; Girych M.; Javanainen M.; Loison C.; Melcr J.; Miettinen M. S.; Monticelli L.; Määttä J.; Oganesyan V. S.; Ollila O. S.; et al. Molecular Electrometer and Binding of Cations to Phospholipid Bilayers. Phys. Chem. Chem. Phys. 2016, 18, 32560–32569. 10.1039/C6CP04883H. [DOI] [PubMed] [Google Scholar]
- Ollila O. S.; Pabst G. Atomistic Resolution Structure and Dynamics of Lipid Bilayers in Simulations and Experiments. Biochim. Biophys. Acta, Biomembr. 2016, 1858, 2512–2528. 10.1016/j.bbamem.2016.01.019. [DOI] [PubMed] [Google Scholar]
- Hopkins C. W.; Roitberg A. E. Fitting of Dihedral Terms in Classical Force Fields as an Analytic Linear Least-Squares Problem. J. Chem. Inf. Model. 2014, 54, 1978–1986. 10.1021/ci500112w. [DOI] [PubMed] [Google Scholar]
- Hopfinger A.; Pearlstein R. Molecular Mechanics Force-Field Parameterization Procedures. J. Comput. Chem. 1984, 5, 486–499. 10.1002/jcc.540050510. [DOI] [Google Scholar]
- Fong D. C.-L.; Saunders M. LSMR: An Iterative Algorithm for Sparse Least-Squares Problems. SIAM J. Sci. Comput. 2011, 33, 2950–2971. 10.1137/10079687X. [DOI] [Google Scholar]
- Lindahl E.; Abraham M. J.; Hess B.; van der Spoel D.. GROMACS 2019 Source Code; 2018; 10.5281/zenodo.2424363. [DOI] [Google Scholar]
- Lyubartsev A. P.; Laaksonen A. M. DynaMix–A Scalable Portable Parallel MD Simulation Package for Arbitrary Molecular Mixtures. Comput. Phys. Commun. 2000, 128, 565–589. 10.1016/S0010-4655(99)00529-9. [DOI] [Google Scholar]
- Hockney R. W.; Goel S.; Eastwood J. Quiet High-Resolution Computer Models of a Plasma. J. Comput. Phys. 1974, 14, 148–158. 10.1016/0021-9991(74)90010-2. [DOI] [Google Scholar]
- Essmann U.; Perera L.; Berkowitz M. L.; Darden T.; Lee H.; Pedersen L. G. A Smooth Particle Mesh Ewald Method. J. Chem. Phys. 1995, 103, 8577–8593. 10.1063/1.470117. [DOI] [Google Scholar]
- Páll S.; Hess B. A Flexible Algorithm for Calculating Pair Interactions on SIMD Architectures. Comput. Phys. Commun. 2013, 184, 2641–2650. 10.1016/j.cpc.2013.06.003. [DOI] [Google Scholar]
- Bussi G.; Donadio D.; Parrinello M. Canonical Sampling through Velocity Rescaling. J. Chem. Phys. 2007, 126, 014101. 10.1063/1.2408420. [DOI] [PubMed] [Google Scholar]
- Berendsen H. J. C.; Postma J. P. M.; van Gunsteren W. F.; DiNola A.; Haak J. R. Molecular Dynamics with Coupling to an External Bath. J. Chem. Phys. 1984, 81, 3684–3690. 10.1063/1.448118. [DOI] [Google Scholar]
- Jorgensen W. L.; Chandrasekhar J.; Madura J. D.; Impey R. W.; Klein M. L. Comparison of Simple Potential Functions for Simulating Liquid Water. J. Chem. Phys. 1983, 79, 926–935. 10.1063/1.445869. [DOI] [Google Scholar]
- Petrache H. I.; Dodd S. W.; Brown M. F. Area Per Lipid and Acyl Length Distributions in Fluid Phosphatidylcholines Determined by 2H NMR Spectroscopy. Biophys. J. 2000, 79, 3172–3192. 10.1016/S0006-3495(00)76551-9. [DOI] [PMC free article] [PubMed] [Google Scholar]
- Seelig J.; Waespe-Sarcevic N. Molecular Order in cis and trans Unsaturated Phospholipid Bilayers. Biochemistry 1978, 17, 3310–3315. 10.1021/bi00609a021. [DOI] [PubMed] [Google Scholar]
- Gross J. D.; Warschawski D. E.; Griffin R. G. Dipolar Recoupling in MAS NMR: A Probe for Segmental Order in Lipid Bilayers. J. Am. Chem. Soc. 1997, 119, 796–802. 10.1021/ja962951b. [DOI] [Google Scholar]
- Hong M.; Schmidt-Rohr K.; Nanz D. Study of Phospholipid Structure by 1H, 13C, and 31P Dipolar Couplings from Two-Dimensional NMR. Biophys. J. 1995, 69, 1939–1950. 10.1016/S0006-3495(95)80064-0. [DOI] [PMC free article] [PubMed] [Google Scholar]
- Ferreira T. M.; Coreta-Gomes F.; Ollila O. S.; Moreno M. J.; Vaz W. L.; Topgaard D. Cholesterol and POPC Segmental Order Parameters in Lipid Membranes: Solid State 1 H–13 C NMR and MD Simulation Studies. Phys. Chem. Chem. Phys. 2013, 15, 1976–1989. 10.1039/C2CP42738A. [DOI] [PubMed] [Google Scholar]
- Seelig J.; Gally H.-U.; Wohlgemuth R. Orientation and Flexibility of the Choline Head Group in Phosphatidylcholine Bilayers. Biochim. Biophys. Acta, Biomembr. 1977, 467, 109–119. 10.1016/0005-2736(77)90188-2. [DOI] [PubMed] [Google Scholar]
- Kučerka N.; Nagle J. F.; Sachs J. N.; Feller S. E.; Pencer J.; Jackson A.; Katsaras J. Lipid Bilayer Structure Determined by the Simultaneous Analysis of Neutron and X-ray Scattering Data. Biophys. J. 2008, 95, 2356–2367. 10.1529/biophysj.108.132662. [DOI] [PMC free article] [PubMed] [Google Scholar]
- Kučerka N.; Liu Y.; Chu N.; Petrache H. I.; Tristram-Nagle S.; Nagle J. F. Structure of Fully Hydrated Fluid Phase DMPC and DLPC Lipid Bilayers using X-ray Scattering from Oriented Multilamellar Arrays and from Unilamellar Vesicles. Biophys. J. 2005, 88, 2626–2637. 10.1529/biophysj.104.056606. [DOI] [PMC free article] [PubMed] [Google Scholar]
- Kučerka N.; Tristram-Nagle S.; Nagle J. F. Structure of Fully Hydrated Fluid Phase Lipid Bilayers with Monounsaturated Chains. J. Membr. Biol. 2006, 208, 193–202. 10.1007/s00232-005-7006-8. [DOI] [PubMed] [Google Scholar]
- Parrinello M.; Rahman A. Polymorphic Transitions in Single Crystals: A New Molecular Dynamics Method. J. Appl. Phys. 1981, 52, 7182–7190. 10.1063/1.328693. [DOI] [Google Scholar]
- Rawicz W.; Olbrich K. C.; McIntosh T.; Needham D.; Evans E. Effect of Chain Length and Unsaturation on Elasticity of lipid Bilayers. Biophys. J. 2000, 79, 328–339. 10.1016/S0006-3495(00)76295-3. [DOI] [PMC free article] [PubMed] [Google Scholar]
- Binder H.; Gawrisch K. Effect of Unsaturated Lipid Chains on Dimensions, Molecular Order and Hydration of Membranes. J. Phys. Chem. B 2001, 105, 12378–12390. 10.1021/jp010118h. [DOI] [Google Scholar]
- Nagle J. F.; Tristram-Nagle S. Structure of Lipid Bilayers. Biochim. Biophys. Acta, Rev. Biomembr. 2000, 1469, 159–195. 10.1016/S0304-4157(00)00016-2. [DOI] [PMC free article] [PubMed] [Google Scholar]
- Filippov A.; Orädd G.; Lindblom G. Influence of Cholesterol and Water Content on Phospholipid Lateral Diffusion in Bilayers. Langmuir 2003, 19, 6397–6400. 10.1021/la034222x. [DOI] [Google Scholar]
- Wu E.; Jacobson K.; Papahadjopoulos D. Lateral Diffusion in Phospholipid Multibilayers Measured by Fluorescence Recovery After Photobleaching. Biochemistry 1977, 16, 3936–3941. 10.1021/bi00636a034. [DOI] [PubMed] [Google Scholar]
- Fahey P.; Webb W. Lateral Diffusion in Phospholipid Bilayer Membranes and Multilamellar Liquid Crystals. Biochemistry 1978, 17, 3046–3053. 10.1021/bi00608a016. [DOI] [PubMed] [Google Scholar]
- Camley B. A.; Lerner M. G.; Pastor R. W.; Brown F. L. Strong Influence of Periodic Boundary Conditions on Lateral Diffusion in Lipid Bilayer Membranes. J. Chem. Phys. 2015, 143, 243113. 10.1063/1.4932980. [DOI] [PMC free article] [PubMed] [Google Scholar]
- Venable R. M.; Ingólfsson H. I.; Lerner M. G.; Perrin B. S. Jr; Camley B. A.; Marrink S. J.; Brown F. L.; Pastor R. W. Lipid and Peptide Diffusion in Bilayers: The Saffman–Delbrück Model and Periodic Boundary Conditions. J. Phys. Chem. B 2017, 121, 3443–3457. 10.1021/acs.jpcb.6b09111. [DOI] [PMC free article] [PubMed] [Google Scholar]
- Wohlert J.; Edholm O. Dynamics in Atomistic Simulations of Phospholipid Membranes: Nuclear Magnetic Resonance Relaxation Rates and Lateral Diffusion. J. Chem. Phys. 2006, 125, 204703. 10.1063/1.2393240. [DOI] [PubMed] [Google Scholar]
- Miao L.; Nielsen M.; Thewalt J.; Ipsen J. H.; Bloom M.; Zuckermann M. J.; Mouritsen O. G. From Lanosterol to Cholesterol: Structural Evolution and Differential Effects on Lipid Bilayers. Biophys. J. 2002, 82, 1429–1444. 10.1016/S0006-3495(02)75497-0. [DOI] [PMC free article] [PubMed] [Google Scholar]
- Ghahremanpour M. M.; Van Maaren P. J.; Van Der Spoel D. The Alexandria Library, A Quantum-Chemical Database of Molecular Properties for Force Field Development. Sci. Data 2018, 5, 180062. 10.1038/sdata.2018.62. [DOI] [PMC free article] [PubMed] [Google Scholar]
Associated Data
This section collects any data citations, data availability statements, or supplementary materials included in this article.


