

Abstract
1. Triclocarban is a residue-producing antibacterial agent used in a variety of consumer products. These studies investigated the disposition and metabolism of [14C]triclocarban.
2. In male rats following a single gavage administration of 50, 150, and 500 mg/kg, excretion was primarily via feces (feces, 85-86%; urine, 3-6%) with no apparent dose-related effect. In male rats, 29% of the administered dose was excreted in bile suggesting some of the fecal excretion is from the absorbed dose which was excreted to the intestine via bile.
3. The tissue retention of radioactivity was low in male rats (24 h, 3.9%; 72 h, 0.1%).
4. Disposition pattern following gavage administration of 50 mg/kg in female rats and male and female mice were similar to male rats.
5. Plasma elimination half-life of triclocarban in rats following gavage administration was shorter (~ 2 h) compared to that based on total radioactivity (≥ 9 h) which included all products of triclocarban.
6. Absorption following a single dermal application of 1.5 or 3% was low (≤ 3%) in rodents.
7. Hydroxylated and conjugated metabolites of triclocarban predominated in bile.
8. In hepatocytes, clearance of triclocarban in mouse and human was similar and was faster than in rat.
Keywords: antibacterial agent, triclocarban, absorption, distribution, metabolism, excretion
Introduction
Triclocarban (3,4,4’-trichlorocarbanilide) is a residue-producing antibacterial agent that was found in soaps, detergents, health and skincare products, and household cleaners typically up to 1.5%. As it was being used as a replacement for triclosan, production of triclocarban increased from 10,000 pounds in 1986 to as much as 10 million pounds in 2002, making it a high production volume chemical (https://comptox.epa.gov/dashboard/chemical_lists/EPAHPV). However, following the issuance of a proposed rule by the U.S. Federal Drug Administration (FDA) in 2013 regulating its usage due to potential health risks such as bacterial resistance, the production declined to <25,000 pounds in 2014 (EPA, 2019). Under the FDA’s proposed rule, the manufacturers were required to provide to the FDA additional data on the safety and effectiveness of the antibacterial agents used in consumer products. Due to failure of the manufacturers to submit this data to the FDA, in September 2016, the FDA finalized the rule banning 19 antimicrobial agents, including triclocarban, in over-the-counter (OTC) consumer antiseptic wash products (hand wash, body wash, and bar soap) which went into effect in September 2017 (21 C.F.R. § 330.545) (FDA, 2020). Though banned in consumer wash products in the U.S., triclocarban is still used in other countries (Yun et al., 2020).
Human exposure to triclocarban occurs primarily through the use of personal care products but can also occur through ingestion of contaminated food or drinking water and inhalation of triclocarban-containing dust (Ashrap et al., 2018). Triclocarban is discharged directly to conventional wastewater treatment plants where it partitions predominantly into sewer sludge, also known as wastewater solids or biosolids, which are commonly disposed of on farmlands due to their organic benefit (Halden et al., 2017; Lozano et al., 2018; Yun et al., 2020). Triclocarban is a persistent environmental pollutant and has been detected at high concentrations in agricultural soil over three years after a single application of municipal biosolids (Halden and Paull, 2005; Ying et al., 2007; Walters et al., 2010; Thelusmond et al., 2018). Photolysis and bacterial degradation of triclocarban results in the formation of 4-chloroaniline (Miller et al., 2010; Ding et al., 2013) a chemical classified as a possible human carcinogen (IARC, 1993). Studies examining food crops have shown accumulation of triclocarban in lettuce, collard, pepper, tomato, radish, soybean, pumpkin and zucchini with concentrations ranging from 2.6-14000 μg/kg (Wu et al., 2010; Wu et al., 2012; Huynh et al., 2018). Triclocarban enters surface and drinking waters via agricultural runoff or through wastewater effluent (Harnly et al., 2007; Yun et al., 2020) where it remains among the most commonly detected organic water contaminants (Miller et al., 2008; Brausch and Rand, 2011; Thelusmond et al., 2018). Worldwide surface and drinking water concentrations range from 0.05-6750 ng/L with median values ranging from 10-100 ng/L (Yun et al., 2020). Triclocarban makes its way into the air via a number of household or industrial products including cleaning solutions, clothing, toys, carpets, plastics, flooring, furniture, and paints (Halden et al., 2017; Fahimipour et al., 2018). Dust samples collected from hospitals, athletic facilities, and homes contained triclocarban at concentrations ranging from 20-9760 ng/g with a median concentration of 270 ng/g (Hartmann et al., 2016; Chen et al., 2018). The ubiquitous nature of triclocarban poses a potential risk to human health.
Triclocarban has been identified as an endocrine toxicant in a number of species including mollusks, fish, mice, and rats, affecting embryonic development, body weight, reproductive tissue weights, circulating hormones, gene expression, and pup mortality (Rochester et al., 2017). In a recent study by Costa et al., following exposure of pregnant Wistar rats to 0.3, 1.5 and 3.0 mg/kg from gestational day 0 to lactational day 21, a decrease in estradiol levels were noted in F1 females (Costa et al., 2020). In addition, a decrease in progesterone levels and an increase in pre-implantation loss in the TCC 3.0 mg/kg group was reported in adulthood. Authors suggested that the decrease in progesterone biosynthesis could interfere with implantation process. Exposure to triclocarban has been studied in several cell models with effects ranging from changes in estrogen and androgen receptor-mediated activity and HSP30 and CAT expression (markers of cellular stress) to altered steroid biosynthesis and cytotoxicity (Rochester et al., 2017). Triclocarban inhibited aromatase activity in a dose dependent manner in JEG-3 cells, a model for human placental steroid production (Li et al., 2017). A cohort study measuring triclocarban and its metabolite 3’-Cl-triclocarban in maternal third trimester urine and umbilical cord blood plasma, described decreased gestational age at birth and low birth weight in neonates (Geer et al., 2017). Triclocarban has been detected in serum of pregnant women in China (Li et al., 2020) in toenails of a Chinese population (Yin et al., 2016) and in human urine samples throughout the world (Vimalkumar et al., 2018) demonstrating exposure.
An evaluation of absorption, distribution, metabolism, and excretion (ADME) and toxicokinetics (TK) data in the literature for triclocarban identified few studies in rats focusing primarily on the metabolism of triclocarban following oral administration and a lack of comprehensive disposition data in rodents following potential routes of exposure such as oral and dermal. Hiles (1977) investigated the ADME of [14C]triclocarban in male Sprague Dawley rats following gavage administration (5-10 μCi/animal) and dermal application (13-15 μCi/animal in a soap formulation). Following oral dosing, 4-6% and 86-89% of the administered dose was recovered in urine and bile, respectively, 72 h after dosing. After dermal application, ~ 7-8% of the applied dose was absorbed and the majority of the absorbed dose was recovered in bile (77-82%) with minor amount in urine (13-16% of the absorbed dose) (Hiles, 1977). In a limited rat and mouse dermal study design, following application of soap containing 1.5% triclocarban, 1.1% and 1.5% of the applied dose, respectively, was remaining at the dose site skin (Demetrulias et al., 1984).
In general, several Phase 1 metabolites were reported in bile, feces, and urine with 3’ and 2’-hydroxy-triclocarban identified as the main metabolites although other hydroxylated metabolites (6hydroxy-triclocarban, 2’−6-dihydroxy-triclocarban) were identified (Jeffcoat et al., 1977; Birch et al., 1978; Hiles and Birch, 1978a; Hiles and Birch, 1978b; Warren et al., 1978; Ye et al., 2011). In these studies, the presence of Phase 2 metabolites was also demonstrated following deconjugation experiments. The most comprehensive investigation was following a 20-d exposure in rats to exposure concentrations between 2 and 318 μmol/kg/d [14C] triclocarban via feed (Hiles and Birch, 1978b). Plasma levels of total triclocarban (both conjugated and unconjugated forms) increased more than proportional to the exposure concentration above 60 μmol/kg/d. Following termination of exposure, triclocarban-derived radioactivity showed a monophasic elimination (half-life 50-60 h) at exposure concentrations < 60 μmol/kg/d and biphasic elimination (alpha half-life 5-12 h and beta half-life 50-60 h) at exposure concentration > 60 μmol/kg/d.
In a species comparison study after oral exposure of rat, monkey, and human to [14C]triclocarban, the major plasma and urinary metabolites identified in the primates were N-glucuronides, which is in contrast to what was observed in rats, where N-glucuronides were not detected (Birch et al., 1978). Metabolites common in all three species were sulfate and glucuronide conjugates of 2’-, 3’- and 6-hydroxy triclocarban. In humans (n = 6), following a single oral dose of 2.2 μmol/kg [14C]triclocarban, 70% and 27% of the administered dose was recovered in feces and urine, respectively; major metabolites detected were N-and N’-triclocarban glucuronide and 2’-hydroxy and 6-hydroxy triclocarban sulfate (Hiles and Birch, 1978a). In another human study (n = 6) following a 28-day intensive bathing regimen using a soap containing 2% triclocarban during showering (~ 260 mg triclocarban/day exposure), triclocarban was not detected in blood or urine during or shortly after end of study (Howes and Black, 1976). In a study by Schebb et al, following showering with a commercial bar soap containing 0.6% triclocarban, the absorption was estimated as 0.6% TCC of the 70 ± 15 mg of triclocarban in the soap used (Schebb et al., 2011). Continuous daily use of the soap led to steady state levels of excretion in urine with N-glucuronides detected as the major metabolites excreted. The levels excreted varied widely among the subjects.
As highlighted above, studies in the literature focus primarily on the metabolism of triclocarban and lacks full disposition data. Hence, we designed studies to investigate the ADME of triclocarban in Hsd:Sprague Dawley® SD® (HSD) rats and B6C3F1/N mice, the two rodent models used in the National Toxicology Program studies, following a single gavage administration and dermal application to generate complete disposition data. For an initial investigation of human relevance, comparative clearance and metabolism was investigated in vitro in hepatocytes from rat, mouse, and human.
Materials and methods
Chemicals and reagents:
Triclocarban (CAS # 101-20-2; Lot # K034.1/14/5/003; COA purity 99.5%) was obtained from Parchem, New Rochelle, NY. The identity was confirmed by 1H and 13C NMR and liquid chromatography tandem mass spectrometry (LC-MS/MS). [14C]triclocarban (Lot # 745-098-030-A-20070803-JI; 30 mCi/mmol), labeled on the chlorophenol ring (Figure 1), was obtained from Moravek Biochemicals (La Brea, CA) and stored at −20°C. The radiochemical purity was determined to be 97.9% following chromatography using HPLC Method 1 (see below) coupled with liquid scintillation spectrometry (LSS) using a Packard 1900CA Tri-Carb Liquid Scintillation Analyzer (Perkin Elmer, Waltham, MA). Ultima Gold™ liquid scintillation cocktail and Soluene®−350 were purchased from PerkinElmer (Waltham, MA). [13C6]Triclocarban was obtained from Cambridge Isotope Laboratories, Inc. (Tewksbury, MA). All other reagents were obtained from commercial sources.
Figure 1.

Structure of triclocarban (* denotes the ring with [14C] label)
HPLC Method 1:
The HPLC instrumentation included two Waters (Milford, MA) 515 HPLC pumps, an Applied BioSystems (Foster City, CA) 759A absorbance detector, and a β-RAM Model 3 radioactivity detector with a 50-μL lithium glass solid scintillant cell (IN/US, Tampa, FL). A Phenomenex (Torrance, CA) Prodigy ODS3 column (250 × 4.6 mm, 5 μm) was used with mobile phase A: 75% aqueous acetonitrile and B: acetonitrile and a flow rate of 1 ml/min. The initial mobile phase composition of 100% A was held for 12 min before changing linearly to 100% B over 3 min, and then held at 100% B for 5 min before returning to initial conditions. The eluent monitored for both UV absorbance at 220 and 254 nm and radioactivity.
HPLC Method 2:
The system used and detection was the same as in HPLC Method 1. Mobile phases A: 10 mM ammonium acetate and B: acetonitrile, were used with an initial composition of 25% B was held of 2 min before changing linearly to 95% B over 13 min, and then held at 95% B for 3 min before returning to initial conditions.
LC-MS Method 1:
The LC-MS instrumentation consisted of a Thermo LTQ Orbitrap Velos mass spectrometer equipped with a FTMS analyzer (Thermo, Waltham, MA) coupled with a Waters Acquity UPLC system (Milford, MA) using a βRAM 5 (IN/US, Tampa, FL) radioactivity detector. A Phenomenex (Torrance, CA) Prodigy ODS3 (250 × 4.6 mm, 5 μm) was used with a flow rate of 1.0 mL/min. Mobile phases A: 10 mM ammonium acetate and B: acetonitrile were used with either an initial composition of 25% B changed linearly to 80% B over 15 min, then changed linearly 95% B over 2 min or an initial composition of 25% B held for 2 min, then changed linearly to 95% B over 13 min and held for 3 min. The mass spectrometer was operated in negative ion mode in a data-dependent fashion. The instrument resolution and mass range scanned were 30,000 and m/z 100-910, respectively.
LC-MS Method 2:
The LC-MS instrumentation consisted of an API 5000 Triple Quadrupole Mass Spectrometer (Applied Biosystems, Foster City, CA) with TurboIonSpray®source coupled with Waters Acquity Ultra Performance Liquid Chromatography (UPLC) system (Milford, MA). A Waters Acquity (Milford, MA) HSS C18 (50 × 2.1 mm, 1.8 μm) column was used with a flow rate of 0.3 mL/min. Mobile phases A: 10 mM ammonium acetate and B: 100% methanol were used with an initial composition of 50% B held for 0.5 min followed by a linear gradient to 10% B over 2 min, which was held for 1 min. The ion source was operated in negative ion mode with a source temperature of 500 °C and spray voltage of −2000 V. The transition monitored for quantitation of triclocarban was m/z 312.848 → 160.0 and for [13C6]triclocarban was m/z 318.848 → 160.0.
Animals and study design.
Studies were conducted at Mispro Biotech Services (RTP, NC), with Institutional Animal Care and Use Committee approval. Animals were housed in facilities that are fully accredited by the Association for Assessment and Accreditation of Laboratory Animal Care International. Animal procedures were in accordance with the “Guide for the Care and Use of Laboratory Animals” (NRC, 2011). Male and female Hsd:Sprague Dawley® SD® (HSD) rats, including the animals with closed loop bile catheters and jugular vein cannulas, were obtained from Envigo (Dublin, VA). B6C3F1/N mice were obtained from Taconic Farms (Germantown, NY). The animals were quarantined for at least one week before they were randomized into dosing groups for the study. Male mice and surgically prepared rats (bile duct catheter or jugular cannula) were housed individually. All animals had ad libitum access to certified, irradiated NTP 2000 feed (Ziegler Bros, Inc., Gardners, PA) and city (Durham, NC) tap water. Bile duct cannulated rats were offered water with 5% dextrose, 0.9% sodium chloride, and 0.05% KCl ad libitum from 4 h post dosing to termination. Environmental conditions included: room temperature 72 ± 3°F (22 ± 2 °C), relative humidity 35 to 65% and a 12-h light/dark cycle. Animals were acclimated overnight in individual metabolism cages prior to dosing and were returned to cages following dosing to allow for separate collection of excreta. TK study rats were housed individually in polycarbonate cages as described above. Animals were 8-10 weeks old at the time of dosing.
The study design is given in Table 1. Dose-response in disposition was investigated in male rats up to 72 h following a single oral administration of 50, 150, and 500 mg/kg [14C]triclocarban, representing 0.001X, 0.01X and 0.1X of the reported oral LD50 of triclocarban in rats (EPA, 2019). Sex and species differences were investigated in limited studies following a single oral administration of a 50 mg/kg [14C]triclocarban in female rats and male and female mice. Limited studies were also conducted to generate plasma TK parameters in HSD rats following a single gavage administration of 150 mg/kg. Disposition was also investigated following a single dermal application in male and female rats and mice. A dermal formulation concentration of 1.5% was selected to represent the percent of triclocarban used in consumer products; 3% was also included to investigate a higher dose. For initial investigation of human relevance, comparative clearance (1 μM) and metabolism (10 μM) was investigated in vitro in hepatocytes from rat, mouse, and humans.
Table 1.
Single gavage administration and dermal application study design of [14C]triclocarban in rodents
| Species (Sex) | Route | Dose (mg/kg) | Formulation concentration (%) | Study Duration (h) | Endpoint |
|---|---|---|---|---|---|
| Rat (M) | Gavage | 50, 150, 500 | - | 72 | Dose response |
| Rat (M) | Gavage | 50 | - | 24 | Tissue distribution |
| Rat (M) | Gavage | 50 | - | 48 | Biliary excretion |
| Rat (F) | Gavage | 50 | - | 72 | Sex difference |
| Rat (M)a | Dermal | - | 1.5, 3 | 72 | Route difference |
| Rat (M)b | Dermal | - | 1.5 | 72 | Route difference |
| Rat (F)a | Dermal | - | 1.5 | 72 | Route difference |
| Mouse (M, F) | Gavage | 50 | - | 72 | Species difference |
| Mouse (M, F)a | Dermal | - | 1.5 | 72 | Species and route difference |
| Rat (M, F) | Gavage | 150 | - | 32 | Toxicokinetic study |
Covered dose site.
Uncovered dose site.
Formulation and administration of triclocarban.
All dose formulations contained [14C]triclocarban and unlabeled triclocarban to achieve the final desired triclocarban concentration and specific activity. The target radioactivity per animal was ~ 50 μCi/rat and 10 μCi/mouse. Oral formulations were prepared by first dissolving both [14C]triclocarban and unlabeled triclocarban in acetone. The acetone was removed by rotary evaporation in a tare-weighed round bottom flask. The flask was reweighed to ensure that all the acetone was removed. An appropriate amount of the resulting [14C]triclocarban was weighed and dissolved in corn oil to prepare gavage formulations or in acetone to prepare dermal formulations. A single oral dose was administered in a volume of 5 mL/kg for rat and 10 mL/kg for mouse by intragastric gavage. Dermal dose formulations were prepared similarly in acetone. A single dermal dose was applied at 0.5 mL/kg for rat and 1.25 mL/kg for mouse. The dermal doses were applied onto a 4 cm2 (2 cm x 2 cm) for rats (1 cm2 for mice) area of skin on the animals’ backs. Approximately 24 h prior to dosing, animals were anesthetized with isoflurane by inhalation. Fur was clipped from the animals’ backs and the clipped area was wiped with a wet gauze, dried, and then examined for nicks. Any animals with nicks in the clipped area were excluded from the study. The outline of the dosing area was inscribed on the animal with a permanent-type felt tip marker. The animals were then placed in individual metabolism cages for overnight acclimation. Prior to dosing rats, a protective foam appliance was glued onto the rats’ backs using Hollister’s Medical Adhesive. The dermal doses were administered evenly to the dose area using a blunt device (Hamilton® syringe fitted with a 20-gauge ball-tipped feeding needle) and spread as evenly as possible over the dose site. A non-occlusive cloth cover was attached over the appliance prior to returning the rat to its cage. For mice, a metal mesh appliance was secured over the dose site with cyanoacrylate glue following dose administration as described for rats. For dermal dose groups designated for no protective appliance, doses were administered as described with the omission of the appliance. After dosing all animals were returned to metabolism cages.
The concentration of [14C]triclocarban in the dose formulations was determined by LSS analysis of weighed aliquots of formulations collected before, during, and after dosing for a total of five aliquots sampled on the day of dosing. Radiochemical purity of each formulation was assessed using HPLC Method 2 on the day of dosing and was ≥ 97.7%.
Collection and analysis of biological samples in disposition studies.
Urine and feces were collected into round-bottom flasks cooled over dry ice at 8 (urine only) and 24 h, and at 24-h intervals through study termination. Any urine present in the bladder at the time of necropsy was added to the final urine collection vessels. At the end of each 24 h excreta collection, the cages were rinsed with water and ethanol and the rinsate was stored separately from urine.
For collection of bile, the closed-loop bile duct catheters were prepared for bile collection by severing the loop and extending the section of tubing that was inserted into the bile duct with additional vinyl tubing. The tubing extension terminated in an amber vial into which bile was collected. Rats were fitted with harnesses and tethers which allowed their free movement within the cage and protected the bile catheter. Bile was collected over the intervals 0-4, 4-8, 8-12, 12-24, 24-32, and 32-48 h at room temperature, weighed, and then stored in the dark at −20 °C until analyzed.
For 50 and 500 mg/kg male rat groups only, volatile organic compounds (VOCs) and expired CO2were collected at 8, 24, 48, and 72 h after dosing as described elsewhere (Waidyanatha et al., 2019). VOC trap contents were stored at −20 °C; CO2 trap contents were stored at room temperature.
At the termination of each study group, the animals were euthanized by asphyxiation with CO2 and blood was collected via cardiac puncture and added to tubes containing K2EDTA. Plasma was prepared by centrifugation at 2000 g for 10 min at 4 °C. The following organs and tissues were collected and weighed: liver, kidney, heart, lung, spleen, brain, bladder, thyroid, pancreas, testes or uterus and ovaries, small intestine, large intestine, cecum and stomach (all gastrointestinal (GI) tract tissues were collected without contents) and samples of muscle (hind leg), abdominal skin and adipose (perirenal). The contents from the GI tract were combined by animal. The GI tract tissues were rinsed with deionized water and the rinsate was collected separately. At the termination of dermal studies, following euthanasia and the collection of blood by cardiac puncture, the protective appliance was gently pulled away from the skin, placed in a Nalgene container and extracted with acetone. The dose site skin was excised, then rinsed with water and then ethanol, and wiped gently with a series of wet gauze. The gauzes were combined in a bottle with acetone for analysis. The dose site skin and skin rinsates were collected for analysis.
All samples were stored at −20 °C until analysis. Samples were prepared and analyzed for radioactivity content by LSS with external standards quench correction as described elsewhere (Waidyanatha et al., 2019). A Debra™ data collection and reporting system (LabLogic Systems, Ltd., Sheffield, England) was used for calculation of all radiolabel disposition data. For determination of total [14C]triclocarban in dispersed tissues, the total rat weight was assumed to be comprised of 7.4% blood, 4.3% plasma, 7.0% adipose, 40.4% muscle, and 19% skin and the total mouse weight was assumed to be comprised of 4.9% blood, 2.8% plasma, 7.0% adipose, 38.4% muscle, and 16.5% skin (Brown et al., 1997).
Profiling and identification of metabolites.
Pooled rat feces (0-24 h, 50 mg aliquots) and bile (pooled 12 and 24 h collections containing the highest radioactivity) were extracted first with 250 μL of 1:1 water:acetonitrile followed by 2 extractions with 250 μL and 500 μL acetonitrile. Each tube was vortexed for 2 min and centrifuged for 5 min at 3000 g. Supernatants were combined and aliquots were analyzed for total radioactivity by LSS to estimate extraction recoveries. The recoveries were ~ 95% compared to an unextracted aliquot suggesting complete extraction of radioactivity using this procedure. Plasma collected 24 h following administration of a 50 mg/kg dose was used for metabolite identification. Plasma proteins were precipitated by adding 1:3 (v:v) methanol, mixed, and centrifuged at 4000 rpm for 10 min.
Bile, feces or plasma extracts were analyzed by LC-MS Method 1 for metabolite identification. Fifty (50) μL of supernatant was removed and mixed with 450 μL of 10 mM ammonium acetate. Mass spectra were analyzed with Compound Discoverer (2.0) software (Thermo Scientific, Waltham, MA). Metabolites were identified based on predicted metabolite masses, isotope distributions, and fragmentation on MS/MS.
Collection and analysis of plasma from toxicokinetic studies.
Approximately 500 μL of blood was collected at 5, 15, 30, 45 min, and 1, 2, 4, 8, 12, 18, 24, and 48 h after a single gavage administration from one animal per timepoint using K3-EDTA as an anticoagulant. Each animal was sampled four times; interim samples were obtained from the jugular catheter and the final sample from each animal was obtained via cardiac puncture and as much blood as possible was collected. The exact times for blood collection were recorded for each animal and time point. Blood was put on wet ice soon after collected. Plasma was isolated from an aliquot of blood by centrifugation (2800g for 10 min at 4 °C) within 60 min of collection. Duplicate aliquots of plasma (20-50 mg) were analyzed for total radioactivity by LSS. For quantitation of triclocarban, 50 μL of plasma was mixed with 150 μL of acetonitrile containing 50 ng/mL (13C6)triclocarban. Samples were centrifuged at 4000 rpm for 10 min and 50 μL of supernatant was mixed with 450 μL of 10 mM ammonium acetate for analysis.
Two stock solutions of triclocarban at 1 mg/mL were prepared in acetonitrile. Working solutions were prepared in water using alternate stock solutions. Calibration curves (concentration range 10 to 2500 ng/mL) were prepared in plasma in triplicate using working solutions similar to above for study samples. Plasma quality control (QC) samples were prepared at 33, 167, and 667 ng/mL. All standards and samples were analyzed using LC-MS Method 2. Concentrations were calculated using the peak area ratio of analyte to internal standard and the regression equation. The analytical method was linear (r > 0.99), with acceptable accuracy (relative error, RE ≤ ± 20%) and precision (relative standard deviation, RSD ≤ 20%), for all calibration standards and QC samples.
The total radioactivity and triclocarban concentration in plasma versus time data, respectively, were analyzed using non-compartmental and one compartmental models (with first order input and output), using Phoenix WinNonlin 6.3 (Pharsight, Cary, NC). Samples with concentrations below the LOQ (1 ng/mL) were excluded from the analysis.
In vitro studies.
The clearance (1 μM) (males and females) and metabolism (10 μM) (males only) of triclocarban were investigated in human, B6C3F1 mouse and Sprague Dawley rat cryopreserved hepatocytes. Plasma protein binding was investigated in HSD rat, B6C3F1/N mouse, and human plasma.
Human (Caucasian, 18-57 years of age, pooled hepatocytes (CryostaX™) from n = 6; male lot 1610049; female lot 1610050) were obtained from Xenotech LLC (Lenexa, KS). Harlan Sprague Dawley (HSD) rat, 8-10 weeks old; male lot RSD202; female lot, RSD297) and mouse (B6C3F1/N, 8-10 weeks, male lot MXX107, female lot MXX109) hepatocytes were obtained from) Triangle Research Laboratories (RTP, NC). Cells were thawed and resuspended according to the suppliers’ protocol. Viability was assessed by trypan blue exclusion. The cell concentrations were 0.58 to 0.84× 10⁶ cells/mL and viabilities were between 73-87%.
Triclocarban stock solution was prepared at 10 mM in acetone and diluted to 0.1 mM in DMSO such that the final concentration of DMSO in the incubation was ≤ 1%. Incubations to determine clearance were performed at a final concentration of 1 μM. Incubations were performed in triplicate with 1 mL cell suspension in 24-well polystyrene cell culture plates in a 37°C incubator with 5% CO2 atmosphere. Incubations of media (no hepatocytes) were carried out to assess analyte losses over the duration of the experiment; no losses of analytes were observed. Following the addition of triclocarban, aliquots (50 μL) were removed from the incubation at 0, 15, 30, 60, 120, and 180 min and added to 150 μL acetonitrile containing [13C6]triclocarban (50 ng/mL). Each sample was vortexed and centrifuged (3500 g for 1 min at 4 °C), and supernatants were collected and stored at −70 °C until analysis. Standard curves were prepared and analyzed similar to above for plasma analysis for the TK study except that hepatocyte incubation medium was used instead of plasma and the concentration range was 1 to 1000 ng/mL. All standards and samples were analyzed using LC-MS Method 2 and triclosan concentration was determined as above for plasma.
Concentration versus time data from clearance studies were evaluated by noncompartmental analysis using Phoenix WinNonlin 6.3 and elimination half-lives (t½) were estimated. Intrinsic clearance (Clint, mL/(min/kg body wt.)) was calculated using the equation: Clint = 0.693/t1/2 * mL incubation/cells * 120 million cells/g liver * g liver/kg body wt. using the physiological parameters for liver weight of 25.7 g/kg body wt. for human, and 34 g/kg body wt. for rat and mouse (Brown et al., 1997; McGinnity et al., 2004).
To assess metabolite formation, [14C]triclocarban (0.3μCi, 10 μM) was incubated in triplicate with rat, mouse and human hepatocytes from males as described above. At 300 min following incubation, 1 mL acetonitrile was added to each sample, centrifuged at 11,000g for 1 min, and the supernatant was analyzed by HPLC Method 2 and LC-MS Method 1. Aliquots of supernatants were also assayed for radiochemical content by liquid scintillation spectroscopy (LSS) using a Packard 1900CA Tri-Carb Liquid Scintillation Analyzer (Perkin Elmer) to verify that the majority of the radioactivity was recovered in the supernatants.
To assess plasma protein binding, [14C] triclocarban was added to triplicate samples of HSD rat, B6C3F1/N mouse, and human plasma (BioReclamation IVT) to a final concentration of 10 μM. Two hundred microliters of [14C] triclocarban-enriched plasma was placed into the sample chamber of Rapid Equilibrium dialysis (RED) plates (Thermos Scientific, Waltham, MA) and 350 μL buffer containing 100 mM sodium phosphate and 150 mM sodium chloride was added to the buffer chamber and incubated for 4 h at 37°C with shaking at 100 rpm. The assay was run in triplicate for each species and each well (plasma and buffer) was sampled in duplicate with aliquots analyzed for radioactivity by LSS. Concurrently, spiked plasma in microcentrifuge tube was incubated under the same conditions to assess stability, with duplicate aliquots analyzed for radiochemical content at 0 and 4 h. Percent free (unbound) was determined using DPM/mL in the buffer chamber divided by the DPM/mL in the plasma sample chamber then multiplying by 100. Percent bound was determined by subtracting the percent free from 100.
Results
All study data are available in the NTP Chemical Effects in Biological Systems (CEBS) database: https://manticore.niehs.nih.gov/cebssearch/paper/14787/private/ADMETRIC
Disposition of [14C]triclocarban following gavage administration.
Disposition of radioactivity 72 h following a single gavage administration in male (50, 150, and 500 mg/kg) and female (50 mg/kg) rats are shown in Table 2. In male rats, administered dose was excreted mainly via feces (~ 85-86%) with small amounts excreted in urine (~ 3-6%) by 72 h, with no apparent dose-related effect in excretion. The secretion of radioactivity in bile was investigated up to 48 h in male rats following a single gavage dose of 50 mg/kg (Table 2). Bile collected at 4, 8, 12, 24, 32, and 48 h following dose administration contained 1.3, 2.6, 5.5, 10.8, 3.9, and 5.1% of the administrated dose, respectively totaling 29.2% of the administered dose recovered by 48 h (Table 2); this demonstrates that ≥ 29% of the dose excreted via feces following gavage administration is the absorbed dose which is excreted via bile. In addition, ~ 40% of the dose was recovered in feces in this group pointing to this as the unabsorbed dose.
Table 2.
Disposition of radioactivity following a single gavage administration of [14C]triclocarban in ratsa
| Sample | Collection Interval (h) | Percent of dose | |||||
|---|---|---|---|---|---|---|---|
| 72 h | 48 hc | 24 h | |||||
| Male | Male | Male | Female | Male | Male | ||
| 50 mg/kg | 150 mg/kg | 500 mg/kg | 50 mg/kg | 50 mg/kg | 50 mg/kg | ||
| Urineb | Subtotal | 4.46 ± 1.00 | 3.44 ± 1.26 | 5.75 ± 7.57 | 2.42 ± 0.18 | 7.91 ± 2.92 | 3.03 ± 0.65 |
| Feces | 0 – 24 | 54.7 ± 7.73 | 24.8 ± 27.1 | 55.8 ± 12.3 | 72.6 ± 11.8 | 16.9 ± 5.12 | 59.7 ± 12.8 |
| 24 – 48 | 27.7 ± 5.59 | 57.8 ± 26.5 | 27.1 ± 19.4 | 17.3 ± 10.3 | 25.9 ± 6.6 | - | |
| 48 – 72 | 2.63 ± 1.78 | 3.14 ± 1.92 | 1.87 ± 0.738 | 0.52 ± 0.45 | - | - | |
| Subtotal | 85.1 ± 2.68 | 85.7 ± 2.83 | 84.8 ± 11.2 | 90.4 ± 2.88 | 42.8 ± 4.00 | 59.7 ± 12.8 | |
| Bile | 0 - 48 | - | - | - | - | 29. 2 ± 9.61 | - |
| GI contentsd | - | 0.11 ± 0.07 | 0.18 ± 0.09 | 0.10 ± 0.08 | 0.03 ± 0.02 | 1.15 ± 1.01 | 25.4 ± 11.2 |
| Tissuesd | - | 0.14 ± 0.04 | 0.21 ± 0.13 | 0.10 ± 0.04 | 0.10 ± 0.06 | 2.57 ± 1.2 | 3.85 ± 2.27 |
| Total recovered | - | 89.8 ± 2.31 | 89.5 ± 3.06 | 90.7 ± 4.58 | 93.0 ± 2.73 | 82.5 ± 3.15 | 92.6 ± 0.70 |
Mean (±SD) for N= 4 animals.
Combined 0-72, 0-48 or 0-24 h data shown since excretion is low in urine. Includes cage rinse and urine present in bladder at time of sacrifice.
Bile collection group.
Collected at study termination which is either 24, 48 or 72 h.
Excretion via exhaled CO2 and VOCs in the 50 and 500 mg/kg male rat groups was < 1% and hence collection of CO2 and VOCs was discontinued in subsequent groups. In female rats following administration of a 50 mg/kg gavage dose, ~ 90 and ~ 2% of the administered dose was recovered in feces and urine, respectively, over 72 h demonstrating no sex difference in excretion (Table 2). Radioactivity was distributed to all tissues examined in male rats with the concentration increasing with the dose administered (Table S1). The total radioactivity in tissues at 72 h in male and female rats was ≤ 0.2% (Table 2). In male rats following gavage dose of 50 mg/kg, the concentration of radioactivity in tissues (Table 2) at 24 h was higher than that in tissues at 72 h with a total of 3.9% administered dose recovered in tissues (Table 2). At 24 h, the highest concentrations in tissues were found in the liver, bladder, kidney, lung, plasma; the elevated levels found in GI tissues is likely from fecal contamination (Table S1). These data demonstrate low tissue retention of [14C]triclocarban-derived radioactivity in rats. The total administered dose recovered following gavage administration of [14C]triclocarban to rats ranged from 83-93% (Table 2).
Disposition of [14C]triclocarban in mice was investigated using a limited design. Following a single gavage administration of 50 mg/kg in male and female mice (Table 3), the disposition pattern was similar to that in rats. Of the administered dose, 73-75% and 3.3-4.7% was recovered in feces and urine, respectively, at 72 h following administration. As in rats, the total radioactivity recovered in tissues at 72 h was ~ 0.1%. Total dose recovered following gavage administration of [14C]triclocarban in male and female mice was ~ 78% (Table 3).
Table 3.
Disposition of radioactivity 72 h following a single gavage administration of [14C]triclocarban in micea
| Sample | Collection Interval (h) | Percent of dose | |
|---|---|---|---|
| Male | Female | ||
| 50 mg/kg | 50 mg/kg | ||
| Urineb | 0 - 72 | 3.32 ± 1.56 | 4.69 ± 1.35 |
| Feces | 0 – 24 | 68.9 ± 10.5 | 67.5 ± 6.25 |
| 24 – 48 | 5.6 ± 8.65 | 5.05 ± 4.59 | |
| 48 – 72 | 0.18 ± 0.10 | 0.40 ± 0.43 | |
| Subtotal | 74.7 ± 2.3 | 73.0 ± 7.53 | |
| GI contentsc | 0.01 ± 0.00 | 0.02 ± 0.00 | |
| Tissuesc | 0.10 ± 0.018 | 0.12 ± 0.021 | |
| Total recovered | 78.2 ± 2.42 | 77.8 ± 8.41 | |
Mean (±SD) for N= 4 animals.
Combined 0-72 h data shown since excretion is low in urine. Includes cage rinse and urine present in bladder at time of sacrifice.
Collected at study termination which is 72 h.
Toxicokinetics of [14C]triclocarban following gavage administration.
Plasma toxicokinetic parameters of triclocarban was estimated in a limited design following gavage administration of 150 mg/kg in male and female rats. Total radioactivity concentrations in blood and plasma were very similar and hence total radioactivity in plasma and triclocarban in plasma were used to estimate TK parameters. Plasma total radioactivity versus time data were evaluated using non-compartmental analysis, and plasma triclocarban concentration versus time data were analyzed using a one-compartment model, the model that fits the data best, and corresponding plots are shown in Figures 2A and 2B, respectively. Toxicokinetic parameters are given in Table 4.
Figure 2.
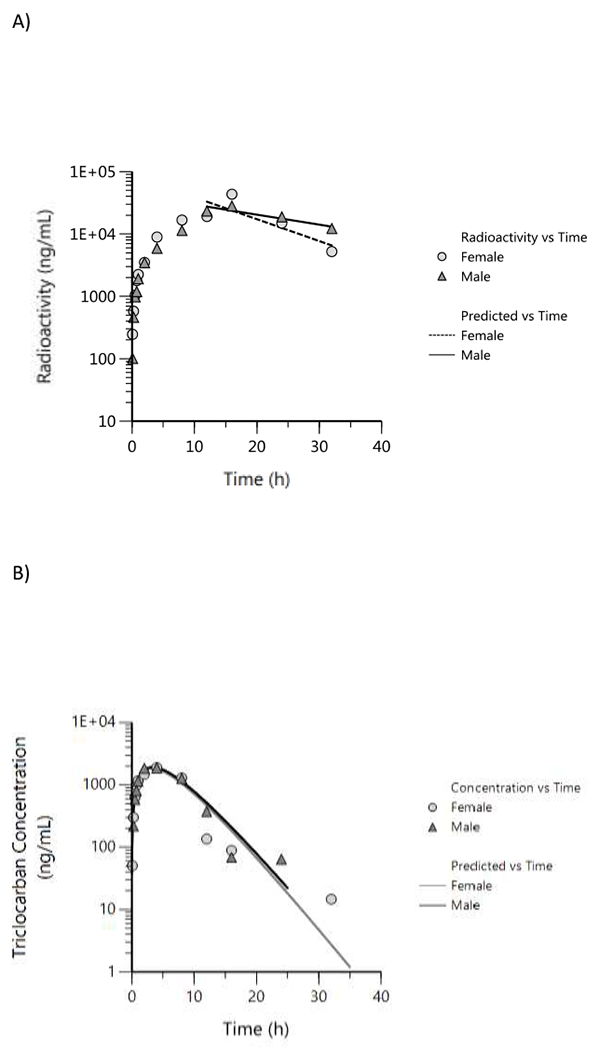
Plasma concentration versus time profiles following a single gavage administration of 150 mg/kg [14C]triclocarban in male and female rats. A) Total radioactivity (data were evaluated using a non-compartmental analysis), B) Parent triclocarban (data were fitted using a one-compartment model with first order input and first order output). One animal per timepoint was sampled.
Table 4.
Plasma toxicokinetic parameters following a single gavage administration of 150 mg/kg [14C]triclocarban in male and female ratsa. Data are presented based on both the [14C] triclocarban-derived total radioactivity and parent triclocarban concentration.
| Parameter | Male | Female |
|---|---|---|
| [14C] Triclocarban-derived total radioactivitya | ||
| Cmax (ng/mL) | 28100 | 43400 |
| Tmax (h) | 16.0 | 16.0 |
| Lamda half-life (h) | 18.8 | 8.58 |
| AUCINF_PRED (h*ng/mL) | 885000 | 659000 |
| Triclocarban b | ||
| Cmax-pred (ng/mL) | 1914 | 1834 |
| Tmax-pred (h) | 3.4 | 3.3 |
| K01 half-Life (h) | 2.32 | 2.26 |
| K10 half-Life (h) | 2.32 | 2.27 |
| Cl/F (mL/h/kg) | 8620 | 9207 |
| V/F (mL/kg) | 28860 | 30161 |
| AUC (h*ng/mL) | 17402 | 16293 |
| Percent of AUCtriclocarban/AUCtotal radioactivity | 1.96 | 2.47 |
Based on non-compartmental analysis of [14C]-derived total radioactivity.
Based on one-compartment model with first order input and output.
Based on total radioactivity, the time (Tmax) to reach the maximum plasma concentration, Cmax, was 16 h following administration, in both male and female rats. Plasma elimination half-life (lambda half-life) was longer in males (~ 19 h) compared to females (~ 9 h) Table 4). The systemic exposure parameters, Cmax, and AUC were similar amongst males and females (Table 4). Tmax of parent triclocarban was reached much faster in both males and females (~ 3 h) compared to Tmax of total radioactivity (16 h). In both sexes, plasma elimination of parent triclocarban was rapid (~ 2 h) compared to total radioactivity (16 h) where all triclocarban-derived products were considered, without any sex difference, compared to elimination of total radioactivity (male, ~ 19 h; female, 9 h). The systemic exposure parameters, Cmax and AUC, were also similar in both sexes for parent triclocarban.
Disposition of [14C]triclocarban following dermal application.
Disposition of radioactivity 72 h following a single dermal application of 1.5 or 3% [14C]triclocarban to a covered dose site was investigated in male and female rats and mice and corresponding data are summarized in Table 5. In rats, the concentration of 1.5 and 3% of the applied triclocarban was equivalent to a dose of 7.5 and 15 mg/kg, respectively. In both male and female rats following application of 1.5 or 3% formulation, [14C]triclocarban was poorly absorbed with total absorbed dose estimated ≤ 0.4% of the applied dose. The dose retained at the dose site skin was significant at 27-40% suggesting that this dose is penetrated through the skin and may be available for absorption overtime. Most of the applied dose was recovered as unabsorbed dose and was similar between the two formulation concentrations and sexes (~ 44 – 72%). Because of poor absorption, the radioactivity in most of the examined tissues were below detection. Following application of a 3% formulation to an uncovered dose site, the administered dose recovered was ~ 66% of the applied dose was (determined as combined excreta and tissues) in male rats suggesting that the majority of the dose internalized was via ingestion from grooming of the dose site (Table 5). The total administered dose recovered following dermal application of [14C]triclocarban in rats to a covered dose site was ~ 84-97% (Table 5).
Table 5.
Disposition of radioactivity 72 h following a single dermal application of [14C]triclocarban in rats and micea
| Sample | Percent of Dose Recovered | |||||
|---|---|---|---|---|---|---|
| Male ratb (1.5%, 7.5 mg/kg) |
Male ratb
(3%, 15 mg/kg) |
Female ratb (1.5%, 7.5 mg/kg) |
Male ratc (3%, 15 mg/kg) |
Male mouseb (1.5%, 18.75 mg/kg) |
Female mouseb
(1.5%, 18.75 mg/kg) |
|
| Urine | 0.12 ± 0.03 | 0.012 ± 0.014 | 0.04 ± 0.01 | 12.3 ± 0.8 | 1.00 ± 0.70 | 0.75 ± 0.59 |
| Feces | 0.12 ± 0.03 | 0.079 ± 0.057 | 0.042 ± 0.013 | 46.8 ± 5.7 | 1.56 ± 1.88 | 0.96 ± 0.86 |
| GI Tract Contents | 0.10 ± 0.02 | 0.02 ± 0.02 | 0.03 ± 0.02 | 2.97 ± 0.63 | 0.26 ± 0.24 | 0.09 ± 0.08 |
| Tissues | 0.031 ± 0.006 | 0.009 ± 0.009 | 0.013 ± 0.009 | 0.52 ± 0.11 | 0.09 ± 0.07 | 0.11 ± 0.14 |
| Total Absorbed Dosed | 0.37± 0.09 | 0.12 ± 0.10 | 0.13 ± 0.05 | 65.6 ± 8.59 | 2.91 ± 2.87 | 1.90 ± 1.49 |
| Dose Site Skine | 40.1 ± 2.67 | 24.3 ± 5.95 | 26.6 ± 10.0 | 7.48 ± 3.60 | 3.79 ± 1.60 | 1.99 ± 0.59 |
| Total Unabsorbed Dosef | 43.6 ± 3.2 | 72.3 ± 10.1 | 61.9 ± 10.1 | 7.8 ± 1.10 | 77.3 ± 4.7 | 82.2 ± 2.50 |
| Total Dose Recovered | 84.1 ± 3.12 | 96.7 ± 4.21 | 88.6 ± 1.95 | 80.8 ± 6.46 | 84.0 ± 3.00 | 86.1 ± 3.53 |
Mean ± SD for 4 animals
Covered dose site
Uncovered dose site
Total absorbed dose is the total administered dose recovered in excreta and tissues
Dose at dose site skin after removing the unabsorbed dose by washing the dose site
Total unabsorbed dose is the total administered dose recovered in dose site wipes, dose site rinses, and dermal appliance (in covered groups only).
Disposition of [14C]triclocarban in male and female mice was investigated following dermal application of 1.5% [14C]triclocarban to a covered dose site (Table 5). Based on the volume applied and body weight of mice, this concentration translates to 18.75 mg/kg in mice. Similar to rats, absorption of triclocarban in mice was poor (~2-3%), but in mice, a lower dose was found at the dose site skin (2-4%) than in rats (27-40%). The dose recovered following dermal application of [14C]triclocarban in male and female mice was ~ 84-86% (Table 5).
Profiling and identification of Triclocarban metabolites.
Bile (12-24 h pool containing the highest radioactivity) extracts were analyzed by LC-MS Method 1 to characterize metabolites which also included an inline radiochemical detector. Under these conditions, the major radioactive peak eluted at ~ 8 min (Peaks 3 and 4) with other discernable radioactive peaks ~ 10 (Peak 5), ~ 11 (Peak 6), and ~ 16 min (Peak 7); additional radioactivity peaks were found in the 5-8 min range (Peaks 1 and 2) (Figure 3, Table 6). Triclocarban eluted at ~ 16 min under these conditions. The largest radioactivity peaks eluting at ~ 8 min (Peaks 3 and 4) were identified as glucuronides of monohydroxylated triclocarban (triclocarban-O-glucuronides) as shown by the exact masses of m/z 505.0000 along with the unique isotope distribution patterns of 3 chlorine atoms (35Cl/37Cl) (Figures 4A and 4B). MS/MS analysis of the m/z 505 ions are shown in Figure 4C which confirms the glucuronide fragment m/z 175. Peak 4 fragmented similarly to the 2’-O-glucuronide (Schebb et al., 2012b), with fragment ions at m/z 300, 318, 329, and 344 (Figure 4C). Peak 3 eluting ~ 8 min had a fragmentation pattern similar to that of the 3’-O-glucuronide reported by the same authors (Schebb et al., 2012b), with fragment ions at m/z 344, 329, 318, 175, and 168 (spectrum not shown).
Figure 3.

Radiochemical profile of bile (12-24 h) following gavage administration of 150 mg/kg [14C]triclocarban in male rats. The profile shown is from the analysis using LC-MS/MS Method 2 coupled with inline radioactivity detector. Annotated peaks, 1 and 2: TCC-O-glucuronide, O-sulfate, 3 and 4: TCC-O-glucuronide 5: TCC-O-sulfates, 6: OH-TCC-O-sulfate, 7: di-OHTCC, OH-TCC and TCC.
Table 6.
Summary of metabolites of triclocarban identified in bile from male ratsa
| Peak Designationb | Retention Time | Metabolite | Molecular Formula | Exact Mass (Calculated) | Exact Mass (Observed) | Percent of Radioactivity c |
|---|---|---|---|---|---|---|
| 1 | 6.7 | Triclocarban-O-glucuronide/O-sulfate | C19 H17 Cl3 N2 O12S | 600.9490 | 600.9525 | 7.2 |
| 2 | 7.2 | Triclocarban-O-glucuronide/O-sulfate | C19 H17 Cl3 N2 O12S | 600.9490 | 600.9525 | 4.5 |
| 3 | 7.8 | Triclocarban-O-glucuronide | C19 H17 Cl3 N2 O8 | 504.9972 | 505.0000 | 11.7 |
| 4 | 8.4 | Triclocarban-O-glucuronide | C19 H17 Cl3 N2 O8 | 504.9972 | 505.0000 | 41.0 |
| 5 | 9.9, 11.3, 11.4 | Triclocarban-O-sulfate | C13 H9 Cl3 N2 O5 S | 408.9219 | 408.9242 | 12.5 |
| 6 | 10.5 | Hydroxy triclocarban-O-sulfate | C13 H9 Cl3 N2 O6 S | 424.9168 | 424.9193 | 12.8 |
| 7 | 14.4 15.6 16.2 |
Dihydroxy triclocarban Hydroxy triclocarban Triclocarban |
C13 H9 Cl3 N2 O3 C13 H9 Cl3 N2 O2 C13 H9 Cl3 N2 O |
344.9601 328.9651 312.9702 |
344.9620 328.9669 312.9718 |
10.4 |
12-24 h bile was used for metabolite identification work.
Peak designation is based on profile given in Figure 3.
Percent of radioactivity estimated based on total radioactivity in chromatogram is shown.
Figure 4.


Extracted negative ion chromatograms and mass spectra of triclocarban-O-glucuronides in 12-24 h rat bile following gavage administration of 150 mg/kg [14C]triclocarban: A) Extracted ion chromatogram ([M-H]+, m/z 504.9000-505.1000); B) Mass spectra for peaks 3 (top panel) and 4 (bottom panel) eluting ~ 8 min; C) MS/MS spectrum of m/z 505.0000 for Peaks 3 (top panel) and 4 (bottom panel).
The mass spectra of the radiochemical peak at 10.5 min (Peak 6) with an ion at m/z 424.9193 is consistent with a monosulfate of dihydroxylated triclocarban (hydroxy triclocarban-O-sulfate) (Figure S1). Peaks at 9.9, 11.3, and 11.4 min, designated as Peak 5, have spectral patterns consistent with sulfates of monohydroxylated triclocarban, triclocarban-O-sulfate, with an ion at m/z 408.9242 with unique isotope distribution patterns of 3 chlorine atoms (Figure S2).
The peak at 16.2 min was confirmed as triclocarban (Figure S3). The remaining minor metabolites (designated as Peak 7) identified were hydroxylated metabolites (~ 3 metabolites) of triclocarban (retention time ~ 15.6 min, m/z 328.9669) (Figure S4), dihydroxy triclocarban (retention time ~ 14.4 min, m/z 344.9620) (Figure S5), mixed sulfate/glucuronide conjugates of dihydroxy triclocarban (retention times ~ 6.4 and 7 min, m/z 600.9525) (Figure S6). A summary of the metabolites of triclocarban identified in bile is given in Table 6.
Radiochemical profiles of feces extracts analyzed by LC-MS Method 2 showed multiple peaks (Figure S7). A peak that eluted ~ 16 min was confirmed as triclocarban using the mass spectrum. A metabolite peak eluting at ~ 15.6 min was confirmed as hydroxy triclocarban, which was also a minor metabolite observed in bile. Other feces metabolite eluting between 8 and 15 min, which were also observed in bile were dihydroxy triclocarban (3 isomers), triclocarban-O-sulfate (2 isomers), hydroxy triclocarban-O-sulfate (4 isomers), and triclocarban-O-glucuronides (mass spectrometry data not shown).
Extracts of plasma collected at 24 h after dosing 50 mg/kg triclocarban analyzed similarly to above showed no discernable radioactive triclocarban peak. However, it was readily detected with LC-MS. The major peak in the radiochemical profile eluted at ~ 11.3 min and was identified as triclocarban-O-sulfate. Minor metabolites identified similar to bile and feces above by mass spectrometry were hydroxy triclocarban, dihydroxy triclocarban, hydroxy triclocarban-O-sulfates, and triclocarban-O-glucuronides (mass spectrometry data not shown).
In vitro studies.
Clearance of triclocarban was investigated in male and female rat, mouse, and human hepatocytes. Concentration versus time plots are presented in Figure S8. Half-life and clearance data are presented in Table 7. In rats, the clearance of triclocarban was slow with 4.3 and 5.1 mL/min*kg for male and female rats; corresponding half-lives were 843 and 742 min, in males and females, respectively. Clearance of triclocarban in mice and human hepatocytes were similar (8.1 to 10.2 mL/min*kg) and was ~ 2-fold higher than in rat hepatocytes; half-lives were 359-398 min. There was no sex difference in clearance of triclocarban in any of the three species investigated. Plasma protein binding was investigated in rat, mouse, and human plasma. Triclocarban was highly bound to plasma protein with 99.9% bound in all three species. Metabolite identification in hepatocytes was also conducted with LC-MS analysis. Low levels of metabolites were detected and identified in human and mouse hepatocytes, but not in rat hepatocytes. These included hydroxy-triclocarban, triclocarban-O-sulfate, and triclocarban-O-glucuronide.
Table 7.
Clearance and half-life of triclocarban in rat, mouse, and human hepatocytes in vitroa
| Species | Sex | t1/2 (min) | Clearance (mL/(min*kg)) |
|---|---|---|---|
| Rat | Male | 843 | 4.3 |
| Female | 742 | 5.1 | |
| Mouse | Male | 398 | 10.2 |
| Female | 359 | 9.4 | |
| Human | Male | 372 | 10.1 |
| Female | 362 | 8.1 |
Data shown are based on non-compartmental analysis of mean concentration versus time data of three replicate samples.
Discussion
Here we report the ADME data for triclocarban in male and female rats and mice following a single gavage administration and dermal application. Studies were initiated and completed prior to the FDA ban on the use of triclocarban in OTC products (FDA, 2020). To the best of our knowledge this is the first study comparing the disposition and mass balance of triclocarban in multiple species and following multiple routes.
In male rats, following gavage administration of 50, 150, and 500 mg/kg, the administered dose was recovered mostly in feces (85-86%) with very little recovered in urine (3-6%) and tissues (~ 0.1%) at 72 h with no apparent dose-related effect in disposition. Distinguishing between the unabsorbed dose and the dose potentially secreted to the intestine via bile and subsequently excreted in feces is an important consideration. In bile duct cannulated male rats, 29% of an orally administered 50 mg/kg dose was excreted via bile in 48 h providing evidence that some of the observed fecal excretion following gavage administration was due to biliary excretion and not the unabsorbed dose. Based on the combined dose recovered in bile, urine and tissues in the bile-duct cannulated group, triclocarban absorption in rats is ~ 40%. If this was adjusted, based on the total administered dose recovered for this group of 82.5%, the absorbed dose of triclocarban in rats is moderate at 48% (i.e., 40/82.5*100). The pattern of disposition of orally-administered 50 mg/kg dose of triclocarban in female rats, and male and female mice, was similar to that of male rats. Our observation was similar to Hiles where following oral dosing of [14C]triclocarban in rats, 4-6% and 86-89% of the administered dose was recovered in urine and bile, respectively, 72 h after dosing (Hiles, 1977). In a recent study by Costa et al., following exposure of pregnant Wistar rats to very low doses of triclocarban via gavage (up to 3 mg/kg), reproductive effects were noted in F1 females (Costa et al., 2020). These observations parallel the significant absorption of triclocarban following gavage administration reported in our study and by others. In humans (Hiles and Birch, 1978a), following a single oral dose of 2.2 μmol/kg [14C]triclocarban, a higher percent of the administered dose was excreted in urine (~ 27%) compared to rats (~ 2-6%) suggesting potential species difference in disposition; concomitantly, the dose excreted in feces was lower in humans (~ 70%) compared to rats (85-90%).
Absorption of triclocarban in female and male rats following gavage administration was slow with an absorption half-life of ~ 2 h. The estimated apparent volume of distribution (V/F, 28860 and 30161 mL/kg, for males and females, respectively) of triclocarban was higher than the reported body water volume in rats (688 mL/kg) (Davies and Morris, 1993) suggesting that triclocarban was well-distributed to tissues, in both male and female rats. However, the total radioactivity remaining in tissues at 72 h was low (~0.1%), compared to that at 24 h (~ 4%), suggesting low tissue retention of triclocarban in rodents. The parent triclocarban was cleared faster in rats (half-life ~ 2 h) compared to the [14C]-derived total radioactivity (half-life ~ 9 −19 h), suggesting triclocarban-derived metabolites are cleared slowly in rats. Based on the AUC values of total radioactivity and parent triclocarban, the fraction present as triclocarban in plasma was ≤ 2.5% that of total radioactivity demonstrating that metabolites of triclocarban predominate in the systemic circulation.
Triclocarban was poorly absorbed following dermal application to a covered dose site in male and female rats with ≤ 0.4% absorbed in rats by 72 h. A moderate amount (24-40%) of the administered dose was recovered at the dose-site skin suggesting that this dose is likely available for systemic absorption overtime. In mice also, the absorption was poor, although a higher percent was absorbed (2-3%) than in rats. Unlike in rats, in mice, the dose remaining at the dose-site skin was much lower (mice, 2-4%; rats, 24-40%). Our observation in rats and mice is consistent with those by Hiles where low dermal absorption (7-8%) was reported in male rats following dermal application (Hiles, 1977). Low dermal absorption (~ 0.6% of 70 mg) was also reported in humans following exposure to triclocarban in soap used during showering (Howes and Black, 1976).
Since urinary excretion was a minor route in rodents, we used bile, feces, and plasma to investigate the metabolism of triclocarban in rodents using high resolution mass spectrometry. The initial metabolism involved single or multiple oxidations, followed by conjugation with single or multiple conjugation with sulfate or glucuronide. Standards were not available for comparison, and hence the positions of oxidation and conjugation were inferred from data available in the literature (Jeffcoat et al., 1977; Baumann et al., 2010; Schebb et al., 2012a). Jeffcoat et al. (1977) identified three monohydroxy isomers: 2’-, 3’-and 6-hydroxy triclocarban. Two dihydroxylated isomers were also described as 2’,6- and 3’,6-dihydroxy triclocarban. The in vitro metabolism of triclocarban has been reported by other investigators (Schebb et al., 2012, (Baumann et al., 2010); oxidation of triclocarban to mono-and dihydroxylated metabolites has been investigated, with 2’-, 3’-and 6-hydroxy triclocarban synthesized and their conjugation to glucuronides reported. The metabolites reported in our investigation were consistent with these metabolites and the potential metabolism of triclocarban in rodents is presented in Figure 5. The exact masses and isotope distribution of molecular ions matched the expected values, and the fragments matched those reported by Schebb et al., (2012) for the mono and dihydroxy metabolites of triclocarban and the glucuronides of the monohydroxylated metabolites. As reported by others (Birch et al., 1978) for rodents, N-glucuronidated metabolites were either low or absent and was not confirmed in our investigation.
Figure 5.

Proposed metabolism of triclocarban in rats based on biliary metabolites observed. The position of the hydroxylation was assigned based on work by Jeffcoat et al (1977) and Schebb et al. (2012).
In order to gauge the disposition of triclocarban in humans, metabolism and clearance was investigated in male mouse, rat, and human cryopreserved hepatocytes. Although clearance of triclocarban was slow in all three species, of the three species, rat showed the least clearance. Human hepatocytes and mouse hepatocytes cleared triclocarban 2-fold faster than rats. Metabolites were not detected in rat incubations. In mice and human incubations, hydroxy-triclocarban, triclocarban-O-sulfate, and triclocarban-O-glucuronides were detected; however, the N-glucuronidated products observed in vivo in humans were not detected under the conditions used in our investigation (Hiles and Birch, 1978a). Shebb et al. (2012) have observed that the N- and N’-conjugation of TCC in vitro is very slow in microsomes, compared with the extensive in vivo conjugation in humans, and represents an anomaly (Schebb et al., 2012a). The in vitro oxidative metabolism of TCC in liver microsomes has been described as slow. Baumann et al. (2012) indicated that the in vitro metabolism of TCC to monohydroxy metabolites in microsomes is slow with <2% conversion (Baumann et al., 2010).
In conclusion, in rodents, triclocarban was moderately absorbed following oral administration and poorly absorbed following dermal application. There was no apparent species or sex difference in disposition in rodents. Triclocarban was highly metabolized in rodents with the fraction of parent triclocarban in systemic circulation ~ 2% of total radioactivity.
Supplementary Material
Acknowledgements
The authors are grateful to Drs Esra Mutlu and Madelyn Huang for their review of this manuscript. This work was supported by the Intramural Research Program of the NIH, National Institute of Environmental Health Sciences, Intramural Research project ZIA ES103316-04, and performed for the National Toxicology Program, National Institute of Environmental Health Sciences, National Institutes of Health, U.S. Department of Health and Human Services, under contract HHSN29120077563 (RTI International, RTP, NC).
Footnotes
Declaration of Interest
The authors report no declarations of interest.
References
- Ashrap P, Watkins DJ, Calafat AM, Ye X, Rosario Z, Brown P, Velez-Vega CM, Alshawabkeh A, Cordero JF, Meeker JD, 2018. Elevated concentrations of urinary triclocarban, phenol and paraben among pregnant women in Northern Puerto Rico: Predictors and trends. Environ Int 121, 990–1002. [DOI] [PMC free article] [PubMed] [Google Scholar]
- Baumann A, Lohmann W, Rose T, Ahn KC, Hammock BD, Karst U, Schebb NH, 2010. Electrochemistry-mass spectrometry unveils the formation of reactive triclocarban metabolites. Drug Metab Dispos 38, 2130–2138. [DOI] [PMC free article] [PubMed] [Google Scholar]
- Birch CG, Hiles RA, Eichhold TH, Jeffcoat AR, Handy RW, Hill JM, Willis SL, Hess TR, Wall ME, 1978. Biotransformation products of 3,4,4’-trichlorocarbanilide in rat, monkey, and man. Drug Metab Dispos 6, 169–176. [PubMed] [Google Scholar]
- Brausch JM, Rand GM, 2011. A review of personal care products in the aquatic environment: environmental concentrations and toxicity. Chemosphere 82, 1518–1532. [DOI] [PubMed] [Google Scholar]
- Brown RP, Delp MD, Lindstedt SL, Rhomberg LR, Beliles RP, 1997. Physiological parameter values for physiologically based pharmacokinetic models. Toxicol Ind Health 13, 407–484. [DOI] [PubMed] [Google Scholar]
- Chen J, Hartmann EM, Kline J, Van Den Wymelenberg K, Halden RU, 2018. Assessment of human exposure to triclocarban, triclosan and five parabens in U.S. indoor dust using dispersive solid phase extraction followed by liquid chromatography tandem mass spectrometry. J Hazard Mater 360, 623–630. [DOI] [PubMed] [Google Scholar]
- Costa NO, Borges LI, Cavalcanti LF, Montagnini BG, Anselmo Franci JA, Kiss ACI, Gerardin DCC, 2020. In utero and lactational exposure to triclocarban: reproductive effects on female rat offspring. J Appl Toxicol 40, 504–514. [DOI] [PubMed] [Google Scholar]
- Demetrulias J, Corbin N, North-Root H, 1984. The hairless mouse as a model for quantitating skin deposition of 3,4,4’-trichlorocarbanilide in bar soap. Toxicol Lett 22, 241–248. [DOI] [PubMed] [Google Scholar]
- Ding SL, Wang XK, Jiang WQ, Meng X, Zhao RS, Wang C, Wang X, 2013. Photodegradation of the antimicrobial triclocarban in aqueous systems under ultraviolet radiation. Environ Sci Pollut R 20, 3195–3201. [DOI] [PubMed] [Google Scholar]
- EPA, 2019. ChemView data base https://chemview.epa.gov/chemview. Last accessed 9/6/2019.
- Fahimipour AK, Ben Mamaar S, McFarland AG, Blaustein RA, Chen J, Glawe AJ, Kline J, Green JL, Halden RU, Van Den Wymelenberg K, Huttenhower C, Hartmann EM, 2018. Antimicrobial Chemicals Associate with Microbial Function and Antibiotic Resistance Indoors. mSystems 3. [DOI] [PMC free article] [PubMed] [Google Scholar]
- FDA, 2020. FDA issues final rule on safety and effectiveness of antibacterial soaps. https://www.fda.gov/news-events/press-announcements/fda-issues-final-rule-safety-and-effectiveness-antibacterial-soaps. Last accessed on April 24, 2020.
- Geer LA, Pycke BFG, Waxenbaum J, Sherer DM, Abulafia O, Halden RU, 2017. Association of birth outcomes with fetal exposure to parabens, triclosan and triclocarban in an immigrant population in Brooklyn, New York. J Hazard Mater 323, 177–183. [DOI] [PMC free article] [PubMed] [Google Scholar]
- Halden RU, Lindeman AE, Aiello AE, Andrews D, Arnold WA, Fair P, Fuoco RE, Geer LA, Johnson PI, Lohmann R, McNeill K, Sacks VP, Schettler T, Weber R, Zoeller RT, Blum A, 2017. The Florence Statement on Triclosan and Triclocarban. Environ Health Perspect 125, 064501. [DOI] [PMC free article] [PubMed] [Google Scholar]
- Halden RU, Paull DH, 2005. Co-occurrence of triclocarban and triclosan in U.S. water resources. Environ Sci Technol 39, 1420–1426. [DOI] [PubMed] [Google Scholar]
- Harnly JM, Bhagwat S, Lin LZ, 2007. Profiling methods for the determination of phenolic compounds in foods and dietary supplements. Anal Bioanal Chem 389, 47–61. [DOI] [PMC free article] [PubMed] [Google Scholar]
- Hartmann EM, Hickey R, Hsu T, Betancourt Roman CM, Chen J, Schwager R, Kline J, Brown GZ, Halden RU, Huttenhower C, Green JL, 2016. Antimicrobial Chemicals Are Associated with Elevated Antibiotic Resistance Genes in the Indoor Dust Microbiome. Environ Sci Technol 50, 9807–9815. [DOI] [PMC free article] [PubMed] [Google Scholar]
- Hiles RA, 1977. Metabolism and toxicity of halogenated carbanilides: absorption, distribution and excretion of radioactivity from 3,4,4’-trichloro[14C]carbanilide (TCC) and 3-trifluoromethyl-4,4’-dichloro[14C]carbanilide (TFC) in rats. Food Cosmet Toxicol 15, 205–211. [DOI] [PubMed] [Google Scholar]
- Hiles RA, Birch CG, 1978a. The absorption, excretion, and biotransformation of 3,4,4’-trichlorocarbanilide in humans. Drug Metab Dispos 6, 177–183. [PubMed] [Google Scholar]
- Hiles RA, Birch CG, 1978b. Nonlinear metabolism and disposition of 3,4,4’-trichlorocarbanilide in the rat. Toxicol Appl Pharmacol 46, 323–337. [DOI] [PubMed] [Google Scholar]
- Howes D, Black JG, 1976. Percutaneous absorption of triclocarban in rat and man. Toxicology 6, 67–76. [DOI] [PubMed] [Google Scholar]
- Huynh K, Banach E, Reinhold D, 2018. Transformation, Conjugation, and Sequestration Following the Uptake of Triclocarban by Jalapeno Pepper Plants. J Agric Food Chem 66, 4032–4043. [DOI] [PubMed] [Google Scholar]
- IARC, 1993. IARC monographs on the evaluation of carcinogenic risk to humans: Occupational exposures of hairdressers and barbers and personal use of hair colourants; some hair dyes, cosmetic colourants, industrial dyestuffs and aromatic amines. 57, 305–321. [PMC free article] [PubMed] [Google Scholar]
- Jeffcoat AR, Handy RW, Francis MT, Willis S, Wall ME, Birch CG, Hiles RA, 1977. The metabolism and toxicity of halogenated carbanilides. Biliary metabolites of 3,4,4’-trichlorocarbanilide and 3-trifluoromethyl-4,4’-dichlorocarbanilide in the rat. Drug Metab Dispos 5, 157–166. [PubMed] [Google Scholar]
- Li A, Zhuang T, Zhu Q, Song M, Liao C, Jiang G, 2020. Concentration and distribution of parabens, triclosan, and triclocarban in pregnant woman serum in China. Sci Total Environ 710, 136390. [DOI] [PubMed] [Google Scholar]
- Li H, Zhao Y, Chen L, Su Y, Li X, Jin L, Ge RS, 2017. Triclocarban and Triclosan Inhibit Human Aromatase via Different Mechanisms. Biomed Res Int 2017, 8284097. [DOI] [PMC free article] [PubMed] [Google Scholar]
- Lozano N, Rice CP, Ramirez M, Torrents A, 2018. Fate of triclocarban in agricultural soils after biosolid applications. Environ Sci Pollut Res Int 25, 222–232. [DOI] [PubMed] [Google Scholar]
- McGinnity DF, Soars MG, Urbanowicz RA, Riley RJ, 2004. Evaluation of fresh and cryopreserved hepatocytes as in vitro drug metabolism tools for the prediction of metabolic clearance. Drug Metab Dispos 32, 1247–1253. [DOI] [PubMed] [Google Scholar]
- Miller TR, Colquhoun DR, Halden RU, 2010. Identification of wastewater bacteria involved in the degradation of triclocarban and its non-chlorinated congener. Journal of Hazardous Materials 183, 766–772. [DOI] [PMC free article] [PubMed] [Google Scholar]
- Miller TR, Heidler J, Chillrud SN, DeLaquil A, Ritchie JC, Mihalic JN, Bopp R, Halden RU, 2008. Fate of triclosan and evidence for reductive dechlorination of triclocarban in estuarine sediments. Environ Sci Technol 42, 4570–4576. [DOI] [PMC free article] [PubMed] [Google Scholar]
- NRC, 2011. Guide for the Care and Use of Laboratory Animals: Eighth Edition. Washington, DC: The National Academies Press. [Google Scholar]
- Rochester JR, Bolden AL, Pelch KE, Kwiatkowski CF, 2017. Potential Developmental and Reproductive Impacts of Triclocarban: A Scoping Review. J Toxicol 2017, 9679738. [DOI] [PMC free article] [PubMed] [Google Scholar]
- Schebb NH, Buchholz BA, Hammock BD, Rice RH, 2012a. Metabolism of the antibacterial triclocarban by human epidermal keratinocytes to yield protein adducts. J Biochem Mol Toxic 26, 230–234. [DOI] [PMC free article] [PubMed] [Google Scholar]
- Schebb NH, Franze B, Maul R, Ranganathan A, Hammock BD, 2012b. In Vitro Glucuronidation of the Antibacterial Triclocarban and Its Oxidative Metabolites. Drug Metabolism and Disposition 40, 25–31. [DOI] [PMC free article] [PubMed] [Google Scholar]
- Schebb NH, Inceoglu B, Ahn KC, Morisseau C, Gee SJ, Hammock BD, 2011. Investigation of human exposure to triclocarban after showering and preliminary evaluation of its biological effects. Environ Sci Technol 45, 3109–3115. [DOI] [PMC free article] [PubMed] [Google Scholar]
- Thelusmond JR, Kawka E, Strathmann TJ, Cupples AM, 2018. Diclofenac, carbamazepine and triclocarban biodegradation in agricultural soils and the microorganisms and metabolic pathways affected. Sci Total Environ 640–641, 1393–1410. [DOI] [PubMed] [Google Scholar]
- Vimalkumar K, Arun E, Krishna-Kumar S, Poopal RK, Nikhil NP, Subramanian A, Babu-Rajendran R, 2018. Occurrence of triclocarban and benzotriazole ultraviolet stabilizers in water, sediment, and fish from Indian rivers. Sci Total Environ 625, 1351–1360. [DOI] [PubMed] [Google Scholar]
- Waidyanatha S, Black SR, Blystone CR, Patel PR, Watson SL, Snyder RW, Fennell TR, 2019. Disposition and metabolism of sulfolane in Harlan Sprague Dawley rats and B6C3F1/N mice and in vitro in hepatocytes from rats, mice, and humans. Xenobiotica, 1–12. [DOI] [PMC free article] [PubMed] [Google Scholar]
- Walters E, McClellan K, Halden RU, 2010. Occurrence and loss over three years of 72 pharmaceuticals and personal care products from biosolids-soil mixtures in outdoor mesocosms. Water Res 44, 6011–6020. [DOI] [PMC free article] [PubMed] [Google Scholar]
- Warren JT, Allen R, Carter DE, 1978. Identification of the metabolites of trichlorocarbanilide in the rat. Drug Metab Dispos 6, 38–44. [PubMed] [Google Scholar]
- Wu C, Spongberg AL, Witter JD, Fang M, Czajkowski KP, 2010. Uptake of pharmaceutical and personal care products by soybean plants from soils applied with biosolids and irrigated with contaminated water. Environ Sci Technol 44, 6157–6161. [DOI] [PubMed] [Google Scholar]
- Wu C, Spongberg AL, Witter JD, Sridhar BB, 2012. Transfer of wastewater associated pharmaceuticals and personal care products to crop plants from biosolids treated soil. Ecotoxicol Environ Saf 85, 104–109. [DOI] [PubMed] [Google Scholar]
- Ye X, Zhou X, Furr J, Ahn KC, Hammock BD, Gray EL, Calafat AM, 2011. Biomarkers of exposure to triclocarban in urine and serum. Toxicology 286, 69–74. [DOI] [PMC free article] [PubMed] [Google Scholar]
- Yin J, Wei L, Shi Y, Zhang J, Wu Q, Shao B, 2016. Chinese population exposure to triclosan and triclocarban as measured via human urine and nails. Environ Geochem Health 38, 1125–1135. [DOI] [PubMed] [Google Scholar]
- Ying GG, Yu XY, Kookana RS, 2007. Biological degradation of triclocarban and triclosan in a soil under aerobic and anaerobic conditions and comparison with environmental fate modelling. Environ Pollut 150, 300–305. [DOI] [PubMed] [Google Scholar]
- Yun H, Liang B, Kong D, Li X, Wang A, 2020. Fate, risk and removal of triclocarban: A critical review. J Hazard Mater 387, 121944. [DOI] [PubMed] [Google Scholar]
Associated Data
This section collects any data citations, data availability statements, or supplementary materials included in this article.