

Abstract
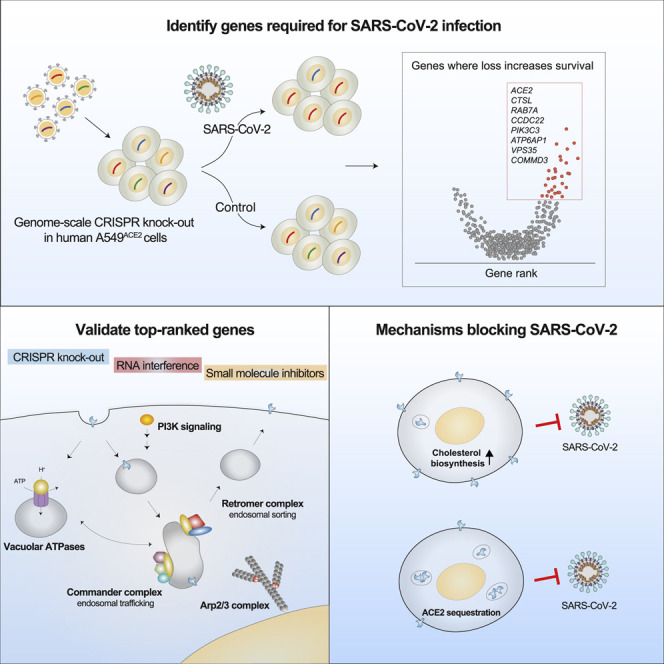
To better understand host-virus genetic dependencies and find potential therapeutic targets for COVID-19, we performed a genome-scale CRISPR loss-of-function screen to identify host factors required for SARS-CoV-2 viral infection of human alveolar epithelial cells. Top-ranked genes cluster into distinct pathways, including the vacuolar ATPase proton pump, Retromer, and Commander complexes. We validate these gene targets using several orthogonal methods such as CRISPR knockout, RNA interference knockdown, and small-molecule inhibitors. Using single-cell RNA-sequencing, we identify shared transcriptional changes in cholesterol biosynthesis upon loss of top-ranked genes. In addition, given the key role of the ACE2 receptor in the early stages of viral entry, we show that loss of RAB7A reduces viral entry by sequestering the ACE2 receptor inside cells. Overall, this work provides a genome-scale, quantitative resource of the impact of the loss of each host gene on fitness/response to viral infection.
Keywords: COVID-19, SARS-CoV-2, genome-wide screen, CRISPR, loss of function, human lung, cholesterol, endosome, ECCITE-seq, Cas9
Graphical Abstract
To identify potential therapeutic targets for SARS-CoV-2, Daniloski et al. conduct a genome-wide CRISPR screen in human lung epithelial cells. They identify genes and pathways required for SARS-CoV-2 infection, including the vacuolar ATPase proton pump, Retromer, and Commander complexes. Using single-cell transcriptomics, they identify upregulation of cholesterol biosynthesis as a common mechanism underlying viral resistance, in addition to ACE2 sequestration.
Introduction
As of October 2020, severe acute respiratory syndrome coronavirus 2 (SARS-CoV-2), the virus that causes COVID-19, has infected 40 million people worldwide and led to the deaths of more than 1 million people, according to the John Hopkins Research Center (Gardner, 2020). SARS-CoV-2 belongs to the family of enveloped viruses known as Coronaviridae and was first reported in late 2019 in China. Over the past two decades, it is the third zoonotic coronavirus to emerge: compared to the other two coronaviruses, SARS-CoV (2002) and Middle East respiratory syndrome (MERS)-CoV (2012), SARS-CoV-2 shows an increased infectivity and lower case-fatality rate, contributing to its wide-spread transmission and resulting in a pandemic (Gates, 2020; Liu et al., 2020). Given that SARS-CoV-2 has already taken a major toll on human life and livelihoods worldwide, many research institutions, governmental organizations, and pharmaceutical companies are working to identify antiviral drugs and develop vaccines. Currently, there are nearly 30 vaccines against SARS-CoV-2 in clinical trials and a Food and Drug Administration (FDA)-approved antiviral drug (remdesivir) that acts as an inhibitor of the SARS-CoV-2 viral RNA-dependent RNA polymerase (Beigel et al., 2020; Funk et al., 2020). A recent study identified small molecules that antagonize SARS-CoV-2 replication and infection by testing ∼12,000 clinical-stage and FDA-approved inhibitors (Riva et al., 2020). Here, we utilize an alternative approach—a genome-scale loss-of-function screen—to identify targets among host genes that are required for SARS-CoV-2 infection. These gene targets (and inhibitors of these genes) may aid in the development of new therapies for COVID-19.
SARS-CoV-2 is an enveloped positive-sense RNA virus that relies on host factors for all stages of its life cycle (Kim et al., 2020; Zhou et al., 2020). The viral envelope is coated by Spike protein trimers that bind to angiotensin converting-enzyme 2 (ACE2) receptor, which is required for SARS-CoV-2 infection (Hoffmann et al., 2020a; Zhou et al., 2020). The Spike protein undergoes proteolytic cleavage that is catalyzed by several host proteases, such as furin, TMPRSS2, and cathepsin L, and can occur in the secretory pathway of the host cell or during viral entry in the target cell. Proteolytic cleavage is considered to be required for activation of Spike that in turn allows for viral-host membrane fusion and release of the viral RNA into the host cytoplasm (Hoffmann et al., 2020b). Once in the cytoplasm, the virus utilizes the host and its own machinery to replicate its genetic material and assemble new viral particles. Recent proteomic studies have identified hundreds of host proteins that directly bind to SARS-CoV-2 viral proteins and have mapped changes in the global protein phosphorylation landscape in response to viral infection, highlighting the interest in better understanding of host-virus genetic dependencies (Bouhaddou et al., 2020; Gordon et al., 2020). To date, there are no genome-wide studies that directly identify human genes required for viral infection, which will be of great interest and utility for the broader scientific community.
Here, we perform a genome-scale CRISPR loss-of-function screen in human alveolar basal epithelial carcinoma cells to identify genes whose loss confers resistance to SARS-CoV-2 viral infection. We validate that these genes reduce SARS-CoV-2 infection using multiple orthogonal cell perturbations (CRISPR knockout, RNA interference knockdown, and small-molecule inhibitors). For the top gene hits, we explore potential mechanisms of their antiviral activity using single-cell transcriptomics, flow cytometry, and immunofluorescence. Using single-cell transcriptomics, we identified a group of genes (ATP6AP1, ATP6V1A, NPC1, RAB7A, CCDC22, and PIK3C3) whose knockout induced shared transcriptional changes in cholesterol biosynthesis pathway. Perturbation of the cholesterol biosynthesis pathway with the small molecule amlodipine reduced viral infection. In addition, we show that loss of RAB7A reduces viral entry by sequestering ACE2 receptors inside cells through altered endosomal trafficking. Prior to this study, our knowledge of essential host genes for SARS-CoV-2 has been limited to only a handful of genes, such as ACE2 and cathepsin L: this work provides a quantitative resource of the impact of each gene’s loss on response to viral infection for every protein-coding gene in the human genome.
Results
A High-Throughput Screen to Identify Genes Required for SARS-CoV-2 Infection
To identify key genes required for SARS-CoV-2 infection, we performed a genome-scale loss-of-function screen targeting 19,050 genes in the human genome using the GeCKOv2 CRISPR-Cas9 library (Sanjana et al., 2014). The GeCKOv2 library contains 122,411 CRISPR single-guide RNAs (sgRNAs) (6 guide RNAs per gene) and has previously been used in CRISPR screens for drug resistance, immunotherapy, synthetic lethality, mitochondrial disease, and therapeutic discovery for muscular dystrophy (Erb et al., 2017; Jain et al., 2016; Lek et al., 2020; Patel et al., 2017; Shalem et al., 2014). First, we transduced a human alveolar basal epithelial carcinoma cell line (A549) that constitutively expresses ACE2 (referred to as A549ACE2) with an all-in-one lentiviral vector containing Cas9, guide RNAs from the GeCKOv2 human library, and a puromycin resistance gene. The transduction was performed at a low multiplicity of infection (MOI ∼0.2) to ensure that most cells would receive only one guide RNA construct (Figure 1 A). We then selected with puromycin so that only library-transduced cells remained. We also measured the survival rate after puromycin selection was complete (3 days) to ensure high coverage of the 122,411 guide RNAs (∼1,000 cells per guide RNA). After puromycin selection was complete, we cultured the cells for 9 days to ensure protein depletion after CRISPR gene targeting.
Figure 1.

A Genome-Scale CRISPR Loss-of-Function Screen to Identify Genes that Prevent SARS-CoV-2 Infection of Human Alveolar Epithelial Carcinoma Cells
(A) Overview of the genome-scale loss-of-function screen for host factors in human A549ACE2 cells requires for SARS-CoV-2 infection.
(B) Immunofluorescence of SARS-CoV-2 nucleocapsid (N) protein and DAPI labeling of human A549ACE2 cells at 24 h post-infection.
(C) Percent survival of human A549ACE2 cells transduced with the GeCKOv2 library with the indicated SARS-CoV-2 viral amount (MOI) at 6 days post-infection.
(D) Scatterplot of guide RNA read counts from A549ACE2 cells at 6 days post-infection with SARS-CoV-2 (MOI ~0.01) versus cells prior to infection. Read counts are normalized log2 reads.
(E) Volcano plot of median fold-change of guide RNAs for each gene and log10 robust rank aggregation (RRA) p values. All genes with |fold-change| > 4 and RRA p < 10−3 are labeled.
(F) Overlap of top 50 ranked genes between the MOI 0.01 and MOI 0.3 screen.
Next, we infected the GeCKOv2 pool of A549ACE2 cells with SARS-CoV-2 virus (Isolate USA-WA1/2020 NR-52281) at either a high (0.3) or a low (0.01) MOI. We verified that SARS-CoV-2 infects A549ACE2 cells by staining for the nucleocapsid (N) protein at 24 h post-infection (Figure 1B), and at day 6 post-infection, we measured cell survival for both the high and low MOI conditions (Figure 1C). As expected, the higher MOI infection resulted in fewer surviving cells at day 6 post-infection. Next, we extracted genomic DNA, and via amplicon sequencing, we quantified guide abundance in each biological condition (Figure 1A). To confirm that library representation was properly maintained, we computed the correlation between the guide representation in the plasmid library and after puromycin selection (r = 0.84) (Figure S1 A). In contrast, after SARS-CoV-2 infection, there was a much greater degree of guide dropout, as expected given that SARS-CoV-2 rapidly kills A549ACE2 cells without CRISPR perturbations (Figures 1C and 1D).
Figure S1.

Genome-wide Loss-of-Function CRISPR Screen Enriched Gene Identification, Related to Figure 1
(A) Scatterplot of guide RNA read counts from A549ACE2 cells at 3 days post-transduction with the GeCKOv2 library versus read counts from the library plasmid. Read counts ar4e normalized log2 reads. (B) RRA p-value distribution for all genes in the GeCKOv2 library. (C) Overlap of top-ranked (top 500) genes between 3 different analysis methods (RRA, RIGER, and SBR). 142 genes are found by all 3 methods. (D) Comparison of top-ranked genes between different genome-scale CRISPR screens for SARS-CoV-2 infection.
Using robust-rank aggregation (RRA) on the guide relative enrichments, we computed gene-level scores to identify genes where loss-of-function mutations led to enrichment within the pool (Figure 1E; Kolde et al., 2012). We identified ∼1,000 genes with significant RRA enrichment (p < 0.05) (Figure S1B). We also used two other previously published methods to compute gene enrichments (RIGER weighted-sum and second-best rank) and found a high degree of overlap between enriched genes identified by all three methods (Figure S1C; Chen et al., 2015; Luo et al., 2008). We also found a high degree of shared genes across both the low and high SARS-CoV-2 MOI conditions: when examining the top 50 most enriched genes, we found that 27 of them were shared between the low and high MOI conditions (Figure 1F; Table S1), suggesting that several host genes involved in viral pathogenesis function independently of viral dose. An independent genome-scale CRISPR screen for SARS-CoV-2 infection also performed in A549 that overexpress ACE2 but with a different CRISPR library identified similar top-ranked genes (Zhu et al., 2020), highlighting the robustness of our results (Figure S1D).
Enriched Genes Are Involved in Multiple Aspects of the Viral Life Cycle and Are Broadly Expressed
Upon close examination of the most enriched genes, we found genes involved in key aspects of viral entry and replication (Figure 2 ; Du et al., 2009). For example, the well-established entry receptor angiotensin-converting enzyme 2 (ACE2) receptor was ranked as the 8th most-enriched gene in the low MOI screen and 12th in the high MOI screen (Table S1; Hoffmann et al., 2020a; Zhou et al., 2020). Among the top 50 enriched genes, we identified several sets of related genes that function together in complexes, giving us further confidence in the genome-scale screen (Figures 2 and 3A). We found genes essential for initial attachment and endocytosis (ACE2, RAB7A, and 4 members of the ARP2/3 complex: ACTR2, ACTR3, ARPC3, and ARPC4), Spike protein cleavage and viral membrane fusion (CTSL and 13 members of the vacuolar-ATPase proton pump: ATP6AP1, ATP6AP2, ATP6V0B ATP6V0C, ATP6V0D1, ATP6V1A, ATP6V1B2, ATP6V1C1, ATP6V1E1, ATP6V1G1, ATP6V1H, TMEM199, and TOR1AIP1), endosome recycling (4 members of the endosomal protein sorting Retromer complex: VPS26A, VPS29, VPS35, and SNX27; 4 members of the endosomal trafficking Commander complex: COMMD2, COMMD3, COMMD3-BMI1, and COMMD4; and 3 members of the PI3K pathway: PIK3C3/VPS34, WDR81, and ACP5), ER-Golgi trafficking (DPM3, ERMP1, PPID, and CHST14), and transcriptional modulators (SLTM and SPEN). A consistent theme among the enriched complexes is endosome function and regulation (V-ATPase proton pump, Retromer, Commander, class 3 PI3Ks) (Banerjee and Kane, 2020; Mallam and Marcotte, 2017; McNally and Cullen, 2018). Gene set enrichment analysis on the full ranked list of genes identified significantly enriched Gene Ontology (GO) categories for endosome processing, transport, and acidification and categories related to cytokinesis and virion attachment (false discovery rate [FDR] q < 0.1) (Figures 3B and S2A–S2D; Table S2; Subramanian et al., 2005).
Figure 2.

Top-Ranked Genes from the CRISPR Screen Are Involved in Key Elements of the SARS-CoV-2 Viral Life Cycle
Schematic of SARS-CoV-2 docking, entry, RNA genome release and transcription, and virion replication, assembly, and release with top-ranked host genes from the CRISPR screen highlighted in red. All genes shown are ranked in the top 50 genes (top ~0.25% of library) in the low MOI CRISPR screen using RRA. Adapted from Du et al. (2009).
Figure 3.

Enriched Genes Cluster into Related Pathways, Are Expressed Broadly, Interact Directly with Viral Proteins, and Are Also Involved in Viral Pathogenesis of Pandemic Flu and Zika Virus
(A) Classification of genes shown in Figure 2 (top-ranked ~0.25% of the GeCKOv2 library) into specific complexes.
(B) Gene set enrichment analysis normalized enrichment scores for all significant (FDR q < 0.1) Gene Ontology (GO) biological processes.
(C) Expression of top-ranked genes (same as in A) across the indicated human tissues from GTEx v8. Gene expression color scale is transcripts per million (TPM).
(D) RRA fold-change for the low MOI CRISPR screen for the high-confidence protein-protein interaction with the maximum fold-change for each viral gene from the Gordon et al. (2020) mass spectrometry dataset.
(E) Clustering of top-ranked GO biological processes for CRISPR screens for Zika virus ZIKV (Li et al., 2019), H1N1 pandemic avian influenza IAV (Li et al., 2020), and SARS-CoV-2 (this study).
Figure S2.

Gene Set Enrichment and Overlap of Top-Ranked Genes with Other Viral Infections, Related to Figures 2 and 3
(A) – (D) Four of the significant (FDR < 0.1) top-ranked GO biological process terms and the fold-change ranks of their genes in the SARS-CoV-2 low MOI CRISPR screen. (E) Normalized gene ranks of the top 50 genes from the SARS-CoV-2 low MOI CRISPR screen and genome-scale CRISPR screens for Zika virus (ZIKV) and H1N1 avian influenza (IAV).
Although we performed our CRISPR screen in human lung cells, we explored whether the expression of host genes whose loss reduces SARS-CoV-2 infection were lung-specific or more broadly expressed. To answer this question, we took the top-ranked genes and examined their expression across 12 tissues using 4,790 RNA-sequencing datasets from the Genotype-Tissue Expression (GTEx) v8 database (Figure 3C; Aguet et al., 2019). Virtually all of the top gene hits were broadly expressed across all tissues, implying that these mechanisms may function independent of cell or tissue type. Among the top-ranked genes, only ACE2 showed tissue-specific expression with a particular enrichment in testis, small intestine, kidney, and heart (Figure 3C).
Enriched Genes Have Been Suggested to Interact with Viral Proteins and Are Also Essential for Other Viral Pathogens
Recently, Gordon et al. (2020) performed an in-depth study of SARS-CoV-2 protein-protein interaction networks by overexpressing affinity-tagged versions of each protein encoded in the viral genome followed by tandem mass spectrometry after pull-down. Their study identified 332 high-confidence SARS-CoV-2-human protein-protein interactions (PPIs). We found that some of the highly ranked genes from our loss-of-function screen were reported to have direct PPI with different viral proteins (Figure 3D; Table S2). For example, two highly ranked subunits of the vacuolar-ATPase proton pump, ATP6AP1 and ATP6V1A, interact with SARS-CoV-2 non-structural protein 6 (nsp6) and membrane (M) protein, respectively. ATP6AP1, which was ranked 2nd in the low MOI CRISPR screen and 4th in the high MOI CRISPR screen, has a very strong PPI interaction with nsp6 (mass spectrometry interaction statistics [MIST] score = 0.99) (Verschueren et al., 2015). Another key endocytosis protein, RAB7A, is ranked in the top 50 genes in both CRISPR screens and interacts strongly with non-structural protein 7 (nsp7) (MIST score = 0.97). We also compared the top-ranked genes with another proteomic study that used proximity labeling in A549 cells overexpressing BioID-tagged viral proteins and found that 22 out of the top 50 low MOI CRISPR screen genes had direct interactions with viral genes—a significant enrichment over randomly chosen genes (p = 2 × 10⁻⁴) (Samavarchi-Tehrani et al., 2020).
Because similar loss-of-function CRISPR screens have been performed to identify host genes required for other viral pathogens, we next sought to understand whether the hits identified in our SARS-CoV-2 screen were shared with those identified in prior screens for Zika virus (ZIKV) and pandemic H1N1 avian influenza (IAV) (Li et al., 2019, 2020). We examined whether top-ranked hits from the ZIKV and IAV screens shared similar genes and similar functional categories. Overall, there was greater similarity between GO categories of enriched genes for SARS-CoV-2 and ZIKV (Figure 3E; Table S2). When examining the top 50 genes from the SARS-CoV-2 screen, we found several genes that were highly enriched in all 3 viral pathogen screens (Figure S2E). This group included subunits of the vacuolar-ATPase proton pump, a well-known family of genes essential for acidification and endosomal processing (Banerjee and Kane, 2020).
Validation of Enriched Genes Using CRISPR Knockout, RNA Interference, and Small Molecule Inhibitors
To test the ability of top-ranked genes to block SARS-CoV-2 viral infection, we picked 30 genes ranked among the top 200 genes in our RRA analysis for independent validation. Each gene was targeted with 3 guide RNAs distinct from the guides present in the GeCKOv2 genome-wide CRISPR library (Table S3). The guides were synthesized individually and cloned into the pCC1 lentiviral vector, a modified version of lentiCRISPRv2 with the F+E optimized guide RNA scaffold (Legut et al., 2020). For a subset of genes, we validated Cas9-mediated loss-of-function by western blot for protein expression (Figure S3 A).
Figure S3.

Validation of Top-Ranked Genes Using CRISPR Perturbations and RNA Interference, Related to Figure 4
(A) western blot analysis of RAB7A, CCDC22, ATP6V1A, and ACE2 after transduction of A549ACE2 with the indicated CRISPR guide RNA and selection with puromycin for 7 days. For validation, we designed 3 independent guide RNAs per gene (i.e., distinct guide RNAs from those in the GeCKOv2 library). Beta tubulin was used as loading control. (B) Quantitative PCR (qPCR) of SARS-CoV-2 viral load present in A549ACE2 CRISPR-perturbed cells infected with SARS-CoV-2 at MOI of 0.1. The qPCR was performed on cells collected at the indicated time (hours) post-infection (hpi) (n = 6 biological replicates, error bars indicate s.e.m.). (C) western blot analysis of RAB7A and ACE2 after transduction of Huh7.5ACE2 with the indicated CRISPR guide RNA and selection with puromycin for 7 days. For validation, we designed 3 independent guide RNAs per gene (i.e., distinct guide RNAs from those in the GeCKOv2 library). Beta tubulin was used as loading control. (D) qPCR of SARS-CoV-2 viral load present in Huh7.5ACE2 CRISPR-perturbed cells infected with SARS-CoV-2 at MOI of 0.1. The qPCR was performed on cells collected and fixed at 36 h.p.i (n = 3 guide RNAs with 6 biological replicates each, error bars indicate s.e.m.). (E) Immunofluorescence quantification of SARS-CoV-2 N protein at 36 hours post-infection (hpi) at MOI 0.1 in A549ACE2 cells pretreated with siRNA pools for 48 hours (n = 3 technical replicates, error bars represent s.e.m., NT indicates non-targeting controls).
Cas9-perturbed A549ACE2 lines were infected with SARS-CoV-2 at an MOI of 0.1 and the percentage of infected cells was determined by immunofluorescence against the SARS-CoV-2 N protein at 36 h post-infection (hpi). For all of the Cas9-perturbed cell lines, we observed a reduced percentage of infected cells with an up to 10-fold reduction in SARS-CoV-2 infection, compared to the cell lines with non-targeting sgRNAs (Figures 4A and 4B). Among the genes where loss provided the greatest protection against SARS-CoV-2 infection were vesicular trafficking genes like RAB7A, CCDC22, and VPS35, and other genes with well-established roles such as the ACE2 receptor and the protease cathepsin L (CTSL) (Figure 4B). We found a significant negative correlation between the percent infection in the arrayed CRISPR validation and the median fold-change from the genome-wide CRISPR screen (r s = −0.6, p = 5 × 10⁻⁴) (Figure 4C).
Figure 4.

Arrayed Validation of Genome-Scale SARS-CoV-2 Screen and Identification of Druggable Gene Targets
(A) Representative immunofluorescence images of A549ACE2 knockout lines infected with SARS-CoV-2 at MOI of 0.1 and fixed 36 h post-infection (hpi). SARS-CoV-2 N protein is shown in red and DAPI in blue.
(B) Quantification of SARS-CoV-2 infected A549ACE2 knockout lines immuno-stained with N protein as shown in (A). Each gene was targeted with 3 different guide RNAs represented as diamond symbols (n = 3 biological replicates, error bars indicate SEM).
(C) Correlation of log2 median fold change from the genome-scale CRISPR screen (low MOI) and percent of infected cells after individual (arrayed) gene perturbation shown in (B).
(D) Druggable genes found in the Drug Gene Interaction database (DGIdb) among highly ranked genes from the genome-scale CRISPR screen (ranked by RRA p value).
(E) qPCR of SARS-CoV-2 viral load present in A549ACE2 cells pretreated for 2 h with the indicated small molecule inhibitors at 10 μM and then infected with SARS-CoV-2 at MOI of 0.1. The qPCR was performed at 36 hpi. Red bars indicate inhibitors that yield a >100-fold reduction in viral load. Bars with hatch marks indicate an unreliable viral load measurement due to a large reduction in cell viability (see F). Inhibitors were maintained at the same concentration throughout the experiment (n = 6 biological replicates, error bars indicate SEM).
(F) Percent of A549ACE2 viable cells following inhibitor treatments at 10 μM for 36 hpi determined using LIVE/DEAD stain and flow cytometry. Bars with red hatch marks indicate that inhibitor treatment had a large impact on viability (<90% viability). Significance testing for (B), (E), and (F) was performed via a one-way ANOVA with false-discovery rate-corrected follow up tests; for clarity of presentation, all significance testing can be found in Table S6.
See also Figures S3 and S4 and Tables S3 and S4.
For these genes, we performed a full multi-step viral replication growth curve and found that the CRISPR perturbations decrease viral load across all time points (5, 10, 24, and 48 h) compared to the non-targeting control (Figure S3B). To test if the identified hits block viral infection in other cell lines, for 8 genes we generated polyclonal CRISPR knockouts in a human liver cell line (Huh7.5ACE2), which were then infected with SARS-CoV-2 at an MOI of 0.1. Compared to non-targeting guide RNA controls, we found reduced infection with all 8 genes tested in the Huh7.5ACE2 cells (Figure S3C).
As an orthogonal gene perturbation method, we also validated a more extensive list of top-ranked genes via siRNA knockdown for 48 h, followed by infection with SARS-CoV-2 at MOI of 0.1 (Table S3). Quantification of N-protein immunofluorescent images revealed a substantial reduction of the percent infected cells (Figure S3D).
By cross-referencing highly ranked genes from the CRISPR screen with the Drug Gene Interaction database (DGIdb), we identified a set of 69 druggable genes (Figure 4D; Table S4; Cotto et al., 2018). We selected 9 genes that were a primary or a secondary target of one of the 26 small molecule inhibitors (Figure 4E). Among the 26 inhibitors, 9 are FDA approved and 7 are in Phase 2 or Phase 3 clinical trials for diverse diseases (Table S4). We pre-treated A549ACE2 cells for 2 h with 10 μM of each inhibitor and then infected with SARS-CoV-2 and analyzed the cells at 36 hpi. As a positive control, we also included remdesivir, which inhibits the viral RNA polymerase and is the only currently approved treatment for COVID-19 in the United States (Beigel et al., 2020). We assessed the efficacy of each inhibitor on blocking viral infection using immunofluorescence and quantitative PCR (qPCR).
Seven of the 26 inhibitors that we tested (PIK-III, Compound-19, SAR405, autophinib, ALLN, tamoxifen, and ilomastat) resulted in >100-fold reduction of viral load as measured by qPCR (Figure 4E). Among the best performing inhibitors, 4 of them target the same gene PIK3C3 (also known as VPS34) and 2 inhibitors (autophinib and ALLN) reduced the viral load more than 1000-fold. Similar results were obtained by immunofluorescent imaging of SARS-CoV-2 N protein (Figure S4 A). By testing the top four PIK3C3 inhibitors in combination with CRISPR targeting of PIK3C3, we found that Compound-19, PIK-III and autophinib were specific while SAR405 resulted in greater viral inhibition in PIK3C3 CRISPR-perturbed cells, suggesting some potential off-target activity for SAR405 (Figure S4B).
Figure S4.

Perturbations of Enriched CRISPR Screen Genes with Small-Molecule Inhibitors, Related to Figure 4
(A) Immunofluorescence quantification of SARS-CoV-2 N protein at 36 hpi (MOI 0.1) in A549ACE2 cells pretreated for 2 hours with 10 μM of the indicated inhibitors (n = 3 biological replicates, error bars represent s.e.m.) (B) Quantitative PCR (qPCR) of SARS-CoV-2 viral load present in A549ACE2 cells (CRISPR-perturbed with either non-targeting or PIK3C3-targeting guide RNAs) pretreated for 2 hours with the indicated PIK3C3 molecule inhibitors at 10 μM and then infected with SARS-CoV-2 at MOI of 0.1. The qPCR was performed at 36 hours post-infection (hpi). Inhibitors were maintained at the same concentration throughout the experiment (n = 6 biological replicates, error bars indicate s.e.m.). (C) Immunofluorescence quantification of SARS-CoV-2 N protein at 36 hpi (MOI 0.1) in A549ACE2 cells pretreated with a combination of indicated inhibitors at 10 μM each for 2 hours (n = 3 biological replicates, error bars represent s.e.m.).
Combinations of some of the top performing inhibitors overall showed an additive effect and further protected the cells from SARS-CoV-2 infection (Figure S4C). Next we measured cell viability at 36 h post-inhibitor treatment using flow cytometry. We observed more than 50% reduction of A549ACE2 cell viability with two pan-HDAC inhibitors, panobinostat and pracinostat (Figure 4F).
Single-Cell Sequencing Identifies Cholesterol Biosynthesis as a Common Mechanism Underlying Multiple Enriched Genes from the CRISPR Screen
Next, we sought to understand the mechanisms underlying how individual genes identified in our loss-of-function screen prevent SARS-CoV-2 infection and if host gene loss alters cell transcriptional programs. For this, we utilized the expanded CRISPR-compatible cellular indexing of transcriptomes and epitopes by sequencing (ECCITE-seq) method to couple pooled CRISPR perturbations of our top hit genes with a single-cell transcriptomic and proteomic readout (Mimitou et al., 2019; Figure 5 A; Table S5). ECCITE-seq is a high-throughput approach to identify the molecular mechanisms and cellular pathways that drive infection resistance; the pooled format also provides a more controlled experiment that may be less susceptible to batch variation. Importantly, cells were infected at low MOI to maximize the fraction of cells that express a single guide RNA, and therefore can be assigned a specific gene perturbation. For this, we pooled all individual guide RNA plasmids (3 per target gene) used to validate our genome-scale screen and 9 non-targeting (NT) sgRNAs (Figure 4B; Table S3).
Figure 5.

Single-Cell Transcriptomics (ECCITE-Seq) Identifies Shared Target Gene Signatures for Lipid and Cholesterol Regulation
(A) Schematic of pooled CRISPR perturbations with expanded CRISPR-compatible cellular indexing of transcriptomes and epitopes by sequencing (ECCITE-seq). Adapted from Mimitou et al. (2019).
(B) Single-cell mRNA expression heatmap showing the 100 most differentially upregulated genes (adjusted p value <0.01) for 200 randomized cells per selected target gene perturbation (for clarity, CCDC22, PIK3C3, RAB7, and TMEM165 perturbations are not shown). Labeled genes are either a top-ranked gene from the genome-wide CRISPR screens (red) or among the top 5 differentially expressed genes for a gene perturbation (black).
(C) Heatmap summarizing gene set enrichment analysis results for genes upregulated in any of the indicated target gene-perturbed cells (all genes with p value <0.01 and with a limit to the 300 most differentially expressed genes; all enriched pathways with adjusted p value <10−13).
(D) Cholesterol quantification in gene-perturbed cells (with the indicated guide RNAs), normalized to total protein.
In an initial ECCITE-seq experiment, we identified a median of 152 single cells per target gene. We observed specific reduction of target gene expression in cells grouped by target gene, indicating nonsense-mediated decay of transcripts with frameshift indel mutations after CRISPR modification (Figure S5 A). This effect was more pronounced for genes with higher expression. Using differential gene expression analysis between cells with non-targeting guide RNAs and cells with targeting guide RNAs, we identified for 11 of the 30 target genes more than 5 differentially expressed genes with a minimal log fold change (see STAR Methods), implying that loss of these genes results in a detectable transcriptomic shift. It is likely that loss of the other 19 genes results in more subtle changes in only a few genes; however, even for “non-perturbed” genes with sufficient basal expression, we detected clear changes in the CRISPR target gene. We repeated the ECCITE-seq experiment focusing on the 11 genes with detectable transcriptomic shifts upon target gene perturbation. Combining both replicate experiments, we obtained 18,853 cells that expressed only one guide RNA with a median of 1,388 cells per target gene.
Figure S5.

ECCITE-Seq Identifies Cholesterol Gene Signature Shared across Multiple Top-Ranked Genes, Related to Figure 5
(A) Stacked violin plot of 11 genes shared in both ECCITE-seq experiments. Single-cells are grouped by unique guide RNA target gene label of cells with a single detected guide RNA. Target gene expression is highlighted in red. (B) Heatmap of Gene Set Enrichment Analysis results for genes downregulated in any of the indicated target gene perturbed cells. (C) Cholesterol (normalized by total protein) in A549ACE2 cells treated with amlodipine or vehicle (DMSO) for 24 hours. (D) Quantitative PCR (qPCR) of SARS-CoV-2 viral load present in A549ACE2 cells treated with amlodipine or DMSO for 24 hours and then infected with SARS-CoV-2 at MOI of 0.1. The qPCR was performed on cells collected at the indicated time (hours) post-infection (hpi) (n = 3 biological replicates, error bars indicate s.e.m.). (E) Plaque assays of SARS-CoV-2 viral load present in A549ACE2 cells treated with amlodipine or DMSO for 24 hours and then infected with SARS-CoV-2 using logarithmically diluted supernatants. (n = 3 biological replicates, error bars indicate s.e.m.). (F) Number of reads mapping to the indicated portion of the viral genome in A549ACE2 cells treated with amlodipine or DMSO. A representative sample is shown for each treatment (n = 3 biological replicate sequencing libraries). (G) Cell viability by Trypan Blue exclusion in A549ACE2 cells treated with amlodipine or DMSO for 24 hours (n = 3 biological replicates, error bars indicate s.e.m.). (H) Distance matrix of RNA-sequencing from A549ACE2 cells treated with amlodipine or DMSO for 24 hours and then infected at MOI 0.1 or mock infection (n = 3 biological replicate sequencing libraries for each treatment-infection group). Read counts were processed with the DESeq2 regularized-log transform before computing distances. (I) k-means clustering (k = 3) of the top 500 most variable genes across all 4 conditions (n = 3 biological replicate sequencing libraries for each treatment-infection group). For each cluster, we label the most enriched pathway (lowest p-value) and, for the genes in that pathway, we label the top 5 most variable genes. No significantly enriched pathways were found for Cluster 3.
We found that loss of 6 of the “perturbed” genes—ATP6AP1, ATP6V1A, CCDC22, NPC1, PIK3C3, and RAB7A, which are part of the endosomal entry pathway—yielded similar gene expression signatures among upregulated differentially expressed genes (Figures 5B, 5C, and S5B). These 6 target gene perturbations all led to upregulation of pathways affecting lipid and cholesterol homeostasis (Figure 5C). Recently, we performed a large survey of >20,000 potential pharmacological treatments for COVID-19, and for compounds effective at preventing viral infection, we identified induction of the cholesterol biosynthesis pathway as a potential mechanism of viral inhibition (Hoagland et al., 2020). Loss-of-function mutations in these 6 genes may function through a similar mechanism (induction of cholesterol synthesis) that combats the virus-mediated suppression of cholesterol synthesis. Among the significant differentially expressed genes, we also found 61 genes from the enriched CRISPR screen genes (n = 20 genes upregulated; n = 41 genes downregulated) (Table S5). For example, NPC1, ATP6V1F, and ATP6V1G1 are upregulated in most of the 6 endosomal entry pathway gene-perturbed cells (Figure 5C), suggesting compensatory upregulation of related genes to mitigate target gene loss.
To understand how these changes impact lipid production, we measured cholesterol levels in cells after CRISPR perturbation and found that loss of these genes increases cholesterol by between 10% and 50%, depending on the perturbation (Figure 5D). To show that increases in cholesterol leads to increased SARS-CoV-2 resistance, we treated A549ACE2 cells with amlodipine, a calcium-channel antagonist that increases intracellular cholesterol (Mori et al., 1988; Ranganathan et al., 1982). We verified that amlodipine increases cholesterol levels in A549ACE2 cells (Figure S5C) and found that pre-treatment with amlodipine results in reduced SARS-CoV-2 viral infection, as measured by qPCR for nucleocapsid RNA, plaque formation, and number of viral RNA reads from RNA-sequencing, with only a modest impact on cell viability (Figures S5D–S5G). RNA-sequencing of cells treated with amlodipine shows a similar differential gene expression profile as seen in our ECCITE-seq with CRISPR perturbations with the most significant upregulated pathway as cholesterol biosynthesis (Figures S5H and S5I).
RAB7A Knockout Results in a Reduced Cell Surface Expression and an Increased Endosomal Accumulation of ACE2
Next, we sought to determine if any of the top-ranked genes regulate cell surface expression of ACE2, because surface ACE2 is required for SARS-CoV-2 infection (Hoffmann et al., 2020a). To measure the cell surface expression of ACE2, we performed flow cytometry on A549 wild-type cells and a panel of A549ACE2 CRISPR-perturbed cells. ACE2 expression was detected in A549ACE2, but not in A549 wild-type cells, validating the antibody specificity (Figures 6 A and S6 ). Flow cytometry analysis of the A549ACE2 CRISPR-perturbed lines revealed that RAB7A knockout cells have a significantly reduced cell surface expression of ACE2 compared to cells transduced with a non-targeting guide RNA (Figure 6B). Efficient Rab7a protein depletion across the RAB7A CRISPR-perturbed lines used was confirmed by western blot (Figure S6C).
Figure 6.

RAB7A Loss Results in a Reduced Cell Surface Expression and an Increased Endosomal Accumulation of ACE2
(A) Representative histograms of flow cytometry analysis to determine cell surface expression of ACE2 on A549 cell lines (A549 wild-type [WT], A549ACE2, and ACE2 with Cas9 and non-targeting [NT] or RAB7A-targeting guide RNAs). The dashed line indicates the gate between the ACE2-negative and -positive cells.
(B) Fraction of ACE2+ cells (using gating shown in A). ACE2 expression level was normalized across all samples to the A549ACE2 cells transduced with non-targeting (NT) guides (n = 2–3 guide RNA-transduced lines per gene, error bars are SEM).
(C) Representative images of immunofluorescence staining of ACE2 on A549ACE2 transduced with an NT or a RAB7A-targeting guide. In NT cells, ACE2 localizes at the cell membrane and in the cytoplasm, while in RAB7A-targeted cells, ACE2 shows a distinct pattern of localization to vesicles.
(D) Percent of cells with ACE2 accumulation in vesicles in NT and RAB7A-transduced A549ACE2 cells (n = 2 biological replicates, error bars are SEM).
(E) Representative images of immunofluorescence co-stained for ACE2, EEA1, and LysoTracker in A549ACE2 cells with a CRISPR guide RNA targeting RAB7A. ACE2 shows a distinct colocalization with EEA1 (an early endosome marker) and a less frequent colocalization with LysoTracker (a lysosomal maker).
(F) Representative histograms of flow cytometry analysis to determine cell surface expression in Calu-3 cells. The dashed line indicates the gate between the ACE2-negative and -positive cells.
(G) Fraction of ACE2+ cells (using gating shown in F). ACE2 expression level was normalized across all samples to the Calu-3 cells transduced with an NT guide (n = 3 biological replicates, error bars are SEM).
(H) Representative images of immunofluorescence staining of ACE2 on Caco-2 cells transduced with a NT or a RAB7A-targeting guide. In NT cells, ACE2 localizes at the cell membrane and in the cytoplasm, whereas in RAB7A-targeted cells, ACE2 shows a distinct pattern of localization to vesicles.
(I) Mean area of ACE2 foci in Caco-2 cells transduced with a NT or a RAB7A-targeting guide (n = 4 biological replicates, 80–105 cells per replicate were scored, error bars are SEM). Significance testing for (B) and (G) was performed with a one-way ANOVA (B: F = 9.8, p < 10−4; G: Calu-3: F = 378, p < 10−4, Caco-2: F = 222, p < 10−4) with false-discovery rate-corrected post hoc tests. Significance testing for (D) and (I) was performed with an unpaired t test. For all panels, ∗p ≤ 0.05, ∗∗p ≤ 0.01, ∗∗∗p ≤ 0.001, and ∗∗∗∗p ≤ 0.0001.
See also Figure S6.
Figure S6.

Flow Cytometry for Cell Surface ACE2 Expression and Protein Analysis of RAB7A Protein after CRISPR Targeting, Related to Figure 6
(A) and (B) Flow cytometry gating strategy to quantify cell surface expression of ACE2. (A) Live cells were first gated by the forward and side scatter area, then doublets were excluded by gating with the forward scatter area and width. Viable cells were selected by gating on side scatter area and LIVE/DEAD violet. (B) Gating strategy to determine ACE2+ cells. The gate was position such that < 3% of A549 wild-type and > 85% of A549ACE2 cells were ACE2 positive. The same gating strategy was applied to all samples. (C) western blot on A549ACE2 cells perturbed with non-targeting (NT) or RAB7A-targeting guide RNAs and probed with a RAB7A antibody. GAPDH was used as loading control.
Rab7a is a small GTPase that is involved in regulating cellular processes such as vesicular transport and membrane trafficking (Guerra and Bucci, 2016). We hypothesized that the observed reduction of ACE2 at the cell surface in RAB7A knockout cells may be due to impaired vesicular trafficking and accumulation of ACE2 in the cytoplasm. Immunofluorescence in the A549ACE2 polyclonal cell line revealed that ACE2 is detected in most cells. We also found that RAB7A knockout leads to an increased accumulation of ACE2 in the cytoplasm and in vesicle-like hollow structures reminiscent of endo-lysosomes (Figure 6C). We detected these accumulations in about 35% of RAB7A knockout cells with ACE2 staining, compared to the control where ACE2 was primarily localized at the plasma membrane and small cytoplasmic puncta (Figure 6D). Finally, we investigated which cellular compartments accumulate ACE2 in RAB7A knockout cells. Co-immunofluorescence images showed that in RAB7A knockout cells ACE2-containing vesicles often colocalize with EEA1, an early endosomal marker and less frequently with LysoTracker, a lysosome marker (Figure 6E).
Because ACE2 was overexpressed in our A549ACE2 cells, we wondered whether Rab7a loss would lead to similar cytoplasmic sequestration in cells with endogenous ACE2 expression. Flow cytometry analysis in Caco-2 colon and Calu-3 lung cells revealed that RAB7A knockout cells have significantly reduced cell surface expression of ACE2 compared to cells transduced with a non-targeting guide RNA (Figures 6F and 6G). We also found that RAB7A knockout in Caco-2 cells results in larger cytoplasmic ACE2 puncta compared to the control cells, further supporting cytoplasmic accumulation of ACE2 in the absence of Rab7a (Figures 6H and 6I).
Discussion
Given the current COVID-19 global pandemic, there is an urgent need to better understand the complex relationships between host and virus genetic dependencies. We report a genome-wide loss-of-function screen in human lung cells that identified host genes required for SARS-CoV-2 viral infection. We selected and validated 30 genes that were ranked among the top 200 genes. To support the ability of the screen to identify key dependencies, some of the well-known host genes involved in SARS-CoV-2 Spike protein binding and entry such as the ACE2 receptor and Cathepsin L were among the top-scoring genes (Hoffmann et al., 2020a). One of the validated genes (SIGMAR) encodes the Sigma-1 receptor that was recently identified to be modulated by drugs effective against SARS-CoV-2 in vitro (Gordon et al., 2020). Overall, the top-ranked genes clustered within several protein complexes including vacuolar ATPases, Retromer and endosome, Commander, ARP2/3, PI3K, and others, highlighting both the critical importance of multiple genes within each pathway to viral pathogenesis and the diversity of molecular pathways involved in SARS-CoV-2 infection.
Using a “minipool” CRISPR library of perturbations targeting top-ranked genes from the genome-scale CRISPR screen and single-cell transcriptomics, we identified a group of 6 genes (RAB7A, PIK3C3, NPC1, CCDC22, ATP6V1A, and ATP6AP1) that had a similar transcriptional signature—upregulation of the cholesterol synthesis pathway. By measuring the cholesterol levels, we found that CRISPR-driven loss of those 6 genes result in increased cellular cholesterol. Some of the 6 genes have previously been implicated in regulating low-density lipoprotein (LDL) cholesterol. For example, depletion of Rab7a leads to LDL accumulation in endosomes and NPC1 knockout cells show a reduction of cholesterol at the plasma membrane and an accumulation in the late endosome/lysosome compartments (Chang et al., 2005; Girard et al., 2014; Millard et al., 2000; Neufeld et al., 1996). We have recently, in an independent study, identified that SARS-CoV-2 infection negatively downregulates the cholesterol synthesis pathway, and viral infection can be counteracted by drug treatments that upregulate the same pathway (Hoagland et al., 2020). It is possible that changes in lipid composition directly impacts SARS-CoV-2 virion maturation and infectivity, as has been previously shown for hepatitis C and influenza A (Aizaki et al., 2008; Bajimaya et al., 2017). In this study, we showed that amlodipine, a calcium-channel antagonist, upregulates cholesterol levels and blocks SARS-CoV-2 infection. In addition, recent clinical studies have suggested that patients taking amlodipine or similar dihydropyridine calcium channel inhibitors have a reduced COVID-19 case fatality rate (Solaimanzadeh, 2020; Zhang et al., 2020). An important future research direction will be to further understand the relationship between cholesterol synthesis pathways and SARS-CoV-2.
Furthermore, we screened a panel of the top-ranked genes and identified that Rab7a regulates cell surface expression of ACE2, likely by sequestering ACE2 in endosomal vesicles. Rab7a is involved in vesicular trafficking and its depletion has been shown to sequester other cell receptors in endosomes (Rush and Ceresa, 2013). Interestingly, RAB7A knockout cell lines showed both altered cholesterol biosynthesis and sequestration of ACE2 receptor. Previous proteomics work showed that Rab7a has a strong interaction with viral protein nsp7 (Gordon et al., 2020). However, there is no nsp7 in the incoming virion, implying a post-entry/post-translational role for Rab7a. Thus, it is possible that loss of Rab7a blocks SARS-CoV-2 pathogenesis via multiple separate pathways, which is supported by the observation that it is the top-performing gene in our arrayed validation.
While this study was under review, a few other groups released preprints with loss-of-function CRISPR screens to identify host factors required for SARS-CoV-2 infection (Heaton et al., 2020; Wei et al., 2020; Zhu et al., 2020). Notably, only two studies (ours and Zhu et al. [2020]) have substantial overlap (11 and 14 genes among the top 36 genes from our MOI 0.3 and 0.01 screens, respectively, as shown in Figure S1D and nearly all of the top-ranked gene categories shown in Figure 2A). Given that these independent screens utilized different CRISPR libraries, the corroboration by Zhu et al. (2020) provides further support for our conclusions. The overlap between either of these studies with another screen performed using African green monkey cells (Wei et al., 2020) was limited to ACE2 and CTSL, two genes with established roles in viral entry. The differences in the overlap among the top-ranked genes might be due to technical aspects (such as different CRISPR libraries or variations in guide representation) or biological differences (such as different cell types or different host species). An exciting avenue for future study would be to investigate if SARS-CoV-2 perhaps utilizes multiple cell-type-specific genetic circuits.
A key element in our study was harnessing genome-scale loss-of-function to develop more refined therapeutic hypothesis. Our study suggests that PIK3C3 is a promising drug target: four out of the seven PIK3C3 inhibitors resulted in more than 100-fold reduction of SARS-CoV-2 viral load (SAR405, Compound-19, PIK-III, and Autophinib). Using a PIK3C3 polyclonal knockout A549ACE2 cell line, we found that among the top four PIK3C3 inhibitors, SAR405 may have some off-target effects (Figure S4B). Considering that our polyclonal knockout line likely has some residual PIK3C3, future work will be required to test the inhibitor specificity using a PIK3C3 monoclonal knockout cell line. Another drug that shows a substantial reduction in SARS-CoV-2 viral load is tamoxifen. Tamoxifen is an FDA-approved drug given as prophylaxis to patients at risk of breast cancer and works via modulation of the estrogen receptor. Tamoxifen was included in our study as it targets protein kinase C as a secondary target (O’Brian et al., 1985). This mechanism is further supported by the observation that A549 cells have undetectable transcript levels of estrogen receptor 1 (Human Protein Atlas) (Uhlen et al., 2010). Considering that tamoxifen is typically given to patients for years as a cancer therapy and prophylactic (Marchant, 1976), it would be interesting to investigate if patients taking tamoxifen have a reduced risk of SARS-CoV-2 infection and/or display less severe symptoms post-infection.
Finally, many approaches for therapeutic discovery have focused on large-scale screens of compound libraries. Even when promising therapeutic candidates are identified, it can be challenging to understand the mechanisms responsible for reducing viral pathogenesis. Our forward-genetics approach allows us to first identify key host genes, which can then be targeted through a diversity of methods such as small-molecule inhibitors, blocking antibodies, or gene knockdown. A key advantage of this approach is that the mechanism of action for any therapeutic is well-established from the outset.
Taken together, our integrative study identifies essential host genes in SARS-CoV-2 viral pathogenesis and, through a broad range of analytic and experimental approaches, validates their central role in infection. We also identify potential mechanisms underlying top-ranked genes, including cholesterol synthesis and endosomal function. In addition to guiding new therapeutic targets to help end this pandemic, our study provides a framework for harnessing massively parallel genome editing to understand disease genetics and mechanisms.
Limitations of Study
Our study identified host factors required for SARS-CoV-2 infection in human A549 cells that overexpress ACE2. Future work will be needed to explore limitations of our study. (1) Considering the ACE2 overexpression in our screen, it will be interesting to screen human cells expressing endogenous ACE2, which may potentially identify transcriptional regulators of ACE2. (2) The A549 cell line used in our CRISPR screen is a lung adenocarcinoma cell line. Given that various organs are affected by SARS-CoV-2, it will be helpful to understand whether there are tissue-specific host factors. (3) Although we show through multiple, distinct genetic perturbations that upregulation of the cholesterol biosynthesis pathway and increase in cellular cholesterol blocks SARS-CoV-2, the precise mechanisms of how changes in cholesterol disrupt viral infection remain to be elucidated. (4) Recent genome-wide association studies have uncovered human genetic variants associated with COVID-19 risk and severity. Since the majority of such variants are in noncoding regions, integrative analysis of genome-wide CRISPR screens may help pinpoint the causal genes through which these variants function.
STAR★Methods
Key Resources Table
| REAGENT or RESOURCE | SOURCE | IDENTIFIER |
|---|---|---|
| Antibodies | ||
| SARS-CoV-2 nucleocapsid (N) antibody (clone 1C7C7) | Center for Therapeutic Antibody Discovery at the Icahn School of Medicine at Mount Sinai | N/A |
| Mouse anti-2A (clone 3H4) | Millipore | Cat#MABS2005 |
| Rabbit anti-GAPDH (clone 14C10) | Cell Signaling | Cat#2118S; RRID: AB_561053 |
| IRDye 680RD donkey anti-rabbit | LI-COR | Cat#926-68073; RRID: AB_10954442 |
| IRDye 800CW donkey anti-mouse | LI-COR | Cat#926-32212; RRID: AB_621847 |
| Goat anti-human IgG Alexa Flour 568 | Thermo Fisher Scientific | Cat#A-21090; RRID: AB_2535746 |
| Goat anti-ACE2 | R&D Systems | Cat#AF933; RRID: AB_355722 |
| Anti-Goat APC | R&D Systems | Cat#F0108; RRID: AB_573124 |
| Rabbit anti-EEA1 | Thermo Fisher Scientific | Cat#MA5-14794; RRID: AB_10985824 |
| Goat anti-Mouse IgG Alexa 488 | Jackson Immuno Research | Cat#115-545-003; RRID: AB_2338840 |
| Goat anti-Rabbit IgG Alexa 594 | Jackson Immuno Research | Cat#711-585-152; RRID: AB_2340621 |
| Rabbit anti-RAB7A | NovusBio | Cat#NBP1-87174; RRID: AB_11004418 |
| Rabbit anti-CCDC22 | Proteintech | Cat#16636-1-AP; RRID: AB_2072065 |
| Rabbit anti-ATP6V1A | Proteintech | Cat#17115-1-AP; RRID: AB_2290195 |
| Rabbit anti-ACE2 | Thermo Fisher Scientific | Cat#MA5-32307; RRID: AB_2809589 |
| Mouse anti-beta tubulin | Thermo Fisher Scientific | Cat#32-2600; RRID: AB_2533072 |
| Bacterial and Virus Strains | ||
| NEB Stable Cells | New England Biolabs | Cat#C3040I |
| Chemicals, Peptides, and Recombinant Proteins | ||
| Polyethyleneimine | Polysciences | Cat#23966 |
| Taq B polymerase | Enzymatics | CAT#P7250L |
| Q5 High-Fidelity DNA polymerase | New England Biolabs | Cat#M0491L |
| PageRuler pre-stained protein ladder | Thermo Fisher Scientific | Cat#26616 |
| Lipofectamine RNAiMAX | Thermo Fisher Scientific | Cat#13778075 |
| Serabelisib | Selleckchem | Cat#S8581 |
| Idelalisib | Selleckchem | Cat#S2226 |
| Buparlisib | Selleckchem | Cat#S2247 |
| PIK-III | Selleckchem | Cat#S7683 |
| Compound 19 (VPS34 inhibitor 1) | Selleckchem | Cat#S8456 |
| SAR405 | Selleckchem | Cat#S7682 |
| Autophinib | Selleckchem | Cat#S8596 |
| Odanacatib | Selleckchem | Cat#S1115 |
| SID 26681509 | MedChemExpress | Cat#HY-103353 |
| ALLN | Selleckchem | Cat#S7386 |
| Sotrastaurin | Selleckchem | Cat#S2791 |
| Enzastaurin | Selleckchem | Cat#S1055 |
| Tamoxifen | Selleckchem | Cat#S1238 |
| Ilomastat | Selleckchem | Cat#S7157 |
| Doxycycline Hyclate | Selleckchem | Cat#S4163 |
| GSK6853 | MedChemExpress | Cat#HY-100220 |
| Olanzapine | Selleckchem | Cat#S2493 |
| Binimetinib (MEK162) | Selleckchem | Cat#S7007 |
| Mirdametinib | Selleckchem | Cat#S1036 |
| Gentamicin | Selleckchem | Cat#S4030 |
| Vorinostat | Selleckchem | Cat#S1047 |
| Belinostat | Selleckchem | Cat#S1085 |
| Panobinostat | Selleckchem | Cat#S1030 |
| Pracinostat | Selleckchem | Cat#S1515 |
| BRD4354 | MedChemExpress | Cat#HY-112719 |
| TMP195 | Selleckchem | Cat#S8502 |
| Remdesivir | Biovision | Cat#B2997-1000 |
| Amlodipine | Sigma | Cat#A5605 |
| Critical Commercial Assays | ||
| Pierce BCA protein assay kit | Thermo Fisher Scientific | Cat#23225 |
| Trypan Blue | Thermo Fisher Scientific | Cat#15250061 |
| LysoTracker DeepRed | Thermo Fisher Scientific | Cat#L12492 |
| Cholesterol-Glo assay | Promega | Cat#J3190 |
| TruSeq Stranded mRNA Library Prep Kit | Illumina | Cat#20040534 |
| 10x Genomics 5′ kit (Chromium Single Cell Immune Profiling Solution v1.0) | 10x Genomics | Cat #1000014, #1000020, #1000151 |
| LIVE/DEAD Fixable Violet Dead Stain Kit | Thermo Fisher Scientific | Cat#L34864 |
| KAPA SYBR FAST One-step Universal qRT-PCR Kit | Roche | Cat#KK4652 |
| SYBR Fast qPCR (KAPA) | Roche | Cat#KK4602 |
| SuperScript Reverse Transcriptase II | Thermo Fisher Scientific | Cat#18064022 |
| Deposited Data | ||
| GeCKOv2 CRISPR Screen in A549-ACE2 infected with SARS-CoV-2 | This study | GEO accession: GSE158298 |
| scRNA seq of A549-ACE CRISPR preturbed cells | This study | GEO accession: GSE159519 |
| RNA seq of DMSO or Amplodipine treated A549-ACE2 cells | This study | GEO accession: GSE159522 |
| Experimental Models: Cell Lines | ||
| HEK293FT | Thermo Fisher Scientific | Cat#R70007 |
| Caco-2 | ATCC | Cat#HTB-37 |
| Vero E6 | ATCC | Cat#CRL-1586 |
| Calu-3 | ATCC | Cat#HTB-55 |
| A549-ACE2 | this study | N/A |
| Huh7.5-ACE2 | Daniloski et al., 2020 | N/A |
| Oligonucleotides | ||
| SARS-2 qPCR N mRNA forward: 5′-CTCTTGTAGATCTGTTCTCTAAACGAAC-3′ | This study | N/A |
| SARS-2 qPCR N mRNA reverse: 5′-GGTCCACCAAACGTAATGCG-3′ | This study | N/A |
| Beta Tubulin forward: 5′-GCCTGGACCACAAGTTTGAC-3 | This study | N/A |
| Beta Tubulin reverse: 5′-TGAAATTCTGGGAGCATGAC-3′ | This study | N/A |
| Recombinant DNA | ||
| pHR-PGK-hACE | This study | Addgene 161612 |
| pCV-EF1a-hACE2-hygro | Daniloski et al., 2020 | Addgene 161758 |
| pCC_01 - lenti-hU6-sgRNA(F+E)-EFS-Cas9-NLS2A-Puro | Legut et al., 2020 | Addgene 139086 |
| GeCKOv2 A and B libraries | Sanjana et al., 2014 | Addgene 1000000048 |
| pMD2.G | Trono Lab Packaging and Envelope Plasmids | Addgene 12259 |
| psPAX2 | Trono Lab Packaging and Envelope Plasmids | Addgene 12260 |
| Software and Algorithms | ||
| MaGeCK pipeline was used for the analysis of the CRISPR screen | Chen et al., 2018 | N/A |
| FlowJo v10 | BD Biosciences | N/A |
| GraphPad Prism 8 | GraphPad | N/A |
| Cellranger v3.0.1 | 10x Genomics | N/A |
| Seurat R package v3.2 | Stuart et al., 2019 | N/A |
| DESeq2 | Love et al., 2014 | N/A |
| STRING tool | Szklarczyk et al., 2019 | N/A |
Resource Availability
Lead Contact
Further information and requests for resources and reagents should be directed to and will be fulfilled by the Lead Contact, Neville Sanjana (neville@sanjanalab.org).
Materials Availability
The pHR-PGK-ACE2 vector generated in this study is available through Addgene (161612).
Data and Code Availability
CRISPR screen, single cell RNA-sequencing/ECCITE-seq and bulk RNA-sequencing datasets are available on the GEO repository with accession numbers GSE158298, GSE159519 and GSE159522, respectively.
Experimental Models and Subject Details
Mammalian cell lines and culture conditions
Human alveolar basal epithelial carcinoma cells (A549, ATCC CCL-185), human hepatocellular carcinoma (Huh7.5, a kind gift from C. Rice), human colorectal carcinoma (Caco-2, ATCC HTB-37), lung adenocarcinoma (Calu-3, ATCC HTB-55), monkey kidney epithelial cells (Vero E6, ATCC CRL-1586) and human embryonic kidney cells HEK293FT (Thermo) were used in our study. HEK293FT, Huh7.5, and Caco-2 cells were maintained at 37°C and 5% CO2 in D10 media, which consists of DMEM (Caisson Labs) with 10% Serum Plus II Medium Supplement (Sigma-Aldrich). Calu-3 and Vero E6 cells were maintained in EMEM (ATCC) media with 10% Serum Plus II Medium Supplement (Sigma-Aldrich).
Viral strains
SARS-related coronavirus 2 (SARS-CoV-2), isolate USA-WA1/2020 (NR-52281), used in the study (Blanco-Melo et al., 2020; Daniloski et al., 2020 ). SARS-CoV-2 was grown in Vero E6 cells in DMEM supplemented with 2% FBS, 4.5 g/L D-glucose, 4 mM L-glutamine, 10 mM non-essential amino acids, 1 mM sodium pyruvate and 10 mM HEPES. Plaque assays were used to determine infectious titers of SARS-CoV-2 by infection of Vero E6 cells in Minimum Essential Media supplemented with 2% FBS, 4 mM L-glutamine, 0.2% BSA, 10 mM HEPES and 0.12% NaHCO3 and 0.7% agar.
Method Details
Generation of A549ACE2 line
To generate ACE2 expressing cells, the human ACE2 coding sequence was amplified and cloned into the BamHI site of the lentiviral vector pHR-PGK (Addgene 79120). We generated lentiviral particles (as described below) and transduced 5x10⁴ A549 cells plated in a 12-well plate in the presence of polybrene (8 μg/ml). We confirmed hACE2 expression by western blot analysis (Thermo MA5-32307).
Lentiviral production, transduction and SARS-CoV-2 infection
The Human GeCKOv2 A and B libraries (Addgene 1000000048) were used for genome-scale CRISPR knockout screens (Sanjana et al., 2014). We mixed equal amount of the A and B library plasmids to target each gene with 6 guide RNAs. Briefly, 225cm2 flasks of 80% confluent HEK293FT cells (Thermo) were transfected with 25 μg GeCKOv2 plasmid, 14 μg pMD2.G and 20 μg psPAX2 mixed in 2.5 mL OptiMEM (Thermo) and 175 μL Polyethylenimine (1 mg/ml) (Polysciences). After 6 hours, media was changed to D10 media with 1% bovine serum albumin (Sigma) added to improve virus stability. After 60 hours, viral supernatants were harvested and centrifuged at 3,000 rpm at 4°C for 10 min to pellet cell debris debris and filtered using 45 μm PVDF filters (CellTreat). The supernatant was then ultracentrifuged for 2 hours at 100,000 g (Sorvall Lynx 6000) and the pellet resuspended overnight at 4°C in PBS with 1% BSA.
Following lentiviral titration, 330 million A549ACE2 expressing cells were transduced at MOI of 0.5. Cells were selected with 2 μg/uL puromycin (Thermo) for 12 days to ensure proper selection. Throughout the experiment the representation was monitored such that each guide RNA is represented by at least 1000 cells (∼125 M cells).
We infected GeCKOv2-transduced cells (∼1000x representation) with SARS-CoV-2 isolate USA-WA1/2020 (NR-52281) at either MOI of 0.01 (low MOI) and 0.3 (high MOI). Surviving cells were collected on day 6 post-infection for genomic DNA isolation.
Genomic DNA isolation, guide RNA amplification and quantification
We used a two-step PCR protocol (PCR1 and PCR2) to amplify the guide RNA cassette for Illumina sequencing from genomic DNA (gDNA). The gDNA was extracted from CRISPR screen cells using the following protocol (Chen et al., 2015): Per 100 million cells, 12 mL of NK Lysis Buffer (50 mM Tris, 50 mM EDTA, 1% SDS, pH 8) were used for cell lysis. Once cells were resuspended, 60 μL of 20 mg/ml Proteinase K (QIAGEN) was added and the sample was incubated at 55°C overnight. The next day, 60 μL of 20 μg/mL RNase A (QIAGEN) was added, mixed, and samples were incubated at 37°C for 30 min. Then 4 mL of pre-chilled 7.5 M ammonium acetate was added, samples were vortexed and spun at 4,000 g for 10 min. The supernatant was placed in a new tube, mixed well with 12 mL isopropanol and spun at 4,000 g for 10 min. DNA pellets were washed with 12 mL of 70% ethanol, spun, dried and pellets were resuspended with 0.2x TE buffer (Sigma).
For the first PCR reaction, we used all gDNA available for each sample. We performed the PCR1 using Taq-B polymerase (Enzymatics) and used multiple reactions where each reaction contained up to 10 μg gDNA per 100 μL PCR reaction. PCR1 products for each sample were pooled and used for amplification with barcoded PCR2 primers. For each sample, we performed 12 PCR2 reactions (using 5 μL of the pooled PCR1 product per PCR2 reaction) with Q5 polymerase (NEB). PCR2 products were pooled and then normalized within each biological sample before combining uniquely-barcoded separate biological samples. The pooled product was then gel-purified from a 2% E-gel EX (Life Technologies) using the QiaQuick gel extraction kit (QIAGEN). The purified, pooled library was then quantified with Tapestation 4200 (Agilent Technologies). PCR products were run on a 2% agarose gel and the correct size band was extracted. Sequencing was performed on the NextSeq 550 instrument using the HighOutput Mode v2 with 75 bp paired-end reads (Illumina). For PCR1 the following primer set was used: 5′ GAGGGCCTATTTCCCATGATTC 3′ and 5′ GTTGCGAAAAAGAACGTTCACGG 3′. For PCR2 the following primers were used: 5′ AATGATACGGCGACCACCGAGATCTACACTCTTTCCCTACACGACGCTCTTCCGATCT (N1-9) (BC8) TCTTGTGGAAAGGACGAAACACCG 3′ and 5′ CAAGCAGAAGACGGCATACGAGAT (BC8) GTGACTGGAGTTCAGACGTGTGCTCTTCCGATCT (N1-9) TCTACTATTCTTTCCCCTGCACTGT 3′, where N is a stagger of 1 to 9 nucleotides and BC is a barcode of 6 nucleotides.
Sequencing reads were demultiplexed upon sequencing based on Illumina i7 barcodes present in PCR2 reverse primers using Illumina BaseSpace. We performed adaptor trimming by treating the hU6 promoter sequence as a 5′ adaptor, using cutadapt v1.13 [-e 0.2 -O 5 -m 20 -g TCTTGTGGAAAGGACGAAACACCG]. Processed guide RNA sequences were aligned to the GeCKOv2 reference allowing for up to 1 mismatch using bowtie v1.1.2 [-a–best–strata -v 1 –norc] with alignment rates of 81% to 86%.
Computational analyses of genome-scale CRISPR screens
Guide RNA counts were processed using the MaGeCK pipeline with an output of RRA p-values and gene ranks (Chen et al., 2018). We separately ranked genes using the RIGER (weighted-sum) and second-best rank methods (Chen et al., 2015; Luo et al., 2008). Gene Set Enrichment Analyses were performed using the fgsea package with Gene Ontology for biological processes (c5.bp.v7.1.symbols) (Korotkevich et al., 2019). GTEx v8 tissue specific enrichment was performed using the Multi Gene Query function available on the GTEx website: https://www.gtexportal.org/home/multiGeneQueryPage (accessed August 1st, 2020) (Aguet et al., 2019). GO enrichments for SARS-CoV-2, ZIKV, and IAV CRISPR screens were performed using GOrilla to find all significant enrichments (FDR p-value < 10-3) (Eden et al., 2009). FDR p-values were log10-transformed and normalized to create the heatmap shown in Figure 3E.
Generation of gene-perturbed human cell lines and SARS-CoV-2 infection
For validation by CRISPR knock-out (using 3 independent guide RNAs per gene), we selected genes that were highly-ranked (either in the low or high MOI screen or both) or genes that had not previously been implicated in viral pathogenesis or immune signaling. For each gene of interest, 3 guide RNAs were designed using GUIDES software and were subsequently cloned into an all-in-one vector with an optimized Cas9 scaffold (pCC_01, Addgene 139086) containing Cas9, a guide RNA cassette and a puro resistant cassette (Legut et al., 2020; Meier et al., 2017). Following sequence confirmation by Sanger sequencing, lentivirus was produced individually for each plasmid and the target cells were transduced in presence of polybrene (10 μg/mL, Santa Cruz). Gene-perturbed A549ACE2, Huh7.5ACE2, Calu-3 and Caco-2 cells were selected for at least 10 days with 2 μg/mL (A549ACE2, Calu-3), 3 μg/mL (Caco-2) or 5 μg/mL (Huh7.5ACE2) puromycin (Thermo). To determine the SARS-CoV-2 infection susceptibility of gene-perturbed lines, 10,000 cells were plated per well of 96-well plates. After 24 hours, the cells were infected with SARS-CoV-2 at MOI of 0.1. At 36 hours post-infection, the cells were either fixed and processed for immunofluorescence or cellular RNA was harvested for qRT-PCR analyses. For the multistep growth curves, cells were infected at an MOI of 0.1, and total RNA was harvested from infected cells at indicated times. RNA was processed for qRT-PCR as described above. All infections with SARS-CoV-2 were performed with at least 3 biological replicates.
Immunofluorescence of nucleocapsid (N) protein
Cells were fixed with 5% formaldehyde and immunostained for nucleocapsid (N) protein and visualized with a secondary antibody labeled with AlexaFlour-568 (Thermo). SARS-CoV-2 nucleocapsid (N) antibody (clone 1C7C7) was obtained from the Center for Therapeutic Antibody Discovery at the Icahn School of Medicine at Mount Sinai. Nuclei were stained with DAPI. Full wells were imaged and quantified for SARS-CoV-2 infected cells using a Celigo imaging cytometer (Nexcelom Biosciences). All infections with SARS-CoV-2 were performed with 3 biological replicates. Representative images from the top gene knockout hits were acquired using the EVOS M5000 Imaging System (Thermo).
Identification of druggable genes and drug treatments
To identify druggable genes among the top CRISPR screen hits, we cross-referenced highly-ranked genes from the RRA analysis with the data table containing drugs and their gene targets was obtained from Drug Gene Interaction database (DGIdb, retrieved on June 3, 2020) as well as manual literature search (Cotto et al., 2018). Inhibitors that target the genes of interest (and remdesivir) was obtained from SelleckChem and MedChemExpress. The catalog number and vendor information is available in the Key Resource section. Amlodipine was obtained from Sigma (A5605).
To test drug efficacy in reducing SARS-CoV-2 infection, 10,000 A549ACE2 cells were seeded per well of a 96-well plate. Cells were treated with inhibitors at 10 μM for two hours before infection and inhibitors were maintained throughout the course of infection. Cells were infected with SARS-CoV-2 at MOI of 0.1 for 36 hours and the cells were collected for analysis via qRT-PCR or processed for immunofluorescence (N protein and quantified by Celigo). For Figure 4E, the remdesivir data was collected in an independent experiment.
Cell viability assays
Cell viability following drug treatments was performed the same way as described above. Thirty-six hours post drug treatment the cells were collected and stained with LIVE-DEAD Violet (Thermo). Cell acquisition was performed using a Sony SH800S cell sorter with a 100 μm sorting chip. We used the following gating strategy: 1) We excluded the cell debris based on the forward and reverse scatter; 2) Doublets were excluded by plotting FSC height versus FCS area, 3) Dead cells were quantified using live-dead violet stain. For all samples, we recorded at least 5,000 cells that pass the gating criteria described above. Flow cytometry analyses were performed using FlowJo v10. Cell viability for A549-ACE2 treated with DMSO or 10μM amlodipine was performed 24 hours post treatment using Trypan Blue (Thermo Fisher) and automated cell counting (Nexcelom AutoT4).
Quantitative reverse-transcription PCR (qRT-PCR) of viral RNA
RNA was extracted from cells grown in 96-well plates by using the RNeasy 96 Kit (QIAGEN) per the manufacturer’s instructions. RNA was reverse-transcribed and PCR amplified using SYBR Fast One-step Universal qRT-PCR Kit (KAPA/Roche). For amlodipine experiments, RNA was extracted using TRIzol Reagent (Invitrogen) and purified with the Direct-zol RNA Miniprep kit (Zymo Research) as per the manufacturer’s instructions (including the optional DNase I treatment). For amlodipine experiments, the RNA was reverse-transcribed using SuperScript Reverse Transcriptase II (Thermo Fisher) and oligo(dT) primers. The cDNA was diluted 1:20 before qRT-PCR was performed using SYBR Fast qPCR (KAPA/Roche). SARS-CoV-2 replication was assessed by using primers specific to the N mRNA (Forward 5′-CTCTTGTAGATCTGTTCTCTAAACGAAC-3′; Reverse 5′-GGTCCACCAAACGTAATGCG-3′). SARS-CoV-2 N mRNA levels were normalized to beta tubulin (Forward 5′-GCCTGGACCACAAGTTTGAC-3; Reverse 5′-TGAAATTCTGGGAGCATGAC-3′). Reactions were ran and analyzed on a Lightcycler 480 II Instrument (Roche). Relative quantification was calculated by comparing the cycle threshold (C t) values using ΔΔCt. C t values of subgenomic nucleocapsid transcript were normalized to C t values of alpha-tubulin, and those values were normalized to viral transcript levels of DMSO-treated or non-targeting guide RNA-transduced control samples, and displayed as fold-reduction in viral transcript. Significance was determined using a one-way ANOVA with post hoc tests or a two-tailed unpaired Student’s t test, as appropriate.
siRNA transfections and SARS-CoV-2 infection
All of the siRNAs were ordered from Dharmacon and their catalog number can be found in the Key Resources Table. To knockdown individual genes, 10,000 A549ACE2 cells were seeded in 96-well plates and transfected with siRNAs using Lipofectamine RNAiMAX (Thermo) following the manufacturer’s protocol. Forty-eight hours later, the cells were infected with SARS-CoV-2 at an MOI of 0.1 for 36 hours. Cells were fixed with 5% formaldehyde, stained with nucleocapsid protein (clone 1C7C7, ISMMS), and visualized with AlexaFluor-568 conjugated secondary antibody (Thermo). Nuclei were stained with DAPI, and full wells were imaged with a Celigo imaging cytometer (Nexcelom Biosciences).
Minipool CRISPR library and lentiviral production
To generate the minipool, we combined equimolar amounts the same guide RNA vectors (cloned in pCC1) that we used for arrayed validation (see above Generation of gene-perturbed A549ACE2 lines and SARS-CoV-2 infection). In total, we combined 3 guide RNAs for each gene (either, 30 or 11 genes) plus 9 non-targeting guide RNAs. The non-targeting guide RNA plasmids were added at half the molar ratio of the other plasmids. Lentivirus was produced via transfection of the minipool with appropriate packaging plasmids (psPAX2: Addgene 12260; pMD2.G: Addgene 12259) using polyethylenimine (PEI) reagent in HEK293FT. The target A549ACE2 cells were transduced in presence of polybrene (10 μg/mL, Santa Cruz) (ECCITE-Seq experiment 1) or without (ECCITE-seq experiment 2) at very low MOI to ensure entry of a single virus per cell. The survival was below 5% after 2 days of selection with 2 μg/mL puromycin (Thermo) for both ECCITE-seq experiments. On day 10 post-transduction, the cells were collected and processed for ECCITE-seq.
Expanded CRISPR-compatible Cellular Indexing of Transcriptomes and Epitopes (ECCITE-seq)
To perform cell-hashing and ECCITE-seq (Mimitou et al., 2019; Stoeckius et al., 2018), we separated cells into several sub-pools and, for each pool, we resuspended 1 million cells in 100 μl staining buffer (2% BSA, 0.01% Tween in PBS). We then added 10 μl Human TruStain FcX Fc Receptor Blocking Solution (BioLegend) and incubated on ice for 10 minutes. We then added hashing antibodies (BioLegend), incubated on ice for 30 minutes, and washed cells 3 times with staining buffer. In total, we ran four lanes of a Chromium Single Cell Immune Profiling Solution v1.0 5′ kit (10x Genomics) targeting recovery of 12,000 cells per lane (superloading) in experiment 1 and 20,000 cells in experiment 2. Gene expression (mRNA), hashtags (Hashtag-derived oligos, HTOs) and guide RNA (Guide-derived oligos, GDOs) libraries were constructed (Smibert et al., 2019). Each replicate was sequenced on two NextSeq550 75-cycle high-output runs (Illumina). Sequencing reads from the mRNA library were mapped to the hg38 reference genome (Ensembl v97) using Cellranger (v3.0.1, 10x Genomics). To generate count matrices for HTO and GDO libraries, the CITE-seq-count package was used (https://github.com/Hoohm/CITE-seq-Count v1.4.2). Count matrices were then used as input into the Seurat R package (v3.2) for downstream analyses (Stuart et al., 2019).
ECCITE-seq data analysis
Processing of initial ECCITE-seq experiment with 30 target genes
Cells with low quality metrics, high mitochondrial gene content (> 17.5%) and low number of genes detected (≤1800) were removed. The median number of detected genes was 3309. RNA counts were log-normalized and HTO counts were normalized using the centered log-ratio transformation approach, with margin = 2 (normalizing across cells). To identify cell doublets and assign experimental conditions to cells, we used the HTOseqDemux function (Stoeckius et al., 2018). HTOseqDemux-defined cell doublets and negatives were removed from any downstream analyses.
Cellular guide RNA identity for cells in the ECCITE-seq pool was assigned based on GDO unique molecular identifier (UMI) counts. We considered a guide RNA detected with ≥ 16 UMI counts (the median UMI counts per guide RNA was 503 counts, 93% of cells with ≥ 1 sgRNA). We observed that 64% of the cells had > 1 detected guide RNA (29% 1 guide RNA, 27% 2 guide RNAs, 17% 3 guide RNAs). To maximize cell recovery, we retained cells with 1 - 3 guide RNAs per cell (n = 10,265). We collapsed the guide RNA information down to target gene level (3 guide RNA per target gene) in the following way: For all cells (with 1-3 guide RNAs), we assigned a unique target gene if all detected guide RNAs targeted the same gene, or if the additional guide RNA detected was a non-targeting (NT) guide RNA (4,715 cells: 4,013 cells with exactly 1 sgRNA and 702 cells with collapsed target gene assignment). All remaining cells assigned 2 or 3 separate target genes were discarded.
Some of the top-ranked genes from the CRISPR screens may be endpoint genes and thus may have subtle phenotypes difficult to detect using single-cell transcriptomics. To address this issue, we used the initial ECCITE-seq experiment (n = 4,715 cells) and grouped cells by target gene. To identify target gene perturbations that lead to systemic transcriptomic changes, we determined the number of differentially expressed genes relative to cells with NT guide RNAs. We found that under stringent filtering conditions (non-adjusted p-value < 10−5 or adjusted p-value < 0.2), only 11 target genes showed more than 5 differentially expressed genes. The second ECCITE-seq experiment was conducted using guide RNAs solely for these.
Joint processing of both ECCITE-seq experiments
Cells with low quality metrics, high mitochondrial gene content (> 15%) and low or high number of genes detected (≤2000 and > 5000) were removed. The median number of detected genes was 3365, with a median of 13,532 UMIs per cell. HTO counts were normalized using the centered log-ratio transformation approach, with margin = 2 (normalizing across cells). To identify cell doublets and assign experimental conditions to cells, we used the HTOseqDemux function (Stoeckius et al., 2018). HTOseqDemux-defined cell doublets and negatives were removed from any downstream analyses. Guide RNA counts were normalized similar to HTO UMI counts. Cell-wise guide RNA assignment was achieved using the MultiSeqDemux function (McGinnis et al., 2019). We only retained cells assigned with a single HTO and a single guide RNA (ECCITE-seq experiment 1: n = 1,824 cells, ECCITE-seq experiment 2: n = 17,029 cells). Cells from ECCITE-Seq experiment 1 and experiment 2 were harmonized by log-normalizing, followed by the identification of the 2000 most variable features with “vst” selection method. Next, we we used FindIntegrationAnchors and IntegrateData with the first 40 principle components.
In the harmonized dataset (n = 18,853 cells), we used FindMarkers to find differentially expressed genes between non-targeting cells and cells that belonged to a targeted gene class. We used up to 100 of the most upregulated genes with adjusted p-value < 0.01 and minimal logeFC threshold > 0.1 filter as input into the heatmap in Figure 5B. The same FindMarkers analysis (but using the non-adjusted p-value < 0.01 with a maximum of the 300 most significant DEGs) was used as input into the EnrichR package to run pathway analysis using the human WikiPathways database (v. 2019) (Kuleshov et al., 2016; Slenter et al., 2018). Figure 5C shows -log10 transformed p-values for the union of all enriched pathways with an adjusted p-value < 0.01 across the 11 target genes with perturbation signatures.
Plaque assay
Infectious titer in supernatant of SARS-CoV-2 infections (from A549ACE2) was determined by plaque assay in Vero E6 cells. Cells were seeded in 12-well plates before infection with logarithmically diluted supernatants in a total inoculum of 100 ul, rocking plates every 10 minutes for 1 hour. Then an overlay of Minimum Essential Media with 0.12% NaHCO3, 4 mM L-glutamine, 0.2% BSA, 10 mM HEPES and 0.7% OXOID agar (Thermo) was aliquoted into wells and plates were incubated for 48 hours before fixing with 5% formaldehyde. After 24 hours, plaques were stained with crystal violet (1% crystal violet in 20% EtOH) for 15 minutes before washing wells and counting plaques.
Bulk RNA-sequencing
RNA-sequencing libraries were constructed from 1ug of RNA per sample using the TruSeq Stranded mRNA Library Prep Kit (Illumina) according to the manufacturer’s instructions. Sequencing libraries were sequenced using an Illumina NextSeq 500 platform and fastq files were generated using bcl2fastq (Illumina). Alignment to the SARS-CoV-2 genome (GenBank: MN985325.1) were performed using bowtie (Langmead et al., 2009). Reads were aligned to hg19 using STAR aligner in the Basespace RNA-Seq Alignment application (Illumina) and processed using DESeq2 (Love et al., 2014). Sample distances were calculated using read counts from the regularized log transform in DESeq2. K-means clustering was perfomed using the kmeans function in R/RStudio. Enriched Reactome pathways were identified using the STRING tool (Szklarczyk et al., 2019).
Measurement of cellular cholesterol
Cellular cholesterol was measured using the Cholesterol-Glo assay (Promega). For each cell line (CRISPR-perturbed or drug-treated), we counted 100,000 cells, washed with 1xPBS twice and resuspended in 100 μL cell lysis solution for 30 min at 37°C. Following the incubation, 10 μL of cell lysate was used to measure the cholesterol levels in 96 well plates in a final reaction volume of 100uL per well (without esterase). Luminescence was measured after incubating the plate for 1 hour at room temperature in the dark. Using the same lysis sample, the protein concentration was determined using the BCA assay (Thermo). The cholesterol levels were normalized to the respective protein concentration of each sample. A549ACE cells were incubated with 10 μM amlodipine (Sigma) or DMSO for 24 hours. Cholesterol levels were then determined as described above.
Flow cytometry of ACE2 cell surface expression
Cells were harvested, counted and about 100,000 cells were washed with Dulbecco’s phosphate-buffered saline (PBS, Caisson Labs) and then stained with LIVE/DEAD Violet stain (Thermo, 34864). Following a wash with 1x PBS, all subsequent washes and antibody dilutions were performed using 1x PBS supplemented with 2% FBS. Wild-type or Cas9-perturbed A549ACE2, Caco-2 and Calu-3 cells were stained for 30 min on ice with 0.25 μg of anti-ACE2 antibody (R&D Systems, AF933) in ∼50 μL residual volume. Following two washes with 1x PBS with 2% FBS, samples were stained on ice for 20 min with 7.5 μL of anti-goat-APC secondary antibody (R&D Systems, F0108). Cell acquisition and sorting was performed using a Sony SH800S cell sorter with a 100 μm sorting chip. We used the following gating strategy: 1) We excluded the cell debris based on the forward and reverse scatter; 2) Doublets were excluded by plotting FSC height versus FCS area, 3) Dead cells were excluded by live-dead stain. We recorded at least 5,000 cells for A549ACE2 and at least 3,000 cells for Calu-3 and Caco-2 that pass the gating criteria described above. Gates to determine ACE2-APC+ cells were set based on control A549 wild-type cells or only secondary antibody stained Calu-3 and Caco-2, where the percent of ACE2 positive cells was set as < 5% (background level). Flow cytometry analyses were performed using FlowJo v10.
Immunofluorescence of ACE2 and endo/lysosomal markers
A549ACE2 Cas9-transduced (specific gene or non-targeting) cell lines were seeded on poly-D-lysine-coated coverslips (Electron Microscopy Sciences) 24 hours before they were fixed with 4% formaldehyde (Sigma) diluted in 1x PBS (Caisson Labs) (Daniloski et al., 2020). Following 3 washes with 1x PBS, cells were blocked with 1x PBS with 2% BSA for 30 min at room temperature. Cells were stained with mouse anti-2A antibody diluted at 1:250 (clone 3H4, Millipore Sigma, MABS2005) to recognize ACE2-2A, and rabbit anti-EEA1 diluted at 1:100 (Thermo, MA5-14794). To detect ACE2 in Caco-2 cells, goat anti-ACE2 (R&D Systems, AF933) was used at 1.25 μg/mL. Cell were incubated with primary antibodies for 3 hours at room temperature in a moisturized chamber. Coverslips were then washed 5 times with 1x PBS with 2% BSA and then incubated with Alexa-conjugated secondary antibodies (Jackson ImmunoResearch) diluted at 1:1000 for 45 min at room temperature. Coverslips were then washed 5 times with 1x PBS with 2%BSA, and DAPI (Sigma) was added in the fourth wash at a concentration of 0.1 μg/mL. To stain the lysosomes, LysoTracker DeepRed (Thermo) was diluted to 70 nM in culture media and was added to actively growing cells on coverslips and were incubated for 1 hour at 37°C. Following incubation with LysoTracker, cells were processed for immunofluorescence as described above. Confocal images were acquired on a Zeiss LSM 780 with a 20x/0.8 Plan-Apochromat objective or a 63x/1.4 Plan-Apochromat objective (Zeiss). Epifluorescence images were acquired using the same system; both fitted with a Zeiss Axiocam 506 mono (Zeiss). Images were processed using Zen Black 2012 (Zeiss) and FIJI 2.1.0; Java 1.8.0-202 (Schindelin et al., 2012). Linear histogram adjustments were applied uniformly within experiments for clarity of presentation.
ACE2 localization was determined on images taken on a Zeiss LSM 780 with a 20x/0.8 Plan-Apochromat objective using Zen Black (Zeiss). The A549ACE2 polyclonal cell line had both ACE2 positive and negative cells. Only ACE2 positive cells were then manually scored if they had a distinct accumulation of cytoplasmic vesicles-like hollow structures, compared to the non-targeting (NT) control. In the NT control, the ACE2 staining was seen on the plasma membrane and diffuse in the cytoplasm. The scoring was performed on 2 biological replicates (that is, two separate non-targeting controls and two separate Rab7A knockout lines engineered using 4 separate Cas9 guide RNAs). We scored ∼430 cells per replicate. To quantify the size of ACE2 foci, confocal microscopy images were thresholded using FIJI’s local-threshold (Phansalkar radius = 15) and then a watershed transform was applied. Foci were counted and measured using FIJI’s Analyze Particles function.
Western blots
A549ACE2 or Huh7.5ACE2 cells were collected, washed with 1x PBS and lysed with TNE buffer (10 mM Tris-HCl, pH 7.4, 150 mM NaCl, 1mM EDTA, 1% Nonidet P-40) in presence of protease inhibitor cocktail (Bimake B14001) for 1 hour on ice. Cells lysates were spun for 10 min at 10,000 g, and protein concentration was determined with the BCA assay (Thermo). Equal amounts of cell lysates (20 μg) were denatured in Tris-Glycine SDS Sample buffer (Thermo LC2676), and loaded on a Novex 4 - 20% Tris-Glycine gel (Thermo XP04205BOX). PageRuler pre-stained protein ladder (Thermo 26616) was used to determine the protein size. The gel was run in 1x Tris-Glycine-SDS buffer (IBI Scientific IBI01160) for about 120 min at 120V. Proteins were transferred on a nitrocellulose membrane (BioRad 1620112) in presence of prechilled 1x Tris-Glycine transfer buffer (FisherSci LC3675) supplemented with 20% methanol for 100 min at 100V. Immunoblots were blocked with 5% skim milk dissolved in 1x PBS with 1% Tween-20 (PBST) and incubated overnight at 4°C separately with the following primary antibodies: rabbit anti-RAB7A (0.1 μg/mL, NovusBio, NBP1-87174), rabbit anti-GAPDH (0.1 μg/mL, Cell Signaling, 2118S), rabbit anti-CCDC22 (0.34 μg/mL, Proteintech, 16636-1-AP), rabbit anti-ATP6V1A (0.46 μg/mL, Proteintech, 17115-1-AP), rabbit anti-ACE2 (0.5 μg/mL, Invitrogen, MA5-32307), and mouse anti-beta tubulin (0.5 μg/mL, Invitrogen, 32-2600). Following the primary antibody, the blots were incubated with IRDye 680RD donkey anti-rabbit (0.2 μg/mL, LI-COR 926-68073) or with IRDye 800CW donkey anti-mouse (0.2 μg/mL, LI-COR 926-32212). The blots were imaged using Odyssey CLx (LI-COR).
Quantification and Statistical Analysis
Statistical analysis
Statistical parameters and details are reported in each figure legend. Generally, experiments were repeated with at least three biological replicates. Each plot includes points for individual biological replicates and mean ± s.e.m. error bars unless otherwise specified. In general, biological replicates consist of replicate viral transductions (CRISPR), replicate RNA transfections (siRNA), or replicate drug treatments (small molecule inhibitors) and are specified in each figure legend. For imaging experiments, the number of cells scored per biological replicate is given in the figure legend.
When assessing significance of genetic perturbations and/or inhibitor treatments, we employed first a one-way or two-way ANOVA to assess significance and, when significant, post hoc comparisons were performed using the false-discovery rate method of Benjamini-Krieger-Yekutieli to correct for multiple comparisons. Before applying ANOVA, we first verified the equality of group variances using the Brown-Forsythe test. Details for all ANOVA and post hoc multiple comparisons are reported in Table S6; t tests are reported in the respective figure legends.
Throughout the manuscript, we use r to denote the Pearson correlation and r s to denote the Spearman correlation; all reported correlations were significant using the cor.test function in R. For the BioID interactome analysis, we derived an empirical p value by resampling from a null distribution (n = 10,000 gene shuffling iterations). Statistical analyses were performed in GraphPad Prism 8 and RStudio 1.2.5019.
Acknowledgments
We thank the entire Sanjana and tenOever laboratories for support and advice. We also thank the New York Genome Center for flow cytometry and confocal microscopy resources and T. Maniatis for advice. Z.D. is supported by an American Heart Association postdoctoral fellowship (20POST35220040). Postdoctoral fellowship support for T.X.J. is provided by the NIH (R01AI123155). M.L. is supported by the Hope Funds for Cancer Research postdoctoral fellowship. T.L. is supported by NIH/NIMH (R01MH106842) and NIH/NHGRI (UM1HG008901). S.K. and T.L. are supported by NIH/NHLBI (R01HL142028). B.R.t. is supported by the Marc Haas Foundation, the NIH, and DARPA’s PREPARE Program (HR0011-20-2-0040). N.E.S. is supported by NYU and NYGC startup funds, NIH/NHGRI (DP2HG010099), NIH/NCI (R01CA218668), DARPA (D18AP00053), the Sidney Kimmel Foundation, and the Brain and Behavior Foundation.
Author Contributions
Z.D., T.X.J., B.R.t., and N.E.S. conceived the project. Z.D., T.X.J., B.R.t., and N.E.S. designed and performed the genome-scale CRISPR screen. N.E.S., Z.D., H.-H.W., and E.G. analyzed the CRISPR screen. Z.D., T.X.J., D.A.H., M.L, L.L., B.R.t., and N.E.S. designed and performed the arrayed validation and inhibitor work. T.X.J. performed BSL3 work. O.D. and B.R.R. made the transgenic A549 cells. H.-H.W., Z.D., E.P.M., P.S., and N.E.S. designed and performed the single-cell experiments. S.M., Z.D., and N.E.S. designed and performed the endosomal trafficking experiments. S.K. and T.L. assisted with genetic analyses. N.E.S., B.R.t., H.P., P.S., and T.L. supervised the work. Z.D., T.X.J., H.-H.W., D.A.H., B.R.t., and N.E.S. wrote the manuscript with input from all the authors.
Declaration of Interests
N.E.S. is an advisor to Vertex. T.L. is a member of the scientific advisory boards of Goldfinch Bio and, with equity, Variant Bio. The New York Genome Center and New York University have applied for patents relating to the work in this article.
Published: October 25, 2021
Footnotes
Supplemental Information can be found online at https://doi.org/10.1016/j.cell.2020.10.030.
Supplemental Information
References
- Aguet F., Barbeira A.N., Bonazzola R., Brown A., Castel S.E., Jo B., Kasela S., Kim-Hellmuth S., Liang Y., Oliva M., et al. The GTEx Consortium atlas of genetic regulatory effects across human tissues. bioRxiv. 2019 doi: 10.1101/787903. [DOI] [Google Scholar]
- Aizaki H., Morikawa K., Fukasawa M., Hara H., Inoue Y., Tani H., Saito K., Nishijima M., Hanada K., Matsuura Y., et al. Critical role of virion-associated cholesterol and sphingolipid in hepatitis C virus infection. J. Virol. 2008;82:5715–5724. doi: 10.1128/JVI.02530-07. [DOI] [PMC free article] [PubMed] [Google Scholar]
- Bajimaya S., Frankl T., Hayashi T., Takimoto T. Cholesterol is required for stability and infectivity of influenza A and respiratory syncytial viruses. Virology. 2017;510:234–241. doi: 10.1016/j.virol.2017.07.024. [DOI] [PMC free article] [PubMed] [Google Scholar]
- Banerjee S., Kane P.M. Regulation of V-ATPase Activity and Organelle pH by Phosphatidylinositol Phosphate Lipids. Front. Cell Dev. Biol. 2020;8:510. doi: 10.3389/fcell.2020.00510. [DOI] [PMC free article] [PubMed] [Google Scholar]
- Beigel J.H., Tomashek K.M., Dodd L.E., Mehta A.K., Zingman B.S., Kalil A.C., Hohmann E., Chu H.Y., Luetkemeyer A., Kline S., et al. Remdesivir for the Treatment of Covid-19 - Preliminary Report. N. Engl. J. Med. 2020 doi: 10.1056/NEJMoa2007764. Published online May 22 2020. [DOI] [PMC free article] [PubMed] [Google Scholar]
- Blanco-Melo D., Nilsson-Payant B.E., Liu W.-C., Uhl S., Hoagland D., Møller R., Jordan T.X., Oishi K., Panis M., Sachs D., et al. Imbalanced Host Response to SARS-CoV-2 Drives Development of COVID-19. Cell. 2020;181:1036–1045. doi: 10.1016/j.cell.2020.04.026. [DOI] [PMC free article] [PubMed] [Google Scholar]
- Bouhaddou M., Memon D., Meyer B., White K.M., Rezelj V.V., Correa Marrero M., Polacco B.J., Melnyk J.E., Ulferts S., Kaake R.M., et al. The Global Phosphorylation Landscape of SARS-CoV-2 Infection. Cell. 2020;182:685–712. doi: 10.1016/j.cell.2020.06.034. [DOI] [PMC free article] [PubMed] [Google Scholar]
- Chang T.-Y., Reid P.C., Sugii S., Ohgami N., Cruz J.C., Chang C.C.Y. Niemann-Pick type C disease and intracellular cholesterol trafficking. J. Biol. Chem. 2005;280:20917–20920. doi: 10.1074/jbc.R400040200. [DOI] [PubMed] [Google Scholar]
- Chen S., Sanjana N.E., Zheng K., Shalem O., Lee K., Shi X., Scott D.A., Song J., Pan J.Q., Weissleder R., et al. Genome-wide CRISPR screen in a mouse model of tumor growth and metastasis. Cell. 2015;160:1246–1260. doi: 10.1016/j.cell.2015.02.038. [DOI] [PMC free article] [PubMed] [Google Scholar]
- Chen C.-H., Xiao T., Xu H., Jiang P., Meyer C.A., Li W., Brown M., Liu X.S. Improved design and analysis of CRISPR knockout screens. Bioinformatics. 2018;34:4095–4101. doi: 10.1093/bioinformatics/bty450. [DOI] [PMC free article] [PubMed] [Google Scholar]
- Cotto K.C., Wagner A.H., Feng Y.-Y., Kiwala S., Coffman A.C., Spies G., Wollam A., Spies N.C., Griffith O.L., Griffith M. DGIdb 3.0: a redesign and expansion of the drug-gene interaction database. Nucleic Acids Res. 2018;46(D1):D1068–D1073. doi: 10.1093/nar/gkx1143. [DOI] [PMC free article] [PubMed] [Google Scholar]
- Daniloski Z., Jordan T.X., Ilmain J.K., Guo X., Bhabha G., tenOever B.R., Sanjana N.E. The Spike D614G mutation increases SARS-CoV-2 infection of multiple human cell types. bioRxiv. 2020 doi: 10.1101/2020.06.14.151357. [DOI] [PMC free article] [PubMed] [Google Scholar]
- Du L., He Y., Zhou Y., Liu S., Zheng B.-J., Jiang S. The spike protein of SARS-CoV--a target for vaccine and therapeutic development. Nat. Rev. Microbiol. 2009;7:226–236. doi: 10.1038/nrmicro2090. [DOI] [PMC free article] [PubMed] [Google Scholar]
- Eden E., Navon R., Steinfeld I., Lipson D., Yakhini Z. GOrilla: a tool for discovery and visualization of enriched GO terms in ranked gene lists. BMC Bioinformatics. 2009;10:48. doi: 10.1186/1471-2105-10-48. [DOI] [PMC free article] [PubMed] [Google Scholar]
- Erb M.A., Scott T.G., Li B.E., Xie H., Paulk J., Seo H.-S., Souza A., Roberts J.M., Dastjerdi S., Buckley D.L., et al. Transcription control by the ENL YEATS domain in acute leukaemia. Nature. 2017;543:270–274. doi: 10.1038/nature21688. [DOI] [PMC free article] [PubMed] [Google Scholar]
- Funk C.D., Laferrière C., Ardakani A. A Snapshot of the Global Race for Vaccines Targeting SARS-CoV-2 and the COVID-19 Pandemic. Front. Pharmacol. 2020;11:937. doi: 10.3389/fphar.2020.00937. [DOI] [PMC free article] [PubMed] [Google Scholar]
- Gardner L. 2020. Johns Hopkins Coronavirus Resource Center.https://coronavirus.jhu.edu/ [Google Scholar]
- Gates B. Responding to Covid-19 - A Once-in-a-Century Pandemic? N. Engl. J. Med. 2020;382:1677–1679. doi: 10.1056/NEJMp2003762. [DOI] [PubMed] [Google Scholar]
- Girard E., Chmiest D., Fournier N., Johannes L., Paul J.-L., Vedie B., Lamaze C. Rab7 is functionally required for selective cargo sorting at the early endosome. Traffic. 2014;15:309–326. doi: 10.1111/tra.12143. [DOI] [PubMed] [Google Scholar]
- Gordon D.E., Jang G.M., Bouhaddou M., Xu J., Obernier K., White K.M., O’Meara M.J., Rezelj V.V., Guo J.Z., Swaney D.L., et al. A SARS-CoV-2 protein interaction map reveals targets for drug repurposing. Nature. 2020;583:459–468. doi: 10.1038/s41586-020-2286-9. [DOI] [PMC free article] [PubMed] [Google Scholar]
- Guerra F., Bucci C. Multiple Roles of the Small GTPase Rab7. Cells. 2016;5:34. doi: 10.3390/cells5030034. [DOI] [PMC free article] [PubMed] [Google Scholar]
- Heaton B.E., Trimarco J.D., Hamele C.E., Harding A.T., Tata A., Zhu X., Tata P.R., Smith C.M., Heaton N.S. SRSF protein kinases 1 and 2 are essential host factors for human coronaviruses including SARS-CoV-2. bioRxiv. 2020 doi: 10.1101/2020.08.14.251207. [DOI] [Google Scholar]
- Hoagland D.A., Clarke D.J.B., Møller R., Han Y., Yang L., Wojciechowicz M.L., Lachmann A., Oguntuyo K.Y., Stevens C., Lee B., et al. Modulating the transcriptional landscape of SARS-CoV-2 as an effective method for developing antiviral compounds. bioRxiv. 2020 doi: 10.1101/2020.07.12.199687. [DOI] [Google Scholar]
- Hoffmann M., Kleine-Weber H., Schroeder S., Krüger N., Herrler T., Erichsen S., Schiergens T.S., Herrler G., Wu N.-H., Nitsche A., et al. SARS-CoV-2 Cell Entry Depends on ACE2 and TMPRSS2 and Is Blocked by a Clinically Proven Protease Inhibitor. Cell. 2020;181:271–280. doi: 10.1016/j.cell.2020.02.052. [DOI] [PMC free article] [PubMed] [Google Scholar]
- Hoffmann M., Kleine-Weber H., Pöhlmann S. A Multibasic Cleavage Site in the Spike Protein of SARS-CoV-2 Is Essential for Infection of Human Lung Cells. Mol. Cell. 2020;78:779–784. doi: 10.1016/j.molcel.2020.04.022. [DOI] [PMC free article] [PubMed] [Google Scholar]
- Jain I.H., Zazzeron L., Goli R., Alexa K., Schatzman-Bone S., Dhillon H., Goldberger O., Peng J., Shalem O., Sanjana N.E., et al. Hypoxia as a therapy for mitochondrial disease. Science. 2016;352:54–61. doi: 10.1126/science.aad9642. [DOI] [PMC free article] [PubMed] [Google Scholar]
- Kim D., Lee J.-Y., Yang J.-S., Kim J.W., Kim V.N., Chang H. The Architecture of SARS-CoV-2 Transcriptome. Cell. 2020;181:914–921. doi: 10.1016/j.cell.2020.04.011. [DOI] [PMC free article] [PubMed] [Google Scholar]
- Kolde R., Laur S., Adler P., Vilo J. Robust rank aggregation for gene list integration and meta-analysis. Bioinformatics. 2012;28:573–580. doi: 10.1093/bioinformatics/btr709. [DOI] [PMC free article] [PubMed] [Google Scholar]
- Korotkevich G., Sukhov V., Sergushichev A. Fast gene set enrichment analysis. bioRxiv. 2019 doi: 10.1101/060012. [DOI] [Google Scholar]
- Kuleshov M.V., Jones M.R., Rouillard A.D., Fernandez N.F., Duan Q., Wang Z., Koplev S., Jenkins S.L., Jagodnik K.M., Lachmann A., et al. Enrichr: a comprehensive gene set enrichment analysis web server 2016 update. Nucleic Acids Res. 2016;44(W1) doi: 10.1093/nar/gkw377. W90-7. [DOI] [PMC free article] [PubMed] [Google Scholar]
- Langmead B., Trapnell C., Pop M., Salzberg S.L. Ultrafast and memory-efficient alignment of short DNA sequences to the human genome. Genome Biol. 2009;10:R25. doi: 10.1186/gb-2009-10-3-r25. [DOI] [PMC free article] [PubMed] [Google Scholar]
- Legut M., Daniloski Z., Xue X., McKenzie D., Guo X., Wessels H.-H., Sanjana N.E. High-throughput screens of PAM-flexible Cas9 variants for gene knock-out and transcriptional modulation. Cell Rep. 2020;30:2859–2868. doi: 10.1016/j.celrep.2020.02.010. [DOI] [PMC free article] [PubMed] [Google Scholar]
- Lek A., Zhang Y., Woodman K.G., Huang S., DeSimone A.M., Cohen J., Ho V., Conner J., Mead L., Kodani A., et al. Applying genome-wide CRISPR-Cas9 screens for therapeutic discovery in facioscapulohumeral muscular dystrophy. Sci. Transl. Med. 2020;12:eaay0271. doi: 10.1126/scitranslmed.aay0271. [DOI] [PMC free article] [PubMed] [Google Scholar]
- Li Y., Muffat J., Omer Javed A., Keys H.R., Lungjangwa T., Bosch I., Khan M., Virgilio M.C., Gehrke L., Sabatini D.M., Jaenisch R. Genome-wide CRISPR screen for Zika virus resistance in human neural cells. Proc. Natl. Acad. Sci. USA. 2019;116:9527–9532. doi: 10.1073/pnas.1900867116. [DOI] [PMC free article] [PubMed] [Google Scholar]
- Li B., Clohisey S.M., Chia B.S., Wang B., Cui A., Eisenhaure T., Schweitzer L.D., Hoover P., Parkinson N.J., Nachshon A., et al. Genome-wide CRISPR screen identifies host dependency factors for influenza A virus infection. Nat. Commun. 2020;11:164. doi: 10.1038/s41467-019-13965-x. [DOI] [PMC free article] [PubMed] [Google Scholar]
- Liu Y., Gayle A.A., Wilder-Smith A., Rocklöv J. The reproductive number of COVID-19 is higher compared to SARS coronavirus. J. Travel Med. 2020;27:taaa021. doi: 10.1093/jtm/taaa021. [DOI] [PMC free article] [PubMed] [Google Scholar]
- Love M.I., Huber W., Anders S. Moderated estimation of fold change and dispersion for RNA-seq data with DESeq2. Genome Biol. 2014;15:550. doi: 10.1186/s13059-014-0550-8. [DOI] [PMC free article] [PubMed] [Google Scholar]
- Luo B., Cheung H.W., Subramanian A., Sharifnia T., Okamoto M., Yang X., Hinkle G., Boehm J.S., Beroukhim R., Weir B.A., et al. Highly parallel identification of essential genes in cancer cells. Proc. Natl. Acad. Sci. USA. 2008;105:20380–20385. doi: 10.1073/pnas.0810485105. [DOI] [PMC free article] [PubMed] [Google Scholar]
- Mallam A.L., Marcotte E.M. Systems-wide Studies Uncover Commander, a Multiprotein Complex Essential to Human Development. Cell Syst. 2017;4:483–494. doi: 10.1016/j.cels.2017.04.006. [DOI] [PMC free article] [PubMed] [Google Scholar]
- Marchant J. Letter: Prophylactic chemotherapy for breast cancer. BMJ. 1976;1:1589. doi: 10.1136/bmj.1.6025.1589. [DOI] [PMC free article] [PubMed] [Google Scholar]
- McGinnis C.S., Patterson D.M., Winkler J., Conrad D.N., Hein M.Y., Srivastava V., Hu J.L., Murrow L.M., Weissman J.S., Werb Z., et al. MULTI-seq: sample multiplexing for single-cell RNA sequencing using lipid-tagged indices. Nat. Methods. 2019;16:619–626. doi: 10.1038/s41592-019-0433-8. [DOI] [PMC free article] [PubMed] [Google Scholar]
- McNally K.E., Cullen P.J. Endosomal Retrieval of Cargo: Retromer Is Not Alone. Trends Cell Biol. 2018;28:807–822. doi: 10.1016/j.tcb.2018.06.005. [DOI] [PubMed] [Google Scholar]
- Meier J.A., Zhang F., Sanjana N.E. GUIDES: sgRNA design for loss-of-function screens. Nat. Methods. 2017;14:831–832. doi: 10.1038/nmeth.4423. [DOI] [PMC free article] [PubMed] [Google Scholar]
- Millard E.E., Srivastava K., Traub L.M., Schaffer J.E., Ory D.S. Niemann-pick type C1 (NPC1) overexpression alters cellular cholesterol homeostasis. J. Biol. Chem. 2000;275:38445–38451. doi: 10.1074/jbc.M003180200. [DOI] [PubMed] [Google Scholar]
- Mimitou E.P., Cheng A., Montalbano A., Hao S., Stoeckius M., Legut M., Roush T., Herrera A., Papalexi E., Ouyang Z., et al. Multiplexed detection of proteins, transcriptomes, clonotypes and CRISPR perturbations in single cells. Nat. Methods. 2019;16:409–412. doi: 10.1038/s41592-019-0392-0. [DOI] [PMC free article] [PubMed] [Google Scholar]
- Mori S., Ito H., Yamamoto K. Effects of calcium antagonists on low density lipoprotein metabolism in human arterial smooth muscle cells. Tohoku J. Exp. Med. 1988;154:329–333. doi: 10.1620/tjem.154.329. [DOI] [PubMed] [Google Scholar]
- Neufeld E.B., Cooney A.M., Pitha J., Dawidowicz E.A., Dwyer N.K., Pentchev P.G., Blanchette-Mackie E.J. Intracellular trafficking of cholesterol monitored with a cyclodextrin. J. Biol. Chem. 1996;271:21604–21613. doi: 10.1074/jbc.271.35.21604. [DOI] [PubMed] [Google Scholar]
- O’Brian C.A., Liskamp R.M., Solomon D.H., Weinstein I.B. Inhibition of protein kinase C by tamoxifen. Cancer Res. 1985;45:2462–2465. [PubMed] [Google Scholar]
- Patel S.J., Sanjana N.E., Kishton R.J., Eidizadeh A., Vodnala S.K., Cam M., Gartner J.J., Jia L., Steinberg S.M., Yamamoto T.N., et al. Identification of essential genes for cancer immunotherapy. Nature. 2017;548:537–542. doi: 10.1038/nature23477. [DOI] [PMC free article] [PubMed] [Google Scholar]
- Ranganathan S., Harmony J.A., Jackson R.J. Effect of Ca2+ blocking agents on the metabolism of low density lipoproteins in human skin fibroblasts. Biochem. Biophys. Res. Commun. 1982;107:217–224. doi: 10.1016/0006-291x(82)91691-6. [DOI] [PubMed] [Google Scholar]
- Riva L., Yuan S., Yin X., Martin-Sancho L., Matsunaga N., Pache L., Burgstaller-Muehlbacher S., De Jesus P.D., Teriete P., Hull M.V., et al. Discovery of SARS-CoV-2 antiviral drugs through large-scale compound repurposing. Nature. 2020;586:113–119. doi: 10.1038/s41586-020-2577-1. [DOI] [PMC free article] [PubMed] [Google Scholar]
- Rush J.S., Ceresa B.P. RAB7 and TSG101 are required for the constitutive recycling of unliganded EGFRs via distinct mechanisms. Mol. Cell. Endocrinol. 2013;381:188–197. doi: 10.1016/j.mce.2013.07.029. [DOI] [PMC free article] [PubMed] [Google Scholar]
- Samavarchi-Tehrani P., Abdouni H., Knight J.D.R., Astori A., Samson R., Lin Z.-Y., Kim D.-K., Knapp J.J., St-Germain J., Go C.D., et al. A SARS-CoV-2 – host proximity interactome. bioRxiv. 2020 doi: 10.1101/2020.09.03.282103. [DOI] [Google Scholar]
- Sanjana N.E., Shalem O., Zhang F. Improved vectors and genome-wide libraries for CRISPR screening. Nat. Methods. 2014;11:783–784. doi: 10.1038/nmeth.3047. [DOI] [PMC free article] [PubMed] [Google Scholar]
- Schindelin J., Arganda-Carreras I., Frise E., Kaynig V., Longair M., Pietzsch T., Preibisch S., Rueden C., Saalfeld S., Schmid B., et al. Fiji: an open-source platform for biological-image analysis. Nat. Methods. 2012;9:676–682. doi: 10.1038/nmeth.2019. [DOI] [PMC free article] [PubMed] [Google Scholar]
- Shalem O., Sanjana N.E., Hartenian E., Shi X., Scott D.A., Mikkelson T., Heckl D., Ebert B.L., Root D.E., Doench J.G., Zhang F. Genome-scale CRISPR-Cas9 knockout screening in human cells. Science. 2014;343:84–87. doi: 10.1126/science.1247005. [DOI] [PMC free article] [PubMed] [Google Scholar]
- Slenter D.N., Kutmon M., Hanspers K., Riutta A., Windsor J., Nunes N., Mélius J., Cirillo E., Coort S.L., Digles D., et al. WikiPathways: a multifaceted pathway database bridging metabolomics to other omics research. Nucleic Acids Res. 2018;46(D1):D661–D667. doi: 10.1093/nar/gkx1064. [DOI] [PMC free article] [PubMed] [Google Scholar]
- Smibert P., Mimitou E., Stoeckius M. 2019. ECCITE-seq.https://cite-seq.com/eccite-seq/ [Google Scholar]
- Solaimanzadeh I. Nifedipine and Amlodipine Are Associated With Improved Mortality and Decreased Risk for Intubation and Mechanical Ventilation in Elderly Patients Hospitalized for COVID-19. Cureus. 2020;12:e8069. doi: 10.7759/cureus.8069. [DOI] [PMC free article] [PubMed] [Google Scholar]
- Stoeckius M., Zheng S., Houck-Loomis B., Hao S., Yeung B.Z., Mauck W.M., 3rd, Smibert P., Satija R. Cell Hashing with barcoded antibodies enables multiplexing and doublet detection for single cell genomics. Genome Biol. 2018;19:224. doi: 10.1186/s13059-018-1603-1. [DOI] [PMC free article] [PubMed] [Google Scholar]
- Stuart T., Butler A., Hoffman P., Hafemeister C., Papalexi E., Mauck W.M., 3rd, Hao Y., Stoeckius M., Smibert P., Satija R. Comprehensive Integration of Single-Cell Data. Cell. 2019;177:1888–1902. doi: 10.1016/j.cell.2019.05.031. [DOI] [PMC free article] [PubMed] [Google Scholar]
- Subramanian A., Tamayo P., Mootha V.K., Mukherjee S., Ebert B.L., Gillette M.A., Paulovich A., Pomeroy S.L., Golub T.R., Lander E.S., Mesirov J.P. Gene set enrichment analysis: a knowledge-based approach for interpreting genome-wide expression profiles. Proc. Natl. Acad. Sci. USA. 2005;102:15545–15550. doi: 10.1073/pnas.0506580102. [DOI] [PMC free article] [PubMed] [Google Scholar]
- Szklarczyk D., Gable A.L., Lyon D., Junge A., Wyder S., Huerta-Cepas J., Simonovic M., Doncheva N.T., Morris J.H., Bork P., et al. STRING v11: protein-protein association networks with increased coverage, supporting functional discovery in genome-wide experimental datasets. Nucleic Acids Res. 2019;47(D1):D607–D613. doi: 10.1093/nar/gky1131. [DOI] [PMC free article] [PubMed] [Google Scholar]
- Uhlen M., Oksvold P., Fagerberg L., Lundberg E., Jonasson K., Forsberg M., Zwahlen M., Kampf C., Wester K., Hober S., et al. Towards a knowledge-based Human Protein Atlas. Nat. Biotechnol. 2010;28:1248–1250. doi: 10.1038/nbt1210-1248. [DOI] [PubMed] [Google Scholar]
- Verschueren E., Von Dollen J., Cimermancic P., Gulbahce N., Sali A., Krogan N.J. Scoring Large-Scale Affinity Purification Mass Spectrometry Datasets with MiST. Curr. Protoc. Bioinformatics. 2015;49:8.19.1–8.19.16. doi: 10.1002/0471250953.bi0819s49. [DOI] [PMC free article] [PubMed] [Google Scholar]
- Wei J., Alfajaro M.M., Hanna R.E., DeWeirdt P.C., Strine M.S., Lu-Culligan W.J., Zhang S.-M., Graziano V.R., Schmitz C.O., Chen J.S., et al. Genome-wide CRISPR screen reveals host genes that regulate SARS-CoV-2 infection. Cell. 2020;184 doi: 10.1016/j.cell.2020.10.028. Published online October 20, 2021. [DOI] [PMC free article] [PubMed] [Google Scholar]
- Zhang L., Sun Y., Zeng H.-L., Peng Y., Jiang X., Shang W.-J., Wu Y., Li S., Zhang Y.-L., Yang L., et al. Calcium channel blocker amlodipine besylate is associated with reduced case fatality rate of COVID-19 patients with hypertension. medRxiv. 2020 doi: 10.1101/2020.04.08.20047134. [DOI] [PMC free article] [PubMed] [Google Scholar]
- Zhou P., Yang X.-L., Wang X.-G., Hu B., Zhang L., Zhang W., Si H.-R., Zhu Y., Li B., Huang C.-L., et al. A pneumonia outbreak associated with a new coronavirus of probable bat origin. Nature. 2020;579:270–273. doi: 10.1038/s41586-020-2012-7. [DOI] [PMC free article] [PubMed] [Google Scholar]
- Zhu Y., Feng F., Hu G., Wang Y., Yu Y., Zhu Y., Xu W., Cai X., Sun Z., Han W., et al. The S1/S2 boundary of SARS-CoV-2 spike protein modulates cell entry pathways and transmission. bioRxiv. 2020 doi: 10.1101/2020.08.25.266775. [DOI] [Google Scholar]
Associated Data
This section collects any data citations, data availability statements, or supplementary materials included in this article.
Supplementary Materials
Data Availability Statement
CRISPR screen, single cell RNA-sequencing/ECCITE-seq and bulk RNA-sequencing datasets are available on the GEO repository with accession numbers GSE158298, GSE159519 and GSE159522, respectively.