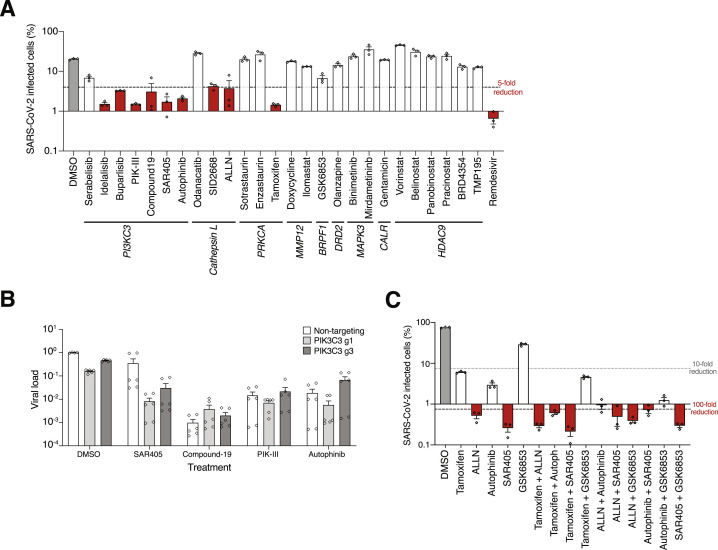
Figure S4.
Perturbations of Enriched CRISPR Screen Genes with Small-Molecule Inhibitors, Related to Figure 4
(A) Immunofluorescence quantification of SARS-CoV-2 N protein at 36 hpi (MOI 0.1) in A549ACE2 cells pretreated for 2 hours with 10 μM of the indicated inhibitors (n = 3 biological replicates, error bars represent s.e.m.) (B) Quantitative PCR (qPCR) of SARS-CoV-2 viral load present in A549ACE2 cells (CRISPR-perturbed with either non-targeting or PIK3C3-targeting guide RNAs) pretreated for 2 hours with the indicated PIK3C3 molecule inhibitors at 10 μM and then infected with SARS-CoV-2 at MOI of 0.1. The qPCR was performed at 36 hours post-infection (hpi). Inhibitors were maintained at the same concentration throughout the experiment (n = 6 biological replicates, error bars indicate s.e.m.). (C) Immunofluorescence quantification of SARS-CoV-2 N protein at 36 hpi (MOI 0.1) in A549ACE2 cells pretreated with a combination of indicated inhibitors at 10 μM each for 2 hours (n = 3 biological replicates, error bars represent s.e.m.).

