Significance
Gpr116 is an adhesion G protein-coupled receptor (aGPCR) that is highly expressed in the kidney. Here, we report that Gpr116 localizes to A-intercalated cells in the murine collecting duct, where it functions as a significant and critical regulator of renal acid secretion by regulating the surface expression of V-ATPase proton pumps. Kidney-specific Gpr116 knockout mice develop a unique acid-base disorder, “renal tubular alkalosis,” characterized by acidic urine and alkaline blood. These findings have significant implications for other tissues with Gpr116 expression, as well as other acid-secreting epithelia. Furthermore, we propose that Gpr116 may more generally regulate endocytosis, a function that would have wide-ranging implications for both Gpr116 function and for our understanding of aGPCRs.
Keywords: Gpr116, ADGRF5, A-intercalated cell, V-ATPase, kidney
Abstract
The diversity and near universal expression of G protein-coupled receptors (GPCR) reflects their involvement in most physiological processes. The GPCR superfamily is the largest in the human genome, and GPCRs are common pharmaceutical targets. Therefore, uncovering the function of understudied GPCRs provides a wealth of untapped therapeutic potential. We previously identified an adhesion-class GPCR, Gpr116, as one of the most abundant GPCRs in the kidney. Here, we show that Gpr116 is highly expressed in specialized acid-secreting A-intercalated cells (A-ICs) in the kidney using both imaging and functional studies, and we demonstrate in situ receptor activation using a synthetic agonist peptide unique to Gpr116. Kidney-specific knockout (KO) of Gpr116 caused a significant reduction in urine pH (i.e., acidification) accompanied by an increase in blood pH and a decrease in pCO2 compared to WT littermates. Additionally, immunogold electron microscopy shows a greater accumulation of V-ATPase proton pumps at the apical surface of A-ICs in KO mice compared to controls. Furthermore, pretreatment of split-open collecting ducts with the synthetic agonist peptide significantly inhibits proton flux in ICs. These data suggest a tonic inhibitory role for Gpr116 in the regulation of V-ATPase trafficking and urinary acidification. Thus, the absence of Gpr116 results in a primary excretion of acid in KO mouse urine, leading to mild metabolic alkalosis (“renal tubular alkalosis”). In conclusion, we have uncovered a significant role for Gpr116 in kidney physiology, which may further inform studies in other organ systems that express this GPCR, such as the lung, testes, and small intestine.
G protein-coupled receptors (GPCRs) are a large and diverse family of integral membrane proteins that recognize a tremendous assortment of extracellular molecules, including neurotransmitters, hormones, light, and odors (1). Their diversity and nearly universal expression underlie their significance in many physiological processes, as well as their enormous potential as therapeutic targets (2). To this end, considerable effort has been made in recent years to understand the function of understudied GPCRs.
GPCRs can be further characterized, based on sequence homology, as belonging to one of five major phylogenetic subfamilies (3). The adhesion class of GPCRs (aGPCR) form the second largest subfamily, consisting of 33 identified members in the mammalian genome, including Gpr116 (ADGRF5) (4). The defining feature of the aGPCRs is an extended N-terminal ectodomain that culminates at a GPCR proteolytic site motif (5, 6). Autocatalytic processing causes the large extracellular domain to be cleaved, yet remain noncovalently associated with the membrane-bound fragment. Recent studies have demonstrated that Gpr116 and similar aGPCRs are activated by a tethered ligand proximal to the first transmembrane α-helix (7, 8). Structural changes in the aGPCR allow for the tethered ligand to be exposed, leading to receptor activation. Cells expressing heterologous Gpr116 can be stimulated and activated in vitro by addition of a 16-amino acid peptide corresponding to the tethered ligand of Gpr116. Addition of this peptide results in accumulation of IP1 and an increase in intracellular calcium (7, 8).
Although initially described and cloned from rat lung (9), Gpr116 is expressed in a number of tissues outside of the lung, including brain, heart, skeletal muscle, and kidney. In fact, we previously reported that Gpr116 is among the most highly expressed GPCRs in the kidney (10). Several knockout (KO) mice models have been developed to study the biologic significance of this receptor. Experiments performed on these animal models demonstrate that Gpr116 is critically important to the regulation of pulmonary surfactant pool size, as well as limiting alveolar macrophage infiltration (11–15). Additionally a vascular endothelium specific Gpr116 KO model displays a leaky blood–brain barrier, suggesting Gpr116 also plays a crucial role in maintaining endothelial junctional integrity (14) as well as initiation of subretinal vascularization (16). Despite our growing understanding of the biological significance of Gpr116 in the lung and other tissues, its role in kidney physiology has not yet been investigated. In the present study, we present evidence of a significant role for Gpr116 in renal physiology, where it plays a key role in regulating urinary pH.
Results
Gpr116 Is Localized to A-Intercalated Cells.
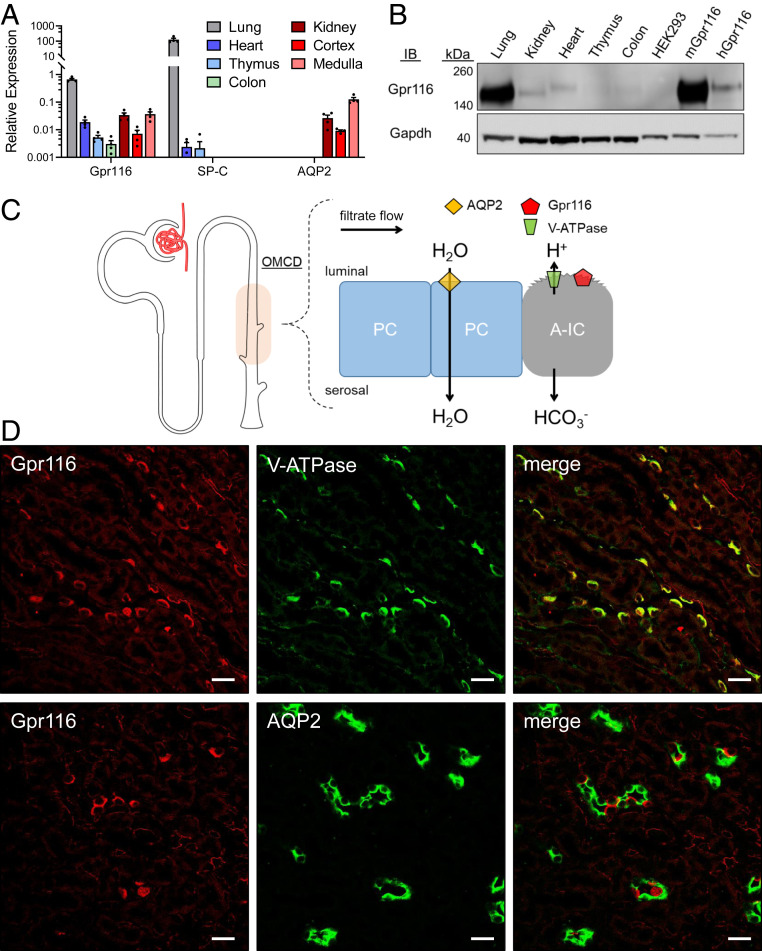
We (10) and others (9, 13, 17–19) have previously reported expression of Gpr116 in mouse kidney. To further identify the localization of Gpr116 in the kidney, we performed qRT-PCR on murine lung, heart, thymus, colon, and kidney, as well as isolated renal cortical and medullary tissue (Fig. 1A). Gpr116 expression (normalized to Gapdh) was highest in the lung (CT = 26.1 ± 0.5; ΔCT = 0.6 ± 0.3), followed by the kidney (CT = 28.1 ± 0.3; ΔCT = 5.0 ± 0.6) and the heart (CT = 28.0 ± 0.5; ΔCT = 5.8 ± 0.5). Gpr116 mRNA was more abundant in the renal medulla (CT = 27.4 ± 0.4; ΔCT = 4.9 ± 0.6) than the cortex (CT = 30.1 ± 1.3; ΔCT = 7.4 ± 1.1). Surfactant protein C (SP-C) and aquaporin 2 (AQP2) were used as positive controls for lung and kidney mRNA, respectively (Fig. 1A). Next, we performed a Western blot on whole-organ lysates from lung, kidney, heart, thymus, and colon, as well as HEK293 cells expressing murine (mGpr116) and human (hGpr116) Gpr116 (Fig. 1B). We observed a band at the expected molecular mass for Gpr116 (150 kDa) in lung, kidney, and heart, as well as in mGpr116- and hGpr116-expressing HEK cells.
Fig. 1.
Gpr116 is highly expressed in kidney and is localized to V-ATPase expressing ICs of the collecting duct. (A) Gpr116 mRNA expression as measured by qRT-PCR in various tissues including lung and kidney. SP-C and AQP2 served as positive controls of lung and kidney mRNA. Gene expression is normalized to Gapdh. Cycle threshold of 35 approximately corresponds with 0.001 on the y axis. (B) Western blot analysis of Gpr116 expression in various tissues as well as stably transfected HEK293 cells with mouse (mGpr116) or human (hGpr116) Gpr116. Expected molecular mass for Gpr116 is ∼150 kDa. (C) Diagram of the murine outer medullary collecting duct (OMCD) showing water-transporting principal cells (PC) and acid-secreting A-IC. Proton secretion is coupled to bicarbonate reabsorption throughout the nephron. (D) Representative immunofluorescence images demonstrating colocalization of Gpr116 with V-ATPase in mouse collecting ducts. Similarly, Gpr116 is interspersed among AQP2 expressing cells in mouse collecting ducts. (Scale bars, 20 μm.)
Previous studies (9, 13) have suggested localization of Gpr116 to A-intercalated cells (A-ICs) of the cortical and medullary collecting duct in mouse kidney. We performed immunofluorescence imaging on fixed-frozen kidney sections using a previously published primary antibody that we also validated using Western blot (9). Representative images in Fig. 1D demonstrate colocalization of Gpr116 with the B subunit of the vacuolar-type H+-ATPase in the medulla (V-ATPase), where A-ICs predominate (V-ATPase antibody recognizes B1/2). In collecting ducts from the inner stripe of the outer medulla, we observed Gpr116 staining on every AQP2− cell with apical V-ATPase staining, which is consistent with localization of Gpr116 to A-ICs. Similarly, Gpr116-expressing cells are interspersed among AQP2-expressing principal cells in outer medullary collecting ducts (Fig. 1D). However, in the renal cortex, where pendrin-positive type B-ICs are also present, we observed that Gpr116 localizes to only a subset of the AQP2− cells (SI Appendix, Fig. S1). Furthermore, we found that Gpr116 and pendrin expression in the cortex are distinct (SI Appendix, Figs. S2 and S3), demonstrating that Gpr116 protein expression is restricted to A-type cells. Together, these data demonstrate the localization of Gpr116 to A-ICs in the murine kidney.
Peptide Agonist Activates Ca2+ Signaling in Gpr116-Expressing Cells.
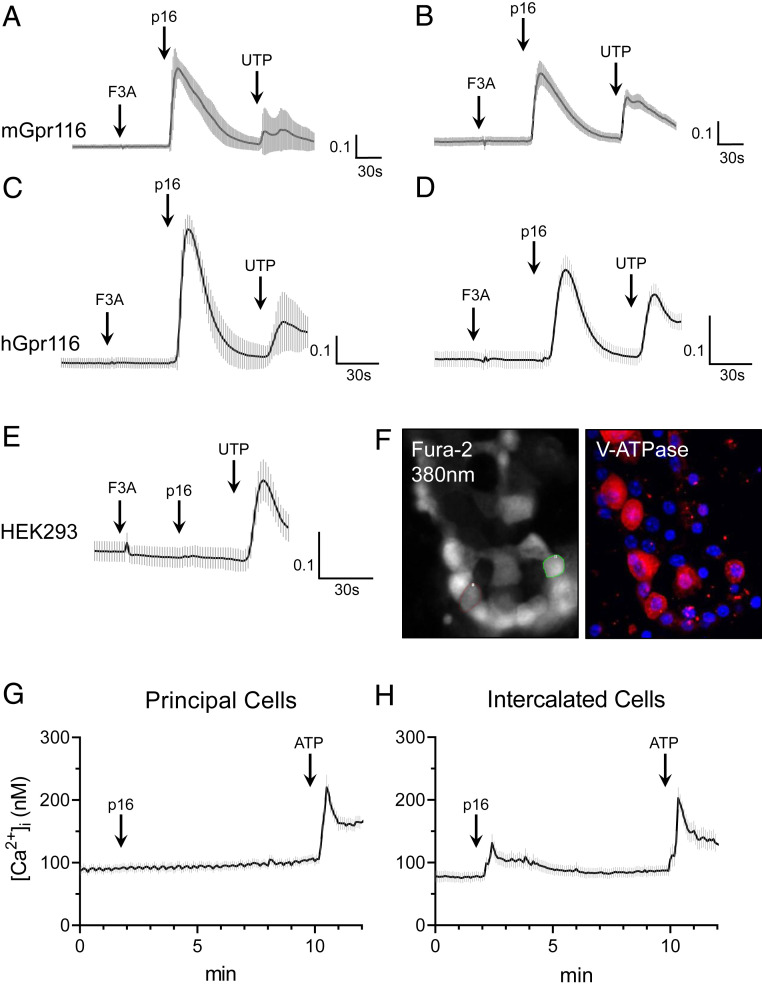
Gpr116 is an adhesion-class GPCR that possesses a tethered ligand (20). Synthesized exogenous agonist peptides, which have identical amino acid sequences to the native tethered ligand, have previously been shown to stimulate aGPCRs in vitro, including Gpr116 (7, 8). Using the synthetic agonist p16 peptide described by Brown et al. (7), we observed an increase in [Ca2+]i in mGpr116 and hGpr116-expressing HEK293 cells, as measured by ΔF340/F380 with Fura-2 calcium-imaging (Fig. 2 A–E). Next, we performed calcium-imaging experiments on split-open murine cortical collecting ducts (Fig. 2F). For this experiment, A-ICs were identified by immunofluorescence staining for V-ATPase after the calcium imaging was complete. Cells without V-ATPase were identified as principal cells. Addition of the synthetic peptide agonist did not lead to an increase in [Ca2+]i in principal cells (Fig. 2G). However, addition of the synthetic peptide agonist did stimulate an increase in [Ca2+]i in V-ATPase expressing A-ICs (Fig. 2H). These data further establish the localization of functional Gpr116 to V-ATPase expressing A-ICs in the collecting ducts.
Fig. 2.
Gpr116 activation by exogenous synthetic agonist peptide mobilizes calcium in vitro and in split-open cortical collecting ducts. (A–E) Stimulation of heterologous murine and human Gpr116 in HEK293 cells with p16 synthetic agonist peptide (200 μM), but not with the control peptide (F3A), causes an increase in [Ca2+]i as measured by ΔF340/F380. Nontransfected control is shown in E. In A and C, traces are the mean ± SEM of 20 individual p16-responsive cells; in B, D, and E traces are the mean ± SEM of 16 regions of an entire field of view. (F) Representative images of Fura-2 loaded murine split-open collecting ducts demonstrating identification of V-ATPase expressing ICs. As these are split-open tubules viewed from above, V-ATPase stain can be used to identify cell types (but not for subcellular localization). Magnification: 40×. (G) Calcium mobilization in principal cells following stimulation with p16 (200 μM) and then ATP (50 μM) in split-open collecting ducts. Trace is mean ± SEM of 24 cells from three collecting ducts. (H) Calcium mobilization in V-ATPase expressing ICs following stimulation with p16 and then ATP. Trace is mean ± SEM of 21 cells from 3 collecting ducts.
Development of a Kidney-Specific Gpr116 KO Mouse.
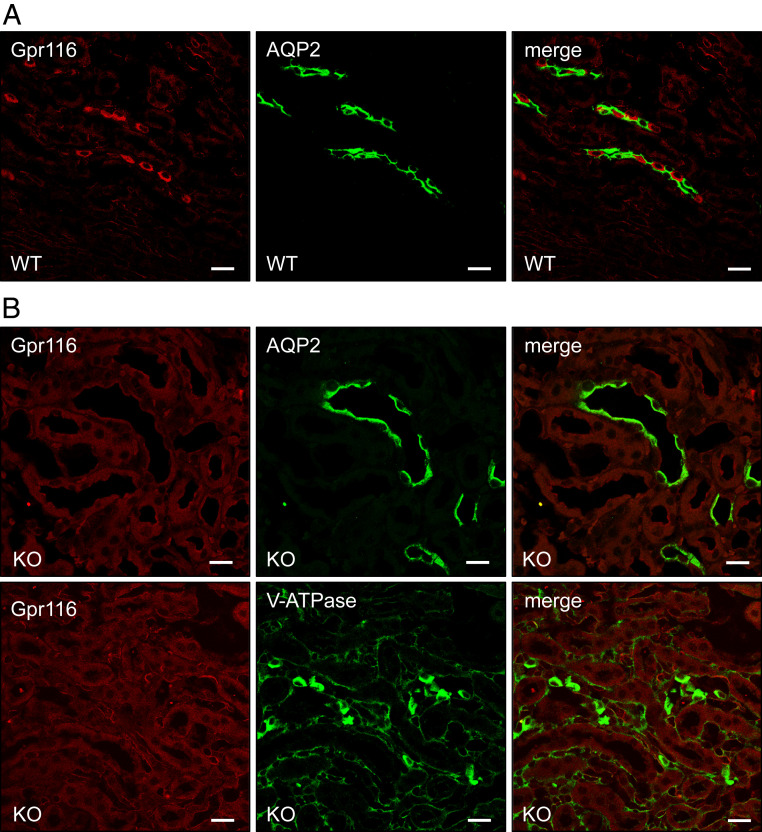
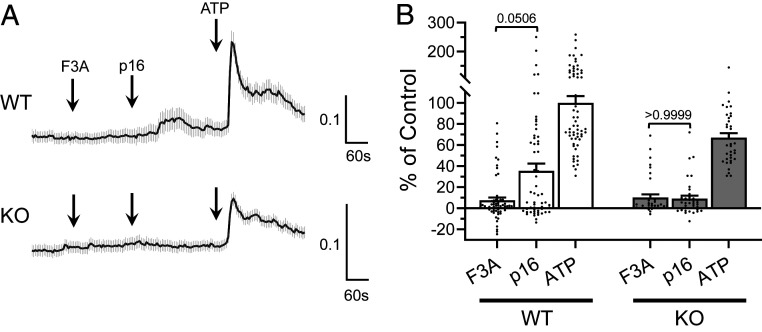
Whole-animal Gpr116 KO mice develop a well-documented pulmonary phenotype characterized by the accumulation of alveolar surfactant (12, 13, 15). In contrast, Gpr116 expression has been reported in the kidney, but the physiological role of Gpr116 in the kidney has not been examined. To study the function of Gpr116 in the kidney without interference from the pulmonary phenotype, we developed a kidney-specific Gpr116 KO mouse using KSP-Cre and Gpr116-loxP animals. While WT mice have expression of Gpr116 in A-ICs in the collecting ducts among AQP2-expressing principal cells (Fig. 3A), kidney-specific KO animals (KO) have a complete absence of Gpr116 in A-ICs (Fig. 3B and SI Appendix, Figs. S4 and S5). Of note, Gpr116 is also expressed in the vascular endothelium, and vascular signal for Gpr116 is still detected in the kidney-specific KO, confirming the epithelial specificity of the KSP-Cre driven KO. KO mice still possess V-ATPase–expressing cells, demonstrating the presence of A-ICs in KO nephrons. In calcium-imaging experiments, split-open cortical collecting ducts from WT mice exhibited increased [Ca2+]i after exposure to the synthetic peptide agonist as compared to the control peptide (P = 0.0506), whereas this difference was not seen in tubules from KO mice (P > 0.9999) (Fig. 4). Together, these data demonstrate the effective deletion of Gpr116 from mouse distal nephron/collecting duct.
Fig. 3.
Targeted deletion of Gpr116 in kidney tubules results in loss of Gpr116 in collecting ducts. (A) Representative immunofluorescence images demonstrating localization of Gpr116-expressing cells among AQP2 expressing cells in WT mouse collecting ducts. (B) Representative immunofluorescence images demonstrating loss of Gpr116-expressing cells in mouse collecting ducts after targeted deletion with KSP-Cre/Lox system. (Scale bars, 20 μm.)
Fig. 4.
Split-open cortical collecting ducts from kidney-specific Gpr116 KO do not contain cells that are stimulated by exogenous p16 synthetic agonist peptide. (A) Representative Fura-2 (ΔF340/F380) traces of split-open collecting ducts from WT and KO mice. Traces are mean ± SEM of all ATP-responsive cells in three split-open collecting ducts. (B) Summary data of ΔF340/F380 for all ATP-responsive cells observed in split-open collecting ducts from WT and KO mice. Data are normalized to ΔF340/F380 of WT tubules to ATP. Bars are mean ± SEM. n = 63 WT cells, 37 KO cells. Statistical analysis performed using Kruskal–Wallis test followed by Dunn’s multiple comparisons.
Gpr116 Regulates Acid Excretion.
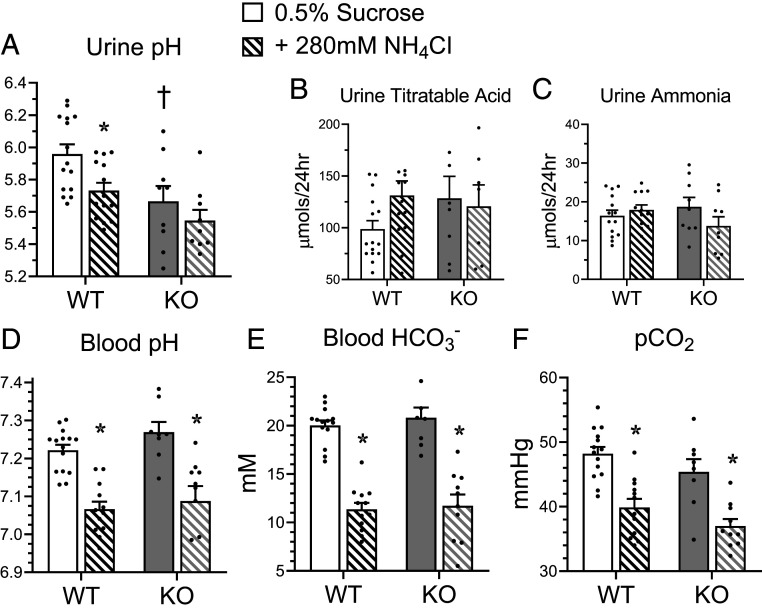
A major function of A-ICs is the secretion of protons into the primary urine via apical V-ATPase (21, 22). Therefore, we hypothesized that Gpr116 may regulate urinary pH due to its localization to A-ICs. We collected 24-h urine samples from male mice housed in metabolic cages and found that kidney-specific Gpr116 KO mice have reduced urine pH compared to WT mice (Fig. 5A). KO mice do not have significantly increased excretion of titratable acids or ammonia (Fig. 5 B and C), and do not have an acidemia (Fig. 5D). To challenge the A-ICs of KO mice to further acidify urine and compensate for an increased acid load, we added 280 mM NH4Cl to the drinking water (23). WT mice drinking NH4Cl water exhibited a significant drop in urine pH compared to controls (Fig. 5A). However, KO mice did not significantly acidify their urine while drinking NH4Cl water compared to KO mice drinking control water (Fig. 5A), suggesting that deletion of Gpr116 from A-ICs already maximally acidifies urine. Addition of NH4Cl to the drinking water caused significantly reduced blood pH (Fig. 5D), significantly reduced blood bicarbonate (Fig. 5E), and significantly reduced pCO2 (Fig. 5F) in both WT and KO mice, demonstrating an induced metabolic acidosis consistent with an increased acid load, although we cannot rule out some contribution due to hypertonicity.
Fig. 5.
Deletion of Gpr116 in mouse collecting ducts decreases urine pH. (A–C) Twenty-four–hour urine pH, urine titrable acid, and urine ammonia of WT and KO mice with access to control water (0.5% sucrose, solid bars) or metabolic-acidosis inducing water (0.5% sucrose + 280 mM NH4Cl, hatched bars; paired samples). (D–F) Paired whole-blood samples harvested from facial vein puncture were analyzed for pH, HCO3− concentration, pCO2. For paired samples in A–F, bars are mean ± SEM. n = 15 WT mice, 9 KO mice. Statistical analysis performed using Kruskal–Wallis test followed by Dunn’s multiple comparisons. *P < 0.05 vs. treatment; †P < 0.05 vs. genotype. Urine pH: WT 0.5% sucrose vs. +280 mM NH4Cl *P = 0.04; WT 0.5% sucrose vs. KO 0.5% sucrose †P = 0.04. Blood pH: WT 0.5% sucrose vs. +280 mM NH4Cl *P = 0.001; KO 0.5% sucrose vs. +280 mM NH4Cl *P = 0.004. Blood HCO3−: WT 0.5% sucrose vs. +280 mM NH4Cl *P = 0.0001; KO 0.5% sucrose vs. +280 mM NH4Cl *P = 0.001. pCO2: WT 0.5% sucrose vs. +280 mM NH4Cl *P = 0.001; KO 0.5% sucrose vs. +280 mM NH4Cl *P = 0.04.
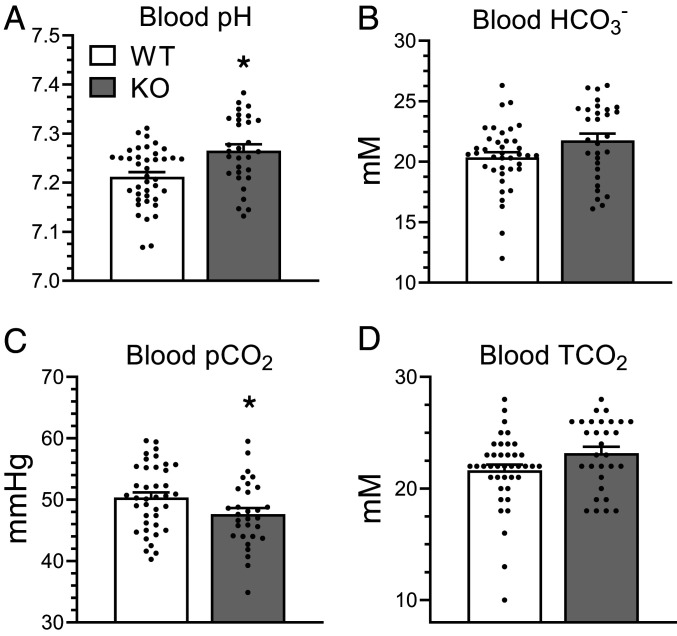
We noted that in initial experiments in metabolic cages, the blood pH and blood HCO3− of KO animals both trended higher as compared to WT controls (Fig. 5 D and E) and blood pCO2 trended lower (Fig. 5F), a pattern that we had also observed in a cohort of female animals (SI Appendix, Fig. S6). (Blood pH values in Fig. 5 reflect mixed venous blood; arterial samples from ventilated mice are shown in SI Appendix, Fig. S6.) In an expanded cohort of male WT and KO mice (not housed in metabolic cages), we found that KO mice had significantly more alkaline blood pH compared to WT (7.265 ± 0.07 vs. 7.212 ± 0.06; P = 0.002) and lower pCO2 (47.6 ± 5.4 vs. 50.3 ± 5.4; P = 0.04) (Fig. 6 A and C). We also observed a trend toward greater blood HCO3− (21.8 ± 3.1 vs. 20.4 ± 2.7; P = 0.06) in KO mice compared to WT (Fig. 6B). Interestingly, we did not observe a statistically significant change in total CO2, which suggests KO mice have more CO2 in the form of HCO3− but do not accumulate more CO2 than WT mice (Fig. 6D).
Fig. 6.
Kidney-specific Gpr116 KO mice have alkaline blood and reduced pCO2 compared to WT littermates. (A–D) Whole-blood samples harvested from facial vein puncture demonstrate increased blood pH from KO mice, a trend toward increased blood HCO3−, and significantly reduced pCO2. TCO2 is not statistically different, but shows a trend toward increased values in KO samples (due to increased HCO3− in those samples). TCO2 was calculated as the sum of pCO2 (in mM) and HCO3−. Bars are mean ± SEM. n = 39 WT mice, 30 KO mice. Statistical analysis performed using Mann–Whitney test. *P < 0.05. Blood pH: WT vs. KO *P = 0.002; blood HCO3−: WT vs. KO P = 0.06; pCO2: WT vs. KO *P = 0.04. TCO2: WT vs. KO P = 0.06.
These data support the hypothesis that Gpr116 deletion from A-ICs induces a primary excretion of H+ in the urine, leading to a decrease in urinary pH and a concurrent increase in blood pH. However, a previous study similarly observed reduced urine pH in Gpr116 whole-animal KO mice (24), but also reported reduced blood pH and increased pCO2. Kubo et al. attributed the increased urine acidity in the whole-animal KO to a primary respiratory acidosis caused by the loss of Gpr116 in type II pneumocytes, which led to an appropriate compensatory decrease in urinary pH. Therefore, we wanted to ensure that the kidney-specific KO mice did not have reduced urine pH due to an unexpected lung phenotype. Whole-animal KO mice have a striking pulmonary phenotype, with turbid bronchoalveolar lavage (BAL) fluid as well as increased BAL protein content. We found that kidney-specific KO mice do not have turbid BAL fluid and do not have increased BAL protein content compared to WT mice (SI Appendix, Fig. S7). These data demonstrate that kidney-specific KO mice do not possess the pulmonary phenotype associated with whole-animal deletion of Gpr116. Moreover, kidney-specific KO mice do not have increased pCO2 or decreased blood pH, indicating that kidney-specific KO mice do not have a respiratory acidosis. Together, these data strongly suggest Gpr116 deletion from A-ICs induces a primary excretion of H+ in the urine.
Deletion of Gpr116 Causes Increased Surface Density of V-ATPase in A-ICs.
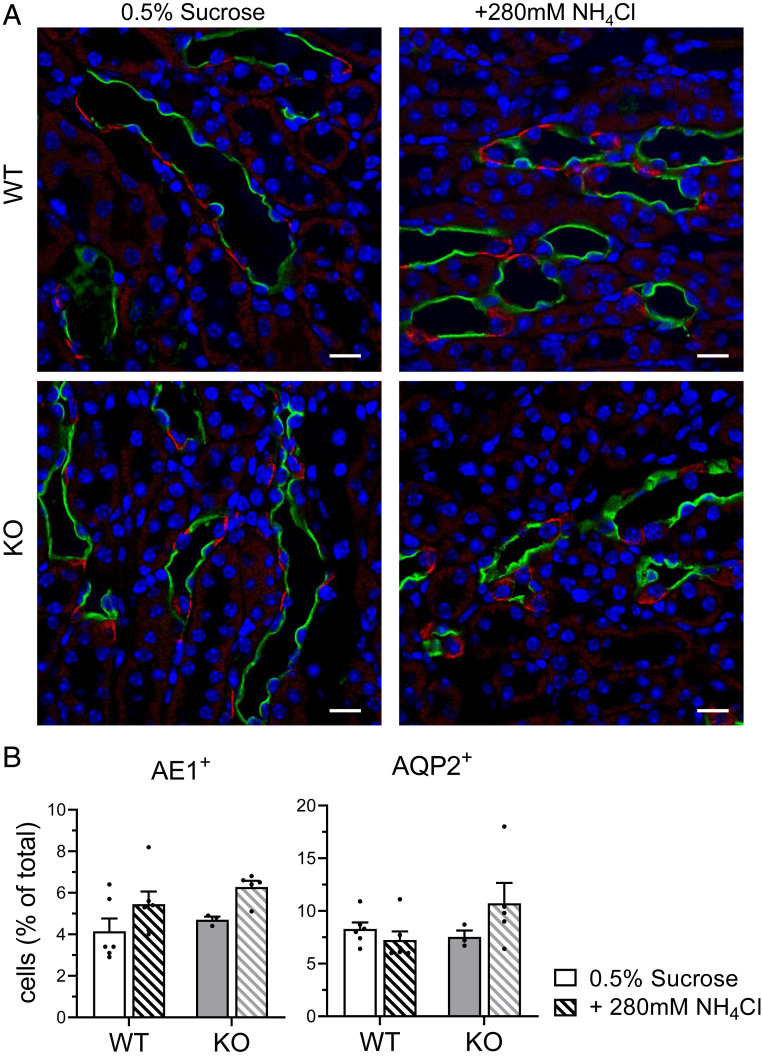
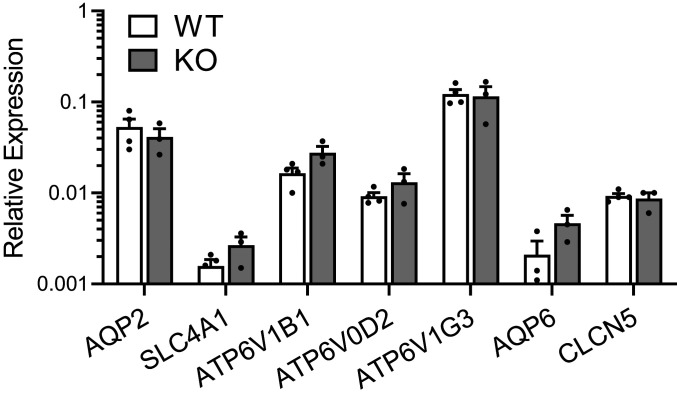
Next, we investigated whether the reduced urine pH observed in kidney-specific Gpr116 KO mice was caused by a change in the abundance of A-ICs. A quantification of WT and KO medullas stained with AQP2 and AE1 (SLC4A1, A-IC–specific marker) (Fig. 7A and SI Appendix, Fig. S8) revealed no significant difference in the abundance of AE1+ cells (Fig. 7B) or AQP2+ cells (Fig. 7B) between WT and KO mice. These data indicate that KO mice do not have significantly more A-ICs than WT mice. Additionally, qPCR analysis of WT and KO kidneys revealed no significant change in the abundance of V-ATPase mRNA (Fig. 8). Quantification of AQP2, SLC4A1, AQP6, and CLCN5 mRNA similarly showed no significant difference between WT and KO mice (Fig. 8).
Fig. 7.
KO mice do not have more A-ICs than WT mice. (A) Representative images demonstrating AQP2 (green) labeling of principal cells and AE1 (red) labeling of ICs from mice drinking control water and water with NH4Cl. (Scale bars, 20 μm.) (B, Left) Quantification of AE1+ cells per 100 DAPI+ cells. For each kidney section, quantification was performed on whole medulla. (Right) Quantification of AQP2+ cells per 100 DAPI+ cells. For B, bars are mean ± SEM. n = 6 kidneys per group. Solid bars are 0.5% sucrose water, hatched bars are 0.5% sucrose + 280 mM NH4Cl water.
Fig. 8.
mRNAs of V-ATPase subunits are similar in WT and KO mice. qPCR analysis of AQP2, SLC4A1 (AE1), V-ATPase subunits ATP6V1B1, ATP6V0D2, ATP6V1G3, AQP6, and CLCN5 mRNAs are not statistically different in WT and KO kidney samples. V-ATPase subunits ATP6V0D2 and ATP6V1G3 were previously shown to be unique transcriptional markers for A-ICs in the kidney (18). AQP6 and CLCN5 encode for proteins that colocalize with V-ATPase in subapical vesicles (59). Bars are mean ± SEM. n = 4 WT kidneys, 3 KO kidneys. Cycle threshold of 35 approximately corresponds with 0.001 on the y axis.
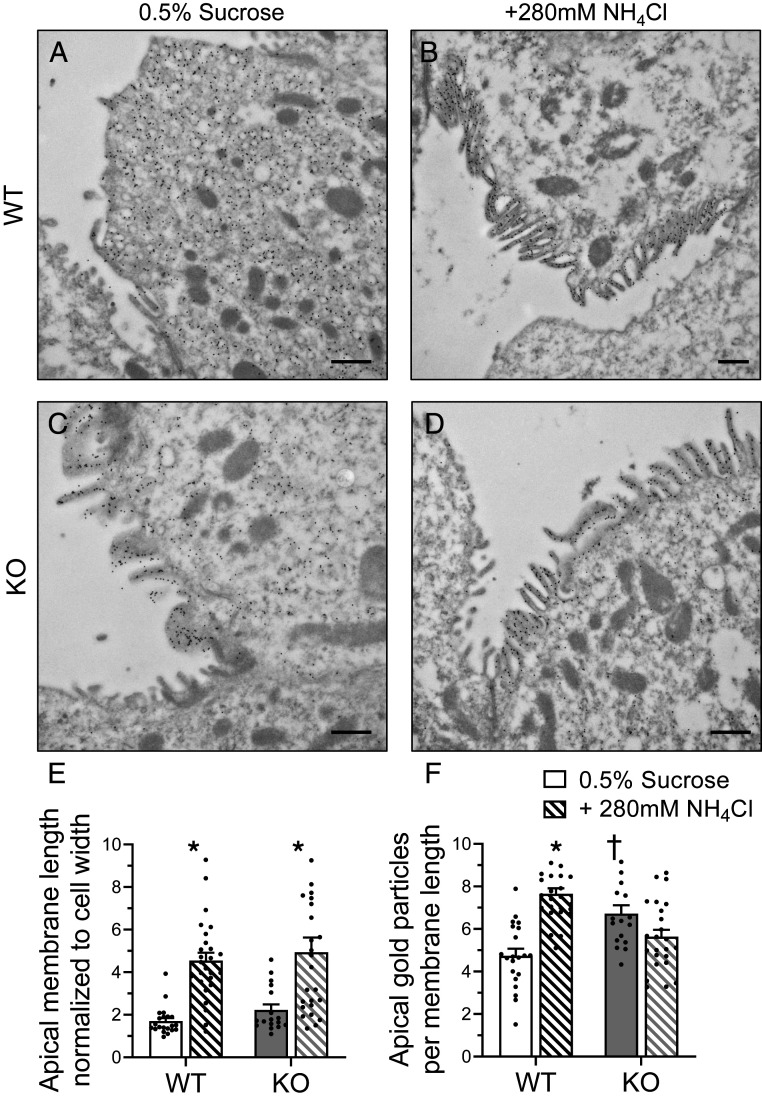
To determine if V-ATPase may be redistributed in A-ICs of Gpr116 KO, we examined surface expression of V-ATPase on A-ICs using immunogold labeling of V-ATPase followed by electron microscopy. We found greater accumulation of V-ATPase–associated gold particles on the surface of A-ICs from KO mice as compared to WT mice drinking control water (0.5% sucrose) (Fig. 9 A, C, and F). Notably, V-ATPase was mostly localized to subapical vesicles in WT A-ICs (Fig. 9A). Induction of a metabolic acidosis using NH4Cl increased surface expression of V-ATPase in WT mice, but not KO mice (Fig. 9F), whereas apical membrane length increased similarly in WT and KO mice (Fig. 9E). Notably, KO mice drinking control water exhibited an increased accumulation of V-ATPase at the apical membrane of A-ICs without any corresponding increase in apical membrane length (Fig. 9 E and F). These data suggest that Gpr116 plays an important role in V-ATPase trafficking.
Fig. 9.
Kidney-specific Gpr116 KO mice have increased accumulation of V-ATPase at the apical membrane of A-ICs. Representative transmission electron micrographs reveal the subcellular localization of V-ATPase by immunogold labeling. (A) Gold particles (black dots) labeling V-ATPase are localized to subapical vesicles in A-ICs from WT mice. (B) Induction of a metabolic acidosis with the addition of NH4Cl to the drinking water causes translocation of V-ATPase to the apical membrane. Numerous microplicae are visible on the surface of the A-IC. (C) KO mice accumulate gold particles at the apical membrane of A-ICs and have visible microplicae. (D) Addition of NH4Cl to the drinking water induces growth of microplicae in KO mice. Images are representative of n = 3 kidneys per group. (Scale bars, 500 nm.) (E) Quantification of A-IC apical membrane length normalized to the cell width. (F) Quantification of gold particle density per unit length of membrane. For E and F, n = 21 cells WT 0.5% sucrose, n = 26 cells WT NH4Cl, n = 17 KO 0.5% sucrose, n = 25 cells KO NH4Cl. Statistical analysis performed using Kruskal–Wallis test followed by Dunn’s multiple comparisons. *P < 0.05 vs. treatment; †P < 0.05 vs. genotype. Apical membrane length: WT 0.5% sucrose vs. +280 mM NH4Cl *P < 0.0001; KO 0.5% sucrose vs. +280 mM NH4Cl *P = 0.005. Apical gold particles: WT 0.5% sucrose vs. +280 mM NH4Cl *P < 0.0001; WT 0.5% sucrose vs. KO 0.5% sucrose †P = 0.007.
Activation of Gpr116 Significantly Inhibits Proton Flux in A-ICs.
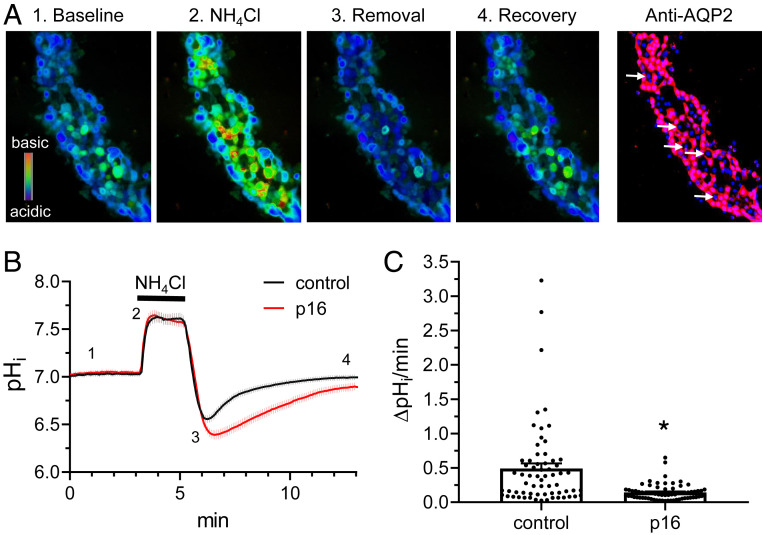
Finally, to determine if Gpr116 has a direct role in regulating surface density of V-ATPase, we investigated the effects of Gpr116 activation on intracellular pH (pHi) in A-ICs from split-open murine collecting ducts harvested from the cortex. Split-open collecting ducts loaded with BCECF-AM and pretreated with 100 µM synthetic agonist p16 peptide demonstrated a significantly reduced pHi recovery compared to untreated collecting ducts following 40 mM NH4Cl pulse (Fig. 10B). The proton extrusion rate was nearly fourfold reduced in the p16-stimulated ICs compared to controls (Fig. 10C) (0.14 ± 0.01 vs. 0.50 ± 0.08, P < 0.0001). These data support the hypothesis that Gpr116 activation inhibits V-ATPase surface expression.
Fig. 10.
Gpr116 activation in A-ICs inhibits pHi recovery. (A) Representative pseudocolor images (blue, acidic; red, alkali) of intracellular pH in a split opened collecting duct loaded with pH-sensitive dye BCECF at the baseline (1), upon application of 40 mM NH4Cl (2), immediately after NH4Cl removal (3), and recovery toward the baseline pHi values (4). Confocal micrograph of the same split-opened CD probed with anti-AQP2 (pseudocolor red) is shown on the right. Examples of AQP2− ICs are depicted with white arrows. Nuclear DAPI staining is shown in pseudocolor blue. Magnification: 40×. (B) Summary graph comparing the time course of pHi changes in control (black) and p16 pretreated (100 µM for 40 min, red) ICs. Trace shows mean ± SEM for 65 control cells and 69 p16-treated cells. Each experimental condition is a summary from four collecting ducts from four different mice. Application of the NH4Cl pulse is designated by the black bar above the trace. The time points shown in A are marked as 1 to 4. (C) Summary graph of H+ extrusion rate from ICs from the control and after pretreatment with p16 shown in B. The rate was calculated as a linear slope of pHi recovery after 40 mM NH4Cl application. Statistical analysis performed using Mann–Whitney test. *P < 0.05. Control vs. p16 *P < 0.0001.
Discussion
We examined renal function in kidney-specific Gpr116-null mice and uncovered a significant physiological role of this understudied GPCR in the kidney. Deletion of Gpr116 from the murine nephron causes accumulation of V-ATPase proton pumps on the surface of acid-secreting A-ICs, resulting in a physiologically inappropriate reduction in urine pH. Furthermore, induction of a metabolic acidosis by addition of NH4Cl to the drinking water did not cause a further drop in urine pH, suggesting that loss of Gpr116 from A-ICs is sufficient to maximally acidify urine. Additionally, Gpr116 activation caused a significant reduction to pHi recovery in ICs from split-open tubules. These data argue that Gpr116 is a major regulator of kidney acid excretion by acting as an inhibitor of V-ATPase mediated proton secretion. There are several interesting observations from the data that strongly support this model.
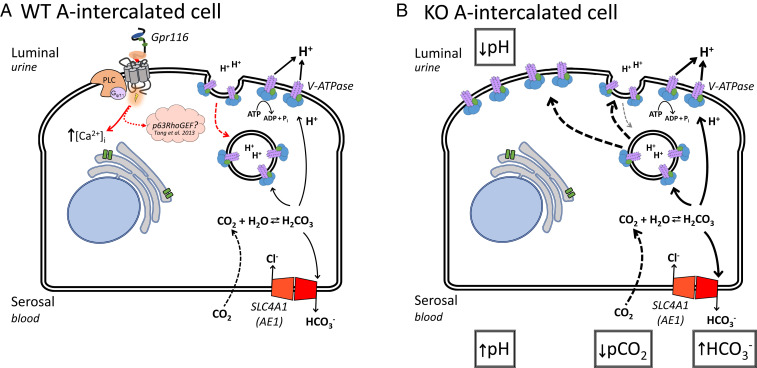
First, the reduction in urine pH observed in the KO mice appears to be the primary defect. KO mice have healthy lungs (SI Appendix, Figs. S6 and S7) and do not have a baseline respiratory acidosis driving urine acidification [as previously observed in whole-animal Gpr116 KO mice (24)]. In contrast, kidney-specific KO mice have more alkaline blood, as well as a trend toward higher blood HCO3− (P = 0.064) (Fig. 6). These data indicate that Gpr116 KO mice have a mild metabolic alkalosis, a phenomenon we term “renal tubular alkalosis.” We propose that deletion of Gpr116 in A-ICs causes increased surface density of V-ATPase, which in turn results in increased excretion of H+ into the urine. This increase in H+ secretion from the A-ICs is the primary defect, and leads to a concurrent increase in HCO3− reabsorption (Fig. 11B). The net result of this process is decreased urine pH, increased blood pH, and a small but significant decrease in blood pCO2 caused by the increased flux of protons across the luminal membrane (Fig. 11B).
Fig. 11.
Working model of Gpr116 function in A-IC from WT and KO mice. (A) In WT mice, Gpr116 is expressed on the apical membrane of A-ICs. Activation of the receptor leads to an increase in [Ca2+]i and possibly Rho GTPases (48). We hypothesize that Gpr116 acts to decrease surface accumulation of V-ATPase (red arrow) by counteracting the effects of agents, such as aldosterone and adenosine (31, 34), which promote increased surface density of proton pumps. (B) In the absence of Gpr116, there is no counter to the up-regulatory pathways, leading to accumulation of V-ATPase at the apical membrane of A-ICs. This results in increased pumping of protons into the lumen and a decrease to urine pH. By Le Chantelier’s principle, the constant depletion of cytosolic protons causes more CO2 to diffuse into the cell and combine with H2O, producing carbonic acid and ultimately more HCO3− and H+, leading to increased HCO3− reabsorption across the basolateral membrane.
Second, KO mice do not have significantly more A-ICs than WT mice (Fig. 7B), nor is there a significant up-regulation of V-ATPase subunit mRNAs (Fig. 8). Rather, it seems likely that the increased surface density of V-ATPase on A-ICs explains why Gpr116 KO mice excrete a more acidic urine (Fig. 9). Based on the present study, Gpr116 appears to be a significant regulator of V-ATPase surface density.
There are several processes that regulate V-ATPase activity and surface expression. For example, it is well understood that subapical, vesicle pools of V-ATPase are recruited to the luminal surface of A-ICs in response to a variety of physiologic stimuli (21, 25, 26). Acidosis causes an increase in surface expression of V-ATPase in A-ICs as well as other proton-secreting epithelia (21, 27, 28). cAMP-dependent signaling also causes translocation of subapical vesicles containing V-ATPase to the apical membrane of proton-secreting epithelia, including A-ICs (29–31). Furthermore, both aldosterone and angiotensin II have direct, nongenomic, effects on surface density of V-ATPase by inducing translocation of subapical vesicles (32–36). Additionally, V-ATPase is also regulated by the reversible dissociation of the V1 catalytic and V0 proton transporting domains. In cultured renal epithelial cells, assembly of functional V-ATPase, as well as membrane translocation, is stimulated by glucose in a PI3K-dependent pathway (37).
Retrieval of V-ATPase from the surface is not as well characterized. A-ICs have a very high endocytic activity which is known to play a role in recycling of V-ATPase from the apical surface to subapical vesicles (38, 39). However, endocytotic vesicles involved in V-ATPase retrieval are not clathrin-coated nor are they coated with any other recognized coat protein, such as caveolin, suggesting V-ATPase protein itself may play a crucial role in their own recycling (40, 41). Coimmunoprecipitation experiments revealed numerous proteins that directly bind V-ATPase and may have important roles in pump regulation, including ERM protein ezrin and RAC1 GDP/GTP exchange factor ARHGEF7 (42). Notably, V-ATPase B subunit interaction with actin filaments suggests modulation of the cytoskeleton may be important in V-ATPase retrieval from the plasma membrane (43–45). Still, direct evidence of pathways stimulating V-ATPase internalization, to this moment, has been absent.
Potential Mechanisms for Gpr116 Action.
Our data support the hypothesis that Gpr116 affects V-ATPase surface expression by regulating retrieval of H+ pumps from the apical membrane. Gpr116 exclusively couples with Gq/11 protein α-subunits. Here, we demonstrate that a synthetic peptide agonist stimulates an increase in cytosolic [Ca2+] in Gpr116 expressing A-ICs from isolated collecting ducts (Fig. 2). Intracellular calcium was previously shown to be a critical component of CO2-stimulated exocytosis of V-ATPase in mitochondria-rich cells in turtle bladder epithelium (46, 47). In these studies, chelation of intracellular calcium in acidified cells prevented pH recovery that was attributed to a reduction in V-ATPase H+ current. However, our data suggest that Gpr116 signaling decreases surface density of H+ pumps, as we demonstrate greater accumulation of V-ATPase at the apical membrane of A-ICs, as well as acidification of urine, in KO mice. Furthermore, stimulation of Gpr116 with the synthetic agonist peptide significantly inhibits pHi recovery in ICs from split-open tubules (Fig. 10), again demonstrating an inhibitory role for Gpr116 signaling pathways on proton excretion in A-ICs.
While the canonical Gαq signaling pathway results in an increase in cytosolic [Ca2+], a previous study demonstrated Gpr116 coupling through a Gαq-p63RhoGEF pathway. This results in the activation of Rho family GTPases, RhoA and Rac1, and downstream effects on actin stress fibers and the cytoskeleton in MDA-MB-231 breast cancer cells (48). Inhibition of Rho, as well as Rho-associated protein kinase, in epididymal proton-secreting clear cells also induced an accumulation of V-ATPase at the apical membrane, a result that mirrors the effect of deleting Gpr116 in A-ICs (49). Therefore, we hypothesize that Gpr116 activation may result in the stimulation of Rho GTPases, leading to the removal of V-ATPase proton pumps from the luminal membrane of A-ICs (Fig. 11A). Thus, in the absence of Gpr116, V-ATPase membrane expression would be up-regulated (Fig. 11B).
Although the mechanism by which Gpr116 might sense urine pH and limit proton excretion remains unknown, one study reported that collectin protein surfactant protein-D (SP-D) activates Gpr116 (13). However, our experiments on Gpr116-expressing HEK cells did not demonstrate an increase in [Ca2+]i after exposure to recombinant human SP-D, suggesting that SP-D is not an activator of Gpr116. Another obvious possibility is that Gpr116 is itself a luminal pH sensor. In this scenario, an increased concentration of protons would cause a conformational shift in the extracellular domains of the receptor and exposure of the tethered ligand [which is embedded in the GPCR-autoproteolysis inducing domain (6)], directly activating Gpr116 and limiting excessive urine acidification. Another possibility concerns the similarities between type II pneumocytes and A-ICs. Both type II cells and A-ICs are specialized secretory epithelial cells with high rates of endo- and exocytosis. Type II cells are easily identified by a “rough” apical membrane with prominent microvilli as well as the abundance of subapical, dense lamellar bodies, which are packed with surfactant lipids and proteins (50, 51). Mechanical stretching of type II cells, as well as various other physical and chemical stimuli (52), leads to secretion of these lamellar bodies (53). As previously noted, loss of Gpr116 in alveolar epithelial cells leads to increased surfactant secretion and significantly reduced recycling (endocytosis). Similarly, stimulated acid-secreting A-ICs have greater apical membrane surface area through growth of microvilli, and have increased luminal expression of V-ATPase (22). We hypothesize that Gpr116 activation in A-ICs is tied to changes in apical membrane surface forces, possibly through interactions with the glycocalyx and adhesion-like domains in the extended N terminus of Gpr116, which cause the tethered-ligand to be revealed. In activated, proton-secreting A-ICs, changes in membrane morphology would lead to activation of Gpr116, increasing endocytosis of V-ATPase at the apical membrane and, thus, inhibiting excessive acid excretion. In this scenario, surface tension, or shear forces associated with protein–protein interactions, would act as the “endogenous” activator of Gpr116 in both the lung and kidney epithelium.
Conclusions.
In the present work, we confirm the expression and localization of Gpr116 in the murine kidney. Additionally, we demonstrate activation of endogenous Gpr116 on the luminal membrane of A-ICs in split-open collecting ducts using the synthetic agonist peptide p16. Finally, we uncover a significant physiologic role for Gpr116 in the kidney, where it plays a critical role in modulating renal acid secretion. This result suggests Gpr116 may be a valuable therapeutic target for the treatment of acid/base disorders, stone formation (54), and possibly urinary tract infections (55). In future studies it will be important to investigate the Gpr116-stimulated signaling pathways that limit surface expression of V-ATPase in A-ICs as well as the potential therapeutic benefits of targeting renal Gpr116.
Methods
A full description of methods is available in SI Appendix.
Materials.
HEK-293 cells with stable, heterologous expression of murine (mGpr116) and human (hGpr116) Gpr116 were kindly provided by Marie-Gabrielle Ludwig, Novartis, Basel, Switzerland. Gpr116 primary antibody was the generous gift of Shigehisa Hirose, Tokyo Institute of Technology, Tokyo, Japan. A new Gpr116 antibody was generated during the present experiments following the protocol described previously (9). Briefly, following the protocol of Abe et al. (9), a nucleotide construct encoding amino acid residues 232 to 675 of rat Gpr116 was cloned into a bacterial expression system (GenScript). Immunogen protein was purified and validated by SDS/PAGE. Two New Zealand rabbits were immunized with the purified protein and given three subsequent boosts. Primary polyclonal antibody targeting the immunogen protein was harvested from the sera of both animals and affinity-purified against the immunogen protein before use. All antibodies used are listed in Table 1. Primary antibody targeting AQP2 was a kind gift of Paul Welling, The Johns Hopkins University, Baltimore, MD (56), and primary antibody targeting pendrin was a kind gift of Susan Wall, Emory University, Atlanta, GA (57). All TaqMan Real-Time PCR Assays (Thermo Scientific) used are listed in Table 2.
Table 1.
Antibodies used in the study
| Antibody | Host species | Target species | Dilution | Technique | Vendor | Source |
| Gpr116 | Rabbit | Rat, mouse | 1:150/1:1,000 | IF, WB | Abe et al. (9) | |
| Gpr116 | Rabbit | Rat, mouse, human | 1:1,000 | WB | Present study | |
| V-ATPase (B1) | Rabbit | Mouse | 1:100 | TEM | Battistone et al. (31) | |
| V-ATPase (B1/2) | Mouse | Rat, mouse, human | 1:150 | IF | Santa Cruz (sc-55544) | |
| Pendrin | Rabbit | Mouse | 1:200 | IF | Royaux et al. (57) | |
| AQP2 | Chicken | Mouse | 1:150 | IF | Wade et al. (56) | |
| AE1 | Rabbit | Rat | 1:150 | IF | Alpha Diagnostic (AE11-A) | Battistone et al. (31) |
IF, immunfluoresence; TEM, transmission electron microscopy; WB, Western blot.
Table 2.
TaqMan real-time PCR assays used
| Gene | TaqMan ID | Exon boundary |
| ADGRF5 (Gpr116) | Mm00685646_m1 | 6–7 |
| SFTPC (SP-C) | Mm00488144_m1 | 1–2 |
| AQP2 | Mm00437575_m1 | 1–2 |
| SLC4A1 (AE1) | Mm00441492_m1 | 3–4 |
| ATP6V1B1 | Mm00460309_m1 | 2–3 |
| ATP6V0D2 | Mm01222963_m1 | 1–2 |
| ATP6V1G3 | Mm00616840_m1 | 2–3 |
| AQP6 | Mm00558232_m1 | 1–2 |
| CLCN5 (ClC-5) | Mm00443851_m1 | 8–9 |
Animals.
All mice were housed in accordance with the policies and procedures of the The Johns Hopkins Institutional Animal Care and Use Committee and University of Texas–Health Science Center at Houston Animal Care and Use Committees. Gpr116flox animals were provided as a generous gift from Brad St. Croix, National Cancer Institute, Bethesda, MD. These mice contain loxP sites flanking either side of exon 2, encoding the start codon, in Gpr116 (15). Ksp-Cre animals (Cdh16 promoter) were purchased from The Jackson Laboratory. Ksp is a tissue-specicfic cadherin that is expressed in tubular epithelial cells in the kidney, including the collecting duct, and was used to selectively delete Gpr116 from the nephron (58). KO animal genotype was Gpr116flox/flox; Ksp-Cre. WT animal genotype was Gpr116+/+; Ksp-Cre or Gpr116flox/flox (no Cre). Induction of metabolic acidosis in mice was achieved by addition of 280 mM NH4Cl to the drinking water with 0.5% sucrose for 48 h, whereas 0.5% sucrose in water was used as the vehicle control (23). All mice were male between the ages of 3 and 6 mo unless otherwise noted. Data from female mice are presented in SI Appendix, Fig. S6.
Statistical Analysis.
Results are presented as mean ± SEM. Analysis of WT and KO samples was performed using a Kruskal–Wallis test followed by a Dunn’s multiple comparisons test, and P values were adjusted using Bonferroni’s correction. For analysis of only two groups, a Mann–Whitney test was performed and an exact P value is reported. All statistical tests were performed using GraphPad Prism 8.3.0. P < 0.05 was considered significant.
Supplementary Material
Acknowledgments
The authors thank Brad St. Croix (National Cancer Institute) for sharing Gpr116-flox animals, and Shigehisa Hirose for generously providing Gpr116 antibody; Paul Welling (The Johns Hopkins University) for sharing AQP2 primary antibody and critical analysis of results; Mario Caturegli and Fabiana Pani (The Johns Hopkins University) for assistance with mice; Susan Wall (Emory University) for sharing pendrin primary antibody; Marie-Gabrielle Ludwig (Novartis) for kindly sharing Gpr116-expressing HEK cells; The Johns Hopkins Institute for Basic Biomedical Sciences Microscope Facility for providing assistance and equipment critical to the present study; Gayane Yenokyan (The Johns Hopkins University) for providing consulation on statistical analysis; J.L.P. laboratory members for helpful discussion, as well as former J.L.P. laboratory members Blythe Shepard, Premraj Rajkumar, Tyler Shubitowski, Mah Noor, and Gina LoMastro for their contributions; and Larissa Shimoda and Karthik Suresh for helpful discussion on methods. This work was supported by F32DK116499 (to N.A.Z.), R01DK107726 (to J.L.P.), and R01DK121848 (to D.B.). Research reported in this publication was also supported by the Office of the Director of the NIH under Awards S10RR024550 and S10OD023548. The Microscopy Core facility of the Massachusetts General Hospital Program in Membrane Biology receives support from Boston Area Diabetes and Endocrinology Research Center, Grant DK57521, and Center for the Study of Inflammatory Bowel Disease, Grant DK43351. This publication was made possible by The Johns Hopkins Institute for Clinical and Translational Research, which is funded in part by Grant UL1 TR003098 from the National Center for Advancing Translational Sciences, a component of the NIH, and NIH Roadmap for Medical Research. Its contents are solely the responsibility of the authors and do not necessarily represent the official view of The Johns Hopkins Institute for Clinical and Translational Research, National Center for Advancing Translational Sciences, or the NIH.
Footnotes
The authors declare no competing interest.
This article is a PNAS Direct Submission.
This article contains supporting information online at https://www.pnas.org/lookup/suppl/doi:10.1073/pnas.2007620117/-/DCSupplemental.
Data Availability.
All data generated or analyzed as a part of this study are included in the main text or SI Appendix.
References
- 1.Bockaert J., Pin J. P., Molecular tinkering of G protein-coupled receptors: An evolutionary success. EMBO J. 18, 1723–1729 (1999). [DOI] [PMC free article] [PubMed] [Google Scholar]
- 2.Bassilana F., Nash M., Ludwig M. G., Adhesion G protein-coupled receptors: Opportunities for drug discovery. Nat. Rev. Drug Discov. 18, 869–884 (2019). [DOI] [PubMed] [Google Scholar]
- 3.Fredriksson R., Lagerström M. C., Lundin L. G., Schiöth H. B., The G-protein-coupled receptors in the human genome form five main families. Phylogenetic analysis, paralogon groups, and fingerprints. Mol. Pharmacol. 63, 1256–1272 (2003). [DOI] [PubMed] [Google Scholar]
- 4.Bjarnadóttir T. K. et al., The human and mouse repertoire of the adhesion family of G-protein-coupled receptors. Genomics 84, 23–33 (2004). [DOI] [PubMed] [Google Scholar]
- 5.Lin H. H. et al., Autocatalytic cleavage of the EMR2 receptor occurs at a conserved G protein-coupled receptor proteolytic site motif. J. Biol. Chem. 279, 31823–31832 (2004). [DOI] [PubMed] [Google Scholar]
- 6.Araç D. et al., A novel evolutionarily conserved domain of cell-adhesion GPCRs mediates autoproteolysis. EMBO J. 31, 1364–1378 (2012). [DOI] [PMC free article] [PubMed] [Google Scholar]
- 7.Brown K. et al., Epithelial Gpr116 regulates pulmonary alveolar homeostasis via Gq/11 signaling. JCI Insight 2, e93700 (2017). [DOI] [PMC free article] [PubMed] [Google Scholar]
- 8.Demberg L. M. et al., Activation of adhesion G protein-coupled receptors: Agonist specificity of Stachel sequence-derived peptides. J. Biol. Chem. 292, 4383–4394 (2017). [DOI] [PMC free article] [PubMed] [Google Scholar]
- 9.Abe J., Suzuki H., Notoya M., Yamamoto T., Hirose S., Ig-hepta, a novel member of the G protein-coupled hepta-helical receptor (GPCR) family that has immunoglobulin-like repeats in a long N-terminal extracellular domain and defines a new subfamily of GPCRs. J. Biol. Chem. 274, 19957–19964 (1999). [DOI] [PubMed] [Google Scholar]
- 10.Rajkumar P., Aisenberg W. H., Acres O. W., Protzko R. J., Pluznick J. L., Identification and characterization of novel renal sensory receptors. PLoS One 9, e111053 (2014). [DOI] [PMC free article] [PubMed] [Google Scholar]
- 11.Ariestanti D. M., Ando H., Hirose S., Nakamura N., Targeted disruption of Ig-Hepta/Gpr116 causes emphysema-like symptoms that are associated with alveolar macrophage activation. J. Biol. Chem. 290, 11032–11040 (2015). [DOI] [PMC free article] [PubMed] [Google Scholar]
- 12.Bridges J. P. et al., Orphan G protein-coupled receptor GPR116 regulates pulmonary surfactant pool size. Am. J. Respir. Cell Mol. Biol. 49, 348–357 (2013). [DOI] [PMC free article] [PubMed] [Google Scholar]
- 13.Fukuzawa T. et al., Lung surfactant levels are regulated by Ig-Hepta/GPR116 by monitoring surfactant protein D. PLoS One 8, e69451 (2013). [DOI] [PMC free article] [PubMed] [Google Scholar]
- 14.Niaudet C. et al., Gpr116 receptor regulates distinctive functions in pneumocytes and vascular endothelium. PLoS One 10, e0137949 (2015). [DOI] [PMC free article] [PubMed] [Google Scholar]
- 15.Yang M. Y. et al., Essential regulation of lung surfactant homeostasis by the orphan G protein-coupled receptor GPR116. Cell Rep. 3, 1457–1464 (2013). [DOI] [PMC free article] [PubMed] [Google Scholar]
- 16.Niaudet C. et al., Adgrf5 contributes to patterning of the endothelial deep layer in retina. Angiogenesis 22, 491–505 (2019). [DOI] [PMC free article] [PubMed] [Google Scholar]
- 17.Chen L. et al., Transcriptomes of major renal collecting duct cell types in mouse identified by single-cell RNA-seq. Proc. Natl. Acad. Sci. U.S.A. 114, E9989–E9998 (2017). [DOI] [PMC free article] [PubMed] [Google Scholar]
- 18.Park J. et al., Single-cell transcriptomics of the mouse kidney reveals potential cellular targets of kidney disease. Science 360, 758–763 (2018). [DOI] [PMC free article] [PubMed] [Google Scholar]
- 19.Lu S. et al., Developmental vascular remodeling defects and postnatal kidney failure in mice lacking Gpr116 (Adgrf5) and Eltd1 (Adgrl4). PLoS One 12, e0183166 (2017). [DOI] [PMC free article] [PubMed] [Google Scholar]
- 20.Stoveken H. M., Hajduczok A. G., Xu L., Tall G. G., Adhesion G protein-coupled receptors are activated by exposure of a cryptic tethered agonist. Proc. Natl. Acad. Sci. U.S.A. 112, 6194–6199 (2015). [DOI] [PMC free article] [PubMed] [Google Scholar]
- 21.Breton S., Brown D., Regulation of luminal acidification by the V-ATPase. Physiology 28, 318–329 (2013). [DOI] [PMC free article] [PubMed] [Google Scholar]
- 22.Brown D., Paunescu T. G., Breton S., Marshansky V., Regulation of the V-ATPase in kidney epithelial cells: Dual role in acid-base homeostasis and vesicle trafficking. J. Exp. Biol. 212, 1762–1772 (2009). [DOI] [PMC free article] [PubMed] [Google Scholar]
- 23.Nowik M., Kampik N. B., Mihailova M., Eladari D., Wagner C. A., Induction of metabolic acidosis with ammonium chloride (NH4Cl) in mice and rats–species differences and technical considerations. Cell. Physiol. Biochem. 26, 1059–1072 (2010). [DOI] [PubMed] [Google Scholar]
- 24.Kubo F. et al., Loss of the adhesion G-protein coupled receptor ADGRF5 in mice induces airway inflammation and the expression of CCL2 in lung endothelial cells. Respir. Res. 20, 11 (2019). [DOI] [PMC free article] [PubMed] [Google Scholar]
- 25.Roy A., Al-bataineh M. M., Pastor-Soler N. M., Collecting duct intercalated cell function and regulation. Clin. J. Am. Soc. Nephrol. 10, 305–324 (2015). [DOI] [PMC free article] [PubMed] [Google Scholar]
- 26.Schwartz G. J., Al-Awqati Q., Regulation of transepithelial H+ transport by exocytosis and endocytosis. Annu. Rev. Physiol. 48, 153–161 (1986). [DOI] [PubMed] [Google Scholar]
- 27.Schwartz G. J. et al., Acid incubation reverses the polarity of intercalated cell transporters, an effect mediated by hensin. J. Clin. Invest. 109, 89–99 (2002). [DOI] [PMC free article] [PubMed] [Google Scholar]
- 28.Purkerson J. M., Schwaderer A. L., Nakamori A., Schwartz G. J., Distinct α-intercalated cell morphology and its modification by acidosis define regions of the collecting duct. Am. J. Physiol. Renal Physiol. 309, F464–F473 (2015). [DOI] [PMC free article] [PubMed] [Google Scholar]
- 29.Păunescu T. G. et al., cAMP stimulates apical V-ATPase accumulation, microvillar elongation, and proton extrusion in kidney collecting duct A-intercalated cells. Am. J. Physiol. Renal Physiol. 298, F643–F654 (2010). [DOI] [PMC free article] [PubMed] [Google Scholar]
- 30.Pastor-Soler N. et al., Bicarbonate-regulated adenylyl cyclase (sAC) is a sensor that regulates pH-dependent V-ATPase recycling. J. Biol. Chem. 278, 49523–49529 (2003). [DOI] [PMC free article] [PubMed] [Google Scholar]
- 31.Battistone M. A. et al., Extracellular adenosine stimulates vacuolar ATPase-dependent proton secretion in medullary intercalated cells. J. Am. Soc. Nephrol. 29, 545–556 (2018). [DOI] [PMC free article] [PubMed] [Google Scholar]
- 32.Winter C., Schulz N., Giebisch G., Geibel J. P., Wagner C. A., Nongenomic stimulation of vacuolar H+-ATPases in intercalated renal tubule cells by aldosterone. Proc. Natl. Acad. Sci. U.S.A. 101, 2636–2641 (2004). [DOI] [PMC free article] [PubMed] [Google Scholar]
- 33.Wagner C. A. et al., Angiotensin II stimulates H+-ATPase activity in intercalated cells from isolated mouse connecting tubules and cortical collecting ducts. Cell. Physiol. Biochem. 28, 513–520 (2011). [DOI] [PMC free article] [PubMed] [Google Scholar]
- 34.Winter C. et al., Aldosterone stimulates vacuolar H(+)-ATPase activity in renal acid-secretory intercalated cells mainly via a protein kinase C-dependent pathway. Am. J. Physiol. Cell Physiol. 301, C1251–C1261 (2011). [DOI] [PMC free article] [PubMed] [Google Scholar]
- 35.Alzamora R. et al., PKA regulates vacuolar H+-ATPase localization and activity via direct phosphorylation of the a subunit in kidney cells. J. Biol. Chem. 285, 24676–24685 (2010). [DOI] [PMC free article] [PubMed] [Google Scholar]
- 36.Pech V., Zheng W., Pham T. D., Verlander J. W., Wall S. M., Angiotensin II activates H+-ATPase in type A intercalated cells. J. Am. Soc. Nephrol. 19, 84–91 (2008). [DOI] [PMC free article] [PubMed] [Google Scholar]
- 37.Sautin Y. Y., Lu M., Gaugler A., Zhang L., Gluck S. L., Phosphatidylinositol 3-kinase-mediated effects of glucose on vacuolar H+-ATPase assembly, translocation, and acidification of intracellular compartments in renal epithelial cells. Mol. Cell. Biol. 25, 575–589 (2005). [DOI] [PMC free article] [PubMed] [Google Scholar]
- 38.Brown D., Breton S., H(+)V-ATPase-dependent luminal acidification in the kidney collecting duct and the epididymis/vas deferens: Vesicle recycling and transcytotic pathways. J. Exp. Biol. 203, 137–145 (2000). [DOI] [PubMed] [Google Scholar]
- 39.Madsen K. M., Tisher C. C., Response of intercalated cells of rat outer medullary collecting duct to chronic metabolic acidosis. Lab. Invest. 51, 268–276 (1984). [PubMed] [Google Scholar]
- 40.Brown D., Weyer P., Orci L., Nonclathrin-coated vesicles are involved in endocytosis in kidney collecting duct intercalated cells. Anat. Rec. 218, 237–242 (1987). [DOI] [PubMed] [Google Scholar]
- 41.Breton S., Lisanti M. P., Tyszkowski R., McLaughlin M., Brown D., Basolateral distribution of caveolin-1 in the kidney. Absence from H+-atpase-coated endocytic vesicles in intercalated cells. J. Histochem. Cytochem. 46, 205–214 (1998). [DOI] [PubMed] [Google Scholar]
- 42.Merkulova M. et al., Mapping the H(+) (V)-ATPase interactome: Identification of proteins involved in trafficking, folding, assembly and phosphorylation. Sci. Rep. 5, 14827 (2015). [DOI] [PMC free article] [PubMed] [Google Scholar]
- 43.Chen S. H. et al., Vacuolar H+-ATPase binding to microfilaments: Regulation in response to phosphatidylinositol 3-kinase activity and detailed characterization of the actin-binding site in subunit B. J. Biol. Chem. 279, 7988–7998 (2004). [DOI] [PubMed] [Google Scholar]
- 44.Holliday L. S. et al., The amino-terminal domain of the B subunit of vacuolar H+-ATPase contains a filamentous actin binding site. J. Biol. Chem. 275, 32331–32337 (2000). [DOI] [PubMed] [Google Scholar]
- 45.Beaulieu V. et al., Modulation of the actin cytoskeleton via gelsolin regulates vacuolar H+-ATPase recycling. J. Biol. Chem. 280, 8452–8463 (2005). [DOI] [PubMed] [Google Scholar]
- 46.Cannon C., van Adelsberg J., Kelly S., Al-Awqati Q., Carbon-dioxide-induced exocytotic insertion of H+ pumps in turtle-bladder luminal membrane: Role of cell pH and calcium. Nature 314, 443–446 (1985). [DOI] [PubMed] [Google Scholar]
- 47.Gluck S., Cannon C., Al-Awqati Q., Exocytosis regulates urinary acidification in turtle bladder by rapid insertion of H+ pumps into the luminal membrane. Proc. Natl. Acad. Sci. U.S.A. 79, 4327–4331 (1982). [DOI] [PMC free article] [PubMed] [Google Scholar]
- 48.Tang X. et al., GPR116, an adhesion G-protein-coupled receptor, promotes breast cancer metastasis via the Gαq-p63RhoGEF-Rho GTPase pathway. Cancer Res. 73, 6206–6218 (2013). [DOI] [PubMed] [Google Scholar]
- 49.Shum W. W. et al., Regulation of V-ATPase recycling via a RhoA- and ROCKII-dependent pathway in epididymal clear cells. Am. J. Physiol. Cell Physiol. 301, C31–C43 (2011). [DOI] [PMC free article] [PubMed] [Google Scholar]
- 50.Fehrenbach H., Alveolar epithelial type II cell: Defender of the alveolus revisited. Respir. Res. 2, 33–46 (2001). [DOI] [PMC free article] [PubMed] [Google Scholar]
- 51.Cutz E., Wert S. E., Nogee L. M., Moore A. M., Deficiency of lamellar bodies in alveolar type II cells associated with fatal respiratory disease in a full-term infant. Am. J. Respir. Crit. Care Med. 161, 608–614 (2000). [DOI] [PubMed] [Google Scholar]
- 52.Chintagari N. R. et al., Vacuolar ATPase regulates surfactant secretion in rat alveolar type II cells by modulating lamellar body calcium. PLoS One 5, e9228 (2010). [DOI] [PMC free article] [PubMed] [Google Scholar]
- 53.Andreeva A. V., Kutuzov M. A., Voyno-Yasenetskaya T. A., Regulation of surfactant secretion in alveolar type II cells. Am. J. Physiol. Lung Cell. Mol. Physiol. 293, L259–L271 (2007). [DOI] [PubMed] [Google Scholar]
- 54.Wagner C. A., Mohebbi N., Urinary pH and stone formation. J. Nephrol. 23 (suppl. 16), S165–S169 (2010). [PubMed] [Google Scholar]
- 55.Bono M. J., Reygaert W. C., Urinary Tract Infection, (StatPearls, Treasure Island, FL, 2019). [Google Scholar]
- 56.Wade J. B. et al., Differential regulation of ROMK (Kir1.1) in distal nephron segments by dietary potassium. Am. J. Physiol. Renal Physiol. 300, F1385–F1393 (2011). [DOI] [PMC free article] [PubMed] [Google Scholar]
- 57.Royaux I. E. et al., Pendrin, encoded by the Pendred syndrome gene, resides in the apical region of renal intercalated cells and mediates bicarbonate secretion. Proc. Natl. Acad. Sci. U.S.A. 98, 4221–4226 (2001). [DOI] [PMC free article] [PubMed] [Google Scholar]
- 58.Shao X., Somlo S., Igarashi P., Epithelial-specific Cre/lox recombination in the developing kidney and genitourinary tract. J. Am. Soc. Nephrol. 13, 1837–1846 (2002). [DOI] [PubMed] [Google Scholar]
- 59.Michalek K., Aquaglyceroporins in the kidney: Present state of knowledge and prospects. J. Physiol. Pharmacol. 67, 185–193 (2016). [PubMed] [Google Scholar]
Associated Data
This section collects any data citations, data availability statements, or supplementary materials included in this article.
Supplementary Materials
Data Availability Statement
All data generated or analyzed as a part of this study are included in the main text or SI Appendix.


