Abstract
Purpose
The purpose of this paper was to determine the architecture of the collagen fibers of the peripapillary sclera, the retinal nerve fiber layer (RNFL), and Henle's fiber layer in vivo in 3D using polarization-sensitive optical coherence tomography (PS-OCT).
Methods
Seven healthy volunteers were imaged with our in-house built PS-OCT system. PS-OCT imaging included intensity, local phase retardation, relative optic axis, and optic axis uniformity (OAxU). Differential Mueller matrix calculus was used for the first time in ocular tissues to visualize local orientations that varied with depth, incorporating a correction method for the fiber orientation in preceding layers.
Results
Scleral collagen fiber orientation images clearly showed an inner layer with an orientation parallel to the RNFL orientation, and a deeper layer where the collagen was circularly oriented. RNFL orientation images visualized the nerve fibers leaving the optic nerve head (ONH) in a radial pattern. The phase retardation and orientation of Henle's fiber layer were visualized locally for the first time.
Conclusions
PS-OCT successfully showed the orientation of the retinal nerve fibers, sclera, and Henle's fiber layer, and is to the extent of our knowledge the only technique able to do so in 3D in vivo.
Translational Relevance
In vivo 3D imaging of scleral collagen architecture and the retinal neural fibrous structures can improve our understanding of retinal biomechanics and structural alterations in different disease stages of myopia and glaucoma.
Keywords: polarization-sensitive optical coherence tomography (OCT), fiber orientation, peripapillary sclera, birefringence, optic axis
Introduction
Glaucoma is a disease with a complex pathophysiology with an elevated intraocular pressure as the main risk factor, leading to thinning of the retinal nerve fiber layer (RNFL), and permanent loss of visual function. A changed collagen organization and composition of the sclera has also been associated with the disease.1–3 This has been shown in studies using small angle light scattering (SALS), second harmonic generation microscopy (SHG), and wide-angle X-ray scattering (WAXS). WAXS has also been used to report changes in scleral composition in degenerative high myopia, characterized by an abnormally enlarged eye and posterior staphyloma's.4 Gogola et al.5 used polarized light microscopy (PLM) to show that in normal eyes of humans and animals three regions of collagen fiber organization could be identified: a radial region in the most anterior sclera, a region of aligned circumferential fibers adjacent to the canal, and a region of interweaving fibers without a primary alignment orientation. Other techniques, such as scanning electron microscopy (SEM), transmission electron microscopy (TEM), and atomic force microscopy (AFM) were also used to increase our understanding of scleral architecture on the nanoscale level.6
However, none of the aforementioned techniques can be used in vivo. Thus, they cannot be used to scan a large population of patients or monitor the progression of diseases. An exception to this might be magnetic resonance imaging (MRI). Ho et al.7 used this to visualize the scleral architecture. However, the MRI signal intensity from the sclera is very low, resulting in long measurement times. The resolution was in the order of millimeters in the depth dimension, and submillimeter in the lateral dimension, which cannot deliver sufficient information about fine details of the retina. Additionally, MRIs are comparably large and expensive devices, which limits their applicability for screening purposes. There is a clear need for a micrometer-resolution technique, which can quickly and quantitatively assess scleral collagen fiber organization in vivo that can contribute to a better understanding of glaucoma and high myopia pathophysiology, and can aid in their diagnosis and management.6 This technique should provide a high depth resolution to assess how the observed structural differences contribute to disease.1 WAXS, SALS, and PLM are only available in 2D, and the only way to create 3D images is by slicing the tissue. An imaging technique able to visualize scleral architecture in vivo in 3D could greatly increase our understanding of glaucoma and high myopia development and provide us with a tool to monitor the changes in scleral composition during the progression of disease.
Polarization-sensitive optical coherence tomography (PS-OCT) is a functional extension of optical coherence tomography (OCT), where the polarization state changes of the light are included in the analysis to create additional contrast. The development of this technique started shortly after the introduction of OCT,8,9 and is now reaching maturity.10,11 The additional contrast of PS-OCT is based on birefringence and optic axis orientation of fibrous structures. In the retina, these fibrous structures include the RNFL12–14 and Henle's fiber layer.15,16 Optic axis imaging in PS-OCT was used to show a radial orientation of the fibers in the RNFL around the ONH.17,18 In the sclera, PS-OCT has been used to assess the birefringence of ex vivo scleral samples of cows, rabbits, and humans and to quantify stress-induced changes when stretching.19 Baumann et al.20 used PS-OCT to show the peripapillary sclera birefringence and optic axis orientation in rat eyes in vivo, revealing a ring-shaped orientation of fibers directly around the optic nerve head (ONH). At the time of that publication, no method existed yet to visualize the orientation and birefringence locally. If the sclera consists of multiple layers with different orientations that vary in depth, Baumann et al. could not have resolved these layers with different orientations.
In this proof-of-concept study, PS-OCT is used to visualize the peripapillary scleral collagen organization and retinal fibrous layer architecture locally in 3D in vivo in healthy volunteers.
Methods
Experimental Setup
Our experimental PS-OCT setup has been developed by Braaf et al.17 in 2014, and has since then been updated to improve the phase stability by Gräfe et al.21 In short, light from a swept-source laser centered at 1060 nm was split into a reference arm and a sample arm. The light from the reference arm was multiplexed into two orthogonal polarization states with a polarization-delay unit22,23 and then sent into the eye. After traveling through the sample and backscattering in the retina, the light was recollected by the same fiber and recombined with the reference arm. Horizontally and vertically polarized light were separated and detected by two separate balanced detectors. The beam was scanned over an area on the retina using two galvanometric mirrors. This area covered 6.2 mm by 5.7 mm, and consisted of 1536 samples per A-line, 2000 A-lines per B-scan, and 300 B-scans per C-scan. With a sweep repetition rate of 100 kHz, this resulted in an imaging time per C-scan of 6.6 seconds. Total imaging depth was 2.2 mm in air. Assuming a refractive index of tissue of 1.3, this corresponds to a maximum image height of 1.7 mm.
Participants
For this pilot study, seven healthy volunteers were scanned with our PS-OCT setup. In total, 11 eyes were scanned. Five eyes were dilated with tropicamide 0.5% and phenylephrine 5% prior to imaging, as the use of mydriatics was optional. The study followed the Tenets of the Declaration of Helsinki and written informed consent was obtained from all volunteers. The study was approved by the Medical Ethics Committee of the Amsterdam UMC, location VUMC in Amsterdam. A 3D scan centered around the ONH was obtained in all (n = 11) eyes. Optional macular scans were obtained as well in four eyes.
Data Processing
The algorithm to correct the data and create the images has been described by Willemse et al.24 All post-processing was performed in MatLab R2018a, and took approximately 3 hours per dataset. Images used in this study included intensity, local optic axis orientation, optic axis uniformity (OAxU), and cumulative phase retardation. Cumulative phase retardation images were calculated to compare to previous work on PS-OCT and are included in the Supplementary Material. OAxU values vary between 0 and 1 and measure the anisotropy of the optic axis in a small region. Optic axes orientation images were obtained using differential Mueller calculus as originally developed by Villiger et al.25 If there are any preceding birefringent layers of tissue with a different optic axis, the extracted optic axis for the layer underneath is affected and needs to be corrected. Instead of using Jones’ calculus26 or constructing SO(3) rotation matrices27 to correct for this effect, we developed a method using the same differential Mueller calculus. This method is described in the Supplementary Material. The algorithm for automatic segmentation of the sclera and retinal pigment epithelium (RPE) can also be found in the Supplementary Material. Automatic segmentation of the RNFL was performed using the algorithm described by Willemse et al.24 To visualize the different imaging modalities, cross sectional intensity images were overlaid with the optic axis orientation whenever that pixel had an OAxU value > 0.5. Intensity en face images were created using the logarithmic values of the intensity and summing them along each A-line. RNFL orientation en face images were created by computing the mean of each vector element of the optic axes within the segmented RNFL. Similarly, scleral orientation en face images were created with the mean of each vector element of the optic axes over the first 30 pixels (approximately 150 µm) of the segmented sclera that had an OAxU value > 0.5. Because no automatic segmentation is available for Henle's fiber layer / the outer plexiform layer (OPL), orientation en face images were created by taking the mean of each vector element of all pixels with OAxU > 0.5 to visualize the orientation of Henle's fiber layer. Because the RNFL is very thin in the macula region, and sclera tissue is often too deep to be visualized in the macula region, this method did not obscure the signal coming from Henle's fiber layer. Cumulative optic axis images were also created to further visualize the orientation of Henle's fiber layer. In these images, the optic axis is not calculated over one pixel in depth, but over the full distance between the pixel and the surface. This was calculated by using the concurrent decomposition of the Jones matrices J as introduced by Li et al.27:
Subsequently, cumulative optic axis en face images were created by averaging the cumulative optic axis of the pixels segmented as RPE pixels to create optic axis en face images of the macular area with a higher contrast.
Results
The details of the volunteers scanned with our system are displayed in the Table. None of the volunteers had high myopia (< ‒6 D).
Table.
Demographics and Results of the Volunteers Scanned
| Volunteer | Gender | Age, y | Sclera Visible | Mydriasis | Macular Scan | Shown in Figure |
|---|---|---|---|---|---|---|
| 1 | Male | 39 | Yes | Yes | Yes | 1, 2 |
| 2 | Male | 55 | Yes | No | Yes | 3A, 3E, 3I, 3M, 4 |
| 3 | Male | 64 | Yes | Yes | Yes | 3B, 3F, 3J, 3N |
| 4 | Male | 24 | Yes | No | No | 3C, 3G, 3K, 3O |
| 5 | Female | 26 | Yes | Yes | Yes | 3D, 3H, 3L, 3P |
| 6 | Male | 36 | Partially | No | No | – |
| 7 | Female | 21 | Partially | No | No | – |
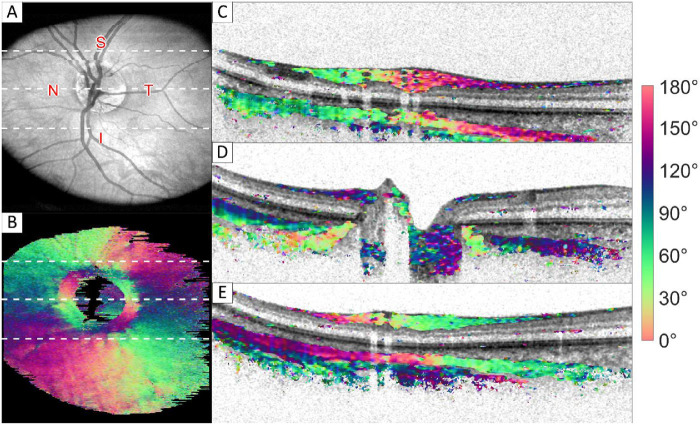
Figure 1 shows an example of intensity and optic axis orientation en face images and combined cross section images obtained in a healthy volunteer. Figure 1A shows the intensity en face image. Figure 1B shows the orientation measured in the sclera, where the white dotted lines correspond to the B-scans shown on the right of the image. Two different fiber orientations where measured in the sclera. The inner layer of sclera is oriented parallel to the RNFL (i.e. radial from the ONH). A deeper layer was found where the orientation is circular around the ONH. This layer is positioned under the radial oriented layer, except in close proximity to the ONH. Here, the radial layer vanishes while the circular layer extends significantly closer to the ONH and more proximal, as indicated by the red arrows in Figure 1D. This results in a ring of circular orientation at the scleral innermost part, as can be seen in the sclera orientation en face image (see Fig. 1B). Cumulative phase retardation images of all B-scans shown here are included in the Supplementary Material.
Figure 1.
Intensity and orientation images of the retina of a healthy volunteer. (A) Intensity en face image; (B) orientation en face image of the innermost part of sclera (approximately 150 µm thickness); and (C–E) cross section images, where the intensity image is overlaid with color-coded orientation values for pixels with high optic axis uniformity. Red arrows in D point toward the region where the most anterior sclera pixels have a circular orientation, causing a ring-like feature in the orientation en face image shown in B. White dotted lines in A and B correspond from top to bottom to the cross sections shown in C to E. Images sizes: A and B 5.7 × 6.2 mm (depth × height), C to E 1.7 × 6.2 mm (depth × height). A video of all frames is provided in the Supplementary Material. S, superior; N, nasal; I, inferior; T, temporal region.
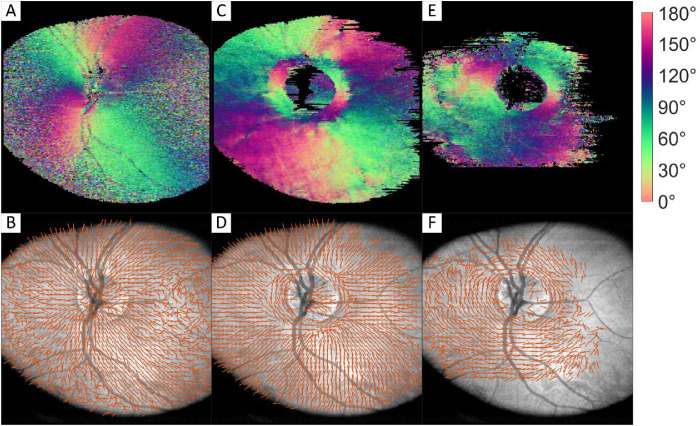
To interpret the colors of the orientation images correctly, vector plots were created, which are plotted on top of intensity en face images. Orientation en face images and their corresponding vector plots of the RNFL, first layer of sclera, and second layer of sclera are shown in Figure 2. Here, the start of the second layer of sclera (Figs. 2E, 2F) was segmented manually based on orientation images. This orientation could not be retrieved from every B-scan because it was either not within the image range or because the intensity from this layer was too low.
Figure 2.
Orientation color images and their corresponding vector images of RNFL (A, B), first 150 µm of sclera (C, D), and manually segmented second layer of sclera orientation (E, F). Images sizes: 5.7 × 6.2 mm (depth × height).
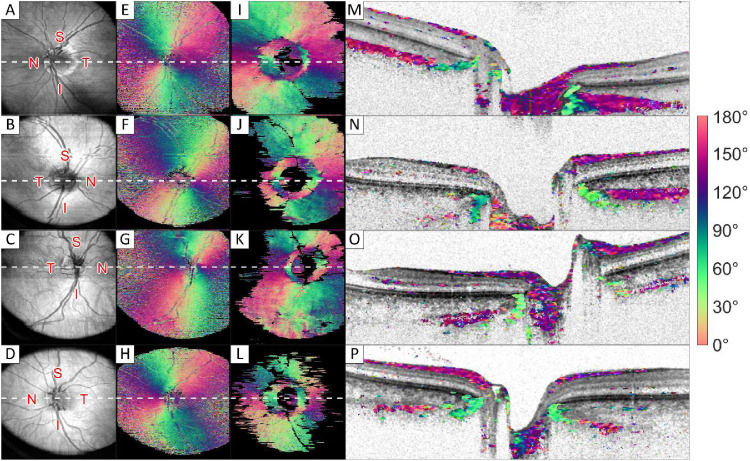
Eyes of five of seven volunteers showed these two orientations for the sclera, with the second layer surfacing in a ring around the ONH. One eye is shown in Figure 1 and Figure 2, an overview of images of the other four volunteers is shown in Figure 3. In two volunteers, the signal-to-noise ratio was too low in the scleral tissue to be evaluated, leaving too little birefringence signal to create a full en face image. Good quality RNFL orientation en face images could be created in all volunteers.
Figure 3.
Intensity and orientation images of the retina of four different volunteers. (A–D) Intensity en face images; (E–H) orientation en face image of the retinal nerve fiber layer; (I–L) orientation en face image of the innermost part of the sclera (approximately 150 µm thickness); and (M–P) cross section images, where the grayscale intensity image is overlaid with color-coded orientation values for pixels with high optic axis uniformity. White dotted lines in A to L correspond to the cross sections shown in M to P in the same row. Images sizes: A to L 5.7 × 6.2 mm (depth × height), and M to P 1.7 × 6.2 mm (depth × height). S, superior; N, nasal; I, inferior; T, temporal region.
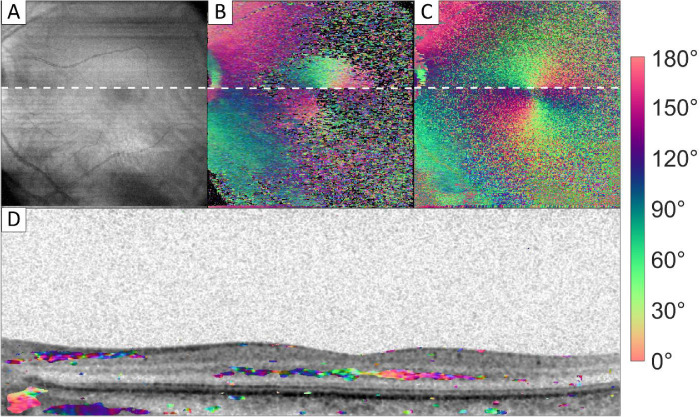
In the macula region, Henle's fiber layer was found to be birefringent, as shown in Figure 4. Figure 4B shows a full optic axis en face image, where all orientations from pixels with an OAxU value > 0.5 were averaged. Near the optic nerve head, the signal from the RNFL and sclera can be observed. At the macula region, Henle's fiber layer creates a radial pattern around the fovea. This is shown locally in Figure 4D. A band of high OAxU signal is found in the OPL, spanning 3.9 mm in the presented B-scan. No birefringent signal of sclera was observed at the macula. This is mostly because the retina was positioned at the bottom of the image and the imaging range did not reach the sclera. In Figure 4C an orientation en face image is shown using the cumulative optic axes.
Figure 4.
Intensity and orientation images of the macula region. (A) Intensity en face image; (B) local orientation en face image; (C) cumulative orientation en face image of RPE; and (D) cross section image, where the intensity image is overlaid with color-coded orientation values for pixels with high optic axis uniformity. White dotted lines in A to C correspond to the cross section shown in D. Images sizes: A to C 5.7 × 6.2 mm (depth × height), and D 1.7 × 6.2 mm (depth × height).
Discussion
The observed patterns of the collagen fibers in the sclera demonstrated in this in vivo study are consistent with the previously mentioned ex vivo results reported by Gogola et al.5 They reported that circumferential fibers formed a ring adjacent to the scleral canal in all measured eyes, and that radially oriented regions started near the canal and extended for at least several mm. Figure 5 shows a 3D model of peripapillary sclera orientation as observed in our images. Gogola et al.5 also report regions of interweaving fibers throughout the sclera depth. These interweaving regions were not found with our method. A lack of birefringence signal might indicate such an interweaving region, but a lack of signal can have other causes as well.
Figure 5.
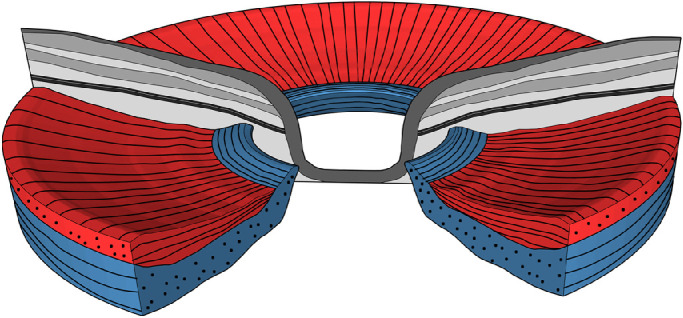
Model of peripapillary scleral orientation. A radially oriented fiber layer (red) precedes a circumferentially orientated fiber layer (blue). Close to the ONH, the circumferentially oriented layer displaces the radially oriented fiber layer.
The reflectivity of Henle's fiber layer is dependent on the angle under which it is imaged.28 This is also the case for its birefringence, as fibers oriented parallel to the propagation direction of the light do not exhibit birefringence signal. In Figure 4B, at the white dotted line, a small movement of the eye caused a shift in the scan. After this movement, Henle's fiber layer showed a stronger OAxU signal. The cumulative en face image in Figure 4C shows that Henle's fiber layer did cause a phase retardation in the light coming from the RPE above and beneath the white line. The quality of the local en face images of Henle's fiber layer varied significantly between and within volunteers.
Before PS-OCT can be used widely in the clinic, some limitations must be overcome. The foremost is its limited penetration depth. Our system has a wavelength range centered at 1060 nm. The long wavelength range enables us to reach the sclera in a large fraction of the data, whereas the light from systems with a wavelength centered around 870 nm is attenuated much more before it reaches the sclera. However, even with our system the sensitivity was not always high enough to detect backscattered light from deep scleral layers. A lack of intensity signal means no optic axes could be calculated. An example of this is shown in Figure 3N, where the left side of the B-scan does not show any signal from sclera. This also shows as a black void in the left of the en face image, as shown in Figure 3J. In two of seven volunteers, only a circumferentially oriented ring of scleral collagen was visible around the ONH, where the attenuation of the RNFL and RPE is lower than in other regions. In these scans, little to no signal from the radially oriented layer could be obtained. In the macula region, the RPE contains more highly scattering and polarization scrambling melanin29 and, therefore, even less light reaches the sclera.
Because of unknown birefringence in the setup and the cornea, the incident polarization state on the retina cannot be determined. Therefore, in this study, optic axis orientation measurements are always relative. The degrees reported in the figures for the optic axis are calibrated on the radial orientation of the fibers in the RNFL. The known orientation of the RNFL is then used to interpret the orientations found in the sclera.
As our system is not equipped with a scanning laser ophthalmoscope (SLO) or retinal tracking, it was sometimes difficult to align the volunteers. The use of mydriatics made this easier. However, the use of mydriatics is not deemed necessary for obtaining high-quality PS-OCT scans in healthy volunteers.
The radially oriented scleral collagen layer is formed on top of the circumferentially oriented layer except in a ring around, and very close to, the ONH. Therefore, the circumferentially oriented deeper layer outside this parapapillary ring is more difficult to observe with the limited penetration depth. Two millimeters was the furthest away from the ONH we could clearly observe the second circumferentially oriented layer underneath a radially oriented layer. Within this small region, our observations do not confirm a tangentially oriented fiber model, as proposed by Voorhees et al.,30 but rather show a varying orientation in depth. Voorhees et al.30 did not include the effect of a varying orientation in depth in their model. It remains unknown how the layered structure evolves when moving further away from the ONH. We presented a method that allows further study of glaucoma and myopia patients to compare their scleral structures with those of healthy volunteers.
Supplementary Material
Acknowledgments
The authors thank Masha Willemse for the drawing in Figure 5.
Supported from Oogfonds Nederland, Algemene Nederlandse Vereniging ter Voorkoming van Blindheid (ANVVB) (www.uitzicht.nl) and from the Dutch Technology Foundation STW (grant number 12822), which is part of the Netherlands Organisation for Scientific Research (NWO). This research has been financially supported by Heidelberg Engineering GmbH. The collaboration project was cofounded by the PPP Program Allowance made available by Health∼Holland, Top Sector Life Sciences and Health, to stimulate public–private partnerships.
Disclosure: J. Willemse, None; M.G.O. Gräfe, Imedos Systems (E); F.D. Verbraak, None; J.F. de Boer, NIDEK Inc. (P), Terumo Corporation (P), Ninepoint Medical (P), and Heidelberg Engineering (P, F)
References
- 1. Danford FL, Yan D, Dreier RA, Cahir TM, Girkin CA, Geest JPV. Differences in the region-and depth-dependent microstructural organization in normal versus glaucomatous human posterior sclerae. Invest Ophthalmol Vis Sci. 2013; 54: 7922–7932. [DOI] [PMC free article] [PubMed] [Google Scholar]
- 2. Jones H, Girard M, White N, et al.. Quantitative analysis of three-dimensional fibrillar collagen microstructure within the normal, aged and glaucomatous human optic nerve head. J R Soc Interface. 2015; 12: 20150066. [DOI] [PMC free article] [PubMed] [Google Scholar]
- 3. Coudrillier B, Pijanka JK, Jefferys JL, et al.. Glaucoma-related changes in the mechanical properties and collagen micro-architecture of the human sclera. PLoS One. 2015; 10: e0131396. [DOI] [PMC free article] [PubMed] [Google Scholar]
- 4. Markov PP, Eliasy A, Pijanka JK, et al.. Bulk changes in posterior scleral collagen microstructure in human high myopia. Mol. Vis. 2018; 24: 818. [PMC free article] [PubMed] [Google Scholar]
- 5. Gogola A, Jan N-J, Lathrop KL, Sigal IA. Radial and circumferential collagen fibers are a feature of the peripapillary sclera of human, monkey, pig, cow, goat, and sheep. Invest Ophthal Vis Sci. 2018; 59: 4763–4774. [DOI] [PMC free article] [PubMed] [Google Scholar]
- 6. Boote C, Sigal IA, Grytz R, Hua Y, Nguyen TD, Girard MJ. Scleral structure and biomechanics. Prog Retin Eye Res. 2020; 74: 100773. [DOI] [PMC free article] [PubMed] [Google Scholar]
- 7. Ho LC, Sigal IA, Jan N-J, et al.. Non-invasive MRI assessments of tissue microstructures and macromolecules in the eye upon biomechanical or biochemical modulation. Sci Rep. 2016; 6: 1–14. [DOI] [PMC free article] [PubMed] [Google Scholar]
- 8. Hee MR, Huang D, Swanson EA, Fujimoto JG. Polarization-sensitive low-coherence reflectometer for birefringence characterization and ranging. J Opt Soc Am B. 1992; 9: 903–908. [Google Scholar]
- 9. de Boer JF, Milner TE, van Gemert MJ, Nelson JS. Two-dimensional birefringence imaging in biological tissue by polarization-sensitive optical coherence tomography. Opt Lett. 1997; 22: 934–936. [DOI] [PubMed] [Google Scholar]
- 10. De Boer JF, Hitzenberger CK, Yasuno Y. Polarization sensitive optical coherence tomography–a review. Biomed Opt Express. 2017; 8: 1838–1873. [DOI] [PMC free article] [PubMed] [Google Scholar]
- 11. Baumann B. Polarization sensitive optical coherence tomography: a review of technology and applications. Appl Sci (Basel). 2017; 7: 474. [Google Scholar]
- 12. Gotzinger E, Pircher M, Baumann B, Hirn C, Vass C, Hitzenberger CK. Retinal nerve fiber layer birefringence evaluated with polarization sensitive spectral domain OCT and scanning laser polarimetry: a comparison. J Biophotonics. 2008; 1: 129–139. [DOI] [PubMed] [Google Scholar]
- 13. Cense B, Chen TC, Park BH, Pierce MC, de Boer JF. Thickness and birefringence of healthy retinal nerve fiber layer tissue measured with polarization-sensitive optical coherence tomography. Invest Ophthal Vis Sci. 2004; 45: 2606–2612. [DOI] [PubMed] [Google Scholar]
- 14. Yamanari M, Miura M, Makita S, Yatagai T, Yasuno Y. Phase retardation measurement of retinal nerve fiber layer by polarization-sensitive spectral-domain optical coherence tomography and scanning laser polarimetry. J Biomed Opt. 2008; 13: 014013. [DOI] [PubMed] [Google Scholar]
- 15. Klein Brink H, Van Blokland G. Birefringence of the human foveal area assessed in vivo with Mueller-matrix ellipsometry. J Opt Soc Am A. 1988; 5: 49–57. [DOI] [PubMed] [Google Scholar]
- 16. Elsner AE, Weber A, Cheney MC, VanNasdale DA. Spatial distribution of macular birefringence associated with the Henle fibers. Vis Res. 2008; 48: 2578–2585. [DOI] [PMC free article] [PubMed] [Google Scholar]
- 17. Braaf B, Vermeer KA, de Groot M, Vienola KV, de Boer JF. Fiber-based polarization-sensitive OCT of the human retina with correction of system polarization distortions. Biomed Opt Express. 2014; 5: 2736–2758. [DOI] [PMC free article] [PubMed] [Google Scholar]
- 18. Sugita M, Pircher M, Zotter S, et al.. Retinal nerve fiber bundle tracing and analysis in human eye by polarization sensitive OCT. Biomed Opt Express. 2015; 6: 1030–1054. [DOI] [PMC free article] [PubMed] [Google Scholar]
- 19. Shin A, Park J, Demer JL. Opto-mechanical characterization of sclera by polarization sensitive optical coherence tomography. J Biomech. 2018; 72: 173–179. [DOI] [PMC free article] [PubMed] [Google Scholar]
- 20. Baumann B, Rauscher S, Glösmann M, et al.. Peripapillary rat sclera investigated in vivo with polarization-sensitive optical coherence tomography. Invest Ophthal Vis Sci. 2014; 55: 7686–7696. [DOI] [PubMed] [Google Scholar]
- 21. Gräfe MGO, Gondre M, de Boer JF. Precision analysis and optimization in phase decorrelation OCT velocimetry. Biomed Opt Express. 2019; 10: 1297–1314. [DOI] [PMC free article] [PubMed] [Google Scholar]
- 22. Baumann B, Choi W, Potsaid B, Huang D, Duker JS, Fujimoto JG. Swept source/Fourier domain polarization sensitive optical coherence tomography with a passive polarization delay unit. Opt Express. 2012; 20: 10229–10241. [DOI] [PMC free article] [PubMed] [Google Scholar]
- 23. Lim Y, Hong YJ, Duan L, Yamanari M, Yasuno Y. Passive component based multifunctional Jones matrix swept source optical coherence tomography for Doppler and polarization imaging. Opt Lett. 2012; 37: 1958–1960. [DOI] [PubMed] [Google Scholar]
- 24. Willemse J, Gräfe MG, van de Kreeke JA, Feroldi F, Verbraak FD, de Boer JF. Optic axis uniformity as a metric to improve the contrast of birefringent structures and analyze the retinal nerve fiber layer in polarization-sensitive optical coherence tomography. Opt Lett. 2019; 44: 3893–3896. [DOI] [PubMed] [Google Scholar]
- 25. Villiger M, Lorenser D, McLaughlin RA, et al.. Deep tissue volume imaging of birefringence through fibre-optic needle probes for the delineation of breast tumour. Sci Rep. 2016; 6: 28771. [DOI] [PMC free article] [PubMed] [Google Scholar]
- 26. Fan C, Yao G.. Mapping local retardance in birefringent samples using polarization sensitive optical coherence tomography. Opt Lett. 2012; 37: 1415–1417. [DOI] [PubMed] [Google Scholar]
- 27. Li Q, Karnowski K, Noble PB, et al.. Robust reconstruction of local optic axis orientation with fiber-based polarization-sensitive optical coherence tomography. Biomed Opt Express. 2018; 9: 5437–5455. [DOI] [PMC free article] [PubMed] [Google Scholar]
- 28. Lujan BJ, Roorda A, Croskrey JA, et al.. Directional optical coherence tomography provides accurate outer nuclear layer and Henle fiber layer measurements. Retina (Philadelphia, PA). 2015; 35: 1511. [DOI] [PMC free article] [PubMed] [Google Scholar]
- 29. Baumann B, Baumann SO, Konegger T, et al.. Polarization sensitive optical coherence tomography of melanin provides intrinsic contrast based on depolarization. Biomed Opt Express. 2012; 3: 1670–1683. [DOI] [PMC free article] [PubMed] [Google Scholar]
- 30. Voorhees AP, Jan N-J, Hua Y, Yang B, Sigal IA. Peripapillary sclera architecture revisited: a tangential fiber model and its biomechanical implications. Acta Biomaterialia. 2018; 79: 113–122. [DOI] [PMC free article] [PubMed] [Google Scholar]
Associated Data
This section collects any data citations, data availability statements, or supplementary materials included in this article.


