

Abstract
Background
The association between alkaline phosphatase (ALP) and incident diabetes remains uncertain. Our study aimed to investigate the prospective relation of serum ALP with the risk of new-onset diabetes, and explore possible effect modifiers, in hypertensive adults.
Methods
A total 14,393 hypertensive patients with available ALP measurements and without diabetes and liver disease at baseline were included from the China Stroke Primary Prevention Trial (CSPPT). The primary outcome was new-onset diabetes, defined as physician-diagnosed diabetes or use of glucose-lowering drugs during follow-up, or fasting glucose ≥ 7.0 mmol/L at the exit visit. The secondary study outcome was new-onset impaired fasting glucose (IFG), defined as FG < 6.1 mmol/L at baseline and ≥ 6.1 but < 7.0 mmol/L at the exit visit.
Results
Over a median of 4.5 years follow-up, 1549 (10.8%) participants developed diabetes. Overall, there was a positive relation of serum ALP and the risk of new-onset diabetes (per SD increment, adjusted OR, 1.07; 95% CI: 1.01, 1.14) and new-onset IFG (per SD increment, adjusted OR, 1.07; 95% CI: 1.02, 1.14). Moreover, a stronger positive association between baseline ALP (per SD increment) with new-onset diabetes was found in participants with total homocysteine (tHcy) < 10 μmol/L (adjusted OR, 1.24; 95% CI: 1.10, 1.40 vs. ≥ 10 μmol/L: adjusted OR, 1.03; 95% CI: 0.96, 1.10; P-interaction = 0.007) or FG ≥ 5.9 mmol/L (adjusted OR, 1.16; 95% CI: 1.07, 1.27 vs. < 5.9 mmol/L: adjusted OR, 1.00; 95% CI: 0.93, 1.08; P-interaction = 0.009)
Conclusions
In this non-diabetic, hypertensive population, higher serum ALP was significantly associated with the increased risk of new-onset diabetes, especially in those with lower tHcy or higher FG levels.
Clinical Trial Registration-URL Trial registration: NCT00794885 (clinicaltrials.gov). Retrospectively registered November 20, 2008.
Keywords: Alkaline phosphatase, New-onset diabetes, New-onset impaired fasting glucose, Total homocysteine, Hypertension
Background
Diabetes mellitus has been a public issue with increasing prevalence worldwide [1, 2]. The global diabetes prevalence in 2019 is estimated to be 9.3% (463 million people), projected to reach 10.2% (578 million) by 2030 and 10.9% (700 million) by 2045 [1]. Diabetes result in many complications, including cardiovascular disease (CVD) and chronic kidney diseases (CKD), amputation and vision problems [3, 4]. The identification of more modifiable risk factors may possibly reduce the huge burden of diabetes and its associated complications by leading to early detection and prevention.
Prior studies have reported that liver function may be associated with diabetes [5, 6]. Alkaline phosphatase (ALP) is a generally accepted clinical marker of hepatic or bone disease [7]. It had been showed that elevated ALP acted as a prognostic indicator of decreased survival in diabetic patients with acute myocardial infarction (MI), possibly in association to decreased renal function in male patients [8]. At the same time, the combined effect of vascular calcification (VC) and higher ALP was associated with a greater risk of cardiovascular events and death, and high serum ALP increased the risk associated with VC in end-stage kidney disease patients starting dialysis [9]. Moreover, in a nest case–control study, ALP in type 2 diabetes seemed to be associated with CVD risk and stroke incidence in men, but with borderline significance [10]. However, only a few previous prospective studies [11–14] have been carried out to evaluate the relation of ALP and incident diabetes, and reported inconsistent results. In addition, although hypertension is one of the important risk factors for diabetes [3, 15, 16], few related studies has been conducted in hypertensive patients. More importantly, potential modifiers on the association between ALP and incident diabetes have not been comprehensively examined in previous studies.
This study was motivated by the limited and inconclusive evidence regarding the ALP levels and incident diabetes, and a special opportunity to address this question in a large, randomized controlled trial with regular antihypertensive treatments, BP measurements and diabetes status reports. Specifically, using data from China Stroke Primary Prevention Trial (CSPPT) [17], we aimed to investigate the prospective association between serum ALP and new-onset diabetes among hypertensive adults, and to examine possible modifiers on the association.
Methods
Study design and participants
The study design, methods and major results of the CSPPT (ClinicalTrials.gov identifier NCT00794885) have been reported elsewhere in detail [17–22]. Briefly, the CSPPT was a multi-community, randomized, double-blind, controlled trial conducted from May 19, 2008 to August 24, 2013 in 32 communities in Anhui and Jiangsu provinces in China. Eligible participants were men and women aged 45–75 years who had hypertension, defined as seated, resting systolic blood pressure (SBP) ≥ 140 mmHg or diastolic blood pressure (DBP) ≥ 90 mmHg at both the screening and recruitment visit, or who were on anti-hypertensive medication. The major exclusion criteria included history of physician-diagnosed stroke, myocardial infarction (MI), heart failure, post-coronary revascularization, and/or congenital heart disease, and/or current supplementation by folic acid, vitamin B12 or vitamin B6.
In the CSPPT, a total of 20,702 eligible participants were enrolled. Our current study is a post-hoc analysis of the CSPPT, including a total of 14,393 participants with complete major data and who were free of diabetes [physician-diagnosed diabetes or using glucose-lowering drugs or fasting glucose (FG) was < 7.0 mmol/L (126 mg/dL)], as well as without liver disease (self-reported chronic hepatitis, hepatic adipose infiltration, or cirrhosis) at baseline (Fig. 1).
Fig. 1.

Flow chart of the participants
Intervention and follow-up
Eligible participants were randomized to receive a daily oral dose of 1 tablet containing 10 mg enalapril and 0.8 mg folic acid (single pill combination, the enalapril-folic acid group) or one tablet containing 10 mg enalapril only (the enalapril-only group).
Participants were scheduled for follow-up every 3 months. At each follow-up visit, BP was measured; study drug compliance, concomitant medication use, adverse events and possible endpoint events were documented by trained research staff and physicians.
Laboratory assessment
Serum fasting ALP, gamma glutamyl transpeptidase (GGT), alanine aminotransferase (ALT), aspartate aminotransferase (AST), total homocysteine (tHcy), creatinine, lipids and fasting glucose (FG) were measured with the use of automatic clinical analyzers (Beckman Coulter) at the core laboratory of the National Clinical Research Center for Kidney Disease, Nanfang Hospital, Guangzhou, China. Serum folate at baseline were measured by a commercial lab using a chemiluminescent immunoassay (New Industrial, Shenzhen, China). Estimated glomerular filtration rate (eGFR) was calculated using the Chronic Kidney Disease Epidemiology Collaboration (CKD-EPI) equation [23].
Study outcomes
The primary study outcome was new-onset diabetes, defined as physician-diagnosed diabetes, or use of glucose-lowering drugs during follow-up, or new onset FG ≥ 7.0 mmol/L (126 mg/dL) at the exit visit. In China, the clinical diagnosis and treatment of diabetes used the same criteria according to the China guideline for diabetes [24, 25].
The secondary study outcome was new-onset impaired fasting glucose (IFG), defined as FG < 6.1 mmol/L (110 mg/dL) at baseline and ≥ 6.1 mmol/L but < 7.0 mmol/L at the exit visit. The analysis of new-onset IFG included subjects whose FG < 6.1 mmol/L and without new-onset diabetes during the follow-up.
Statistical analysis
Baseline characteristics are presented as means ± standard deviations (SDs) or medians [interquartile range (IQR)] for continuous variables and proportions for categorical variables. Statistical significance of differences in baseline characteristics was assessed in accordance with baseline serum ALP quartiles (< 79, 79 to < 96, 96 to < 116, and ≥ 116 IU/L) using ANOVA tests, signed rank tests or chi-square tests, accordingly.
We first explored the association between serum ALP and new-onset diabetes using thin plate regression splines in generalized additive models implemented by the R package mgcv. Then multivariable logistic regression models [odds ratio (OR) and 95% confidence interval (CI)] were used to evaluate relation of serum ALP with new-onset diabetes and new-onset IFG, without and with adjustment for age, sex, study center, treatment group, body mass index (BMI), smoking, alcohol drinking, family history of diabetes, SBP, FG, total cholesterol (TC), triglycerides (TG), eGFR, folate, tHcy and the use of antihypertensive drugs at baseline, as well as time-averaged SBP during the treatment period. As additional exploratory analyses, possible modifications on the association between serum ALP and new-onset diabetes were also evaluated by stratified analyses and interaction testing.
A two-tailed P < 0.05 was considered statistically significant in all analyses. R software, version 3.6.3 (https://www.R-project.org/) was used to perform all statistical analyses.
Results
Study participants and baseline characteristics
In this study, a total of 14,393 participants with complete major data and without diabetes and liver disease at baseline, were included in the final analyses (Fig. 1).
Baseline characteristics of participants by baseline ALP quartiles are presented in Table 1. The mean and median serum ALP levels were 100 IU/L (SD, 30.5) and 96 IU/L, respectively. Participants with higher ALP levels were older and more likely to be female; had higher SBP, TG, high-density lipoprotein (HDL) cholesterol, FG, folate levels at baseline and time-averaged on-treatment SBP during the treatment period; lower BMI, DBP, TC, tHcy levels at baseline and time-averaged on-treatment DBP during the treatment period; and lower frequency in use of antihypertensive drugs and antiplatelet drugs at baseline, as wells as lower frequency of current smoking, alcohol drinking and family history of diabetes (Table 1).
Table 1.
Characteristics of the study participants by baseline serum alkaline phosphatase (ALP) quartiles
| Variables* | Serum ALP, IU/L | P value† | |||
|---|---|---|---|---|---|
| Q1 (< 79) | Q2 (79- < 96) | Q3 (96- < 116) | Q4 (≥ 116) | ||
| N | 3486 | 3623 | 3577 | 3707 | |
| Age, yr | 58.3 ± 8.1 | 59.7 ± 7.5 | 60.7 ± 7.1 | 61.3 ± 6.6 | < 0.001 |
| Male, no. (%) | 1773 (50.9) | 1609 (44.4) | 1377 (38.5) | 1059 (28.6) | < 0.001 |
| Body mass index, kg/m2 | 25.4 ± 3.6 | 25.1 ± 3.6 | 24.8 ± 3.6 | 24.4 ± 3.7 | < 0.001 |
| Current smoking, no. (%) | 963 (27.6) | 938 (25.9) | 810 (22.6) | 664 (17.9) | < 0.001 |
| Current drinking, no. (%) | 1143 (32.8) | 949 (26.2) | 778 (21.8) | 567 (15.3) | < 0.001 |
| Family history of diabetes, no. (%) | 151 (4.3) | 145 (4.0) | 125 (3.5) | 116 (3.1) | 0.036 |
| Enalapril group, no. (%) | 1727 (49.5) | 1838 (50.7) | 1800 (50.3) | 1850 (49.9) | 0.769 |
| BP, mmHg | |||||
| SBP at baseline | 165.6 ± 20.5 | 167.2 ± 20.4 | 167.5 ± 20.5 | 168.2 ± 20.3 | < 0.001 |
| DBP at baseline | 95.4 ± 11.9 | 94.5 ± 11.9 | 94.3 ± 11.8 | 93.3 ± 11.7 | < 0.001 |
| Time-averaged SBP | 138.4 ± 10.6 | 139.1 ± 10.3 | 138.8 ± 10.6 | 139 ± 10.6 | 0.022 |
| Time-averaged DBP | 84.1 ± 7.2 | 83.3 ± 7.2 | 82.6 ± 7.0 | 81.7 ± 7.3 | < 0.001 |
| Laboratory results, mmol/L | |||||
| Total cholesterol | 5.6 ± 1.1 | 5.6 ± 1.1 | 5.5 ± 1.1 | 5.3 ± 1.1 | < 0.001 |
| Triglycerides | 1.6 ± 1.9 | 1.6 ± 0.9 | 1.6 ± 0.9 | 1.7 ± 0.9 | < 0.001 |
| HDL cholesterol | 1.3 ± 0.4 | 1.3 ± 0.4 | 1.4 ± 0.4 | 1.4 ± 0.4 | < 0.001 |
| Fasting glucose | 5.5 ± 0.7 | 5.4 ± 0.7 | 5.4 ± 0.7 | 5.3 ± 0.7 | < 0.001 |
| eGFR, mL/min1.73/m2 | 93.7 ± 13.1 | 93.8 ± 12.8 | 93.3 ± 12.1 | 93.6 ± 12.2 | 0.455 |
| Folate, ng/mL | 7.8 ± 3.3 | 8.2 ± 3.8 | 8.5 ± 3.8 | 9.3 ± 4.4 | < 0.001 |
| Total homocysteine, μmol/L | 14.9 ± 9.9 | 14.5 ± 8.8 | 14.5 ± 8.0 | 14.1 ± 6.9 | < 0.001 |
| Alkaline phosphatase, IU/L | 66.1 ± 10.4 | 87.1 ± 4.8 | 104.9 ± 5.8 | 140.0 ± 24.1 | < 0.001 |
| Aspartate transaminase, IU/L | 21.4(18.0,26.0) | 22.7(19.2,27.8) | 24.0(20.1,29.5) | 26.7(21.9,33.1) | < 0.001 |
| Alanine transaminase, IU/L | 11.0(8.0,14.1) | 12.0(9.0,16.0) | 12.8(10.0,17.0) | 14.0(11.0,19.0) | < 0.001 |
| Gamma glutamyl transpeptidase, IU/L | 19.1(14.3,27.6) | 19.3(14.6,27.5) | 19.3(14.6,28.1) | 19.9(14.9,28.7) | 0.005 |
| Medication use, no. (%) | |||||
| Antihypertensive drugs | 1794 (51.5) | 1708 (47.1) | 1621 (45.3) | 1531 (41.3) | < 0.001 |
| Lipid lowering drugs | 37 (1.1) | 26 (0.7) | 19 (0.5) | 25 (0.7) | 0.065 |
| Antiplatelet drugs | 161 (4.6) | 109 (3.0) | 102 (2.9) | 71 (1.9) | < 0.001 |
ALP serum alkaline phosphatase, DBP diastolic blood pressure, eGFR estimated glomerular filtration rate, HDL high-density lipoprotein, SBP systolic blood pressure
*Continuous variables are presented as Mean ± SD or IQR (25, 75th), categorical variables are presented as n (%)
†Difference between any 2 groups
In addition, during the treatment period, participants with higher ALP levels had higher frequency in use of calcium channel blockers; lower frequency in use of diuretics and antiplatelet drugs. (Table 2).
Table 2.
Concomitant medication usage during the treatment period by baseline serum alkaline phosphatase quartiles
| Variables* | Baseline serum alkaline phosphatase quartiles, IU/L | P value† | |||
|---|---|---|---|---|---|
| Q1 (< 79) | Q2 (79- < 96) | Q3 (96- < 116) | Q4 (≥ 116) | ||
| N | 3486 | 3623 | 3577 | 3707 | |
| Antihypertensive drugs | |||||
| Calcium channel blockers | 2804 (80.4) | 2954 (81.5) | 2958 (82.7) | 3110 (83.9) | < 0.001 |
| Diuretics | 2011 (57.7) | 2028 (56.0) | 1901 (53.1) | 1750 (47.2) | < 0.001 |
| Lipid-lowering drugs | 5 (0.1) | 3 (0.1) | 6 (0.2) | 5 (0.1) | 0.790 |
| Antiplatelet drugs | 33 (0.9) | 35 (1.0) | 26 (0.7) | 17 (0.5) | 0.045 |
*Regular concomitant medication usage was defined as 180 or more cumulative days of taking the drug of interest
†Difference between any 2 groups
Association between baseline serum ALP and study outcomes
During median follow-up of 4.5 years (IQR, 4.2–4.7 years), 1549 (10.8%) participants developed new-onset diabetes. In our current study, a total of 1549 participants developed diabetes. Of these, 156 were those with physician-diagnosed diabetes, 41 reported with the use of glucose-lowering drugs during follow-up, and 1448 had a new-onset FG ≥ 7.0 mmol/L at the exit visit. Some of the patients met at least two of the above three criteria.
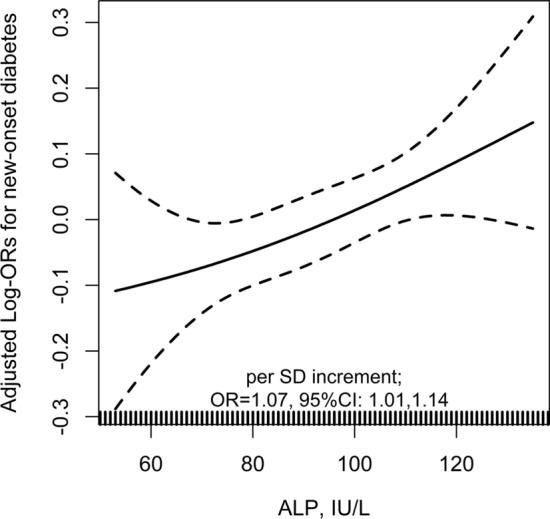
Overall, there was a positive relation of serum ALP and the risk of new-onset diabetes (per SD increment, adjusted OR, 1.07; 95% CI: 1.01, 1.14) (Fig. 2a), and new-onset IFG (per SD increment, adjusted OR, 1.07; 95% CI: 1.02, 1.14) (Fig. 2b). Consistently, compared with participants with serum ALP < 96 IU/L (median), significantly higher risks of new-onset diabetes (adjusted OR, 1.13; 95% CI: 1.00, 1.27) and new-onset IFG (adjusted OR, 1.13; 95% CI: 1.02, 1.27) were found in those with serum ALP ≥ 96 IU/L (Table 3). Accordingly, we also found a positive association between serum ALP and change in FG levels (FG level at exit visit minus that at baseline; per SD increment, adjusted β, 0.03 mmol/L; 95% CI: 0.01, 0.06) (Fig. 3).
Fig. 2.

The association between baseline serum alkaline phosphatase (ALP) and new-onset diabetes a and new-onset impaired fasting glucose (IFG) b in hypertensive adults. Adjusted for age, sex, study center, treatment group, body mass index (BMI), smoking, alcohol drinking, family history of diabetes, SBP, fasting glucose (FG), total cholesterol (TC), triglycerides (TG), eGFR, folate, total homocysteine and the use of antihypertensive drugs at baseline, as well as time-averaged SBP during the treatment period. Subjects with baseline FG < 6.1 mmol/L and without new-onset diabetes during follow-up were included in the analysis for new-onset IFG
Table 3.
The association between baseline serum alkaline phosphatase (ALP) and study outcomes
| ALP, IU/L | N | No. of events (%) | Crude model | Adjusted model* | ||
|---|---|---|---|---|---|---|
| OR (95% CI) | P value‡ | OR (95% CI) | P value‡ | |||
| New-onset diabetes | ||||||
| Continuous, per SD (30.5 IU/L) increment | 14,393 | 1549 (10.8) | 1.07 (1.02,1.13) | 0.007 | 1.07 (1.01,1.14) | 0.027 |
| Quartiles | ||||||
| Q1 (< 79) | 3486 | 343 (9.8) | 1.00 (ref.) | 1.00 (ref.) | ||
| Q2 (79- < 96) | 3623 | 381 (10.5) | 1.08 (0.92,1.26) | 0.346 | 1.09 (0.93,1.28) | 0.291 |
| Q3 (96- < 116) | 3577 | 390 (10.9) | 1.12 (0.96,1.31) | 0.143 | 1.14 (0.96,1.34) | 0.130 |
| Q4 (≥ 116) | 3707 | 435 (11.7) | 1.22 (1.05,1.42) | 0.010 | 1.24 (1.05,1.48) | 0.013 |
| P for trend | 0.009 | 0.013 | ||||
| Categories | ||||||
| Q1-2 (< 96) | 7109 | 724 (10.2) | 1.00 (ref.) | 1.00 (ref.) | ||
| Q3-4 (≥ 96) | 7284 | 825 (11.3) | 1.13 (1.01,1.25) | 0.027 | 1.13 (1.00,1.27) | 0.046 |
| New-onset IFG† | ||||||
| Continuous, per SD (30.8 IU/L) increment | 11,062 | 1876 (17.0) | 1.04 (0.99,1.09) | 0.105 | 1.07 (1.02,1.14) | 0.012 |
| Quartiles | ||||||
| Q1 (< 79) | 2629 | 446 (17.0) | 1.00 (ref.) | 1.00 (ref.) | ||
| Q2 (79- < 96) | 2788 | 446 (16.0) | 0.93 (0.81,1.08) | 0.337 | 0.94 (0.81,1.09) | 0.415 |
| Q3 (96- < 117) | 2825 | 487 (17.2) | 1.02 (0.89,1.17) | 0.788 | 1.06 (0.91,1.23) | 0.431 |
| Q4 (≥ 117) | 2820 | 497 (17.6) | 1.05 (0.91,1.21) | 0.520 | 1.14 (0.97,1.34) | 0.101 |
| P for trend | 0.302 | 0.042 | ||||
| Categories | ||||||
| Q1-2 (< 96) | 5417 | 892(16.5) | 1.00 (ref.) | 1.00 (ref.) | ||
| Q3-4 (≥ 96) | 5645 | 984 (17.4) | 1.07 (0.97,1.18) | 0.177 | 1.13 (1.02,1.27) | 0.024 |
ALP serum alkaline phosphatase, CI confidence interval, eGFR estimated glomerular filtration rate, IFG impaired fasting glucose, OR odds ratio, SD standard deviations, SBP systolic blood pressure
*Adjusted for age, sex, study center, treatment group, body mass index (BMI), smoking, alcohol drinking, family history of diabetes, SBP, fasting glucose (FG), total cholesterol (TC), triglycerides (TG), eGFR, folate, total homocysteine and the use of antihypertensive drugs at baseline, as well as time-averaged SBP during the treatment period
†Subjects with baseline FG < 6.1 mmol/L and without new-onset diabetes during follow-up were included in the analysis
‡In comparison with the first quartile
Fig. 3.
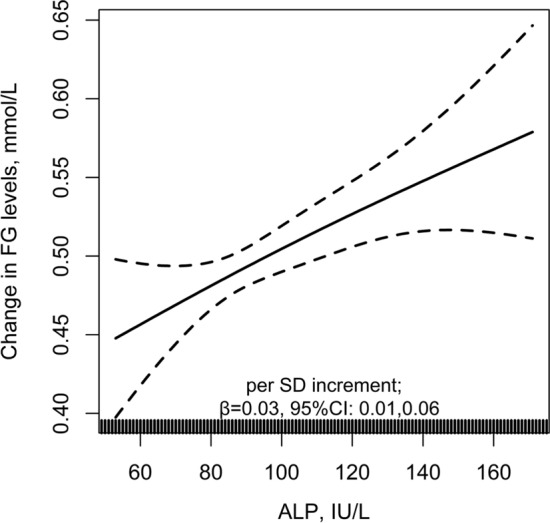
The association between baseline serum alkaline phosphatase (ALP) and change in FG levels. Adjusted for age, sex, study center, treatment group, body mass index (BMI), smoking, alcohol drinking, family history of diabetes, SBP, fasting glucose (FG), total cholesterol (TC), triglycerides (TG), eGFR, folate, total homocysteine and the use of antihypertensive drugs at baseline, as well as time-averaged SBP during the treatment period. The analysis was only included subjects without physician-diagnosed diabetes, or use of glucose-lowering drugs during follow-up
Similar results were also found when estimating the association between baseline ALP and new-onset diabetes with risk ratio (RR) (per SD increment; adjusted RR, 1.06; 95% CI: 1.00, 1.12) (Table 4), or in participants with a normal range of baseline serum ALP (20–140 IU/L) [26] levels (per SD increment; adjusted OR, 1.07; 95% CI: 1.01, 1.14) (Fig. 4). More importantly, further adjustment for use of calcium channel blockers, diuretics and antiplatelet drugs during the treatment period (per SD increment; adjusted OR, 1.07; 95% CI: 1.01, 1.14) (Table 5), or other liver enzymes, including GGT, ALT, AST (per SD increment; adjusted OR, 1.06; 95% CI: 1.00, 1.13) (Table 6) did not substantially change the results.
Table 4.
Estimating the association between baseline serum alkaline phosphatase (ALP) and new-onset diabetes evaluated with risk ratio (RR)
| ALP, IU/L | N | No. of events (%) | Crude model | Adjusted model* | ||
|---|---|---|---|---|---|---|
| RR (95% CI) | P value† | RR (95% CI) | P value† | |||
| New-onset diabetes | ||||||
| Continuous, per SD (30.5 IU/L) increment | 14,393 | 1549 (10.8) | 1.06 (1.01,1.12) | 0.011 | 1.06 (1.00,1.12) | 0.034 |
| Quartiles | ||||||
| Q1 (< 79) | 3486 | 343 (9.8) | 1.00 (ref.) | 1.00 (ref.) | ||
| Q2 (79- < 96) | 3623 | 381 (10.5) | 1.07 (0.93,1.24) | 0.372 | 1.09 (0.94,1.26) | 0.274 |
| Q3 (96- < 116) | 3577 | 390 (10.9) | 1.12 (0.97,1.29) | 0.166 | 1.12 (0.96,1.30) | 0.143 |
| Q4 (≥ 116) | 3707 | 435 (11.7) | 1.19 (1.04,1.38) | 0.015 | 1.21 (1.03,1.41) | 0.018 |
| P for trend | 0.013 | 0.019 | ||||
ALP serum alkaline phosphatase, CI confidence interval, eGFR estimated glomerular filtration rate, RR risk ratio, SD standard deviations, SBP systolic blood pressure
*Adjusted for age, sex, study center, treatment group, body mass index (BMI), smoking, alcohol drinking, family history of diabetes, SBP, fasting glucose (FG), total cholesterol (TC), triglycerides (TG), eGFR, folate, total homocysteine and the use of antihypertensive drugs at baseline, as well as time-averaged SBP during the treatment period
†In comparison with the first quartile
Fig. 4.
The association between baseline alkaline phosphatase (ALP) and new-onset diabetes in normal ALP levels (20–140 IU/L). Adjusted for age, sex, study center, treatment group, body mass index (BMI), smoking, alcohol drinking, family history of diabetes, SBP, fasting glucose (FG), total cholesterol (TC), triglycerides (TG), eGFR, folate, total homocysteine and the use of antihypertensive drugs at baseline, as well as time-averaged SBP during the treatment period
Table 5.
The association between baseline serum alkaline phosphatase (ALP) and new-onset diabetes, with further adjustment for the use of calcium channel blockers, diuretics and antiplatelet drugs during the treatment period
| ALP, IU/L | N | No. of events (%) | Crude model | Adjusted model* | ||
|---|---|---|---|---|---|---|
| OR (95% CI) | P value† | OR (95% CI) | P value† | |||
| Continuous, per SD increment | 14,393 | 1549 (10.8) | 1.07 (1.02,1.13) | 0.007 | 1.07 (1.01,1.14) | 0.026 |
| Quartiles | ||||||
| Q1 (< 79) | 3486 | 343 (9.8) | 1.00 (ref.) | 1.00 (ref.) | ||
| Q2 (79- < 96) | 3623 | 381 (10.5) | 1.08 (0.92,1.26) | 0.346 | 1.09 (0.93,1.28) | 0.290 |
| Q3 (96- < 116) | 3577 | 390 (10.9) | 1.12 (0.96,1.31) | 0.143 | 1.14 (0.96,1.34) | 0.127 |
| Q4 (≥ 116) | 3707 | 435 (11.7) | 1.22 (1.05,1.42) | 0.010 | 1.24 (1.05,1.48) | 0.013 |
| P for trend | 0.009 | 0.013 | ||||
ALP serum alkaline phosphatase, CI confidence interval, eGFR estimated glomerular filtration rate, OR odds ratio, SD standard deviations, SBP systolic blood pressure
*Adjusted for age, sex, study center, treatment group, body mass index (BMI), smoking, alcohol drinking, family history of diabetes, SBP, fasting glucose (FG), total cholesterol (TC), triglycerides (TG), eGFR, folate, total homocysteine and the use of antihypertensive drugs at baseline, as well as time-averaged SBP, the use of calcium channel blockers, diuretics and antiplatelet drugs during the treatment period
†In comparison with the first quartile
Table 6.
The association between baseline serum alkaline phosphatase (ALP) and new-onset diabetes, with further adjustment for AST, ALT and GGT
| ALP, IU/L | N | No. of events (%) | Crude model | Adjusted model* | ||
|---|---|---|---|---|---|---|
| OR (95% CI) | P value† | OR (95% CI) | P value† | |||
| Continuous, per SD increment | 14,393 | 1549 (10.8) | 1.07 (1.02,1.13) | 0.007 | 1.06 (1.00,1.13) | 0.045 |
| Quartiles | ||||||
| Q1 (< 79) | 3486 | 343 (9.8) | 1.00 (ref.) | 1.00 (ref.) | ||
| Q2 (79- < 96) | 3623 | 381 (10.5) | 1.08 (0.92,1.26) | 0.346 | 1.08 (0.92,1.28) | 0.327 |
| Q3 (96- < 116) | 3577 | 390 (10.9) | 1.12 (0.96,1.31) | 0.143 | 1.13 (0.96,1.33) | 0.148 |
| Q4 (≥ 116) | 3707 | 435 (11.7) | 1.22 (1.05,1.42) | 0.010 | 1.23 (1.03,1.46) | 0.020 |
| P for trend | 0.009 | 0.019 | ||||
ALP serum alkaline phosphatase, ALT alanine aminotransferase, AST aspartate aminotransferase, CI confidence interval, eGFR estimated glomerular filtration rate, GGT gamma glutamyl transpeptidase, OR odds ratio, SD standard deviations, SBP systolic blood pressure
*Adjusted for age, sex, study center, treatment group, body mass index (BMI), smoking, alcohol drinking, family history of diabetes, SBP, fasting glucose (FG), total cholesterol (TC), triglycerides (TG), eGFR, folate, total homocysteine and the use of antihypertensive drugs, AST, ALT, GGT at baseline, as well as time-averaged SBP during the treatment period
†In comparison with the first quartile
Association between change in serum ALP and new-onset diabetes
In order to further examine the association between serum ALP and new-onset diabetes, we investigated the relation of change in ALP with new-onset diabetes. We categorized the participants into four groups according to median of baseline serum ALP (96 IU/L): persistently low ALP levels (< 96 IU/L at both baseline and exit visit), persistently high ALP levels (≥ 96 IU/L at both baseline and exit visit), decreased ALP levels (≥ 96 IU/L at baseline and < 96 IU/L at exit visit), and increased ALP levels (< 96 IU/L at baseline and ≥ 96 IU/L at exit visit).
The incidence rates of new-onset diabetes in participants with persistently low ALP levels, persistently high ALP levels, decreased ALP levels, and increased ALP levels were 9.0, 12.6, 8.6 and 16.3%, respectively. Comparted with those with persistently low ALP levels, a significantly higher risk of new-onset diabetes was found in participants with persistently high ALP levels (adjusted OR, 1.57; 95% CI: 1.36, 1.81) or increased ALP levels (adjusted OR, 1.97; 95% CI: 1.61, 2.42); however, the adjusted odds ratio (95% CI) for those decreased ALP levels with was 0.96 (0.81, 1.14) (Table 7).
Table 7.
The association between change in serum alkaline phosphatase (ALP) and new-onset diabetes
| ALP, IU/L | N | No. of events (%) | Crude model | Adjusted model* | ||
|---|---|---|---|---|---|---|
| OR (95% CI) | P value‡ | OR (95% CI) | P value‡ | |||
| Persistently low levels† | 6087 | 549 (9.0) | 1.00 (ref.) | 1.00 (ref.) | ||
| Decreased levels | 2744 | 237 (8.6) | 0.95 (0.81,1.12) | 0.559 | 0.96 (0.81,1.14) | 0.653 |
| Increased levels | 993 | 162 (16.3) | 1.97 (1.63,2.38) | < 0.001 | 1.97 (1.61,2.42) | < 0.001 |
| Persistently high levels | 4511 | 569 (12.6) | 1.46 (1.29,1.65) | < 0.001 | 1.57 (1.36,1.81) | < 0.001 |
ALP serum alkaline phosphatase, CI confidence interval, eGFR estimated glomerular filtration rate, GGT gamma glutamyl transpeptidase, OR odds ratio, SBP systolic blood pressure
*Adjusted for age, sex, study center, treatment group, body mass index (BMI), smoking, alcohol drinking, family history of diabetes, SBP, fasting glucose (FG), total cholesterol (TC), triglycerides (TG), eGFR, folate, total homocysteine and the use of antihypertensive drugs at baseline, as well as time-averaged SBP during the treatment period
†We categorized the participants into four groups according to median of baseline serum ALP (96 IU/L): persistently low ALP levels (< 96 IU/L at both baseline and exit visit), persistently high ALP levels (≥ 96 IU/L at both baseline and exit visit), decreased ALP levels (≥ 96 IU/L at baseline and < 96 IU/L at exit visit), and increased ALP levels (< 96 IU/L at baseline and ≥ 96 IU/L at exit visit)
‡In comparison with persistently low ALP levels
Stratified analyses
In the stratified analyses, a stronger positive association between baseline ALP with new-onset diabetes was found in participants with tHcy < 10 μmol/L (per SD increment; adjusted OR, 1.24; 95% CI: 1.10, 1.40 vs. ≥ 10 μmol/L: adjusted OR, 1.03; 95% CI: 0.96, 1.10; P-interaction = 0.007) and FG ≥ 5.9 mmol/L (quartile 3) (per SD increment; adjusted OR, 1.16; 95% CI: 1.07, 1.27 vs. < 5.9 mmol/L: adjusted OR, 1.00; 95% CI: 0.93, 1.08; P-interaction = 0.009) (Fig. 5).
Fig. 5.

The association between baseline serum alkaline phosphatase (ALP, per SD increment) and new-onset diabetes in various groups. Adjusted for age, sex, study center, treatment group, body mass index (BMI), smoking, alcohol drinking, family history of diabetes, SBP, fasting glucose (FG), total cholesterol (TC), triglycerides (TG), eGFR, folate, total homocysteine and the use of antihypertensive drugs at baseline, as well as time-averaged SBP during the treatment period, if not be stratified
However, other variables, including sex (male vs. female), age (< 60 vs. ≥ 60 years), BMI (< 24 vs. ≥ 24 kg/m2), treatment group (enalapril vs. enalapril-folic acid), current smoking (no vs. yes), current alcohol drinking (no vs. yes), SBP (< 160 vs. ≥ 160 mmHg), TC levels (< 5.2 vs. ≥ 5.2 mmol/L) at baseline, as well as time-averaged SBP (< 140 vs. ≥ 140 mmHg), calcium channel blockers usage (no vs. yes) and diuretics usage (no vs. yes) over the trial period, did not significantly modified the association between baseline serum ALP and new-onset diabetes (all P-interactions > 0.05) (Fig. 5).
Discussion
Our study demonstrated that there was a positive association between baseline serum ALP levels and new-onset diabetes, independent of other liver aminotransferases, treated BP and other important confounders, among hypertensive patients. Moreover, our study expanded the results of previous studies by demonstrating that the positive association between baseline serum ALP levels and new-onset diabetes was more pronounced in participants with lower tHcy or higher FG levels.
Comparisons with previous studies
Previous studies have linked serum ALP levels and the risk of diabetes, but reported controversial results. In a case–control study, Malo MS reported that high intestinal alkaline phosphatase (IAP) levels appeared to be protective against diabetes irrespective of obesity [27]. However, Nannipieri M et al. (n = 1441) [11], Nakanishi N et al. (n = 3260) [12], and Hanley AJ et al. (n = 906) [13] found that there was no significant association between ALP and incident diabetes. Moreover, a study conducted in Taiwan [14], including 132,377 non-diabetic individuals, showed that higher ALP level was significantly related to increased risk of diabetes. Of note, this study did not consider the effect of some major risk factors for diabetes, such as initial FG levels and the concomitant medications, and therefore, could not provide an accurate measurement of the association between ALP and incident diabetes. In addition, a recent mendelian randomization study demonstrated that there was a modest negative effect of genetically predicted ALP on type 2 diabetes (OR, 0.91; 95% CI: 0.86, 0.97) [28]. At the same time, another mendelian randomization study suggested that ALP was not associated with the risk of diabetes [29]. It must be pointed out that both studies [28, 29] only included European origin participants whose genetic background may be different with other population. Overall, to data, the association between ALP and incident diabetes remains uncertain. The explanations for these discrepant results might be due to differences in study population characteristics and/or sample sizes. More importantly, no previous study has comprehensively investigated the modifiers on the relation of ALP with new-onset diabetes.
Study strengths and possible mechanisms
Our study provided a rare opportunity to evaluate the temporal and dose–response relation of serum ALP with new-onset diabetes in hypertension adults, with a comprehensive adjustment and stratified analysis for almost all the pertinent clinical information and laboratory measurements. This is the first study of this kind in a hypertensive population. Our study has made some new contributions to the field. First, we demonstrated that higher serum ALP associated with increased new-onset diabetes in hypertensive patients, independent of other liver enzymes, treated BP and traditional or suspected risk factors. Our study findings are biological plausible based on available literature, although the potential mechanisms by which serum ALP increases diabetes risk remains to be delineated. (1) ALP was reported to contribute to vascular calcification [30], which linked to insulin resistance, subsequently leading to the development of diabetes [31]. Animal experiments showed that ALP upregulation was demonstrated in the vascular wall of diabetic rat and mouse models of vascular calcification [32]. (2) Higher serum ALP was associated with increased risk of endothelial dysfunction, a process related to insulin resistance, an initial process to diabetes [33]. This was explained that ALP could reduce nitric oxide (NO) bioavailability by inhibiting tyrosine kinase activity into endothelial cells [34], leading to the consequent impairment of endothelial NO synthase function [35]. (3) Higher serum ALP levels had been reported to be associated with increased inflammation status in CKD patients or general population [36, 37]. Notably, both endothelial dysfunction [38, 39] and chronic inflammation [40, 41] has been considered as the early events in the development of the diabetes. Taken together, the aforementioned biological functions of ALP may be in part underlying our observed positive association between ALP and incident diabetes. However, more mechanistic studies are still needed.
Second, our results showed that tHcy and FG levels significantly modified the association between serum ALP and the risk of new-onset diabetes. A stronger association was found in those with lower tHcy (< 10 μmol/L) or higher FG (≥ 5.9 mmol/L) levels at baseline. The higher FG levels may partially represent the abnormal glucose metabolic state, due to the impairment of pancreatic alpha and beta cell function and the induced impaired insulin secretion [42, 43]. This population usually had a significantly increased risk of diabetes [44]. Since higher ALP was mainly associated with insulin resistance, our results suggested that increased ALP and higher FG levels may synergistically increase the risk of incident diabetes. On the other hand, it had been reported that elevated tHcy could also promote the calcification of vessels [45], and was related to endothelial dysfunction, inflammation and oxidative stress [15, 46, 47]. It seemed that elevated tHcy and ALP levels may share some common pathway in the development of diabetes. As such, the detrimental effects of higher tHcy levels may attenuate the positive relation of serum ALP levels with the risk of diabetes. Our studies suggested that the combination of optimal ALP, tHcy and FG levels may be a better strategy for the primary prevention of diabetes in hypertensive adults. However, further studies are warranted to verify this hypothesis and further examine the underlying mechanisms.
Limitations
Our study has some limitations. First, this is a post-hoc analysis. Although our current study adjusted for a broad array of covariates in the regression models, the possibility of residual confounding cannot be excluded. Second, we did not measure glycosylated hemoglobin A1c and insulin or perform glucose tolerance tests. However, our definition of diabetes was similar to that of previous studies [48, 49]. In addition, the FG levels were assessed only at baseline and the exit visit. More frequent assays of FG levels would allow for a more accurate assessment of its progression over time. Third, in the current study, we collected total serum ALP rather than ALP isozymes. In fact, a previous case–control study had suggested that IAP deficiency was associated with type 2 diabetes mellitus [27]. However, we did not have enough blood sample for the further IAP measurements. Therefore, we could not examine the association between different ALP isozymes and new-onset diabetes. Finally, we have not available data on some diseases associated with increased serum ALP, such as Paget disease, rickets, hyperparathyroidism, osteomalacia, etc.
Conclusions
In summary, higher serum ALP was significantly associated with increased risk of new-onset diabetes among hypertensive patients, especially in those with lower tHcy or higher FG levels. If further confirmed, our findings support the strategy to identify and modulate diabetes risk in hypertensive patients by measuring and optimizing individual serum ALP levels.
Acknowledgements
We are grateful to the investigators and participants of the CSPPT, the parent study, who made this report possible.
Abbreviations
- ALP
Alkaline phosphatase
- BMI
Body mass index
- BP
Blood pressure
- CCB
Calcium channel blockers
- CVD
Cardiovascular disease
- CSPPT
China Stroke Primary Prevention Trial
- DBP
Diastolic blood pressure
- eGFR
Estimated glomerular filtration rate
- FG
Fasting glucose
- HDL-C
High-density lipoprotein
- IFG
Impaired fasting glucose
- SBP
Systolic blood pressure
Authors’ contributions
YYZ, XPX and XHQ conceived and designed the study. YYZ, XHQ and CZ contributed to statistical analysis. YYZ and XHQ drafted the manuscript. All authors contributed to collect data and reviewed/edited the manuscript important intellectual content. All authors read and approved the final manuscript.
Funding
The study was supported by funding from the following: the National Key Research and Development Program [2016YFE0205400, 2018ZX09739010, 2018ZX09301034003]; the Science and Technology Program of Guangdong [2020B121202010]; the Science and Technology Planning Project of Guangzhou [201707020010]; the Science, Technology and Innovation Committee of Shenzhen [GJHS20170314114526143, JSGG20180703155802047]; the Economic, Trade and Information Commission of Shenzhen Municipality [20170505161556110, 20170505160926390, 201705051617070], the National Natural Science Foundation of China [81730019, 81973133] and Outstanding Youths Development Scheme of Nanfang Hospital, Southern Medical University [2017J009].
Availability of data and materials
The data and study materials that support the findings of this study will be available from the corresponding authors (pharmaqin@126.com) upon request, after the request is submitted and formally reviewed and approved by the Ethics Committee of the Institute of Biomedicine, Anhui Medical University.
Ethics approval and consent to participate
The parent study (the CSPPT) and the current study were approved by the Ethics Committee of the Institute of Biomedicine, Anhui Medical University, Hefei, China (Federalwide Assurance Number 00001263). All participants provided written informed consent.
Consent for publication
Not applicable.
Competing interests
XPX reports grants from the National Key Research and Development Program [2016YFE0205400, 2018ZX09739010, 2018ZX09301034003]; the Science and Technology Program of Guangdong [2020B121202010]; the Science and Technology Planning Project of Guangzhou [201707020010]; the Science, Technology and Innovation Committee of Shenzhen [GJHS20170314114526143, JSGG20180703155802047]; the Economic, Trade and Information Commission of Shenzhen Municipality [20170505161556110, 20170505160926390, 201705051617070].
XHQ reports grants from the National Natural Science Foundation of China [81730019, 81973133] and Outstanding Youths Development Scheme of Nanfang Hospital, Southern Medical University [2017J009].
No other disclosures were reported.
Footnotes
Publisher's Note
Springer Nature remains neutral with regard to jurisdictional claims in published maps and institutional affiliations.
Contributor Information
Xiping Xu, Email: xipingxu126@126.com.
Xianhui Qin, Email: pharmaqin@126.com.
References
- 1.Saeedi P, Petersohn I, Salpea P, Malanda B, Karuranga S, Unwin N, et al. Global and regional diabetes prevalence estimates for 2019 and projections for 2030 and 2045: results from the International Diabetes Federation Diabetes Atlas, 9th edition. Diabetes Res Clin Pract. 2019;157:107843. doi: 10.1016/j.diabres.2019.107843. [DOI] [PubMed] [Google Scholar]
- 2.Qin X, Li J, Zhang Y, Ma W, Fan F, Wang B, et al. Prevalence and associated factors of diabetes and impaired fasting glucose in Chinese hypertensive adults aged 45 to 75 years. PLoS ONE. 2012;7(8):e42538. doi: 10.1371/journal.pone.0042538. [DOI] [PMC free article] [PubMed] [Google Scholar]
- 3.Petrie JR, Guzik TJ, Touyz RM. Diabetes, hypertension, and cardiovascular disease: clinical insights and vascular mechanisms. Can J Cardiol. 2018;34(5):575–584. doi: 10.1016/j.cjca.2017.12.005. [DOI] [PMC free article] [PubMed] [Google Scholar]
- 4.Rao Kondapally Seshasai S, Kaptoge S, Thompson A, Di Angelantonio E, Gao P, Sarwar N, et al. Diabetes mellitus, fasting glucose, and risk of cause-specific death. N Engl J Med. 2011;364(9):829–841. doi: 10.1056/NEJMoa1008862. [DOI] [PMC free article] [PubMed] [Google Scholar]
- 5.Ballestri S, Zona S, Targher G, Romagnoli D, Baldelli E, Nascimbeni F, et al. Nonalcoholic fatty liver disease is associated with an almost twofold increased risk of incident type 2 diabetes and metabolic syndrome. Evidence from a systematic review and meta-analysis. J Gastroenterol Hepatol. 2016;31(5):936–944. doi: 10.1111/jgh.13264. [DOI] [PubMed] [Google Scholar]
- 6.Kunutsor SK, Apekey TA, Walley J. Liver aminotransferases and risk of incident type 2 diabetes: a systematic review and meta-analysis. Am J Epidemiol. 2013;178(2):159–171. doi: 10.1093/aje/kws469. [DOI] [PubMed] [Google Scholar]
- 7.Harmey D, Hessle L, Narisawa S, Johnson KA, Terkeltaub R, Millan JL. Concerted regulation of inorganic pyrophosphate and osteopontin by akp2, enpp1, and ank: an integrated model of the pathogenesis of mineralization disorders. Am J Pathol. 2004;164(4):1199–1209. doi: 10.1016/S0002-9440(10)63208-7. [DOI] [PMC free article] [PubMed] [Google Scholar]
- 8.Nunes JP, Melão F, Godinho AR, Rodrigues JD, Maciel MJ. Plasma alkaline phosphatase and survival in diabetic patients with acute myocardial infarction. Ann Transl Med. 2016;4(11):210. doi: 10.21037/atm.2016.06.01. [DOI] [PMC free article] [PubMed] [Google Scholar]
- 9.Kim DW, Hwang SY, Nam YJ, Kim D, Shin SJ, Yoon HE. The combined prognostic significance of alkaline phosphatase and vascular calcification in patients with end-stage kidney disease. Nutr Metab Cardiovasc Dis. 2020;30(9):1476–1483. doi: 10.1016/j.numecd.2020.04.029. [DOI] [PubMed] [Google Scholar]
- 10.Zwakenberg SR, van der Schouw YT, Schalkwijk CG, Spijkerman AMW, Beulens JWJ. Bone markers and cardiovascular risk in type 2 diabetes patients. Cardiovasc Diabetol. 2018;17(1):45. doi: 10.1186/s12933-018-0691-2. [DOI] [PMC free article] [PubMed] [Google Scholar]
- 11.Nannipieri M, Gonzales C, Baldi S, Posadas R, Williams K, Haffner SM, et al. Liver enzymes, the metabolic syndrome, and incident diabetes: the Mexico City diabetes study. Diabetes Care. 2005;28(7):1757–1762. doi: 10.2337/diacare.28.7.1757. [DOI] [PubMed] [Google Scholar]
- 12.Nakanishi N, Suzuki K, Tatara K. Serum gamma-glutamyltransferase and risk of metabolic syndrome and type 2 diabetes in middle-aged Japanese men. Diabetes Care. 2004;27(6):1427–1432. doi: 10.2337/diacare.27.6.1427. [DOI] [PubMed] [Google Scholar]
- 13.Hanley AJ, Williams K, Festa A, Wagenknecht LE, D'Agostino RJ, Kempf J, et al. Elevations in markers of liver injury and risk of type 2 diabetes: the insulin resistance atherosclerosis study. Diabetes. 2004;53(10):2623–2632. doi: 10.2337/diabetes.53.10.2623. [DOI] [PubMed] [Google Scholar]
- 14.Chen SC, Tsai SP, Jhao JY, Jiang WK, Tsao CK, Chang LY. Liver fat, hepatic enzymes, alkaline phosphatase and the risk of incident type 2 diabetes: a prospective study of 132,377 adults. Sci Rep. 2017;7(1):4649. doi: 10.1038/s41598-017-04631-7. [DOI] [PMC free article] [PubMed] [Google Scholar]
- 15.Qin X, Huo Y. H-Type hypertension, stroke and diabetes in China: opportunities for primary prevention. J Diabetes. 2016;8(1):38–40. doi: 10.1111/1753-0407.12333. [DOI] [PubMed] [Google Scholar]
- 16.Zhang Y, Nie J, Zhang Y, Li J, Liang M, Wang G, et al. Degree of blood pressure control and incident diabetes mellitus in Chinese adults with hypertension. J Am Heart Assoc. 2020;9(16):e017015. doi: 10.1161/JAHA.120.017015. [DOI] [PMC free article] [PubMed] [Google Scholar]
- 17.Huo Y, Li J, Qin X, Huang Y, Wang X, Gottesman RF, et al. Efficacy of folic acid therapy in primary prevention of stroke among adults with hypertension in China: the CSPPT randomized clinical trial. JAMA. 2015;313(13):1325–1335. doi: 10.1001/jama.2015.2274. [DOI] [PubMed] [Google Scholar]
- 18.Zhang Y, He P, Li Y, Zhang Y, Li J, Liang M, et al. Positive association between baseline brachial-ankle pulse wave velocity and the risk of new-onset diabetes in hypertensive patients. Cardiovasc Diabetol. 2019;18(1):111. doi: 10.1186/s12933-019-0915-0. [DOI] [PMC free article] [PubMed] [Google Scholar]
- 19.Qin X, Li J, Zhang Y, Chen D, Wang B, He M, et al. Effect of folic acid supplementation on risk of new-onset diabetes in adults with hypertension in China: findings from the China Stroke Primary Prevention Trial (CSPPT) J Diabetes. 2016;8(2):286–294. doi: 10.1111/1753-0407.12346. [DOI] [PubMed] [Google Scholar]
- 20.Qin X, Li Y, He M, Tang G, Yin D, Liang M, et al. Folic acid therapy reduces serum uric acid in hypertensive patients: a substudy of the China Stroke Primary Prevention Trial (CSPPT) Am J Clin Nutr. 2017;105(4):882–889. doi: 10.3945/ajcn.116.143131. [DOI] [PubMed] [Google Scholar]
- 21.Zhou C, Liu M, Zhang Z, Zhang Y, Nie J, Liang M, et al. Positive association of serum uric acid with new-onset diabetes in Chinese women with hypertension in a retrospective analysis of the China Stroke Primary Prevention Trial. Diabetes Obes Metab. 2020;22(9):1598–1606. doi: 10.1111/dom.14072. [DOI] [PubMed] [Google Scholar]
- 22.Zhang Y, Li H, Lin T, Guo H, Jiang C, Xie L, et al. Plasma selenium levels and risk of new-onset diabetes in hypertensive adults. J Trace Elem Med Biol. 2019;56:6–12. doi: 10.1016/j.jtemb.2019.07.003. [DOI] [PubMed] [Google Scholar]
- 23.Levey AS, Stevens LA, Schmid CH, Zhang YL, Castro AF, 3rd, Feldman HI, et al. A new equation to estimate glomerular filtration rate. Ann Intern Med. 2009;150(9):604–612. doi: 10.7326/0003-4819-150-9-200905050-00006. [DOI] [PMC free article] [PubMed] [Google Scholar]
- 24.Chinese Diabetes Society China guideline for type 2 diabetes (2007) Zhonghua Yi Xue Za Zhi. 2008;88:1227–1245. [Google Scholar]
- 25.Chinese Diabetes Society China guideline for type 2 diabetes (2010) Chin J of Diabetes. 2012;20:S1–S36. [Google Scholar]
- 26.Sharma U, Pal D, Prasad R. Alkaline phosphatase: an overview. Indian J Clin Biochem. 2014;29(3):269–278. doi: 10.1007/s12291-013-0408-y. [DOI] [PMC free article] [PubMed] [Google Scholar]
- 27.Malo MS. A high level of intestinal alkaline phosphatase is protective against type 2 diabetes mellitus irrespective of obesity. EBioMedicine. 2015;2(12):2016–2023. doi: 10.1016/j.ebiom.2015.11.027. [DOI] [PMC free article] [PubMed] [Google Scholar]
- 28.De Silva N, Borges MC, Hingorani AD, Engmann J, Shah T, Zhang X, et al. Liver function and risk of type 2 diabetes: bidirectional mendelian randomization study. Diabetes. 2019;68(8):1681–1691. doi: 10.2337/db18-1048. [DOI] [PMC free article] [PubMed] [Google Scholar]
- 29.Liu J, Au YS, Lin SL, Leung GM, Schooling CM. Liver enzymes and risk of ischemic heart disease and type 2 diabetes mellitus: a mendelian randomization study. Sci Rep. 2016;6:38813. doi: 10.1038/srep38813. [DOI] [PMC free article] [PubMed] [Google Scholar]
- 30.Azpiazu D, Gonzalo S, Villa-Bellosta R. Tissue non-specific alkaline phosphatase and vascular calcification: a potential therapeutic target. Curr Cardiol Rev. 2019;15(2):91–95. doi: 10.2174/1573403X14666181031141226. [DOI] [PMC free article] [PubMed] [Google Scholar]
- 31.Fadini GP, Pauletto P, Avogaro A, Rattazzi M. The good and the bad in the link between insulin resistance and vascular calcification. Atherosclerosis. 2007;193(2):241–424. doi: 10.1016/j.atherosclerosis.2007.05.015. [DOI] [PubMed] [Google Scholar]
- 32.Bouvet C, Peeters W, Moreau S, DeBlois D, Moreau P. A new rat model of diabetic macrovascular complication. Cardiovasc Res. 2007;73(3):504–511. doi: 10.1016/j.cardiores.2006.11.001. [DOI] [PubMed] [Google Scholar]
- 33.House LM, 2nd, Morris RT, Barnes TM, Lantier L, Cyphert TJ, McGuinness OP, et al. Tissue inflammation and nitric oxide-mediated alterations in cardiovascular function are major determinants of endotoxin-induced insulin resistance. Cardiovasc Diabetol. 2015;14:56. doi: 10.1186/s12933-015-0223-2. [DOI] [PMC free article] [PubMed] [Google Scholar]
- 34.Schultz-Hector S, Balz K, Bohm M, Ikehara Y, Rieke L. Cellular localization of endothelial alkaline phosphatase reaction product and enzyme protein in the myocardium. J Histochem Cytochem. 1993;41(12):1813–1821. doi: 10.1177/41.12.8245430. [DOI] [PubMed] [Google Scholar]
- 35.Boo YC, Jo H. Flow-dependent regulation of endothelial nitric oxide synthase: role of protein kinases. Am J Physiol Cell Physiol. 2003;285(3):C499–C508. doi: 10.1152/ajpcell.00122.2003. [DOI] [PubMed] [Google Scholar]
- 36.Damera S, Raphael KL, Baird BC, Cheung AK, Greene T, Beddhu S. Serum alkaline phosphatase levels associate with elevated serum C-reactive protein in chronic kidney disease. Kidney Int. 2011;79(2):228–233. doi: 10.1038/ki.2010.356. [DOI] [PMC free article] [PubMed] [Google Scholar]
- 37.Cheung BM, Ong KL, Cheung RV, Wong LY, Wat NM, Tam S, et al. Association between plasma alkaline phosphatase and C-reactive protein in Hong Kong Chinese. Clin Chem Lab Med. 2008;46(4):523–527. doi: 10.1515/CCLM.2008.111. [DOI] [PubMed] [Google Scholar]
- 38.Sara JD, Taher R, Kolluri N, Vella A, Lerman LO, Lerman A. Coronary microvascular dysfunction is associated with poor glycemic control amongst female diabetics with chest pain and non-obstructive coronary artery disease. Cardiovasc Diabetol. 2019;18(1):22. doi: 10.1186/s12933-019-0833-1. [DOI] [PMC free article] [PubMed] [Google Scholar]
- 39.Huemer MT, Huth C, Schederecker F, Klug SJ, Meisinger C, Koenig W, et al. Association of endothelial dysfunction with incident prediabetes, type 2 diabetes and related traits: the KORA F4/FF4 study. BMJ Open Diabetes Res Care. 2020;8(1):e001321. doi: 10.1136/bmjdrc-2020-001321. [DOI] [PMC free article] [PubMed] [Google Scholar]
- 40.Pradhan AD, Manson JE, Rifai N, Buring JE, Ridker PM. C-reactive protein, interleukin 6, and risk of developing type 2 diabetes mellitus. JAMA. 2001;286(3):327–334. doi: 10.1001/jama.286.3.327. [DOI] [PubMed] [Google Scholar]
- 41.Bao X, Borné Y, Johnson L, Muhammad IF, Persson M, Niu K, et al. Comparing the inflammatory profiles for incidence of diabetes mellitus and cardiovascular diseases: a prospective study exploring the 'common soil' hypothesis. Cardiovasc Diabetol. 2018;17(1):87. doi: 10.1186/s12933-018-0733-9. [DOI] [PMC free article] [PubMed] [Google Scholar]
- 42.Faerch K, Vaag A, Holst JJ, Glümer C, Pedersen O, Borch-Johnsen K. Impaired fasting glycaemia vs impaired glucose tolerance: similar impairment of pancreatic alpha and beta cell function but differential roles of incretin hormones and insulin action. Diabetologia. 2008;51(5):853–861. doi: 10.1007/s00125-008-0951-x. [DOI] [PubMed] [Google Scholar]
- 43.Ha J, Sherman A. Type 2 diabetes: one disease, many pathways. Am J Physiol Endocrinol Metab. 2020;319(2):E410–E426. doi: 10.1152/ajpendo.00512.2019. [DOI] [PMC free article] [PubMed] [Google Scholar]
- 44.Beulens J, Rutters F, Rydén L, Schnell O, Mellbin L, Hart HE, et al. Risk and management of pre-diabetes. Eur J Prev Cardiol. 2019;26(2 suppl):47–54. doi: 10.1177/2047487319880041. [DOI] [PubMed] [Google Scholar]
- 45.Fang K, Chen Z, Liu M, Peng J, Wu P. Apoptosis and calcification of vascular endothelial cell under hyperhomocysteinemia. Med Oncol. 2015;32(1):403. doi: 10.1007/s12032-014-0403-z. [DOI] [PubMed] [Google Scholar]
- 46.Spence JD, Yi Q, Hankey GJ. B vitamins in stroke prevention: time to reconsider. Lancet Neurol. 2017;16(9):750–760. doi: 10.1016/S1474-4422(17)30180-1. [DOI] [PubMed] [Google Scholar]
- 47.Zhao M, Wu G, Li Y, Wang X, Hou FF, Xu X, et al. Meta-analysis of folic acid efficacy trials in stroke prevention: Insight into effect modifiers. Neurology. 2017;88(19):1830–1838. doi: 10.1212/WNL.0000000000003909. [DOI] [PubMed] [Google Scholar]
- 48.Stranges S, Marshall JR, Natarajan R, Donahue RP, Trevisan M, Combs GF, et al. Effects of long-term selenium supplementation on the incidence of type 2 diabetes: a randomized trial. Ann Intern Med. 2007;147(4):217–223. doi: 10.7326/0003-4819-147-4-200708210-00175. [DOI] [PubMed] [Google Scholar]
- 49.Bleys J, Navas-Acien A, Guallar E. Serum selenium and diabetes in U.S. adults. Diabetes Care. 2007;30(4):829–834. doi: 10.2337/dc06-1726. [DOI] [PubMed] [Google Scholar]
Associated Data
This section collects any data citations, data availability statements, or supplementary materials included in this article.
Data Availability Statement
The data and study materials that support the findings of this study will be available from the corresponding authors (pharmaqin@126.com) upon request, after the request is submitted and formally reviewed and approved by the Ethics Committee of the Institute of Biomedicine, Anhui Medical University.