

Abstract
Aim: The association between small dense low-density lipoprotein cholesterol (sdLDL-C) levels and carotid intimal medial thickness (cIMT) progression has not been evaluated fully. We assessed specialized lipoproteins, including sdLDL-C, with regard to cIMT progression in a prospective observational study in Japan.
Methods: Plasma total cholesterol, direct LDL-C, sdLDL-C, LDL-triglycerides (LDL-TG), high-density lipoprotein cholesterol (HDL-C), HDL2-C, HDL3-C, triglycerides, Lp(a), and adiponectin were measured in 2,030 men and women (median age 59 years, free of cardiovascular disease (CVD) and off cholesterol lowering medication). At both baseline and after a five-year follow-up, cIMT was assessed. Univariate, multivariate regression, and least square analyses were performed to examine the relationships between direct LDL-C, sdLDL-C, and other lipoproteins with cIMT progression.
Results: The median cIMT at baseline was 0.63 mm and five-year progression was 0.18 mm. After adjustment for standard CVD risk factors, including age, gender, systolic blood pressure, total cholesterol, HDL-C, smoking, diabetes, and hypertension treatment, only direct LDL-C, sdLDL-C, and the sdLDL-C/LDL-C ratio were associated with cIMT progression. Even in subjects with direct LDL-C < 100 mg/dL, who were considered at low CVD risk, elevated sdLDL-C were associated with cIMT progression (P for trend = 0.009) in a model with established CVD risk factors, although the sdLDL-C/LDL-C ratio did not. Those correlations did not change by including triglycerides as a controlling factor or excluding premenopausal women from the analyzed population.
Conclusions: Small dense LDL-C has a stronger relationship with cIMT progression than LDL-C does; therefore, measuring sdLDL-C may allow for the formulation of optimal therapy for CVD prevention.
Keywords: Small dense LDL cholesterol, Carotid intimal medial thickness, Cardiovascular diseases, Atherosclerosis
1. Introduction
Cardiovascular disease (CVD) is a leading cause of death and disability worldwide1). According to the American Heart Association / American College of Cardiology guidelines, major CVD risk factors include increased age, male gender, hypertension, diabetes, smoking, increased total cholesterol, and decreased high-density lipoprotein cholesterol (HDL-C)2). Increased low-density lipoprotein cholesterol (LDL-C) is also a CVD risk factor highly associated with total cholesterol. An LDL-C target value of < 70mg/dL has been recommended for patients with established CVD in the United States and < 100 mg/dL in Japan3). In many laboratories, LDL-C is calculated using the Friedewald formula or the Martin formula4, 5); however, this estimated LDL-C is inaccurate if the subject has not fasted for at least eight hours or if the plasma triglycerides concentration are > 400 mg/dL4). Moreover, our studies indicate that, even if triglycerides concentration is > 200 mg/dL, the estimated LDL-C value becomes increasingly inaccurate compared to LDL-C levels measured with ultracentrifugation methods6). Direct homogeneous LDL-C assays for use on an automated analyzer without sample pretreatment were developed7, 8). The values obtained with these assays correlated well with results obtained with the reference method using ultracentrifugation9). Small dense LDL-C (sdLDL-C) is a subfraction of LDL with a density of 1.044–1.063 g/mL. Studies indicate that sdLDL-C is associated with a higher CVD risk than large buoyant LDL-C (lbLDL-C)10). Our prior studies found that elevated sdLDL-C levels were significantly associated with increased triglycerides and decreased HDL-C levels in the Framingham Offspring Study11–13). However, the measurement methods of low-density lipoprotein particles in these studies used gradient gel electrophoresis, which is cumbersome, labor-intensive, and difficult to reproduce. Subsequently, a direct homogeneous automated assay for measuring sdLDL-C was developed14, 15). Elevated sdLDL-C, measured using this homogeneous method, has been strongly associated with the presence of coronary heart disease and risk factors16–21).
Measuring carotid intimal medial thickness (cIMT) by carotid ultrasonography is an excellent method of assessing for the presence of atherosclerosis, and is an excellent measure of CVD risk. Increased cIMT, noninvasively measured by B-mode ultrasonography, is associated with carotid arterial wall stiffness, CVD event, and severe coronary atherosclerosis22–24). Elevated LDL-C levels correlate with atherosclerosis development25–27), and several studies have associated elevated sdLDL-C levels with increased cIMT28–31). However, these studies were all cross-sectional and, to our knowledge, there has been no prospective study to assess the association of sdLDL-C levels with cIMT progression.
In this investigation, our goal was to examine the clinical utility of sdLDL-C and LDL-C, using direct homogeneous assays as well as other atherogenic lipoproteins, for predicting cIMT progression in a prospective, observational, community-based cohort study.
2. Subjects and Methods
2.1 Study Population and Design
Subjects in this study were participants of the Kyushu and Okinawa Population Study (KOPS), a community-based, prospective, observational study of lifestyle-related diseases and cancers, which has been underway since 2004 32, 33). A total of 18,762 participants have been enrolled in KOPS, and the population is almost entirely Japanese. For this analysis, we included 2,030 male and female participants who gave blood samples after an overnight fast at the baseline survey, had cIMT measured, and were not taking cholesterol lowering medications during baseline and five-year follow-up surveys. They also had physical examinations, including measurement of blood pressure, height, and weight as part of their participation in this study. All participants provided their past medical history, including information about hospitalization, use of all medications, and lifestyle habits. Each participant provided informed consent prior to enrollment. To ensure data validity, all doctors who participated in the study were staff members of the Department of General Internal Medicine of Kyushu University Hospital, who had been trained with regard to the study protocol and the medical procedures. All studies were carried out in accordance with the principles of the Declaration of Helsinki, as revised in 2008, and approved by the Kyushu University Hospital Ethics Committee prior to data collection.
2.2 Laboratory Measurements
Fasting plasma samples were stored at −80°C and not thawed until use. Plasma levels of total cholesterol, HDL-C, triglycerides, high sensitivity C reactive protein (hsCRP) were measured with standard enzymatic methods, as previously described9, 17). Plasma levels of direct LDL-C, sdLDL-C, LDL-triglycerides (LDL-TG), adiponectin, lipoprotein(a) [Lp(a)], and HDL3-C were determined using homogeneous assay kits obtained from Denka-Seiken (Niigata, Japan) on an automated chemistry analyzer (Olympus AU400), as previously described34–38). All analyses were carried out in the central laboratory at Tufts University, and the within- and between-run coefficients of variation for all assays were < 5.0 %. Non-HDL-C, calculated LDL-C, lbLDL-C, and HDL2-C were calculated as follows: 1) non-HDL-C= total cholesterol – HDL-C; 2) calculated LDL-C= total cholesterol – (HDL-C+ TG/5); 3) lbLDL-C= direct LDL-C – sdLDL-C; and 4) HDL2-C=HDL-C – HDL3-C. Ratios of sdLDL-C to LDL-C were calculated as the sdLDL-C value divided by the direct LDL-C or calculated LDL-C value.
2.3 Assessments of Carotid Intimal Medial Thickness
cIMT levels were measured by B-mode ultrasonography (UF-400AX, Fukuda Denshi, Co., Ltd., Tokyo, Japan) with a 10 MHz probe. All ultrasound examinations focused on the far wall of both the left and right common carotid arteries and were performed by 10 well-trained staff doctors from our department. Images were obtained 20 mm proximal to the bulb origin and analyzed off-line using innovative IMT measurement software (Intima-Scope; MEDIA CROSS Co., Ltd., Tokyo, Japan). This system was specifically designed to assess carotid intimal medial thickness levels and allows one to obtain the average of approximately 250 points of cIMT values in the measurement segment in the order of 0.01 mm39, 40). Segments with plaque were excluded from assessment of cIMT levels. Analyzing cIMT levels using Intima-Scope was performed by a well-trained technician who was blinded to the clinical information. In this study, subjects had their cIMT values assessed at baseline and five-year follow-up, and the differences between those two surveys were calculated.
2.4 Statistical Analyses
All statistical analyses were performed using SAS 9.4 (SAS Institute Inc., Cary, NC). Data are expressed as median values with 25th and 75th percentile values. Categorical variables are reported as frequencies and percentages. Univariate analyses were carried out using Mann-Whitney U testing for continuous variables between groups or Chi-square testing for categorical variables. Univariate and multivariate regression analyses were performed to examine associations with cIMT change over the five-year period and the biochemical variables. In addition, we modeled sdLDL-C as a categorical variable by quartiles, and the cut-points were obtained from the sdLDL-C distribution in the whole population (25th, 50th, and 75th percentile values were 15.2, 21.6, and 30.7 mg/dL, respectively). The P values for trends in multivariate adjustment factors were evaluated with linear or logistic regression and adjusted for standard CVD risk factors, include age, gender, systolic blood pressure, total cholesterol, HDL-C, current smoking, hypertension treatment, and diabetes. Spearman's correlation coefficient was used to assess the correlations of sdLDL-C and traditional CVD risk factors and other lipoproteins. All laboratory measurement variables were log-transformed to account for their non-Gaussian distributions. Associations between the sdLDL-C or sdLDL-C/LDL-C ratio and cIMT change over five years were assessed using least square methods and the Jonckheere-Terpstra trend test, with adjustment for standard CVD risk factors. A P value of < 0.05 was considered statistically significant.
3. Results
3.1 Characteristics at Baseline
Table 1 shows descriptive information on the 2,030 participants at baseline, including information about menopausal status. The mean age was 59 years, and 62.2 % were women. Among the 1,263 women, 187 (14.8%) were premenopausal. Of a total of 2,030 subjects (1,263 women and 767 men), 242 (11.9 %) were smokers, 302 (14.9 %) had hypertension, 279 (13.7 %) were taking blood pressure lowering medication, 50 (2.5 %) had diabetes mellitus, and 42 (2.1 %) were taking diabetes medication. None of subjects were taking lipid lowering medications. Mean cIMT levels were 0.63 mm, and the men had significantly higher cIMT levels than the women (P < 0.001). The mean sdLDL-C levels were 21.6 mg/dL, and the men had significantly higher sdLDL-C levels than the women (P < 0.001). The mean direct LDL-C levels were 91 mg/dL, and the men had significantly higher direct LDL-C values than the women (P = 0.02). Mean sdLDL-C/direct LDL-C ratios were 23.5 %, and the men had significantly higher sdLDL-C/direct LDL-C ratio than the women (P < 0.001). The women had significantly higher levels of HDL-C, HDL3-C, and HDL2-C than the men (all P < 0.001). They also had significantly higher non-HDL-C levels than the men (P < 0.01). Comparing men and postmenopausal women, similar differences were observed; instead of direct LDL-C, they had almost same direct LDL-C levels (P = 0.97).
Table 1. Characteristics at baseline, classified by sex and menopausal status*.
| Variables at baseline | Men (n = 767) |
Women (n = 1,263) |
P value† | Premenopausal women (n = 187) |
Postmenopausal women (n = 1,076) |
P value‡ |
|---|---|---|---|---|---|---|
| Age (year) | 61 [52, 67] | 58 [50, 65] | < 0.001 | 40 [35, 43] | 60 [54, 66] | < 0.001 |
| Body mass index (kg/m2) | 24.2 [22.3, 26.4] | 23.2 [21.0, 25.5] | < 0.001 | 21.4 [19.8, 23.8] | 23.5 [21.3, 25.8] | < 0.001 |
| Systolic blood pressure (mmHg) | 128 [118, 138] | 122 [110, 135] | < 0.001 | 109 [100, 116] | 124 [112, 136] | < 0.001 |
| Diastolic blood pressure (mmHg) | 78 [70, 84] | 71 [66, 80] | < 0.001 | 46 [60, 73] | 72 [68, 80] | < 0.001 |
| Current smoking, n (%) | 184 (26.7) | 58 (5.3) | < 0.001 | 20 (12.4) | 38 (4.1) | < 0.001 |
| Current alcohol drinking, n (%) | 443 (67.8) | 233 (22.4) | < 0.001 | 65 (40.6) | 168 (19.1) | < 0.001 |
| Hypertension, n (%) | 137 (19.8) | 165 (14.9) | < 0.01 | 1 (0.6) | 164 (17.5) | < 0.01 |
| Hypertension treatment, n (%) | 123 (17.3) | 156 (13.1) | 0.01 | 1 (0.5) | 155 (15.4) | 0.01 |
| Diabetes, n (%) | 32 (4.6) | 18 (1.6) | < 0.001 | 0 (0.0) | 18 (1.9) | 0.09 |
| Diabetes treatment, n (%) | 27 (3.8) | 15 (1.3) | < 0.001 | 0 (0.0) | 15 (1.5) | 0.15 |
| Total cholesterol (mg/dL) | 176 [157, 195] | 186 [168, 205] | < 0.001 | 164 [147, 183] | 190 [172, 208] | < 0.001 |
| Triglycerides (mg/dL) | 116 [81, 170] | 96 [68, 137] | < 0.001 | 71 [53, 106] | 100 [71, 142] | < 0.001 |
| HDL-C (mg/dL) | 55 [48, 65] | 63 [54, 74] | < 0.001 | 66 [56, 75] | 63 [53, 74] | 0.053 |
| Non HDL-C (mg/dL)§ | 119 [99, 138] | 121 [102, 140] | 0.03 | 97 [82, 117] | 125 [107, 143] | < 0.001 |
| Calculated LDL-C (mg/dL)‖ | 90 [74, 109] | 100 [82, 116] | < 0.001 | 80 [66, 97] | 102 [86, 118] | < 0.001 |
| Direct LDL-C (mg/dL) | 93 [76, 114] | 91 [73, 109] | 0.02 | 74 [60, 92] | 93 [77, 112] | < 0.001 |
| Small dense LDL-C (mg/dL) | 24.3 [16.8, 33.6] | 20.4 [14.3, 28.6] | < 0.001 | 14.6 [10.2, 23.6] | 21.0 [15.3, 29.1] | < 0.001 |
| Small dense LDL-C / calculated LDL-C ratio (%) | 25.6 [19.3, 36.3] | 19.8 [15.4, 27.8] | < 0.001 | 18.1 [13.4, 28.2] | 19.9 [15.6, 27.8] | < 0.01 |
| Small dense LDL-C / direct LDL-C ratio (%) | 25.5 [21.1, 31.2] | 22.7 [19.0, 27.1] | < 0.001 | 20.8 [17.0, 26.2] | 22.8 [19.3, 27.3] | < 0.001 |
| Large buoyant LDL-C (mg/dL)¶ | 67.0 [56.1, 80.0] | 68.7 [57.4, 81.5] | 0.34 | 58.4 [47.1, 67.0] | 70.6 [59.6, 82.9] | < 0.001 |
| VLDL-C (mg/dL)** | 23 [13, 34] | 30 [20, 40] | < 0.001 | 23 [11, 34] | 31 [21, 41] | < 0.001 |
| LDL-triglycerides (mg/dL) | 10.1 [6.4, 15.8] | 7.5 [4.7, 11.9] | < 0.001 | 5.6 [3.9, 9.1] | 7.7 [4.9, 12.2] | < 0.001 |
| HDL3-C (mg/dL) | 13.9 [11.2, 17.2] | 14.5 [12.1, 18.8] | < 0.001 | 14.2 [11.7, 18.5] | 14.5 [12.2, 18.8] | 0.35 |
| HDL2-C (mg/dL)†† | 40.8 [33.4, 50.2] | 47.5 [38.7, 58.7] | < 0.001 | 49.1 [42.5, 61.6] | 47.3 [38.1, 58.6] | 0.01 |
| Lipoprotein (a) (mg/dL) | 6.2 [3.3, 11.8] | 7.3 [4.0, 13.3] | < 0.001 | 6.1 [3.1, 10.6] | 7.5 [4.1, 13.5] | < 0.01 |
| Adiponectin (µg/mL) | 5.6 [3.8, 8.1] | 9.6 [6.9, 12.9] | < 0.001 | 8.2 [6.2, 11.1] | 9.8 [7.1, 13.2] | < 0.001 |
| High sensitivity CRP (mg/L) | 0.44 [0.21, 0.82] | 0.38 [0.15, 0.80] | < 0.001 | 0.22 [0.09, 0.50] | 0.42 [0.18, 0.84] | < 0.001 |
| Mean cIMT at baseline (mm) | 0.67 [0.60, 0.77] | 0.63 [0.57, 0.70] | < 0.001 | 0.53 [0.47, 0.60] | 0.65 [0.58, 0.73] | < 0.001 |
data are shown as median [25% quartile, 75% quartile] or number (%).
P values were calculated between women and men groups.
P values were calculated between premenopausal and postmenopausal women groups.
Parameter is calculated using the following equation: total cholesterol – HDL-C.
Parameter is calculated using the following Friedewald equation: (total cholesterol – HDL-C) – (triglycerides/5).
Parameter is calculated using the following equation: LDL-C – small dense LDL-C.
Parameter is calculated using the following equation: total cholesterol – HDL-C – LDL-C.
Parameter is calculated using the following equation: HDL-C – HDL3-C.
HDL-C, high-density lipoprotein cholesterol; LDL-C, low-density lipoprotein cholesterol; VLDL-C, very low-density lipoprotein cholesterol; CRP, C reactive protein; cIMT, carotid intimal medial thickness.
3.2 Regression Analyses for cIMT Changes
Table 2 provides results of univariate and multivariate regression analyses for cIMT changes over five years. The mean cIMT changes were 0.18 mm. On univariate analyses, higher levels of sdLDL-C, direct LDL-C, sdLDL-C/LDL-C ratio, LDL-TG, triglycerides, Lp(a), and non-HDL-C were significantly and positively associated with cIMT progression (all P < 0.05). The univariate analysis parameters that were most strongly associated with an estimated value for cIMT change > 0.10, in order, included 1) sdLDL-C/LDL-C ratio, 2) direct LDL-C, 3) sdLDL-C, 4) gender, 5) diabetes treatment, 6) diabetes, 7) log triglycerides, 8) hypertension, and 9) hypertension treatment. HDL-C, HDL3-C, HDL2-C, and adiponectin were significantly negatively associated with cIMT progression (all P < 0.05). Among these parameters, HDL-C had the lowest estimated value for cIMT change, followed by 2) HDL2-C, 3) HDL3-C, and 4) adiponectin. After controlling for standard CVD risk factors, such as age, gender, systolic blood pressure, smoking, hypertension treatment, diabetes, total cholesterol, and HDL-C, only sdLDL-C, direct LDL-C, and sdLDL-C/LDL-C ratio were significantly (estimated values were 0.227, 0.306, and 0.455, respectively, and P < 0.001, P = 0.02, and P < 0.01, respectively) positively correlated with cIMT change, and BMI had significant negative correlation with cIMT change (estimated value was −0.010 and P < 0.01). Therefore, only sdLDL-C and direct LDL-C were statistically significant lipoproteins for cIMT progression. Adding TG to the controlling factors did not change those correlations. In addition, those results were not different when excluding 187 premenopausal women.
Table 2. Regression analyses for cIMT changes during 5 years.
| Variavles | Univariate |
Multivariate Model 1* |
Multivariate Model 2† |
||||||
|---|---|---|---|---|---|---|---|---|---|
| Adjusted R2 | Estimated value | P value | Adjusted R2 | Estimated value | P value | Adjusted R2 | Estimated value | P value | |
| Age (/ 1 year) | 0.0700 | 0.011 | < 0.001 | ||||||
| Sex (men) | 0.0378 | 0.187 | < 0.001 | ||||||
| Body mass index (/ 1 kg/m2) | −0.0002 | 0.002 | 0.44 | 0.0926 | −0.010 | < 0.01 | 0.0935 | −0.010 | < 0.01 |
| sBP (/ 1 mmHg) | 0.0205 | 0.004 | < 0.001 | ||||||
| dBP (/ 1 mmHg) | 0.0040 | 0.003 | < 0.01 | 0.0892 | < −0.001 | 0.69 | 0.0895 | < −0.001 | 0.64 |
| Current smoking (yes) | 0.0026 | 0.073 | 0.02 | ||||||
| Current alcohol drinking (yes) | 0.0071 | 0.080 | < 0.001 | 0.0888 | 0.033 | 0.18 | 0.0889 | 0.030 | 0.23 |
| Hypertension (yes) | 0.0102 | 0.122 | < 0.001 | ||||||
| Hypertension treatment (yes) | 0.0085 | 0.116 | < 0.001 | ||||||
| Diabetes (yes) | 0.0030 | 0.158 | 0.01 | ||||||
| Diabetes treatment (yes) | 0.0026 | 0.163 | 0.01 | ||||||
| log total cholesterol (/ 1 log) | −0.0002 | −0.117 | 0.43 | ||||||
| log triglycerides (/ 1 log) | 0.0059 | 0.155 | < 0.001 | 0.0895 | 0.073 | 0.16 | |||
| log HDL-C (/ 1 log) | 0.0056 | −0.338 | < 0.001 | ||||||
| log non HDL-C‡ (/ 1 log) | 0.0004 | 0.128 | 0.18 | ||||||
| log calculated LDL-C§ (/ 1 log) | −0.0003 | −0.052 | 0.52 | 0.0884 | −0.219 | 0.14 | 0.0881 | −0.393 | 0.15 |
| log direct LDL-C (/ 1 log) | 0.0045 | 0.251 | < 0.01 | 0.0915 | 0.304 | 0.02 | 0.0917 | 0.301 | 0.02 |
| log small dense LDL-C (/ 1 log) | 0.0127 | 0.245 | < 0.001 | 0.0950 | 0.226 | < 0.001 | 0.0945 | 0.226 | < 0.001 |
| Small dense LDL-C / calculated LDL-C ratio (/ 1%) | 0.0168 | 0.353 | < 0.001 | 0.0964 | 0.247 | < 0.001 | 0.0978 | 0.330 | < 0.001 |
| Small dense LDL-C / direct LDL-C ratio (/ 1%) | 0.0147 | 0.727 | < 0.001 | 0.0939 | 0.454 | < 0.01 | 0.0934 | 0.477 | < 0.01 |
| log large buoyant LDL-C‖ (/ 1 log) | −0.0001 | 0.067 | 0.40 | 0.0887 | 0.054 | 0.63 | 0.0891 | 0.091 | 0.43 |
| log VLDL-C¶ (/ 1 log) | 0.0031 | −0.009 | < 0.01 | 0.0906 | −0.081 | 0.02 | 0.0908 | −0.078 | 0.03 |
| log LDL-triglycerides (/ 1 log) | 0.0027 | 0.088 | 0.01 | 0.0890 | 0.039 | 0.34 | 0.0889 | 0.013 | 0.80 |
| log HDL3-C (/ 1 log) | 0.0027 | −0.199 | 0.01 | 0.0887 | −0.056 | 0.53 | 0.0889 | −0.026 | 0.78 |
| log HDL2-C** (/ 1 log) | 0.0043 | −0.240 | < 0.01 | 0.0885 | 0.012 | 0.95 | 0.0888 | −0.020 | 0.93 |
| log lipoprotein(a) (/ 1 log) | 0.0007 | 0.039 | 0.11 | 0.0906 | 0.035 | 0.16 | 0.0914 | 0.042 | 0.10 |
| log adiponectin (/ 1 log) | 0.0025 | −0.101 | 0.01 | 0.0893 | −0.060 | 0.23 | 0.0893 | −0.049 | 0.33 |
| log high sensitivity CRP (/ 1 log) | 0.0013 | 0.039 | 0.06 | 0.0865 | −0.018 | 0.44 | 0.0870 | −0.021 | 0.36 |
Variables in multivariate regression analyses model 1 were adjusted for age, sex, systolic blood pressure, total cholesterol, high density lipoprotein cholesterol, current smoking, history of diabetes, and hypertension treatment.
Variables in multivariate regression analyses model 2 were adjusted for age, sex, systolic blood pressure, total cholesterol, high density lipoprotein cholesterol, current smoking, history of diabetes, and hypertension treatment and triglycerides.
Parameter is calculated using the following equation: total cholesterol – HDL-C.
Parameter is calculated using the following Friedewald equation: (total cholesterol – HDL-C) – (triglycerides/5).
Parameter is calculated using the following equation: LDL-C – small dense LDL-C.
Parameter is calculated using the following equation: total cholesterol – HDL-C – LDL-C.
Parameter is calculated using the following equation: HDL-C – HDL3-C.
cIMT, carotid intimal medial thickness; sBP, systolic blood pressure; dBP, diastolic blood pressure; HDL-C, high-density lipoprotein cholesterol; LDL-C, low-density lipoprotein cholesterol; VLDL-C, very low-density lipoprotein cholesterol; CRP, C reactive protein.
3.3 Association of sdLDL-C with Cardiovascular Risk Factors and Other Lipoproteins
Table 3 shows the means or proportions of CVD risk factors and lipoproteins by sdLDL-C quartiles. On univariate analyses for standard CVD risk factors, individuals with the highest sdLDL-C levels were more likely to be older men with higher systolic blood pressure and total cholesterol levels, hypertension, and diabetes, and receiving hypertension treatment. In addition, they were more likely to have lower HDL-C levels (all P < 0.05). On multivariate analyses, with adjustment for standard CVD risk factors, individuals with the highest sdLDL-C levels were also more likely to have the highest prevalence of alcohol drinking habits, and the highest values for BMI, diastolic blood pressure, direct LDL-C, sdLDL-C/LDL-C ratio, lbLDL-C, LDL-TG, triglycerides, and hsCRP (all P < 0.05). Interestingly, they were likely to have lower HDL3-C, but higher HDL2-C levels. The mean cIMT progression significantly increased with sdLDL-C quartiles (P < 0.01). However, mean cIMT levels at baseline were not different across sdLDL-C quartiles. Adding TG to the controlling factors did not change those correlations. In addition, those results were not different when excluding 187 premenopausal women.
Table 3. Parameters by quartiles of small dense LDL-C and P-value for trend across quartiles, adjusted for standard ASCVD risk factors†.
| Small dense LDL-C Quartiles | Quartile 1 | Quartile 2 | Quartile 3 | Quartile 4 | P values for trend |
|---|---|---|---|---|---|
| (n = 507) | (n = 506) | (n = 510) | (n = 507) | ||
| Unadjusted variables‡ | |||||
| Age (years) | 56 [46, 63] | 59 [52, 66] | 60 [53, 67] | 61 [50, 68] | < 0.001 |
| Women, n (%) | 361 (71.2) | 339 (67.0) | 300 (58.8) | 263 (51.9) | < 0.001 |
| Systolic blood pressure (mmHg) | 120 [109, 132] | 122 [112, 136] | 125 [116, 136] | 128 [116, 139] | < 0.001 |
| Total cholesterol (mg/dL) | 164 [148, 181] | 180 [162, 197] | 189 [171, 205] | 198 [182, 215] | < 0.001 |
| HDL-C (mg/dL) | 67 [57, 78] | 63 [54, 75] | 58 [49, 67] | 54 [47, 63] | < 0.001 |
| Current smoking, n (%) | 52 (11.8) | 60 (13.7) | 62 (13.6) | 68 (15.2) | 0.53 |
| Hypertension, n (%) | 56 (12.5) | 82 (18.5) | 76 (16.6) | 88 (19.6) | 0.02 |
| Hypertension treatment, n (%) | 50 (10.3) | 76 (15.9) | 72 (15.1) | 81 (17.5) | < 0.01 |
| Diabetes, n (%) | 10 (2.2) | 9 (2.0) | 11 (2.4) | 20 (4.4) | 0.13 |
| Diabetes treatment, n (%) | 9 (1.9) | 8 (1.7) | 9 (1.9) | 16 (3.5) | 0.25 |
| Adjusted variables§ | |||||
| Body mass index (kg/m2) | 23.5 ± 0.3 | 24.3 ± 0.3*** | 24.5 ± 0.3*** | 24.9 ± 0.3*** | < 0.001 |
| Diastolic blood pressure (mmHg) | 73.7 ± 0.7 | 73.2 ± 0.7 | 73.8 ± 0.7 | 75.0 ± 0.7 | 0.02 |
| Current alcohol drinking (%) | 39.0 ± 4.1 | 41.3 ± 3.9 | 50.4 ± 3.9*** | 63.8 ± 3.9*** | < 0.001 |
| Dyslipidemia (%) | 1.7 ± 1.2 | 1.6 ± 1.2 | 1.0 ± 1.2 | 3.5 ± 1.2 | 0.19 |
| Triglycerides (mg/dL) | 99.0 ± 6.6 | 118.3 ± 6.3*** | 148.1 ± 6.3*** | 186.7 ± 6.4*** | < 0.001 |
| Calculated LDL-C (mg/dL)‖ | 102.7 ± 1.0 | 98.3 ± 0.9*** | 93.3 ± 0.9*** | 84.5 ± 0.9*** | < 0.001 |
| Direct LDL-C (mg/dL) | 77.5 ± 1.2 | 88.3 ± 1.2*** | 98.1 ± 1.2*** | 114.0 ± 1.2*** | < 0.001 |
| Small dense LDL-C / calculated LDL-C ratio (%) | 10.4 ± 1.3 | 21.7 ± 1.3*** | 30.0 ± 1.3*** | 47.3 ± 1.3*** | < 0.001 |
| Small dense LDL-C / direct LDL-C ratio (%) | 16.7 ± 0.5 | 21.8 ± 0.4*** | 26.4 ± 0.4*** | 35.0 ± 0.5*** | < 0.001 |
| Large buoyant LDL-C (mg/dL)¶ | 63.9 ± 1.1 | 69.2 ± 1.1*** | 72.7 ± 1.0*** | 74.2 ± 1.1*** | < 0.001 |
| VLDL-C (mg/dL)†† | 24.5 ± 1.3 | 29.3 ± 1.2*** | 34.9 ± 1.2*** | 44.8 ± 1.2*** | < 0.001 |
| LDL-triglycerides (mg/dL) | 8.2 ± 0.8 | 9.5 ± 0.7* | 12.7 ± 0.7*** | 16.9 ± 0.7*** | < 0.001 |
| HDL3-C (mg/dL) | 15.7 ± 0.4 | 15.3 ± 0.4 | 14.4 ± 0.4*** | 13.2 ± 0.4*** | < 0.001 |
| HDL2-C (mg/dL)†† | 46.5 ± 0.4 | 47.0 ± 0.4 | 47.8 ± 0.4*** | 49.0 ± 0.4*** | < 0.001 |
| Lipoprotein(a) (mg/dL) | 11.6 ± 1.0 | 11.2 ± 0.9 | 10.4 ± 0.9 | 7.2 ± 1.0*** | < 0.001 |
| Adiponectin (µg/dL) | 9.2 ± 0.4 | 8.2 ± 0.4*** | 8.1 ± 0.4*** | 7.2 ± 0.4*** | < 0.001 |
| High sensitivity CRP (mg/L) | 0.62 ± 0.07 | 0.68 ± 0.07 | 0.71 ± 0.07 | 0.82 ± 0.07** | < 0.01 |
| Mean cIMT at baseline (mm) | 0.69 ± 0.01 | 0.70 ± 0.01 | 0.69 ± 0.01 | 0.69 ± 0.01 | 0.95 |
| Mean cIMT progression (mm) | 0.31 ± 0.04 | 0.33 ± 0.04 | 0.34 ± 0.04 | 0.41 ± 0.04** | < 0.01 |
Adjusted for standard ASCVD risk factors included age, sex, systolic blood pressure, total cholesterol, high density lipoprotein cholesterol, current smoking, history of diabetes, and hypertension treatment.
Data are shown as median [25% quartile, 75% quartile] or number (%) for unadjusted variables.
Data are shown as adjusted mean ± standard error or proportions ± standard error for adjusted variables.
Parameter is calculated using the following Friedewald equation: (total cholesterol – HDL-C) – (triglycerides/5).
Parameter is calculated using the following equation: LDL-C – small dense LDL-C.
Parameter is calculated using the following equation: total cholesterol – HDL-C – LDL-C.
Parameter is calculated using the following equation: HDL-C – HDL3-C.
P values < 0.05 compared with Quartile 1.
P values < 0.01 compared with Quartile 1.
P values < 0.001 compared with Quartile 1.
LDL-C, low-density lipoprotein cholesterol; ASCVD, atherosclerotic cardiovascular disease; HDL-C, high-density lipoprotein cholesterol; VLDL-C, very low-density lipoprotein cholesterol; CRP, C reactive protein; cIMT, carotid intimal medial thickness.
The correlations between sdLDL-C and other lipoproteins and hsCRP are shown in Supplementary Fig. 1. The positive correlations with sdLDL-C were found with direct LDL-C, triglycerides, non-HDL-C, LDL-TG, lbLDL-C, calculated LDL-C, total cholesterol, and hsCRP. HDL-C, HDL2-C, HDL3-C, adiponectin, and Lp(a) showed negative correlations with sdLDL-C.
Supplementary Fig. 1.
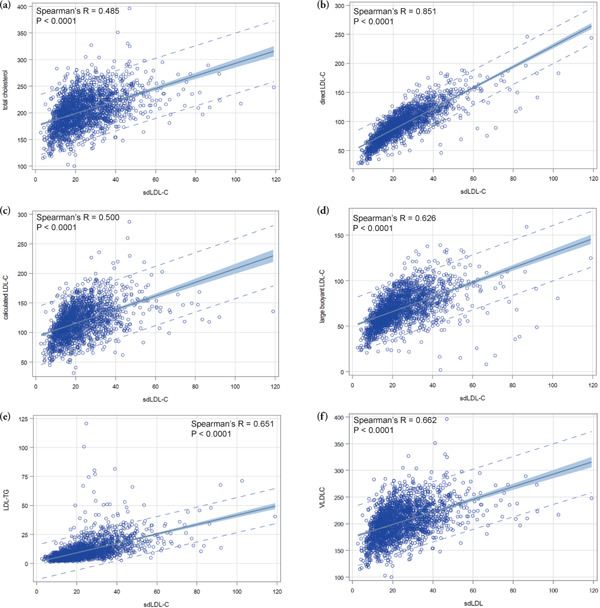
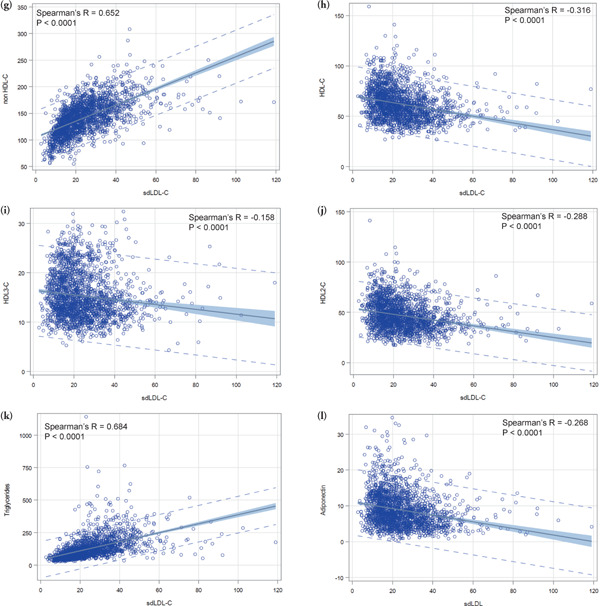
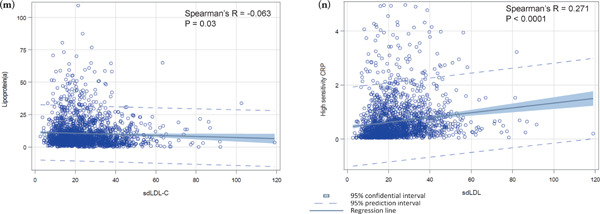
Correlations between sdLDL-C and other lipoproteins and hsCRP
This figure shows scatter plots between sdLDL-C and other lipoproteins and hsCRP. According to Spearman's r values, positive correlations between sdLDL-C were found in order direct LDL-C, triglycerides, non-HDL-C, LDL-TG, large buoyant LDL-C, calculated LDL-C, total cholesterol, and hsCRP. HDL-C, HDL2-C, HDL3-C, adiponectin, and Lp(a) showed negative correlations between sdLDL-C.
sdLDL-C, small dense low-density lipoprotein cholesterol; hsCRP, high sensitivity C reactive protein; LDL-C, low-density lipoprotein cholesterol; HDL-C, high-density lipoprotein cholesterol; LDL-TG, low-density lipoprotein triglycerides; Lp(a), lipoprotein(a).
3.4 sdLDL-C Levels and cIMT Progressions
We assessed the association of sdLDL-C levels with cIMT progressions, stratified by direct LDL-C levels (direct LDL-C ≤ 100 mg/dL and > 100 mg/dL) (Fig. 1). In these analyses, the mean cIMT change levels were adjusted for standard CVD risk factors, such as age, gender, smoking, systolic blood pressure, hypertension treatment, diabetes, total cholesterol, and HDL-C. Mean cIMT progression in both groups, with direct LDL-C levels ≤ 100 mg/dL and > 100 mg/dL, significantly increased in accordance with higher sdLDL-C quartiles (P for trend < 0.01 and < 0.001, respectively). Among subjects with direct LDL-C levels ≤ 100 mg/dL, individuals with the highest sdLDL-C quartile had significantly increased cIMT levels than those with the lowest sdLDL-C quartile (P < 0.05), but this was not the case for those with values with in the 2nd and 3rd sdLDL-C quartiles. The subjects with direct LDL-C levels > 100 mg/dL and the highest sdLDL-C quartile had significantly increased cIMT levels compared to those with all other sdLDL-C quartiles (all P < 0.05). Moreover, the group with direct LDL-C levels > 100 mg/dL and the highest sdLDL-C quartile had significantly increased cIMT levels than those with all other groups (all P < 0.05). Adding TG to the controlling factors did not change those correlations. In addition, those results were not different when excluding premenopausal women.
Fig. 1.
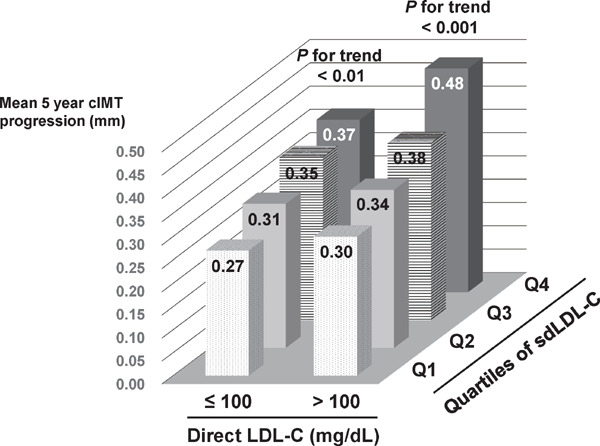
Relationship between cIMT progression and serum sdLDL-C levels
This figure shows cIMT progression levels by sdLDL-C quartiles and LDL-C levels. Subjects were divided into a low LDL-C group (LDL-C ≤ 100 mg/dL) and a high LDL-C group (LDL-C > 100 mg/dL); they were then stratified into four groups according to sdLDL-C quartiles. cIMT levels were adjusted for standard CVD risk factors using least square methods. Jonckheere-Terpstra trend tests were performed to assess the associations between mean cIMT progressions and sdLDL-C quartiles. Mean cIMT progressions in both the low and high LDL-C groups significantly increased in accordance with higher sdLDL-C quartiles (P for trend < 0.01 and < 0.001, respectively). Among the low LDL-C group, individuals with the highest sdLDL-C quartile had significantly increased cIMT levels than those with the lowest sdLDL-C quartile (P < 0.05), but this was not the case for those with 2nd and 3rd sdLDL-C quartiles. Among the high LDL-C group, individuals with the highest sdLDL-C quartile had significantly increased cIMT levels than those with all other sdLDL-C quartiles (all P < 0.05). Individuals with the highest sdLDL-C quartile in the high LDL-C group had significantly increased cIMT levels than those with all other groups (all P < 0.05).
cIMT, carotid intimal medial thickness; sdLDL-C, small dense low-density lipoprotein cholesterol; LDL-C, low-density lipoprotein cholesterol; CVD, cardiovascular disease.
3.5 sdLDL-C/LDL-C Ratios and cIMT Progressions
We also assessed the association of sdLDL-C/LDL-C ratios with cIMT progressions, stratified by direct LDL-C levels (direct LDL-C ≤ 100mg/dL and > 100 mg/dL) (Fig. 2). In these analyses, the mean cIMT change levels were adjusted for standard CVD risk factors as shown in Fig. 1. For sdLDL-C/LDL-C ratio, the mean cIMT progression significantly increased in the group with direct LDL-C levels > 100 mg/dL, in accordance with higher sdLDL-C/LDL-C ratio quartiles (P for trend < 0.001); however, there was no significant association between sdLDLC/LDL-C ratio quartiles and cIMT progression in the group with direct LDL-C levels ≤ 100 mg/dL (P for trend = 0.18). Only the group with direct LDL-C levels > 100 mg/dL and the highest sdLDL-C/LDL-C ratio quartile had significantly increased cIMT levels than those in all other groups (all P < 0.05). There were no significant differences for cIMT progression among other groups. Adding TG to the controlling factors did not change those correlations. In addition, those results were not different when excluding premenopausal women.
Fig. 2.
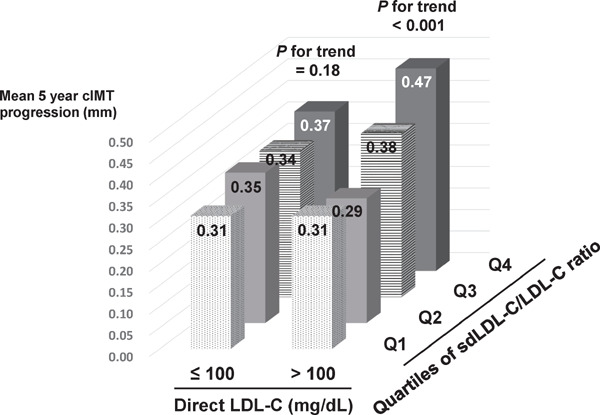
Relationship between cIMT progression and sdLDL-C/LDL-C ratios
This figure shows cIMT progression levels by sdLDL-C/LDL-C ratio quartiles and LDL-C levels. Subjects were divided to a low LDL-C group (LDL-C ≤ 100 mg/dL) and a high LDL-C group (LDL-C > 100 mg/dL); they were then stratified into four groups according to sdLDL-C/LDL-C ratio quartiles. cIMT levels were adjusted for standard CVD risk factors using least square methods. Jonckheere-Terpstra trend tests were performed to assess the associations between mean cIMT progressions and sdLDL-C quartiles. Mean cIMT progression significantly increased in accordance with higher sdLDL-C/LDL-C ratio quartiles only in the high LDL-C group (P for trend < 0.001); however, there was no significant association between sdLDL-C/LDL-C ratio and cIMT progression in the low LDL-C group. Individuals with the highest sdLDL-C/LDL-C ratio quartile in the high LDL-C group had significant increased cIMT levels than those with all other groups (all P < 0.05).
cIMT, carotid intimal medial thickness; sdLDL-C, small dense low-density lipoprotein cholesterol; LDL-C, low-density lipoprotein cholesterol; CVD, cardiovascular disease.
4. Discussion
CVD remains one of the leading causes of death and disability in the world1), and cIMT levels are thought to be a good surrogate marker22–24). Thus, understanding risk factors for cIMT progression may be helpful for formulating an optimal therapy for CVD prevention. In the current study, we examined the association between atherogenic lipoproteins levels and cIMT changes in a general Japanese prospective observational study cohort, with five years of follow-up, using automated homogeneous sdLDL-C, direct LDL-C, LDL-TG, Lp(a), and HDL3-C assays. Elevated plasma sdLDL-C and direct LDL-C levels, and sdLDL-C/LDL-C ratio were significantly associated with cIMT progression after controlling for standard CVD risk factors (estimated values were 0.227, 0.306, and 0.455, respectively). Moreover, even in subjects with direct LDL-C levels less than 100 mg/dL, only elevated sdLDL-C levels were significantly associated with cIMT progression (P for trend < 0.01). It is well known that sdLDL-C is related to TG, and lipid profiles may differ between pre- and postmenopausal women; however, our results did not change by adding TG to controlling factors or excluding premenopausal women.
Elevated LDL-C levels are associated with CVD events3), and lowering LDL-C, along with lifestyle modifications and treatment modalities, has reduced CVD risk41). In addition, increased LDL-C levels are also associated with atherosclerosis development25–27). Recent recommendations indicate that LDL-C targets should be < 100 mg/dL in high risk subjects and < 70 mg/dL in CVD patients, similar to prior recommendations42–44). Moreover, we have previously demonstrated direct LDL-C is superior to calculated LDL-C for predicting CVD incidence in Framingham Offspring Study38). Therefore, direct measurements of LDL-C levels are important for CVD risk assessment and therapy formulation. In the present study, direct LDL-C levels had significant correlation with cIMT progression over a five-year follow-up period, even after controlling for standard CVD risk factors, although calculated LDL-C levels did not. Our results are consistent with the concept that an elevated direct LDL-C level is a predictive marker for CVD.
Small dense LDL-C is one of two LDL-C subfractions; the other one is lbLDL-C. There are a large amount of data supporting the concept sdLDL-C is a more atherogenic lipoprotein particle for CVD events than lbLDL-C16–20). Small dense LDL is a smaller lipoprotein particle and binds with lower affinity to the LDL receptor, which results in sdLDL having a substantially longer plasma residence time than lbLDL, potentially leading to increased deposition in the arterial wall45). Moreover, sdLDL can promote LDL modification because it has a high binding affinity with proteoglycans46). In the present study, all the atherogenic lipoproteins were assessed. SdLDL-C showed the strongest association with cIMT progression after controlling for standard CVD risk factors. Moreover sdLDL-C levels were correlated with adjusted cIMT progression whether LDL-C levels less than 100 mg/dL or greater than 100 mg/dL. These data are consistent with the concept that sdLDL-C is a more atherogenic lipoprotein than lbLDL-C. Ratios of sdLDL-C to LDL-C also provide some information to predict CVD risk; however, sdLDL-C/LDL-C ratios were associated with cIMT progression only in the individuals with LDL-C levels greater than 100 mg/dL. Previously sdLDL-C levels were measured by gradient gel electrophoresis. However, the assessment of LDL particles using gradient gel electrophoresis is time-consuming and not reproducible. Recently, a homogeneous automated assay for measuring sdLDL-C has been developed15), and many studies that used this assay have demonstrated the strong association between the elevated sdLDL-C levels and CVD18–20). In this study, both within- and between-run coefficients of variant for sdLDL-C assays were less than 5.0 %. Thus we believe sdLDL-C should be measured in patients at high CVD risk, as well as those with established CVD.
There are some limitations in this study. The cohort size was relatively small, and all participants were native Japanese. Thus, a larger study with various ethnicities will be necessary to confirm our findings. In addition, direct sdLDL-C measurement are not widely available in Japan. It is necessary to promote direct sdLDL-C measurement's clinical usefulness in preventive healthcare medicine. Moreover, the subjects included in this study received no cholesterol lowering medications during the baseline and follow-up surveys. We have to assess whether lowering sdLDL-C levels modulates cIMT levels in a study including subjects receiving cholesterol lowering medications.
5. Conclusions
In conclusion, both LDL-C and sdLDL-C levels measured with homogenous automated assays were significantly associated with cIMT progression, and sdLDL-C had a stronger relationship with cIMT progression than LDL-C. Our results support the concept that direct sdLDL-C and LDL-C should be measured in subjects with high CVD risk as well as those with established CVD in order to formulate an optimal therapy for CVD prevention.
Acknowledgement
The authors thank Katalin V. Horvath for excellent technical assistance and Drs. Mosaburo Kainuma, Eiichi Ogawa, Kazuhiro Toyota, Koji Takayama, Fujiko Kaseida-Mitsumoto, Satoshi Hiramine, Kazuya Ura, and Ayaka Komori for their efforts in collecting data and checking the questionnaires. The authors also appreciate Denka-Seiken Co., Ltd. for kindly providing their lipoprotein assay kits.
Abbreviations
- CVD
cardiovascular disease
- HDL-C
high-density lipoprotein cholesterol
- LDL-C
low-density lipoprotein cholesterol
- sdLDL-C
small dense low-density lipoprotein cholesterol
- lbLDL-C
large buoyant low-density lipoprotein cholesterol
- cIMT
carotid intimal medial thickness
- KOPS
Kyushu and Okinawa Population Study
- hsCRP
high sensitivity C reactive protein
- LDL-TG
low-density lipoprotein triglycerides
- Lp(a)
lipoprotein(a)
Disclosure of Conflict of Interest
The authors have nothing to declare with regard to conflict of interest.
Grant Supports
This study was funded by the Japan Multi-Institutional Collaborative Cohort Study (J-MICC Study), Grants-in-Aid for Scientific Research on Priority Areas of Cancer [No. 17015018] and Innovative Areas [No. 221S0001] and by JSPS KAKENHI Grants [No. 16H06277] from the Japanese Ministry of Education, Culture, Sports, Science and Technology. H.I. was supported by the Japan Heart Foundation/Bayer Yakuhin Research Grant Abroad Program, Tokyo, Japan and Denka Seiken Co., Ltd., Niigata, Japan. E.J.S. and B.F.A. were supported by the U.S. Department of Agriculture - Agricultural Research Service under Specific Cooperative Agreements #58-1950-0-014 and #58-1950-4-003, and Project Grant P50 HL083813-01 from the National Institutes of Health.
Authors' Contributions
H.I., E.J.S., N.F., M.M., and J.H. designed and conducted this study. H.I., N.F., M.M., and J.H. collected data and samples. H.I., Y.Y., and B.F.A. performed the experiments. H.I., E.J.S., and N.F. analyzed the data and contributed to writing the paper. All authors critically revised the manuscript for important intellectual content and approved the final version of the manuscript.
References
- 1). Global Health Estimates 2016: Deaths by Cause, Age, Sex, by Country and by Region, 2000–2016. Geneva, World Health Organization; 2018 [Google Scholar]
- 2). Goff DC, Jr, Lloyd-Jones DM, Bannett G, Coady S, D'Agostino RB, Sr, Gibbons R, Greenland P, Lackland DT, Levy D, O'Donnell CJ, Robinson JG, Schwartz JS, Shero ST, Smith SC, Jr, Sorlie P, Stone NJ, Wilson PW, American College of Cardiology/American Heart Association Task Force on Practice Guidelines AHA/ACC guideline on the assessment of cardiovascular risk: a report of the American College of Cardiology/American Heart Association Task Force on Practice Guidelines. J Am Coll Cardiol, 2014; 63: 2935-2959 [DOI] [PMC free article] [PubMed] [Google Scholar]
- 3). Lloyd-Jones DM, Morris PB, Ballantyne CM, Birtcher KK, Daly DD, Jr., DePalma SM, Minissian MB, Orringer CE, Smith SC., Jr. 2017 Focused Update of the 2016 ACC Expert Consensus Decision Pathway on the Role of Non-Statin Therapies for LDL-Cholesterol Lowering in the Management of Atherosclerotic Cardiovascular Disease Risk: A Report of the American College of Cardiology Task Force on Expert Consensus Decision Pathways. J Am Coll Cardiol, 2017; 70: 1785-1822 [DOI] [PubMed] [Google Scholar]
- 4). Friedewald WT, Levy RI, Fredrickson DS. Estimation of the concentration of low density lipoprotein cholesterol in plasma, without use of the preparative ultracentrifuge. Clin Chem, 1972; 18: 499-502 [PubMed] [Google Scholar]
- 5). Martin SS, Blaha MJ, Elshazly MB, Toth PP, Kwiterovich PO, Blumenthal RS, Jones SR. Comparison of a novel method vs the Friedewald equation for estimating low-density lipoprotein cholesterol levels from the standard lipid profile. JAMA, 2013; 310: 2061-2068 [DOI] [PMC free article] [PubMed] [Google Scholar]
- 6). McNamara JR, Cohn JS, Wilson PW, Schaefer EJ. Calculated values for low-density lipoprotein cholesterol in the assessment of lipid abnormalities and coronary disease risk. Clin Chem, 1990; 36: 36-42 [PubMed] [Google Scholar]
- 7). Okada M, Matsui H, Ito Y, Fujiwara A, Inano K. Low density lipoprotein cholesterol can be chemically measured; a new superior method. J Lab Clin Med, 1998; 132: 195-201 [DOI] [PubMed] [Google Scholar]
- 8). Sakaue T, Hirano T, Yoshino G, Sakai K, Takeuchi H, Adachi M. Reactions of direct LDL-cholesterol assays with pure LDL fraction and IDL: comparison of three homogeneous methods. Clin Chim Acta, 2000; 295: 97-106 [DOI] [PubMed] [Google Scholar]
- 9). Otokozawa S, Ai M, Asztalos BF, White CC, Demissie-Banjaw S, Cupples LA, Nakajima K, Wilson PW, Schaefer EJ. Direct assessment of plasma low density lipoprotein and high density lipoprotein cholesterol. Atherosclerosis, 2010; 213: 251-255 [DOI] [PMC free article] [PubMed] [Google Scholar]
- 10). Griffin BA. Lipoprotein atherogenicity: an overview of current mechanisms. Proc Nutr Soc, 1999; 58: 163-169 [DOI] [PubMed] [Google Scholar]
- 11). Campos H, Genest JJ, Blijlevens E, McNamara JR, Jenner JL, Ordovas JM, Wilson PW, Schaefer EJ. Low density lipoprotein particle size and coronary artery disease. Arterioscler Thromb, 1992; 12: 187-195 [DOI] [PubMed] [Google Scholar]
- 12). McNamara JR, Jenner JL, Li Z, Wilson PWF, Schaefer EJ. Change in low density lipoprotein particle size in associated with change in plasma triglyceride concentration. Arterioscler Thromb, 1992; 12: 1284-1290 [DOI] [PubMed] [Google Scholar]
- 13). Campos H, Blijlevens E, McNamara JR, Ordovas JM, Wilson PWF, Schaefer EJ. LDL particle size distribution: results from the Framingham Offspring Study. Arterioscler Thromb, 1992; 12: 1410-1419 [DOI] [PubMed] [Google Scholar]
- 14). Hirano T, Ito Y, Saegusa H, Yoshino G. A novel and simple method for quantification of small dense LDL. J Lipid Res, 2003; 44: 2193-2201 [DOI] [PubMed] [Google Scholar]
- 15). Ito Y, Fujimura M, Ohta M, Hirano T. Development of a homogeneous assay for measurement of small dense LDL cholesterol. Clin Chem, 2011; 57: 57-65 [DOI] [PubMed] [Google Scholar]
- 16). Koba S, Yokota Y, Hirano T, Ito Y, Ban Y, Tsunoda F, Sato T, Shoji M, Suzuki H, Geshi E, Kobayashi Y, Katagiri T. Small LDL-cholesterol is superior to LDL-cholesterol for determining severity of coronary atherosclerosis. J Atheroscler Thromb, 2008; 15: 250-260 [DOI] [PubMed] [Google Scholar]
- 17). Ai M, Otokozawa S, Asztalos BF, Ito Y, Nakajima K, White CC, Cupples LA, Wilson PW, Schaefer EJ. Small dense LDL cholesterol and coronary heart disease: results from the Framingham Offspring Study. Clin Chem, 2010; 56: 967-976 [DOI] [PMC free article] [PubMed] [Google Scholar]
- 18). Arai H, Kokubo Y, Watanabe M, Sawamura T, Ito Y, Minagawa A, Okamura T, Miyamato Y. Small dense low-density lipoproteins cholesterol can predict incident cardiovascular disease in an urban Japanese cohort: the Suita study. J Atheroscler Thromb, 2013; 20: 195-203 [DOI] [PubMed] [Google Scholar]
- 19). Hoogeveen RC, Gaubatz JW, Sun W, Dodge RC, Crosby JR, Jiang J, Couper D, Virani SS, Kathiresan S, Boerwinkle E, Ballantyne CM. Small dense low-density lipoprotein-cholesterol concentrations predict risk for coronary heart disease: the Atherosclerosis Risk In Communities (ARIC) study. Arterioscler Thromb Vasc Biol, 2014; 34: 1069-1077 [DOI] [PMC free article] [PubMed] [Google Scholar]
- 20). Tsai MY, Steffen BT, Guan W, McClelland RL, Warnick R, McConnell J, Hoefner DM, Remaley AT. New automated assay of small dense low-density lipoprotein cholesterol identifies risk of coronary heart disease: the Multi-Ethnic Study of Atherosclerosis. Arterioscler Thromb Vasc Biol, 2014; 34: 196-201 [DOI] [PMC free article] [PubMed] [Google Scholar]
- 21). Hsu SHJ, Jang MH, Torng PL, Su TC. Positive association between small dense low-density lipoprotein cholesterol concentration and biomarkers of inflammation, thrombosis, and prediabetes in non-diabetic adults. J Atheroscler Thromb, 2019; 26: 624-635 [DOI] [PMC free article] [PubMed] [Google Scholar]
- 22). Burke GL, Evans GW, Riley WA, Sharrett AR, Howard G, Barnes RW, Rosamond W, Crow RS, Rautaharju PM, Heiss G. Arterial wall thickness is associated with prevalent cardiovascular disease in middle-aged adults. The Atherosclerosis Risk in Communities (ARIC) Study. Stroke, 1995; 26: 386-391 [DOI] [PubMed] [Google Scholar]
- 23). Raitakari OT, Juonala M, Kähönen M, Taittonen L, Laitinen T, Mäki-Torkko N, Järvisalo MJ, Uhari M, Jokinen E, Rönnemaa T, Akerblom HK, Viikari JS. Cardiovascular risk factors in childhood and carotid artery intima-media thickness in adulthood: the Cardiovascular Risk in Young Finns Study. JAMA, 2003; 290: 2277-2283 [DOI] [PubMed] [Google Scholar]
- 24). Iino H, Okano T, Daimon M, Sasaki K, Chigira M, Nakano T, Mizuno Y, Yamazaki T, Kurano M, Yatomi Y, Sumi Y, Sasano T, Miyata T. Usefulness of carotid arterial strain values for evaluating the arteriosclerosis. J Atheroscler Thromb, 2019; 26: 476-487 [DOI] [PMC free article] [PubMed] [Google Scholar]
- 25). Castelli WP, Anderson K, Wilson PW, Levy D. Lipids and risk of coronary heart disease. The Framingham Study. Ann Epidemiol, 1992; 2: 23-28 [DOI] [PubMed] [Google Scholar]
- 26). Amarenco P, Labreuche J, Lavallée P, Touboul PJ. Statins in stroke prevention and carotid atherosclerosis: systematic review and up-to-date meta-analysis. Stroke, 2004; 35: 2902-2909 [DOI] [PubMed] [Google Scholar]
- 27). Steffen BT, Guan W, Remaley AT, Stein JH, Tattersall MC, Kaufman J, Tsai MY. Apolipoprotein B is associated with carotid atherosclerosis progression independent of individual cholesterol measures in a 9-year prospective study of Multi-Ethnic Study of Atherosclerosis participants. J Clin Lpidol, 2017; 11: 1181-1191 [DOI] [PMC free article] [PubMed] [Google Scholar]
- 28). Maeda S, Nakanishi S, Yoneda M, Awaya T, Yamane K, Hirano T, Kohno N. Associations between small dense LDL, HDL subfractions (HDL2, HDL3) and risk of atherosclerosis in Japanese-Americans. J Atheroscler Thromb, 2012; 19: 444-452 [DOI] [PubMed] [Google Scholar]
- 29). Lamprea-Montealegre JA, Astor BC, McClelland RL, de Boer IH, Burke GL, Sibley CT, O'Leary D, Sharrett AR, Szklo M. CKD, plasma lipids, and common carotid intima-media thickness: results from the multi-ethnic study of atherosclerosis. Clin J Am Soc Nephrol, 2012; 7: 1777-1785 [DOI] [PMC free article] [PubMed] [Google Scholar]
- 30). Gentile M, Panico S, Mattiello A, Ubaldi S, Iannuzzo G, De Michele M, Iannuzzi A, Rubba P. Association between small dense LDL and early atherosclerosis in a sample of menopausal women. Clin Chim Acta, 2013; 426: 1-5 [DOI] [PubMed] [Google Scholar]
- 31). Aoki T, Yagi H, Sumino H, Tsunekawa K, Araki O, Kimura T, Nara M, Ogiwara T, Nakajima K, Murakami M. Relationship between carotid artery intimamedia thickness and small dense low-density lipoprotein cholesterol concentrations measured by homogenous assay in Japanese subjects. Clin Chim Acta, 2015; 442: 110-114 [DOI] [PubMed] [Google Scholar]
- 32). Furusyo N, Koga T, Ai M, Otokozawa S, Kohzuma T, Ikezaki H, Schaefer EJ, Hayashi J. The serum undercarboxylated osteocalcin level and the diet of a Japanese population: Results from the Kyushu and Okinawa Population Study (KOPS). Endocrine, 2013; 43: 635-642 [DOI] [PubMed] [Google Scholar]
- 33). Ikezaki H, Furusyo N, Jacques PF, Shimizu M, Murata M, Schaefer EJ, Urita Y, Hayashi J. Higher dietary cholesterol and ω-3 fatty acid intakes are associated with a lower success rate of Helicobacter pylori eradication therapy in Japan. Am J Clin Nutri, 2017; 106: 581-588 [DOI] [PubMed] [Google Scholar]
- 34). Ikezaki H, Ai M, Schaefer EJ, Otokozawa S, Asztalos BF, Nakajima K, Zhou Y, Liu CT, Jacques PF, Cupples LA, Furusyo N. Cardiovascular disease prevalence and insulin resistance in the Kyushu-Okinawa Population Study and the Framingham Offspring Study. J Clin Lipidol, 2017; 11: 348-356 [DOI] [PubMed] [Google Scholar]
- 35). Ito Y, Ohta M, Ikezaki H, Hirano Y, Machida A, Schaefer EJ, Furusyo N. Development and Population Results of a Fully Automated Homogeneous Assay for LDL Triglyceride. J App Lab Med, 2018; 2: 746-756 [DOI] [PubMed] [Google Scholar]
- 36). Lamon-Fava S, Marcovina SM, Albers JJ, Kennedy H, Deluca C, White CC, Cupples LA, McNamara JR, Seman LJ, Bongard V, Schaefer EJ. Lipoprotein(a) levels, apo(a) isoform size, and coronary heart disease risk in the Framingham Offspring Study. J Lipid Res, 2011; 52: 1181-1187 [DOI] [PMC free article] [PubMed] [Google Scholar]
- 37). Ito Y, Satoh N, Ishii T, Kumakura J, Hirano T. Development of a homogeneous assay for measurement of high-density lipoprotein-subclass cholesterol. Clin Chim Acta, 2014; 427: 86-93 [DOI] [PubMed] [Google Scholar]
- 38). Ikezaki H, Fisher VA, Lim E, Ai M, Liu CT, Cupples LA, Nakajima K, Asztalos BF, Furusyo N, Schaefer EJ. Direct versus calculated low-density lipoprotein cholesterol and C reactive protein in cardiovascular disease risk assessment in the Framingham Offspring Study. Clin Chem, 2019; 65: 1102-1114 [DOI] [PubMed] [Google Scholar]
- 39). Yanase T, Nasu S, Mukuta Y, Shimizu Y, Nishihara T, Okabe T, Nomura M, Inoguchi T, Nawata H. Evaluation of a new carotid intima-media thickness measurement by B-mode ultrasonography using an innovative measurement software, intimascope. Am J Hypertens, 2006; 19: 1206-1212 [DOI] [PubMed] [Google Scholar]
- 40). Wada S, Koga M, Toyoda K, Minematsu K, Yasaka M, Nagai Y, Aoki S, Nezu T, Hosomi N, Kagimura T, Origasa H, Kamiyama K, Suzuki R, Ohtsuki T, Maruyama H, Kitagawa K, Uchiyama S, Matsumoto M, the Japan Statin Treatment Against Recurrent Stroke (J-STARS) Echo Study Collaborators Factors associated with intima-media complex thickness of the common carotid artery in Japanese noncardioembolic stroke patients with hyperlipidemia: The J-STARS Echo Study. J Atheroscler Thromb, 2018; 25: 359-373 [DOI] [PMC free article] [PubMed] [Google Scholar]
- 41). Silverman MG, Ference BA, Im K, Wiviott SD, Giugliano RP, Grundy SM, Braunwald E, Sabatine MS. Association Between Lowering LDL-C and Cardiovascular Risk Reduction Among Different Therapeutic Interventions: A Systematic Review and Meta-analysis. JAMA, 2016; 316: 1289-1297 [DOI] [PubMed] [Google Scholar]
- 42). Writing Committee. Lloyd-Jones DM, Morris PB, Ballantyne CM, Birtcher KK, Daly DD, Jr, DePalma SM, Minissian MB, Orringer CE, Smith SC., Jr 2016 ACC Expert Consensus Decision Pathway on the Role of Non-Statin Therapies for LDL-Cholesterol Lowering in the Management of Atherosclerotic Cardiovascular Disease Risk: A Report of the American College of Cardiology Task Force on Clinical Expert Consensus Documents. J Am Coll Cardiol, 2016; 68: 92-125 [DOI] [PubMed] [Google Scholar]
- 43). Jacobson TA, Ito MK, Maki KC, Orringer CE, Bays HE, Jones PH, McKenney JM, Grundy SM, Gill EA, Wild RA, Wilson DP, Brown WV. National lipid association recommendations for patient-centered management of dyslipidemia: part 1--full report. J Clin Lipidol, 2015; 9: 129-169 [DOI] [PubMed] [Google Scholar]
- 44). Expert Dyslipidemia Panel of the International Atherosclerosis Society Panel members. An International Atherosclerosis Society Position Paper: global recommendations for the management of dyslipidemia - full report. J Clin Lipidol, 2014; 8: 29-60 [DOI] [PubMed] [Google Scholar]
- 45). Thongtang N, Diffenderfer MR, Ooi EM, Barrett PHR, Turner SM, Le NA, Brown WV, Schaefer EJ. Metabolism and proteomics of large and small dense LDL in combined hyperlipidemia. Effects of rosuvastatin. J Lipid Res, 2017; 58: 1315-1324 [DOI] [PMC free article] [PubMed] [Google Scholar]
- 46). Hurt-Camejo E, Olsson U, Wiklund O, Bondjers G, Camejo G. Cellular consequences of the association of apoB lipoproteins with proteoglycans. Potential contribution to atherogenesis. Arterioscler Thromb Vasc Biol, 1997; 17: 1011-1017 [DOI] [PubMed] [Google Scholar]