Abstract
Aims: To investigate the differentially expressed genes (DEGs) and molecular interaction in unstable atherosclerotic carotid plaques.
Methods: Gene expression datasets GSE41571, GSE118481, and E-MTAB-2055 were analyzed. Co-regulated DEGs in at least two datasets were analyzed with the enrichment of Gene Ontology Biological Process (GO-BP), Kyoto Encyclopedia of Genes and Genomes (KEGG), protein-protein interaction (PPI) networks, interrelationships between miRNAs/transcriptional factors, and their target genes and drug-gene interactions. The expression of notable DEGs in human carotid artery plaques and plasma was further identified.
Results: The GO-BP enrichment analysis revealed that genes associated with inflammatory response, and extracellular matrix organization were altered. The KEGG enrichment analysis revealed that upregulated DEGs were enriched in the tuberculous, lysosomal, and chemokine signaling pathways, whereas downregulated genes were enriched in the focal adhesion and PI3K/Akt signaling pathway. Collagen type I alpha 2 chain (COL1A2), adenylate cyclase 3 (ADCY3), C-X-C motif chemokine receptor 4 (CXCR4), and TYRO protein tyrosine kinase binding protein (TYROBP) might play crucial roles in the PPI networks. In drug–gene interactions, colony-stimulating factor-1 receptor had the most drug interactions. Insulin-like growth factor binding protein 6 (IGFBP6) was markedly downregulated in unstable human carotid plaques and plasma. Under a receiver operating characteristic curve analysis, plasma IGFBP6 had a significant discriminatory power (AUC, 0.894; 95% CI, 0.810–0.977), with a cutoff value of 142.08 ng/mL.
Conclusions: The genes COL1A2, ADCY3, CXCR4, and TYROBP are promising targets for the prevention of unstable carotid plaque formation. IGFBP6 may be an important biomarker for predicting vulnerable plaques.
Keywords: Atherosclerosis, Cerebrovascular stroke, Carotid stenosis, Pathway analysis, Signal transduction, Gene expression, Insulin-like growth factor binding protein 6
Introduction
Stroke is the third leading cause of mortality and the major cause of crippling in developed countries1). Carotid atherosclerotic plaques are one of the leading causes of ischemic cerebral stroke2). Advanced carotid atheroma may develop into unstable plaques, characterized by a tendency to rupture, which is a major source of local thrombosis or embolus. Preventing the formation of unstable plaque, rather than intervening on the formed, unstable plaques, is also essential for preventing stroke. Unstable plaques have distinguishing characteristics, such as decreased content of the fibrous cap, increased necrotic core, and intraplaque hemorrhage. The balance between the fibrous cap and necrotic core may be disturbed by impaired cellular behavior and increased inflammatory–immune responses3). Moreover, several genes, such as YKL-404) and interferon regulatory factor 5 5), have been implicated in unstable plaque formations. However, a comprehensive and pleiotropic understanding of the formation of unstable plaques is lacking. A clarification of the biological processes and pathways associated with the formation of vulnerable plaques will be useful and may reveal targets for drugs that can be used to prevent stroke.
Gene expression profiling, such as microarray and RNA sequencing, maybe used to explore differentially expressed genes (DEGs) and molecular mechanisms involved in atherosclerosis. Sequencing techniques, combined with bioinformatics analysis, can be used to define the relationships between DEGs and biological processes and the complex interacting networks of transcriptional factors (TFs), microRNAs (miRNAs), and proteins6). Several studies on gene profiling combined with bioinformatics analysis have been conducted on stable and unstable carotid atherosclerotic plaques. Wang et al.7) have reported that differentially expressed collagen type III alpha 1 chain (COL3A1), collagen type I alpha 2 chain (COL1A2), asporin (ASPN), and pre-platelet basic protein may play crucial roles in the formation of unstable plaques, as revealed through a bioinformatics analysis. A microarray-based study8) revealed that chemokine (C-C motif) ligand 19 (CCL19) is upregulated in unstable carotid atherosclerotic plaques. However, the study analyzed datasets individually, which may introduce biases because of the heterogeneity of selected datasets and patient cohorts, and the results could be inconsistent among various high-throughput platforms. Thus, an overall bioinformatics analysis of multiple related gene expression datasets is needed.
In this study, we used integrated bioinformatics methods to analyze datasets GSE41571, GSE118481, and E-MTAB-2055. DEG screening, Gene Ontology Biological Process (GO-BP), Kyoto Encyclopedia of Genes and Genomes (KEGG) enrichment analysis, protein–protein interactions (PPIs), prediction of the interaction relationship between TF/miRNA and DEGs, and a study of drug–gene interactions was performed. We also used human carotid plaques obtained during carotid endarterectomies to verify the co-regulated DEGs and hub genes in the PPI networks. Through these analyses, we explored the gene markers that may predict unstable plaques and become promising targets for inhibiting the formation of unstable plaques.
Materials and Methods
Data Set Selection
Eligible microarray data sets were downloaded from Gene Expression Omnibus (GEO, http://www.ncbi.nlm.nih.gov/geo) and the European Bioinformatics Institute (EBI, https://www.ebi.ac.uk) databases. GEO and EBI are functional genomics databases, which include sequencing and microarray data, that are available to the public. The inclusion standards of microarray data were as follows: 1) Data sets were composed of expression profiles in patients with stable and unstable carotid atherosclerotic plaques published in the past 10 years. 2) Stable and unstable plaques were defined in accordance with clinical (symptomatic or asymptomatic) or histologic criteria8). 3) Data sets were raw. We excluded datasets of animal samples, serums, or plasma samples and those of patients with diabetes.
Data Source
GSE41571 and GSE118481 were downloaded from the GEO database, and E-MTAB-2055 was downloaded from the EBI database. GSE41571, containing five ruptured and six stable carotid atherosclerotic plaques, was measured at the platform of GPL5175 [HuEx-1_0-st] Affymetrix Human Exon 1.0 ST Array [transcript (gene) version]. E-MTAB-2055, including 25 ruptured and 22 stable plaques, was assayed at the platform of A-MEXP-931-Illumina Human Ref-8 v2 Expression Bead Chip. GSE118481, including 10 clinical unstable and 6 stable carotid atherosclerotic plaques, was measured on the platform of GPL10558, Illumina Human HT-12 V4.0 expression bead chip. The profiling construction of the three datasets was authorized by the local research ethics committee.
Data Preprocessing
After downloading, the raw data of GSE41571 were read with affy in R package9) (version1.50.0, http://www.bioconductor.org/packages/release/bioc/html/affy.html) and linear models for microarray data (LIMMA) package10) (version 3.10.3, http://www.bioconductor.org/packages/2.9/bioc/html/limma.html). E-MTAB-2055 and GSE118481 were read with the LIMMA package10). The three datasets were processed via the robust multi-array average method (background correction, normalization, and expression calculation)11). In accordance with the annotation profile provided by the platform, probes were annotated and non-matched probes were abandoned. When multiple probes were mated to one gene symbol, the final expression of the gene was defined as the mean values of multiple probes.
Co-Regulated DEGs Screening
Using the LIMMA package (version 3.30.3), we identified DEGs. For microarray data, classical Bayesian method was used in the linear models. The Benjamini–Hochberg methods were used to adjust the P-value, followed by a calculation of a false discovery rate (FDR) of the P-value. DEGs were defined as genes with FDR < 0.05 and |log2 fold change (FC)| > 0.585. The co-regulated DEGs were the intersection of at least two datasets and were selected with the online drawing tool VENNY12) (version 2.1.0, http://bioinfogp.cnb.csic.es/tools/venny/index.html).
GO and KEGG Enrichment Analyses
The GO-BP13) and KEGG14) pathway enrichment analyses of the co-regulated DEGs were performed through the online tool Database for Annotation, Visualization, and Integrated Discovery (DAVID)15) (version 6.8, https://david-d.ncifcrf.gov/). The upregulated and downregulated DEGs enriched in the GO-BP and KEGG pathways were visualized using the ClueGO plugin16) (version 2.2.6, http://apps.cytoscape.org/apps/ClueGO) of Cytoscape® software (version 3.2.0, http://www.cytoscape.org/)17). The thresholds were as follows: enriched gene count ≥ 2 and P-value < 0.05.
PPI Network Analysis
The Search Tool for the Retrieval of Interacting Genes/Proteins (STRING)18) (version10.0, http://string-db.org/) database was used to predict the PPIs of proteins encoded by the co-regulated DEGs. The threshold value of the PPIs was ≥ 0.7 (high confidence). Cytoscape® software was used to construct and visualize the PPIs. Hub genes that had a connectivity degree > 12 were selected for experimental verification.
Subnet Module Analysis
Single gene tends to interact with other genes, which facilitates their playing regulatory roles. Encoded proteins from the same module tend to act as a module to fulfill the same biological role and function. The plugin of multi-contrast delayed enhancement19) (version1.4.2, http://apps.cytoscape.org/apps/MCODE) in Cytoscape® was used to subnet analyze the most evident clustered PPI networks, with a threshold score > 5. The GO and KEGG enrichment analyses of modules from each subnet module were performed with DAVID15).
Prediction of TF/miRNA Target Regulatory Networks
The TF or miRNA was predicted through Web-Gestalt 20) (http://www.webgestalt.org/option.php). The interacting relationships between TFs or miRNAs and all targeted DEGs in significantly clustered modules were predicted with an overrepresentation enrichment analysis (http://amp.pharm.mssm.edu/Enrichr/) (enriched gene count ≥ 2 and P-value < .05). We constructed and visualized miRNAs or TF target regulatory networks using the Cytoscape® software.
Prediction of Drug–Gene Interactions
To explore the genes that are preferentially targeted for drug development, we used the drugs potentially targeted on the co-regulated DEGs and the genes in the regulatory networks with the Drug-Gene Interaction Database21) (http://www.dgidb.org/). All the drug–gene interactions were predicted with the parameters set to “all default.” The Cytoscape® software was used to construct the networks of drug–gene interactions.
Patients' Characteristics and Sample Collection
Between August 2017 and April 2019, 54 consecutive patients from the Department of Vascular and Endovascular Surgery of Changzheng Hospital, Shanghai, China, with high-grade carotid artery stenosis (> 50% stenosis according to the North American Symptomatic Carotid Endarterectomy criteria) and who were treated with carotid endarterectomy were enrolled. Atherosclerotic plaques were obtained during the procedures, and intact pieces of plaques were cut into two parts, with one part stored in 4% paraformaldehyde for histology and immunohistochemistry and another part frozen in liquid nitrogen for RNA extraction. The plaques were classified as stable or unstable, in accordance with the clinical and histology standards as described8). The clinical criteria for the unstable plaques were the onset of transient ischemic attack, stroke, or amaurosis fugax within 6 months before the carotid endarterectomy. Histologic features were analyzed with a semiquantitative grading scale in accordance with the American Heart Association22). Plasma was available from 52 patients, of which 28 had histologically stable plaques and 24 had unstable plaques. The verification experiments were approved by the local ethics committee, and consent for participation in the study was obtained from all patients.
Histology and Immunohistochemistry
Carotid atherosclerotic plaques were embedded in paraffin and serially sectioned at 5 µm thick. The sections were stained with hematoxylin–eosin and Masson's trichrome. Immunohistochemistry was performed to assess acute inflammation, chronic inflammation, neovascularization, insulin-like growth factor binding protein 6 (IGFBP6) protein expression, and vascular smooth muscle cells in plaque. The primary antibodies were antibodies to CD68 (1:200, Abcam, USA), CD3 (1:100, Abcam, USA) and CD31 (1:50, Abcam, USA), IGFBP6 (1:100, Abcam, USA), and α -SMA (1:500, Acam, USA). The sections were reacted with horseradish peroxidase-labeled secondary antibodies and then reacted with diaminobenzidine. IGFBP6-positive areas in the plaques were calculated in five randomized fields with 10× magnification.
Quantitative Real-Time PCR (qRT-PCR)
Total RNA was extracted from 10–50 µg plaques with Trizol (QIAGEN, Germany) and reverse-transcribed into cDNA with miScript Reverse Transcription Kit (QIAGEN, Germany). qRT-PCR was performed with miScript SYBR Green PCR kit (QIAGEN, Germany). Gene expression was measured with qRT-PCR on a Light Cycler 480 II (Roche Diagnostics Ltd, Rotkreuz, Switzerland) at 95 °C for 10 min, followed by 40 cycles of 95°C for 10s, 60°C for 15s, and 72°C for 20s. Gene expressions were normalized to a reference gene (GADPH). The relative quantification of gene expression was determined with the 2−ΔΔCt method23). The inclusion criteria of selecting candidate genes for the experimental verification included the following: 1) Hub genes that had a connectivity degree > 12 in the PPI networks and 2) genes that were up- or down-regulated in all the three datasets. The exclusion criteria included the following: 1) No literature reporting the association between the gene candidate and atherosclerosis and 2) genes that are biomarkers or important targets for unstable carotid plaques. The primer sequences are listed in Supplementary Table 1.
Supplementary Table 1.
| Primers | Sequence (5′-3′) |
|---|---|
| Human-COL1A2-Forward | CTCCATGGTGAGTTTGGTCTC |
| Human-COL1A2-Reverse | CTTCCAATAGGACCAGTAGGAC |
| Human-ADCY3-Forward | CCAACTTTGCTGACTTCTACAC |
| Human-ADCY3-Reverse | TGTCCAGGAGAGAGTCAAAATC |
| Human-IGFBP6-Forward | GAATCCTAAGGAGAGTAAACCCC |
| Human-IGFBP6-Reverse | CTGGATTCCTCTGTTGGTCTC |
| Human-CYP27A1-Forward | AAGGCTGATCCAGAAGTACAAG |
| Human-CYP27A1-Reverse | GCCCACTTTCTTATTGGGAAC |
| Human-PLA2G7-Forward | CTCATGGGTTTATAGTTGCTGC |
| Human-PLA2G7-Reverse | CTATTTCTGCAGCAGATTGGTC |
| Human-TYROBP-Forward | TGGTGCTGACAGTGCTCATTGC |
| Human-TYROBP-Reverse | AGGCGACTCGGTCTCAGTGATAC |
Enzyme Immunoassay
IGFBP6 plasma levels were measured in 52 patients with a commercial enzyme-linked immunosorbent assay (ELISA) kit (Cloud Clone Corp., USA) in accordance with the manufacturer's instructions.
Statistical Analysis
Data are expressed as the mean ± standard error of the mean. A Kolmogorov–Smirnov normality test was performed to determine whether the data were normally distributed. Comparisons of gene expression between stable and unstable plaques and ELISA results were analyzed with Student's t-test. For comparing the difference of demographics and risk factors between stable and unstable groups, the enumeration data and measurement data were analyzed with a chi-square test and an unpaired Student's t-test, respectively. Multivariable logistic regression models (models 1, 2, and 3) for discriminating unstable plaques were calculated using IGFBP6 and relevant confounders (adjusted for age, gender, smoke, hypertension, weight, diabetes, creatinine, triglyceride, and total lipoprotein, highdensity lipoprotein, and low-density lipoprotein cholesterol concentrations). Predicted probability was acquired. The receiver operating characteristic (ROC) curve analysis was performed to explore the sensitivity and specificity of IGFBP6 and IGFBP6/relevant confounders with respect to detecting unstable plaques. The area under the curve (AUC) was calculated with 95% confidence interval (CI). The optimal cutoff values were determined in accordance with Youden's index. P-value < .05 was deemed statistically significant. Data were statistically analyzed with SPSS version 19.0 software (SPSS Inc., Chicago, IL, USA) or GraphPad Prism (5.0).
Results
Identification of DEGs and Co-Regulated DEGs
In GSE41571, 1575 DEGs, including 680 upregulated and 875 downregulated DEGs, were identified in unstable plaques, as shown in volcano plot (Fig. 1A). In GSE118481, 760 DEGs were screened, with 471 upregulated and 289 downregulated DEGs (Fig. 1B). In the E-MTAB-2055 dataset, 1186 DEGs were identified, with 619 upregulated and 567 downregulated DEGs (Fig. 1C). In the three datasets, there were 231 co-upregulated genes and 205 co-downregulated genes (co-regulated DEGs were defined as DEGs identified in at least two datasets). A total of 14 upregulated DEGs and 2 downregulated DEGs were identified in all the three datasets (Fig. 1D, E, Supplementary Table 2). JCHAIN, CXCL10, and HMOX1 were the most upregulated genes in the GSE41571, GSE118481, and E-MATB-2055 datasets, respectively. COL21A1, DACT3, and ACTC1 were the most downregulated genes in the GSE41571, GSE118481, and E-MATB-2055 datasets, respectively. IGFBP6 was downregulated in all three datasets.
Fig. 1.
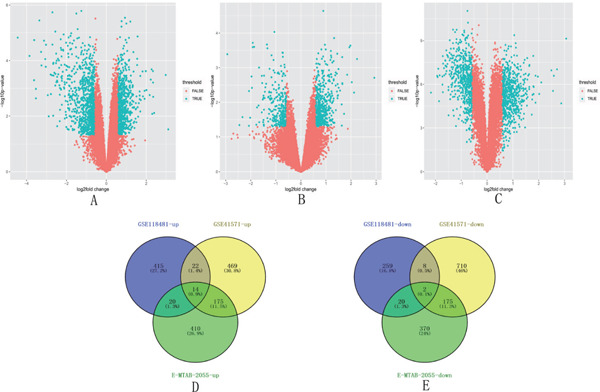
Volcano map analysis of the upregulated and downregulated genes in the stable and unstable carotid plaques in the three datasets
A. 1575 DEGs, including 680 upregulated and 875 downregulated DEGs, were identified in the unstable plaques compared with the stable plaques in the GSE41571 dataset. B. 760 DEGs were screened, with 471 upregulated and 289 downregulated in the GSE118481 dataset. C. 1186 DEGs were identified, with 619 upregulated and 567 downregulated in the E-MTAB-2055 dataset. D. 14 upregulated DEGs were identified after merging the three datasets. E. Two downregulated DEGs were identified after merging the three datasets. DEGs, differentially expressed genes
Supplementary Table 2. The list of the Genes that were co-up-regulated or co-down-regulated in all the 3 datasets.
| Gene | Description | Gene | Description |
|---|---|---|---|
| CD33 | up | GRINA | up |
| ACP2 | up | SEMA4A | up |
| GMIP | up | PKD2L1 | up |
| SCD | up | TCN2 | up |
| ASGR1 | up | LY96 | up |
| CYP27A1 | up | TMEM37 | up |
| PLA2G7 | up | ITGA8 | down |
| FUCA1 | up | IGFBP6 | down |
GO-BP and KEGG Enrichment Analyses
The GO-BP analysis revealed that the co-upregulated DEGs were enriched in 97 pathways, and the co-downregulated DEGs were enriched in 90 pathways. The top 20 pathways were selected and displayed through a bubble diagram. The co-upregulated DEGs were mostly enriched in signal transduction, innate immune response, and inflammatory response, and the co-downregulated DEGs were mostly enriched in cell adhesion and extracellular matrix organization (Fig. 2A, B). The KEGG enrichment analysis revealed that the co-upregulated DEGs were enriched in 21 pathways, and the co-downregulated DEGs were enriched in 11 pathways. The bubble diagram showed that the co-upregulated DEGs were mostly enriched in the tuberculous, lysosomal, and chemokine signaling pathways, and the co-downregulated DEGs were most enriched in focal adhesion and the PI3K/Akt signaling pathway (Fig. 2C, D).
Fig. 2.
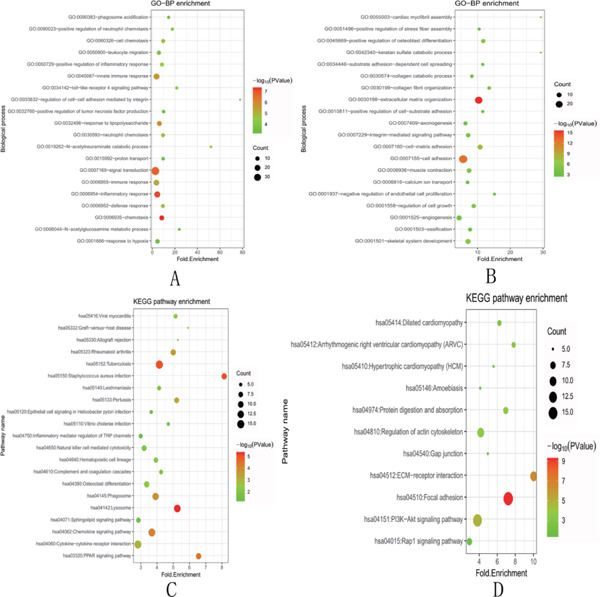
Bubble diagram (top) results of the functional enrichment analyses of upregulated and downregulated DEGs
The size of an individual point represents the degree of enrichment. The color depth represents the P-value. A. GO-BP enrichment analysis of upregulated DEGs. B. GO-BP enrichment analysis of downregulated DEGs. C. KEGG pathway enrichment analysis for upregulated genes. D. KEGG pathway enrichment analysis for downregulated genes. GO, gene ontology; KEGG, Kyoto Encyclopedia of Genes and Genomes; DEGs, differentially expressed genes
PPI Network Analysis
A total of 223 nodes and 387 interacting pairs were identified in the PPI regulatory networks (Fig. 3A). In the PPI network, only four hubs of upor downregulated genes with degrees ≥ 12 were screened: COL1A2, ADCY3, CXCR4, and TYROBP. In addition, three subnet modules, namely, modules A, B, and C, were selected in the PPI networks. Module A contains nine downregulated nodes (e.g., COL1A2) and 36 interacting pairs (Fig. 3B). Module B contains eight upregulated nodes (e.g., ADCY3 and CXCR4) and 28 interacting pairs (Fig. 3C). Modules C contains seven upregulated nodes (TYROBP) and 18 interacting pairs (Fig. 3D). The genes and their degrees in the three modules are listed in Table 1. Furthermore, the nodes in module A were enriched in two KEGG pathways (ECM–receptor interaction and focal adhesion); the nodes in module B were enriched in two pathways (chemokine signaling pathway and cytokine–cytokine receptor interaction); and the nodes in module C were enriched in three pathways (Prion diseases, complement and coagulation cascades, systemic lupus erythematosus)(Table 2).
Fig. 3.
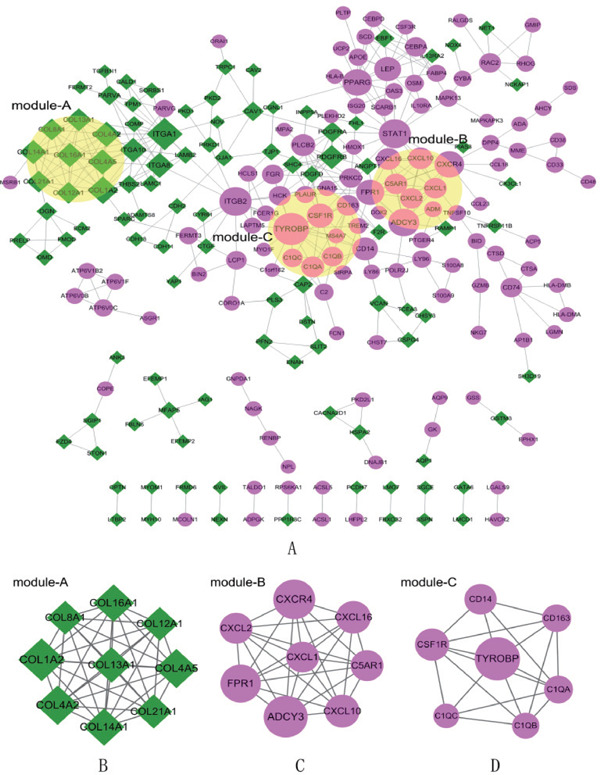
PPI network and subnet module analysis
The violet circles represent the upregulated DEGs, and the green diamonds represent the downregulated DEGs. The size of the nodes represents the number of protein-protein interaction pairs of a certain protein. The lines between two nodes represent the interaction of two proteins. A. Construction of PPI networks. B, C, D. Subnet module analysis of PPI. B, mcode 1; C, mcode 2; D, mcode 3. PPI, protein–protein interactions; DEGs, differentially expressed genes.
Table 1. Sub-module genes and degree in PPI networks.
| ModuleA |
ModuleB |
ModuleC |
|||||||
|---|---|---|---|---|---|---|---|---|---|
| Nodes | Description | Degree | Nodes | Description | Degree | Nodes | Description | Degree | |
| COL1A2 | Down | 13 | ADCY3 | Up | 13 | TYROBP | Up | 17 | |
| COL4A2 | Down | 11 | CXCR4 | Up | 12 | CSF1R | Up | 10 | |
| COL4A5 | Down | 11 | FPR1 | Up | 11 | CD14 | Up | 9 | |
| COL14A1 | Down | 10 | CXCL10 | Up | 8 | CD163 | Up | 7 | |
| COL16A1 | Down | 10 | CXCL16 | Up | 8 | C1QA | Up | 7 | |
| COL13A1 | Down | 9 | C5AR1 | Up | 7 | C1QB | Up | 6 | |
| COL21A1 | Down | 8 | CXCL2 | Up | 7 | C1QC | Up | 5 | |
| COL12A1 | Down | 8 | CXCL1 | Up | 7 | ||||
| COL8A1 | Down | 8 | |||||||
Table 2. KEGG and GO-BP enrichment analysis of submodule genes in PPI (Top 5).
| module | KEGG pathway/BP-top5 | Count | P Value | |
|---|---|---|---|---|
| Pathway | module-A | hsa04512:ECM-receptor interaction | 2 | 1.65E-02 |
| hsa04510:Focal adhesion | 2 | 3.95E-02 | ||
| module-B | hsa04062:Chemokine signaling pathway | 6 | 1.26E-06 | |
| hsa04060:Cytokine-cytokine receptor interaction | 5 | 2.13E-04 | ||
| module-C | hsa05020:Prion diseases | 3 | 4.54E-04 | |
| hsa04610:Complement and coagulation cascades | 3 | 1.77E-03 | ||
| hsa05322:Systemic lupus erythematosus | 3 | 3.61E-03 | ||
| BP | module-A | GO:0007155∼cell adhesion | 6 | 7.04E-06 |
| GO:0022610∼biological adhesion | 6 | 7.09E-06 | ||
| GO:0030198∼extracellular matrix organization | 4 | 1.51E-05 | ||
| GO:0043062∼extracellular structure organization | 4 | 5.80E-05 | ||
| GO:0030199∼collagen fibril organization | 3 | 9.26E-05 | ||
| module-B | GO:0006935∼chemotaxis | 7 | 1.73E-11 | |
| GO:0042330∼taxis | 7 | 1.73E-11 | ||
| GO:0007626∼locomotory behavior | 7 | 4.50E-10 | ||
| GO:0007610∼behavior | 7 | 1.14E-08 | ||
| GO:0007186∼G-protein coupled receptor protein signaling pathway | 8 | 2.67E-08 | ||
| module-C | GO:0006952∼defense response | 6 | 1.10E-06 | |
| GO:0006954∼inflammatory response | 5 | 4.72E-06 | ||
| GO:0002526∼acute inflammatory response | 4 | 7.26E-06 | ||
| GO:0009611∼response to wounding | 5 | 3.28E-05 | ||
| GO:0006958∼complement activation, classical pathway | 3 | 6.62E-05 | ||
miRNA/TF Target Networks
Eleven miRNAs (miR-29 family had the most target genes) and 16 TFs (NFKAPPAB, NFKAP-PAB65 and IRF7 had the most target genes) were predicted, and 73 regulatory pairs of miRNA or TF target networks were identified. There were eight downregulated target genes and seven upregulated target genes in the networks. In the miRNA target gene networks, five regulatory pairs were identified between miRNAs and upregulated DEGs (miR367–ADCY3), and 26 regulatory interactions were revealed between miRNAs and downregulated DEGs (miR29–COL4A2). In the TF target gene networks, NFKAPPAB, NFKAP-PAB65, and IRF7 were predicted to target four DEGs. NFKAPPAB was predicted to target one downregulated gene (COL16A1) and three upregulated genes (CXCL2, CXCL10, and CXCL16). NFKAPPAB65 was predicted to target one downregulated gene (COL16A1) and three upregulated genes (colonystimulating factor 1 receptor (CSF1R), CXCL10, and CXCL16). IRF7 was predicted to target one downregulated gene (COL12A1) and three upregulated genes (CXCL10, CXCL16, and CXCR4). The regulatory networks of miRNAs or TF target genes are summarized in Fig. 4.
Fig. 4.
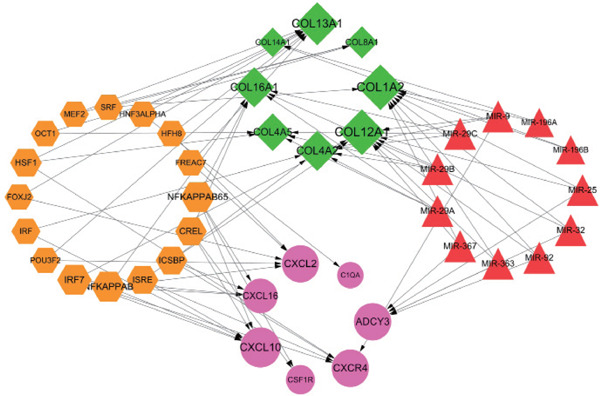
miRNA/TF targeted DEGs regulatory networks
The violet circles represent the upregulated DEGs, and the green diamonds represent the downregulated DEGs. The red triangle represents miRNA, and the yellow hexagon represents TF. The arrows indicate the regulatory direction.
Prediction of Drug–Gene Interaction
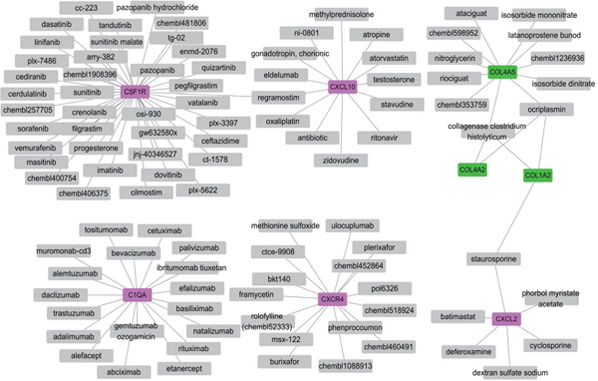
A total of 107 drug–gene interacting pairs, including 5 upregulated target genes, 3 downregulated target genes, and 101 drugs, were identified (Fig. 5). In the drug–gene networks, CSF1R was most inhibited by drugs, CXCR4 was most antagonized by drugs, and COL4A5 was most activated by drugs.
Fig. 5.
Drug–gene interaction networks
The violet rectangles represent the up-DEGs, and green rectangles represent the downregulated DEGs. The gray boxes indicate the drugs.
Expression of Hub Genes in Human Unstable Plaques and Plasma
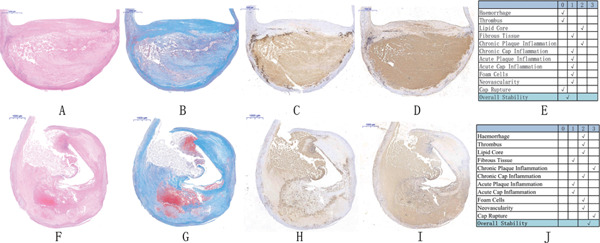
In accordance with the inclusion and exclusion criteria, COL1A2, TYOBP, ADCY3, IGFBP6, CYP27A1, and PLA2G7 were selected as potential candidates for the experimental verification. The human carotid plaques were classified in accordance with the American Heart Association guidelines, and the characteristic images of stable and unstable plaques are illustrated in Fig. 6A-E, F-J.
Fig. 6.
Representative histologic images of the stable and unstable plaques and the classification system
A–E: Representative image and stability scoring of the stable plaques. F–J: representative image and stability scoring of the unstable plaques. A, F indicate hematoxylin–eosin staining (scale bar: 1,000 µm); B, G indicate Masson's trichrome staining (scale bar: 1,000 µm); C, H indicate CD68 immunostaining; D, I indicate CD31 immunostaining (scale bar: 1,000 µm); E: associated scoring chart for the stable plaques; J: associated scoring chart for the unstable plaques.
The patients' baseline characteristics, according to the histologic status of the plaques and clinical manifestation of patients (stable vs. unstable plaques), are listed in Table 3. No statistically significant differences were found in the clinical variables between patients who had stable plaques and those who had unstable plaques based on the histologic criteria. Intriguingly, the incidences of transient ischemic attacks, amaurosis fugax, and stroke were not significantly different between patients who had histologically stable plaques and those who had unstable plaques. There were also no statistically significant differences in the variables except the symptoms between the patients who had symptoms and those who were asymptomatic.
Table 3. Patients baseline characteristics.
| Stable | Unstable | Asymptomatic | Symptomatic | |||
|---|---|---|---|---|---|---|
| (n = 28) | (n = 26) | P value | (n = 27) | (n = 27) | P value | |
| Age (mean ± SEM, years) | 67.5 ± 1.2 | 68.5 ± 1.2 | 0.567 | 68.3 ± 1.2 | 67.7 ± 1.2 | 0.719 |
| Male sex n = (%) | 26 (92.9) | 25 (96.2) | 0.947 | 27 (100) | 24 (89) | 0.235 |
| Smokers n = (%) | 16 (57.1%) | 18 (69.2%) | 0.408 | 19 (70.4%) | 15 (55.6%) | 0.398 |
| Hypertension n = (%) | 17 (60.7%) | 20 (76.9%) | 0.249 | 16 (59.3%) | 21 (77.8%) | 0.241 |
| Diabetes n = (%) | 8 (28.6%) | 12 (46.2%) | 0.260 | 9 (33.3%) | 11 (40.7%) | 0.779 |
| CHD n = (%) | 3 (10.7%) | 3 (11.5%) | 0.736 | 2 (7.4%) | 4 (14.8%) | 0.665 |
| CRF n = (%) | 0 (0.00%) | 0 (0.00%) | n.a. | 0 (0.00%) | 0 (0.00%) | n.a. |
| Aspirin n = (%) | 13 (46.4%) | 11 (42.3%) | 0.791 | 14 (51.9%) | 10 (37.0%) | 0.412 |
| Clopidogrel n = (%) | 2 (7.1%) | 2 (7.7%) | 0.658 | 1 (3.7%) | 3 (11.1%) | 0.603 |
| Statin n = (%) | 10 (35.7%) | 12 (46.2%) | 0.580 | 12 (44.4%) | 10 (37.0%) | 0.782 |
| ACEI/ARB n = (%) | 6 (21.4%) | 9 (34.6%) | 0.366 | 9 (33.3%) | 6 (22.2%) | 0.543 |
| Beta-blocker n = (%) | 2 (7.1%) | 4 (15.4%) | 0.596 | 2 (7.4%) | 4 (14.8%) | 0.665 |
| CCB n = (%) | 9 (32.1%) | 8 (30.8%) | 0.914 | 9 (33.3%) | 8 (29.6%) | 0.770 |
| TIA n = (%) | 6 (21.4%) | 5 (19.2%) | 0.890 | 0 (0.0%) | 11 (40.7%) | 0.0003*** |
| AF n = (%) | 2 (7.1%) | 2 (7.7%) | 0.658 | 0 (0.0%) | 4 (14.8%) | 0.111 |
| Stroke n = (%) | 9 (32.1%) | 8 (30.8%) | 0.914 | 3 (11.1%) | 14 (51.9%) | 0.003** |
| Weight (mean ± SEM, kg) | 72.5 ± 1.8 | 70.3 ± 1.4 | 0.356 | 72.8 ± 1.4 | 70.1 ± 1.8 | 0.253 |
| creatinine (mean ± SEM, µmol/L) | 80.6 ± 3.3 | 82.2 ± 4.0 | 0.749 | 80.9 ± 2.7 | 81.8 ± 4.4 | 0.858 |
| TCHO (mean ± SEM, mmol/L) | 3.9 ± 0.2 | 3.7 ± 0.2 | 0.321 | 3.8 ± 0.2 | 3.8 ± 0.2 | 0.909 |
| LDL (mean ± SEM, mmol/L) | 2.3 ± 0.1 | 2.0 ± 0.1 | 0.069 | 2.2 ± 0.1 | 2.1 ± 0.2 | 0.485 |
| HDL (mean ± SEM, mmol/L) | 1.0 ± 0.04 | 1.0 ± 0.05 | 0.338 | 1.0 ± 0.04 | 1.0 ± 0.1 | 0.979 |
| triglyceride (mean ± SEM,mmol/L) | 1.4 ± 0.1 | 1.9 ± 0.4 | 0.243 | 1.5 ± 0.2 | 1.8 ± 0.3 | 0.373 |
SEM, standard error of mean; CHD, coronary heart disease; CRF, chronic renal failure; ACEI, angiotensin converting enzyme inhibitor; ARB, angiotensin receptor blocker; CCB, caicium channel blocker; TIA, transient ischemic attack; AF, amaurosis fugax; TCHO, total cholesterol; LDL, low density lipoprotein; HDL, high density lipoprotein.
represents P < 0.01;
represents P < 0.001.
There were no significant differences between stable and unstable plaques in COL1A2, TYROBP, ADCY3, CYP27A1, or PLA2G7, as determined with the qRT-PCR. IGFBP6 was markedly less in the histologically unstable plaques than in the stable plaques, although the gene expression of IGFBP6 was not significantly different between patients who had symptoms and those who did not (Fig. 7A, B). The immunohistochemistry analysis of human stable and unstable carotid atherosclerotic plaques revealed that the protein levels of IGFBP6 were significantly lower in patients with unstable plaques than in those with stable plaques (Fig. 8A).We further found that IGFBP6 was colocalized with CD31+ endothelial cells in the fibrous cap and colocalized with CD68+ macrophages in the junctional region between the fibrous cap and necrotic core (Fig. 8B, C). However, α-SMA staining was not colocalized with IGFBP6 in the intima and tunica media in carotid atherosclerotic plaques. (Supplemental Fig. 1).
Fig. 7.
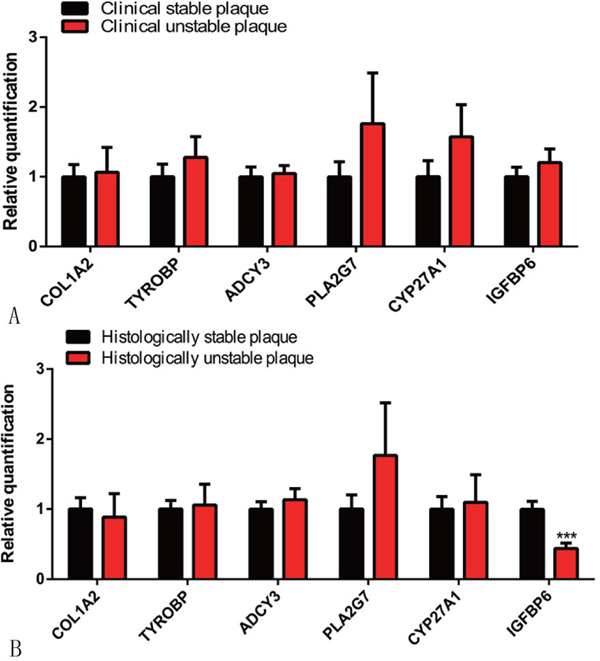
Experimental verification of the mRNA expression of six candidate genes identified from the co-regulated DEGs and PPI networks in the tissue samples
A. qRT-PCR analysis of COL1A2, TYROBP, ADCY3, PLA2G7, CYP27A1, and IGFBP6 in 54 carotid atherosclerotic plaques (27 stable and 27 unstable plaques according to the clinical criteria; n = 54). B. qRT-PCR analysis of the 6 genes in the same patient cohort (28 stable and 26 unstable plaques according to the histologic criteria; n = 54). ***p < .001. Three independent experiments were performed.
Fig. 8.
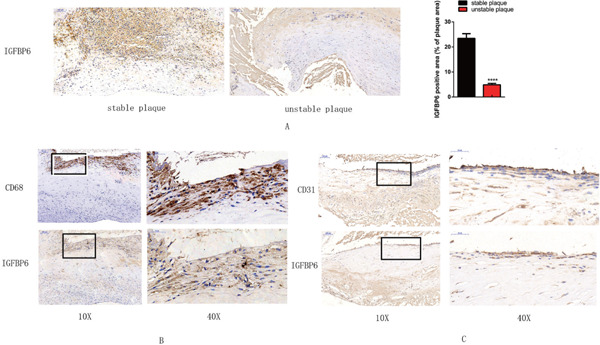
Immunochemistry analysis of IGFBP6 in histologically stable and unstable plaques
A. IGFBP6-positive area (brown) is significantly decreased in the unstable plaque compared with that in the stable plaque (×10) (****p < .0001) B. Colocalization of CD68+ macrophages in the border between the fibrous cap and necrotic core, in the area where IGFBP6 is expressed (×10). The black rectangle indicates the local enlarged view (×40). C. CD31+ endothelial cells are colocalized with IGFBP6 (× 10). The black rectangle indicates the local enlarged view (×40).
Supplemental Fig. 1.
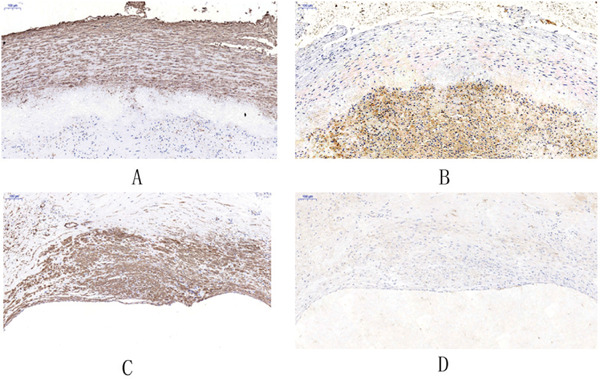
A. The brown region indicates the α-SMA+ cells in the tunica media in carotid atherosclerotic plaques. B. IGFBP6 is not colocalized with α -SMA+ cells in the tunica media. C. The brown region indicates the α-SMA+ cells in the intima layer. D. IGFBP6 is not colocalised with the α-SMA+ cells in the intima layer.
ELISA was performed to measure the concentration of IGFBP6 in 52 patients, of which 28 had histologically stable plaques and 24 had unstable plaques. IGFBP6 concentration was significantly lower in the patients with unstable plaques (mean ± SEM, 11,3041 ± 3,710 pg/mL) than in those with stable plaques (mean ± SEM, 15,7359 ± 6,152 pg/mL) (p < .0001) (Fig. 9A). To further explore the feasibility of using plasma IGFBP6 as a biomarker for discriminating unstable plaques, a ROC analysis was performed. The AUC for plasma IGFBP6 for detecting unstable plaques was 0.894 (95% CI: 0.810, 0.977), and the best cutoff value for plasma IGFBP6 was 142.08 ng/mL with a sensitivity of 1.000 and a specificity of 0.655. In addition, in multivariable logistic regression models with relevant confounders, model 1 (IGFBP6, age and gender), model 2 (age, gender, smoke, hypertension, weight, diabetes, creatinine, triglyceride, and total lipoprotein, high-density lipoprotein, and low-density lipoprotein cholesterol concentrations), and model 3 (IGFBP6 and the above cofounders) had insignificantly higher AUC compared with the univariable model of IGFBP6 (AUC = 0.903, AUC = 0.906, and AUC = 0.952, respectively; all P > 0.05) (Fig. 9B). The AUC, optimal cutoff value of IGFBP6, and multivariable models are summarized in Table 4.
Fig. 9.
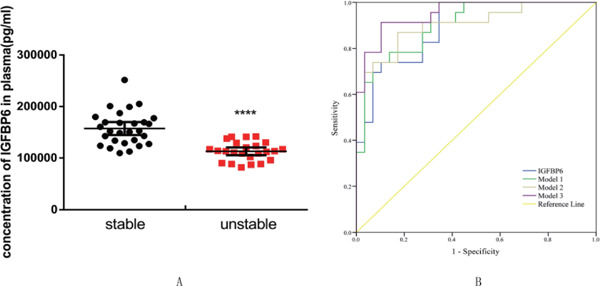
A. Concentration of IGFBP6 protein in the plasma of patients with histologically stable versus unstable plaque. (****p < .0001) B. ROC curves of IGFBP6, models 1, 2, and 3 for the discrimination between patients with stable and unstable plaques. The discriminative power of IGFBP6: the AUC was 0.894 (95% CI: 0.810–0.977), the sensitivity was 1.000, and the specificity was 0.655. The discriminative power of model 1: AUC was 0.903 (95% CI: 0.823–0.982), the sensitivity was 0.739, and the specificity was 0.931. The discriminative power of model 2: AUC was 0.906 (95% CI: 0.821–0.990), the sensitivity was 0.870, and the specificity was 0.828. The discriminative power of model 3: AUC was 0.952 (95% CI: 0.900–1.000), sensitivity was 0.913, and specificity was 0.897. Model 1, IGFBP6 adjusted for age and gender; model 2, age, gender, smoke, hypertension, weight, diabetes, creatinine, triglyceride, and total high-density lipoprotein and low-density lipoprotein cholesterol levels; model 3, IGFBP6 adjusted for all the above cofounders. ROC, receiver operating characteristic; AUC, area under the curve; CI, confidence interval.
Table 4. The diagnostic power of IGFBP6, Model 1, 2, 3 in discriminating unstable carotid atherosclerotic plaque.
| Variables | Cut-off | AUC (95% CI) | P | Sensitivity | Specificity |
|---|---|---|---|---|---|
| IGFBP6 (ng/mL) | ≤ 142.0767 | 0.894 (0.810, 0.977) | < 0.001 | 1.000 | 0.655 |
| PP (Model 1) | ≤ 0.38946 | 0.903 (0.823, 0.982) | < 0.001 | 0.739 | 0.931 |
| PP (Model 2) | ≤ 0.54239 | 0.906 (0.821, 0.990) | < 0.001 | 0.870 | 0.828 |
| PP (Model 3) | ≤ 0.49497 | 0.952 (0.900, 1.000) | < 0.001 | 0.913 | 0.897 |
Model 1, IGFBP6 adjusted for age, gender; Model 2, age, gender, smoke, hypertension, weight, diabetes, creatinine, tyglyceride, total-, HDL- and LDL-cholesterol levels; Model 3, IGFBP6 adjusted for all the above cofounders. IGFBP6, insulin-like growth factor binding protein 6; PP, predicted probability; AUC , the area under the curve. HDL, high density lipoprotein; LDL, low density lipoprotein.
Discussion
One of the main pathology underlying stroke is carotid atherosclerosis. Emboli from ruptured atherosclerotic plaques are the major causes of the occlusion of cerebral vessels. Stroke maybe preventable, but identifying the biomarkers of patients who are at risk of stroke and the possible therapeutic targets of atherosclerosis and unstable plaque is imperative for preventing cerebrovascular and cardiovascular adverse events24). To identify potential biomarkers, we analyzed the co-regulated DEGs in all the datasets, which included 40 human unstable and 34 stable carotid atherosclerotic plaques, from the GEO and EBI databases, using integrated bioinformatics methods. By using the merged analysis of multiple datasets, we avoided the individual bias present in the analysis of single datasets. We also eliminated the influence of factors, such as diabetes, trans-species difference, and non-plaque samples, through the exclusion criteria. We further presented experimental evidence to validate the co-regulated DEGs, using unstable and stable human carotid plaques in histologic and clinical classification. Therefore, we feel that this study is a potent and comprehensive exploration of molecular mechanisms of plaque vulnerability and has identified potential interventional targets.
We identified 231 co-upregulated genes and 205 co-downregulated genes in unstable plaques. The upregulated genes were predicted to be involved in biological processes, including signal transduction, innate immune response, and inflammatory response, which indicated that the vulnerability of plaques is a complex process regulated by immune–inflammatory responses. This possibility is consistent with the evidence that plaque rupture is largely triggered by nonresolved immune–inflammatory reactions25, 26). However, the co-downregulated DEGs were mostly enriched in cell adhesion and ECM organization. Decreased cell adhesion may suppress the migration of endothelial repairing cells, thereby interfering with the timely repair of damaged endothelium27). Downregulated cell adhesion-related genes may be responsible for the unstable plaque formation. Moreover, ECM organization is imperative for maintaining the stability of the fibrous cap28). Downregulated genes participating in the ECM organization, such as COL1A2 and COL12A1, which were identified in this study, are associated with the decreased content of the fibrous cap in coronary artery atherosclerosis29). Therefore, abating inflammatory and immune response and enhancing cell adhesion and ECM organization may be strategies for stabilizing carotid plaques.
In the present study, upregulated DEGs were mostly enriched in the tuberculous and lysosomal pathways, whereas focal adhesion and PI3K/Akt signaling pathways had the most downregulated genes. Some studies30, 31) have reported that bacterial infection is linked to unstable carotid plaque formations and adverse neurological events. The accumulation of macrophage-derived foam cells in tubercles is an important feature of tuberculosis32). As tuberculosis shares features with atherosclerosis, the possibility that tuberculosis and its immune–inflammatory response are related to atherosclerosis progression is reasonable. In this work, the upregulated gene in unstable carotid plaque was enriched in the tuberculous pathways; this result may imply that tuberculosis infection is correlated with plaque instability. The treatment of oxidized low-density lipoprotein inhibits macrophage lysosomes from combining with Mycobacterium tuberculosis, thereby supporting the survival of the microorganism33). Atherosclerosis may in turn drive the development of tuberculosis. Lysosomal autophagy is necessary for rendering macrophages less susceptible to external stimuli, such as to various inflammatory molecules34). In advanced plaques, autophagy is impaired, and lysosomes are dysfunctional; cellular debris accumulates, contributing to plaque vulnerability35). We found upregulated genes enriched in the lysosome pathway, which implies that although lysosomes become dysfunctional, the related gene is activated to offset the dysfunctional lysosome. Cell–matrix interaction, i.e., focal adhesion, is indispensable in regulating cell migration and proliferation36). In the initial stage of atherosclerosis, vascular smooth muscle cells migrate into the intima and proliferate, where they promote the formation of neointima. However, in advanced lesions, vascular smooth muscle, the most crucial component in the fibrous cap, contributes to the thickening of the cap37). Thus, the impaired focal adhesion of vascular smooth muscle is responsible for plaque rupture. The PI3K/Akt signaling pathway is essential for the survival, proliferation, and migration of macrophages. A previous work38) has indicated that suppressing macrophagic PI3K/Akt signaling decreases autophagy and viability of the cells, thereby rendering them susceptible to apoptosis or death. Therefore, the reversal of downregulated PI3K/Akt signaling may enhance plaque stability.
In this work, COL1A2, ADCY3, CXCR4, and TYROBP were found highest in the PPI network. COL1A2 was mostly enriched in biological adhesion and ECM–receptor interaction, a result that is consistent with the reports of other studies7). Decreased collagen content in plaques is a sign of unstable plaque28). COL1A2 encodes type I collagen, which is an important component of the fibrous cap39). Therefore, enhancing COL1A2 expression may be an approach for promoting ECM organization and collagen production to stabilize carotid plaques. ADCY3 and CXCR4 were mostly enriched in the chemokine signaling pathway and chemotaxis. ADCY3 has been associated with obesity, and ADCY3 deficiency in animals increased their susceptibility to obesity40). This study was the first to identify ADCY3 as a central gene in carotid unstable plaques, but the association between ADCY3 and the chemokine pathway in plaque instability is unelucidated. Chemokine, predominantly expressed by macrophages, contributes to the recruitment of macrophages into the subendothelial layer and drives atherogenesis41). CXCR4 and its ligand chemokine CXCL12 are involved in the progression of atherosclerosis42). CXCR4 has limited atherosclerosis by maintaining endothelial barrier function and the contractile phenotype of vascular smooth muscle cells43). Moreover, unstable carotid plaque has a higher content of CXCR4 mRNA than normal vessels, and CXCR4 is mainly localized in lesional macrophages44). Thus, CXCR4 may play a crucial role in unstable plaque formations. TYROBP was mostly enriched in coagulation cascades and defense responses. Similarly, another bioinformatics study has reported that TYROBP is a hub gene in advanced carotid plaques45). TYROBP, a transmembrane signaling polypeptide, has also been involved in immune–inflammatory responses46). Thus, TYROBP may participate in the progression of atherosclerosis and plaque instability via the regulation of immune responses. The relationship between TYROBP and coagulation remains to be explored.
In the miRNA/TF target gene networks, the miR-29 family had nine targeted DEGs, the most among the 11 predicted miRNAs. Particularly, the miR-29 family mostly regulated collagen-encoding genes, such as COL12A1, COL1A2, and COL4A2. COL1A2, which was highly expressed in PPI, was downregulated by miR-29b. In an animal model45), antagonists to miR-29 increased the expression of COL1A2, thereby increasing the thickness of the fibrous cap and stabilizing the plaque47). Thus, targeting the axis of miR-29b–COL1A2 maybe beneficial for plaque remodeling and preventing plaque rupture.
The prediction of drug–gene interaction showed that CSF1R had the most drug–gene interacting pairs and may be preferentially targeted for drug exploitation. The colony-stimulating factor 1 (CSF1)/CSF1R axis plays a crucial role in the survival and differentiation of the monocyte–macrophage system and promotes the activation of tumor-associated macrophages48). The CSF1 inhibitor, including the inhibitor of CSF1R and ligand, has been developed as an antitumor and anti-inflammatory agent49). Macrophages in plaques also play crucial roles in destabilizing plaques by increasing the inflammatory response and producing proteolytic matrix-degrading enzymes. Using the CSF1R inhibitor, which has been used in cancer therapy, for plaque stabilization is an attractive consideration.
We further selected the hub genes, which were derived from the PPI with a high degree, or the most significantly co-regulated genes for experimental verification. COL1A2 was not found to be significantly changed in clinical or histologically unstable carotid plaques, which is inconsistent with a report that COL1A2 is downregulated in unstable plaques7); this difference may be due to the difference between the experimental verification and simple bioinformatics analysis. CYP27A1 variants are associated with hypercholesterolemia50), and PLA2G7, encoding lipoprotein-associated phospholipase A2, is a marker of familial hypercholesterolemia and increased risk of cardiovascular diseases51). In the present study, CYP27A1 and PLA2G7 were markedly upregulated in all three datasets in the bioinformatics analysis, but there was no significant difference in the expression of the two genes between stable and unstable plaques; this finding is evidence that CYP27A1 and PLA2G7 may not be biomarkers for predicting plaque instability.
IGFBP6, a family protein binding with insulin-like growth factors, is involved in various diseases, including cancer and autoimmune diseases52). IGFBP6 is also downregulated in Type I and II diabetes mellitus53), which is similar to our novel finding of the downregulated IGFBP6 expression in unstable carotid plaques. Moreover, diabetes and advanced glycation end products are associated with vulnerable plaque phenotype54). These results corroborate the correlation between diabetes and vulnerable plaque formation. Moreover, IGFBP6 colocalized with endothelial cells and macrophages, which indicated that it may play crucial roles in the activities of endothelial cells and macrophages involved in unstable plaques. ELISA analysis revealed that IGFBP6 was also a circulating protein and its plasma concentration was lower in patients who had unstable plaques than in those with stable plaques. Moreover, based on the ROC and AUC, plasma IGFBP6 values below the best cutoff value of 142.0767 ng/mL indicated that the plaque was more likely to be classified as unstable in the histologic examination. The sensitivity at this cutoff value was high, but the specificity was relatively low, which might broaden the application of IGFBP6 in screening the non-selective populations. After adjusting for clinical cofounders, the AUC did not differ significantly between multiple regression models, which supports the view that IGFBP6 is an independent predictor of unstable plaques. Thus, IGFBP6 may be a biomarker for predicting vulnerable plaques and an important molecule for the formation of unstable plaques.
Our study has limitations. The exact role of ADCY3, CXCR4, and TYROBP in unstable plaque formations is still unknown. Moreover, the function of IGFBP6 in vitro and in vivo has not been verified. As atherosclerosis coexists with complex metabolic disorders, an analysis of comprehensive metabolic change through metabolomics should be conducted55). Finally, the other 13 co-DEGs merged in all the three datasets were not enrolled in our experimental verification, and they will require further exploration.
Conclusion
The tuberculous, lysosomal, and chemokine signaling pathways are implicated in the formation of vulnerable atherosclerotic plaques. COL1A2, ADCY3, CXCR4, and TYROBP may be crucial targets in the formation of vulnerable plaques. miR-29 is implicated for targeting COL1A2 and fibrosis. Using a CSF1R inhibitor may be a promising strategy to stabilize atherosclerotic plaques. IGFBP6 is downregulated in unstable carotid plaques and plasma; thus, it may be an important molecule and biomarker in the formation of unstable carotid plaques.
Acknowledgement
None.
Conflict of Interests
None.
Funding
This work was supported by the Specifically Invited Professor of Oriental Scholar of Shanghai Colleges and Universities Tracking Program (GZ2016008), the Guiding Project of Western Medicine from the Science and Technology Commission of Shanghai Municipality (16411966500), and grants from the National Natural Science Foundation of China (8157020854) and from the National Natural Science Foundation of China (81570440, 81870347).
References
- 1). Wang G, Kuai D, Yang Y, Yang G, Wei Z, Zhao W: Screening of potential gene markers for predicting carotid atheroma plaque formation using bioinformatics approaches. Mol Med Rep, 2017; 15: 2039-2048 [DOI] [PMC free article] [PubMed] [Google Scholar]
- 2). Foulkes MA, Wolf PA, Price TR, Mohr JP, Hier DB: The stroke data bank: Design, methods, and baseline characteristics. Stroke, 1988; 19: 547-554 [DOI] [PubMed] [Google Scholar]
- 3). Cochain C, Zernecke A: Macrophages in vascular inflammation and atherosclerosis. Pflugers Arch, 2017; 469: 485-499 [DOI] [PubMed] [Google Scholar]
- 4). Kjaergaard AD, Bojesen SE, Johansen JS, Nordestgaard BG: Elevated plasma ykl-40 levels and ischemic stroke in the general population. Ann Neurol, 2010; 68: 672-680 [DOI] [PubMed] [Google Scholar]
- 5). Seneviratne AN, Edsfeldt AO, Cole JE, Kassiteridi C, Swart M, Park I, Green P, Khoyratty TE, Saliba DG, Goddard ME, Sansom SN, Goncalves I, Krams R, Udalova IA, Monaco C: Interferon regulatory factor 5 controls necrotic core formation in atherosclerotic lesions by impairing efferocytosis. Circulation, 2017; 136: 1140-1154 [DOI] [PMC free article] [PubMed] [Google Scholar]
- 6). Nai W, Threapleton D, Lu J, Zhang K, Wu H, Fu Y, Wang Y, Ou Z, Shan L, Ding Y, Yu Y, Dai M: Identification of novel genes and pathways in carotid atheroma using integrated bioinformatic methods. Sci Rep, 2016; 6: 18764. [DOI] [PMC free article] [PubMed] [Google Scholar]
- 7). Wang H, Liu D, Zhang H: Investigation of the underlying genes and mechanism of macrophage-enriched ruptured atherosclerotic plaques using bioinformatics method. J Atheroscler Thromb, 2019; 26: 636-658 [DOI] [PMC free article] [PubMed] [Google Scholar]
- 8). Salem MK, Butt HZ, Choke E, Moore D, West K, Robinson TG, Sayers RD, Naylor AR, Bown MJ: Gene and protein expression of chemokine (c-c-motif) ligand 19 is upregulated in unstable carotid atherosclerotic plaques. Eur J Vasc Endovasc Surg, 2016; 52: 427-436 [DOI] [PubMed] [Google Scholar]
- 9). Gautier L, Cope L, Bolstad BM, Irizarry RA: Affy--analysis of affymetrix genechip data at the probe level. Bioinformatics, 2004; 20: 307-315 [DOI] [PubMed] [Google Scholar]
- 10). Diboun I, Wernisch L, Orengo CA, Koltzenburg M: Microarray analysis after rna amplification can detect pronounced differences in gene expression using limma. BMC Genomics, 2006; 7: 252. [DOI] [PMC free article] [PubMed] [Google Scholar]
- 11). Bolstad BM, Irizarry RA, Astrand M, Speed TP: A comparison of normalization methods for high density oligonucleotide array data based on variance and bias. Bioinformatics, 2003; 19: 185-193 [DOI] [PubMed] [Google Scholar]
- 12). Khan A, Mathelier A: Intervene: A tool for intersection and visualization of multiple gene or genomic region sets. BMC Bioinformatics, 2017; 18: 287. [DOI] [PMC free article] [PubMed] [Google Scholar]
- 13). Ashburner M, Ball CA, Blake JA, Botstein D, Butler H, Cherry JM, Davis AP, Dolinski K, Dwight SS, Eppig JT, Harris MA, Hill DP, Issel-Tarver L, Kasarskis A, Lewis S, Matese JC, Richardson JE, Ringwald M, Rubin GM, Sherlock G: Gene ontology: Tool for the unification of biology. The gene ontology consortium. Nat Genet, 2000; 25: 25-29 [DOI] [PMC free article] [PubMed] [Google Scholar]
- 14). Kanehisa M, Goto S: Kegg: Kyoto encyclopedia of genes and genomes. Nucleic Acids Res, 2000; 28: 27-30 [DOI] [PMC free article] [PubMed] [Google Scholar]
- 15). Huang da W, Sherman BT, Lempicki RA: Systematic and integrative analysis of large gene lists using david bioinformatics resources. Nat Protoc, 2009; 4: 44-57 [DOI] [PubMed] [Google Scholar]
- 16). Bindea G, Mlecnik B, Hackl H, Charoentong P, Tosolini M, Kirilovsky A, Fridman WH, Pages F, Trajanoski Z, Galon J: Cluego: A cytoscape plug-in to decipher functionally grouped gene ontology and pathway annotation networks. Bioinformatics, 2009; 25: 1091-1093 [DOI] [PMC free article] [PubMed] [Google Scholar]
- 17). Shannon P, Markiel A, Ozier O, Baliga NS, Wang JT, Ramage D, Amin N, Schwikowski B, Ideker T: Cytoscape: A software environment for integrated models of biomolecular interaction networks. Genome Res, 2003; 13: 2498-2504 [DOI] [PMC free article] [PubMed] [Google Scholar]
- 18). Szklarczyk D, Franceschini A, Kuhn M, Simonovic M, Roth A, Minguez P, Doerks T, Stark M, Muller J, Bork P, Jensen LJ, von Mering C: The string database in 2011: Functional interaction networks of proteins, globally integrated and scored. Nucleic Acids Res, 2011; 39: 561-568 [DOI] [PMC free article] [PubMed] [Google Scholar]
- 19). Bandettini WP, Kellman P, Mancini C, Booker OJ, Vasu S, Leung SW, Wilson JR, Shanbhag SM, Chen MY, Arai AE: Multicontrast delayed enhancement (mcode) improves detection of subendocardial myocardial infarction by late gadolinium enhancement cardiovascular magnetic resonance: A clinical validation study. J Cardiovasc Magn Reson, 2012; 14: 83. [DOI] [PMC free article] [PubMed] [Google Scholar]
- 20). Zhang B, Kirov S, Snoddy J: Webgestalt: An integrated system for exploring gene sets in various biological contexts. Nucleic Acids Res, 2005; 33: W741-748 [DOI] [PMC free article] [PubMed] [Google Scholar]
- 21). Wagner AH, Coffman AC, Ainscough BJ, Spies NC, Skidmore ZL, Campbell KM, Krysiak K, Pan D, McMichael JF, Eldred JM, Walker JR, Wilson RK, Mardis ER, Griffith M, Griffith OL: Dgidb 2.0: Mining clinically relevant drug-gene interactions. Nucleic Acids Res, 2016; 44: 1036-1044 [DOI] [PMC free article] [PubMed] [Google Scholar]
- 22). Lovett JK, Gallagher PJ, Hands LJ, Walton J, Rothwell PM: Histological correlates of carotid plaque surface morphology on lumen contrast imaging. Circulation, 2004; 110: 2190-2197 [DOI] [PubMed] [Google Scholar]
- 23). Livak KJ, Schmittgen TD: Analysis of relative gene expression data using real-time quantitative pcr and the 2(-delta delta c(t)) method. Methods, 2001; 25: 402-408 [DOI] [PubMed] [Google Scholar]
- 24). Tada H, Nakagawa T, Okada H, Nakahashi T, Mori M, Sakata K, Nohara A, Takamura M, Kawashiri MA: Clinical impact of carotid plaque score rather than carotid intima-media thickness on recurrence of atherosclerotic cardiovascular disease events. J Atheroscler Thromb, 2020; 27: 38-46 [DOI] [PMC free article] [PubMed] [Google Scholar]
- 25). Tabas I, Lichtman AH: Monocyte-macrophages and t cells in atherosclerosis. Immunity, 2017; 47: 621-634 [DOI] [PMC free article] [PubMed] [Google Scholar]
- 26). Tall AR, Yvan-Charvet L: Cholesterol, inflammation and innate immunity. Nat Rev Immunol, 2015; 15: 104-116 [DOI] [PMC free article] [PubMed] [Google Scholar]
- 27). Lee JS, Gotlieb AI: Understanding the role of the cytoskeleton in the complex regulation of the endothelial repair. Histol Histopathol, 2003; 18: 879-887 [DOI] [PubMed] [Google Scholar]
- 28). Libby P, Ridker PM, Hansson GK: Progress and challenges in translating the biology of atherosclerosis. Nature, 2011; 473: 317-325 [DOI] [PubMed] [Google Scholar]
- 29). Pickering JG, Ford CM, Chow LH: Evidence for rapid accumulation and persistently disordered architecture of fibrillar collagen in human coronary restenosis lesions. Am J Cardiol, 1996; 78: 633-637 [DOI] [PubMed] [Google Scholar]
- 30). Rai V, Agrawal DK: The role of damage- and pathogen-associated molecular patterns in inflammation-mediated vulnerability of atherosclerotic plaques. Can J Physiol Pharmacol, 2017; 95: 1245-1253 [DOI] [PubMed] [Google Scholar]
- 31). Wu Y, Tao Z, Song C, Jia Q, Bai J, Zhi K, Qu L: Overexpression of ykl-40 predicts plaque instability in carotid atherosclerosis with caga-positive helicobacter pylori infection. PloS one, 2013; 8: e59996. [DOI] [PMC free article] [PubMed] [Google Scholar]
- 32). Guerrini V, Prideaux B, Blanc L, Bruiners N, Arrigucci R, Singh S, Ho-Liang HP, Salamon H, Chen PY, Lakehal K, Subbian S, O'Brien P, Via LE, Barry CE, 3rd, Dartois V, Gennaro ML: Storage lipid studies in tuberculosis reveal that foam cell biogenesis is disease-specific. PLoS Pathog, 2018; 14: e1007223. [DOI] [PMC free article] [PubMed] [Google Scholar]
- 33). Vrieling F, Wilson L, Rensen PCN, Walzl G, Ottenhoff THM, Joosten SA: Oxidized low-density lipoprotein (oxldl) supports mycobacterium tuberculosis survival in macrophages by inducing lysosomal dysfunction. PLoS Pathog, 2019; 15: e1007724. [DOI] [PMC free article] [PubMed] [Google Scholar]
- 34). Evans TD, Jeong SJ, Zhang X, Sergin I, Razani B: Tfeb and trehalose drive the macrophage autophagy-lysosome system to protect against atherosclerosis. Autophagy, 2018; 14: 724-726 [DOI] [PMC free article] [PubMed] [Google Scholar]
- 35). Grootaert MOJ, Roth L, Schrijvers DM, De Meyer GRY, Martinet W: Defective autophagy in atherosclerosis: To die or to senesce? Oxid Med Cell Longev, 2018; 2018: 7687083. [DOI] [PMC free article] [PubMed] [Google Scholar]
- 36). Tsai MS, Chiang MT, Tsai DL, Yang CW, Hou HS, Li YR, Chang PC, Lin HH, Chen HY, Hwang IS, Wei PK, Hsu CP, Lin KI, Liu FT, Chau LY: Galectin-1 restricts vascular smooth muscle cell motility via modulating adhesion force and focal adhesion dynamics. Sci Rep, 2018; 8: 11497. [DOI] [PMC free article] [PubMed] [Google Scholar]
- 37). Ballantyne MD, Pinel K, Dakin R, Vesey AT, Diver L, Mackenzie R, Garcia R, Welsh P, Sattar N, Hamilton G, Joshi N, Dweck MR, Miano JM, McBride MW, Newby DE, McDonald RA, Baker AH: Smooth muscle enriched long noncoding rna (smilr) regulates cell proliferation. Circulation, 2016; 133: 2050-2065 [DOI] [PMC free article] [PubMed] [Google Scholar]
- 38). Linton MF, Moslehi JJ, Babaev VR: Akt signaling in macrophage polarization, survival, and atherosclerosis. Int J Mol Sci, 2019; 20 [DOI] [PMC free article] [PubMed] [Google Scholar]
- 39). Prockop DJ, Kivirikko KI: Collagens: Molecular biology, diseases, and potentials for therapy. Annu Rev Biochem, 1995; 64: 403-434 [DOI] [PubMed] [Google Scholar]
- 40). Li Z, Liang Y, Xia N, Lai Y, Pan H, Zhou S, Jiang F, He Y: Liraglutide reduces body weight by upregulation of adenylate cyclase 3. Nutr Diabetes, 2017; 7: e265. [DOI] [PMC free article] [PubMed] [Google Scholar]
- 41). Kimura S, Noguchi H, Nanbu U, Wang KY, Sasaguri Y, Nakayama T: Relationship between ccl22 expression by vascular smooth muscle cells and macrophage histamine receptors in atherosclerosis. J Atheroscler Thromb, 2018; 25: 1240-1254 [DOI] [PMC free article] [PubMed] [Google Scholar]
- 42). Doring Y, Pawig L, Weber C, Noels H: The cxcl12/cxcr4 chemokine ligand/receptor axis in cardiovascular disease. Front Physiol, 2014; 5: 212. [DOI] [PMC free article] [PubMed] [Google Scholar]
- 43). Doring Y, Noels H, van der Vorst EPC, Neideck C, Egea V, Drechsler M, Mandl M, Pawig LB, Jansen Y, Schroder K, Bidzhekov K, Megens RTA, Theelen W, Klinkhammer BM, Boor P, Schurgers LJ, van Gorp RH, Ries C, Kusters PJH, van der Wal AC, Hackeng TM, Gabel G, Brandes RP, Soehnlein O, Lutgens E, Vestweber D, Teupser D, Holdt LM, Rader DJ, Saleheen D, Weber C: Vascular cxcr4 limits atherosclerosis by maintaining arterial integrity: Evidence from mouse and human studies. Circulation, 2017; 136: 388-403 [DOI] [PMC free article] [PubMed] [Google Scholar]
- 44). Merckelbach S, van der Vorst EPC, Kallmayer M, Rischpler C, Burgkart R, Doring Y, de Borst GJ, Schwaiger M, Eckstein HH, Weber C, Pelisek J: Expression and cellular localization of cxcr4 and cxcl12 in human carotid atherosclerotic plaques. Thromb Haemost, 2018; 118: 195-206 [DOI] [PubMed] [Google Scholar]
- 45). Wang J, Wei B, Cao S, Xu F, Chen W, Lin H, Du C, Sun Z: Identification by microarray technology of key genes involved in the progression of carotid atherosclerotic plaque. Genes Genet Syst, 2014; 89: 253-258 [DOI] [PubMed] [Google Scholar]
- 46). Lanier LL: Dap10- and dap12-associated receptors in innate immunity. Immunol Rev, 2009; 227: 150-160 [DOI] [PMC free article] [PubMed] [Google Scholar]
- 47). Ulrich V, Rotllan N, Araldi E, Luciano A, Skroblin P, Abonnenc M, Perrotta P, Yin X, Bauer A, Leslie KL, Zhang P, Aryal B, Montgomery RL, Thum T, Martin K, Suarez Y, Mayr M, Fernandez-Hernando C, Sessa WC: Chronic mir-29 antagonism promotes favorable plaque remodeling in atherosclerotic mice. EMBO Mol Med, 2016; 8: 643-653 [DOI] [PMC free article] [PubMed] [Google Scholar]
- 48). Cannarile MA, Weisser M, Jacob W, Jegg AM, Ries CH, Ruttinger D: Colony-stimulating factor 1 receptor (csf1r) inhibitors in cancer therapy. J Immunother Cancer, 2017; 5: 53. [DOI] [PMC free article] [PubMed] [Google Scholar]
- 49). Lu X, Xun Q, Wang Z, Hu X, Ding K: Small-molecule csf1r inhibitors as anticancer agents. Curr Med Chem, 2019 [DOI] [PubMed] [Google Scholar]
- 50). Corral P, Geller AS, Polisecki EY, Lopez GI, Banares VG, Cacciagiu L, Berg G, Hegele RA, Schaefer EJ, Schreier LE: Unusual genetic variants associated with hypercholesterolemia in argentina. Atherosclerosis, 2018; 277: 256-261 [DOI] [PubMed] [Google Scholar]
- 51). Mattina A, Rosenbaum D, Bittar R, Bonnefont-Rousselot D, Noto D, Averna M, Bruckert E, Giral P: Lipoprotein-associated phospholipase a(2) activity is increased in patients with definite familial hypercholesterolemia compared with other forms of hypercholesterolemia. Nutr Metab Cardiovasc Dis, 2018; 28: 517-523 [DOI] [PubMed] [Google Scholar]
- 52). Ding H, Wu T: Insulin-like growth factor binding proteins in autoimmune diseases. Front Endocrinol (Lausanne), 2018; 9: 499. [DOI] [PMC free article] [PubMed] [Google Scholar]
- 53). Feldmann B, Jehle PM, Mohan S, Lang GE, Lang GK, Brueckel J, Boehm BO: Diabetic retinopathy is associated with decreased serum levels of free igf-i and changes of igf-binding proteins. Growth Horm IGF Res, 2000; 10: 53-59 [DOI] [PubMed] [Google Scholar]
- 54). Hanssen NM, Wouters K, Huijberts MS, Gijbels MJ, Sluimer JC, Scheijen JL, Heeneman S, Biessen EA, Daemen MJ, Brownlee M, de Kleijn DP, Stehouwer CD, Pasterkamp G, Schalkwijk CG: Higher levels of advanced glycation endproducts in human carotid atherosclerotic plaques are associated with a rupture-prone phenotype. Eur Heart J, 2014; 35: 1137-1146 [DOI] [PubMed] [Google Scholar]
- 55). Omori K, Katakami N, Yamamoto Y, Ninomiya H, Takahara M, Matsuoka TA, Bamba T, Fukusaki E, Shimomura I: Identification of metabolites associated with onset of cad in diabetic patients using ce-ms analysis: A pilot study. J Atheroscler Thromb, 2019; 26: 233-245 [DOI] [PMC free article] [PubMed] [Google Scholar]


