

Abstract
The metabotropic glutamate receptor 5 (mGluR5) is a promising treatment target for psychiatric disorders due to its modulatory effects on glutamate transmission. Using [11C]ABP688, we previously showed that the rapidly acting antidepressant ketamine decreases mGluR5 availability. The mGluR5 radioligand [18F]FPEB offers key advantages over [11C]ABP688; however, its suitability for drug challenge studies is unknown. We evaluated whether [18F]FPEB can be used to capture ketamine-induced effects on mGluR5. Seven healthy subjects participated in three [18F]FPEB scans: a baseline, a same-day post-ketamine, and a 24-h post-ketamine scan. The outcome measure was VT/fP, obtained using a two-tissue compartment model and a metabolite-corrected arterial input function. Dissociative symptoms, heart rate and blood pressure increased following ketamine infusion. [18F]FPEB VT/fP decreased by 9% across the cortex after ketamine infusion, with minimal difference between baseline and 24-h scans. Compared to our previous work using [11C]ABP688, the magnitude of the ketamine-induced change in mGluR5 was smaller using [18F]FPEB; however, effect sizes were similar for the same-day post-ketamine vs. baseline scan (Cohen’s d = 0.75 for [18F]FPEB and 0.88 for [11C]ABP688). [18F]FPEB is therefore able to capture some of the effects of ketamine on mGluR5, but [11C]ABP688 appears to be more suitable in drug challenge paradigms designed to probe glutamate transmission.
Keywords: FPEB, glutamate, ketamine, mGluR5, positron emission tomography
Introduction
Glutamate is the most abundant neurotransmitter in the human brain, responsible for virtually every excitatory synaptic transmission. Due to its wide-reaching impact on brain function, glutamate dysfunction has been implicated in the disruption of networks responsible for cognitive and emotional processing across psychiatric disorders including depression,1,2 PTSD,3,4 bipolar disorder5 and schizophrenia.6 As such, modulation of the glutamate system has been a major focus in the discovery of critically needed novel treatments in Psychiatry. Indeed, the S-enantiomer version of the NMDA receptor antagonist ketamine has recently been FDA approved for treatment-resistant depression, paving the way for a new wave of rapid-acting antidepressants that target the glutamate system. Using positron emission tomography (PET) to investigate the molecular effects of ketamine and other glutamate-modulating drugs will therefore be vital in advancing mechanistic understanding of psychiatric disorders and their treatment.
The metabotropic glutamate receptor subtype 5 (mGluR5) is a G-protein coupled receptor that has important modulatory effects on glutamate transmission and is widely expressed throughout the brain.7 Emerging evidence suggests that mGluR5 plays a key role in a range of psychiatric disorders,8 including depression9,10 and PTSD.4,11,12 Ketamine transiently increases glutamate transmission and subsequently leads to a cascade of downstream signaling effects that are now beginning to be elucidated.13–15 Indeed, ketamine is thought to have downstream effects on the activity of mGluR5, which is structurally linked to the NMDA receptor.16 Using the radioligand [11C]ABP688, a negative allosteric modulator (NAM) of mGluR5, we previously showed that ketamine administration in humans was associated with reductions in availability of mGluR5,17 which we hypothesized to be related to ketamine-induced increases in glutamate.15 This raises the possibility that PET imaging of mGluR5 can be used as an index of glutamate release. In another study using [11C]ABP688, we showed that ketamine-induced antidepressant effects were associated with downregulation of mGluR5 in individuals with depression,18 suggesting that the downstream effects of ketamine on mGluR5 may be directly related to the rapid antidepressant properties of ketamine, and highlighting the potential of mGluR5 as a novel therapeutic target for psychiatric treatment.
[18F]FPEB is another mGluR5 radioligand that also binds to the negative allosteric modulator (NAM) site, which offers a number of advantages over [11C]ABP688. [18F]FPEB is thought to display higher specific binding signals than [11C]ABP688.19,20 Furthermore, the F-18 radionuclide provides distinct advantages – its longer half-life minimizes the need for an onsite cyclotron and is associated with better counting statistics.21 Such properties have made [18F]FPEB a desirable radioligand in studies investigating mGluR5. Accordingly, it has become widely used across psychiatric, neurological and addiction disorders.4,22–26
Indeed, we have utilized [18F]FPEB to provide preliminary evidence for a role for mGluR5 in PTSD4 and in suicidal ideation transdiagnostically.27 Evaluating the effects of mGluR5-modulating agents in disorders such as PTSD and depression, and on suicidal thinking transdiagnostically, would be important next steps in terms of drug discovery. However, the suitability of [18F]FPEB in drug challenge studies is unclear. Determining whether [18F]FPEB can be used to capture ketamine-induced changes in mGluR5 availability would be informative for future research using [18F]FPEB in similar drug challenge paradigms, as well as in studies assessing the therapeutic effects of direct modulation of mGluR5. We therefore explored whether [18F]FPEB could detect changes in mGluR5 availability after administration of ketamine to healthy volunteers.
Methods
Participants
Seven healthy, non-smoking subjects participated in the study (mean age; 31 ± 8 males (n = 3), 27 ± 5 females (n = 4)). After providing informed consent, inclusion criteria were assessed by the following: medical and psychiatric history, physical examination, routine blood tests, and psychiatric and neurologic examination. A urine drug screen, electrocardiogram, and pregnancy test (for women) were performed at screening and before radiotracer administration. General inclusion criteria were as follows: (1) age 18–60 years old; (2) English speaking; (3) no current, or history of, any DSM-IV diagnosis; (4) no first-degree relative with history of psychotic, mood, or anxiety disorder; and (5) no recent regular medication use and no history of psychiatric medication use.
The Structured Clinical Interview for DSM (IV)28 was administered at screening. The Hamilton Depression Rating Scale,29 Montgomery–Åsberg Depression Rating Scale,30 and Beck Depression Inventory31 were used to assess subjects’ mood at screening and on the days of the PET scans (at baseline scan, immediately after ketamine scan and 24 h after ketamine administration). The effects of ketamine on subjects’ mental state were subjectively assessed using the Clinician Administered Dissociative State Scale (CADSS)32 and Profile of Mood States (POMS)33 before, during and after ketamine administration. The study was approved by the Yale University Human Investigation Committee (governed by the Common Rule for ethical research involving human subjects; US Department of Health and Human Services) and the Radioactive Drug Research Committee. All participants provided written informed consent before inclusion in the study.
MRI and PET scanning
T1-weighted MRI scans were acquired on a 3 T scanner (Trio; Siemens Medical Systems) to exclude structural abnormality and for coregistration with PET images. [18F]FPEB was prepared as previously described34 on the morning of each of the two scan days (molar activity was 216 ± 135 MBq/nmol at end of synthesis). The radiochemical purity was 99.0 ± 0.7%. A 6-min transmission scan was acquired before injection. [18F]FPEB was administered as bolus over 1 min, and emission data were collected for 120 min on the high resolution research tomograph (HRRT; Siemens). Since two scans were scheduled on the same day (injection times ∼3 h apart), and fluorine-18 has a long half-life (109.8 min), the injected activity was intentionally limited for this first scan (≤70 MBq) and corrections for between-scan activity were applied (see below). The actual injected activity was 49 ± 13 MBq. List-mode data were binned into 33 frames (6 × 30 s, 3 × 1 min, 2 × 2 min, 22 × 5 min). Head motion was tracked using the Polaris Vicra optical tracking system (Vicra; NDI System) and an infrared tracking tool attached to the head of the subject with a swim cap. The metabolite-corrected arterial input function was concurrently measured as previously described.35 Plasma free fraction (fP) was measured by ultrafiltration.36
Following the baseline [18F]FPEB scan, subjects were given a short (∼1 h) break. Subjects then participated in a second [18F]FPEB scan (118 ± 59 MBq), with ketamine administered immediately after successful radioligand administration, as done previously.17 Subjects then returned the next day for a 24 h post-ketamine [18F]FPEB scan (147 ± 43 MBq). Vital signs (pulse, blood pressure, and oxygen saturation) were obtained before and after ketamine administration and during the ketamine infusion (at 5- to 10-min intervals). Racemic ketamine was obtained from the Yale–New Haven Hospital Pharmacy and administered intravenously, with an initial bolus of 0.23 mg/kg over 1 min followed by constant infusion of 0.58 mg/kg per hour over 1 h.37,38 This dosing regimen of ketamine was used instead of the 0.5 mg/kg over 40 min dose to enhance statistical power by inducing a larger glutamate surge as suggested by prior ketamine studies.39,40 Both dosing regimens are similar in that they result in comparable changes in cognition and perception and do not cause the anesthetic effect. Blood ketamine levels were assessed at 5, 15, 30, and 75 min, as previously described.38
Image analysis
[18F]FPEB image analysis was performed using IDL 8.0 (Harris Geospatial Solutions, Melbourne, FL). To correct for potential slippage of the tracking tool on the head of the subject, a second step of motion correction was performed by realigning frame images to an average image of the first 10 min after injection, using FMRIB linear image registration tool (FLIRT), version 5.3 (FMRIB Image Analysis Group, Oxford, UK). A new motion-corrected average image of the first 10 min after injection was then computed and coregistered to the subject’s MRI using FLIRT. The subject’s MRI was then coregistered to a template MRI in MNI space using bioimagesuite (http://bioimagesuite. yale.edu; version 2.5) and nonlinear transforms.41,42 Regions of interest in the major cortical lobes – frontal, parietal, occipital and temporal were defined using the automated anatomical labeling template43 for SPM2, and the aforementioned coregistration transforms.
Outcome measure
Computation of the metabolite corrected input function was performed as described previously.35 Volumes of distributions were estimated using the two-tissue compartment model.44 For the second scan, the compartmental model incorporated corrections for residual activity from the first injection.35 In drug challenge studies, it is important to account for fp due to potential drug-induced changes in plasma protein binding of the radiotracer. Indeed, changes in free fraction can have large effects on brain uptake.45 Therefore, for each scan, the outcome measure was the volume distribution VT corrected for the radiotracer’s plasma free fraction fP: VT/fP. For the second scan, the plasma free fraction fP was corrected by performing the ultrafiltration procedure twice: once with an un-spiked plasma sample containing only leftover radioactivity from the first [18F]FPEB injection, and once with plasma sample spiked with pure [18F]FPEB. The corrected plasma free fraction was computed as: (Cultrafiltrate,spiked-Cultrafiltrate,unspiked)/(Cplasma,spiked-Cplasma,unspiked), where C is the concentration of each sample (measured in triplicate). For each post-ketamine scan, the percent change in radioligand was calculated as ΔVT = [1-(VT, ketamine/fP, ketamine)/(VT, baseline/fP, baseline)].
The clearance of tracer was compared between baseline and post-ketamine scans. To compute clearance values, the tail (t ≥30 min) of the metabolite-corrected arterial input function curve was fitted with a single-exponential function, and the clearance was computed as the injected dose divided by the area under curve of the input function, extrapolated to infinity. For the scan immediately after ketamine, the input function curve was corrected for the leftover activity from the first scan using the extrapolation of the first scan’s input curve.
Statistical analysis
To examine the differences of measured VT/fP due to ketamine administration between baseline and (24-h) post-ketamine time points, a linear mixed-effects model with region and time as random effects was used. The dependence structure among regions and time points from the same subject was modeled using the Kronecker product between unrestricted symmetry (to model the correlation among all regions) and autoregressive with order 1 (to model the correlation among time points) based on Arkaike Information Criteria. Other dependence structures considered included unrestricted symmetry, compound symmetry, and the Kronecker product between unrestricted symmetry and compound symmetry. The interaction term between region and time was also included in the model to get a region-specific estimate of differences at post-ketamine scan from baseline. Paired-samples t-tests were used to determine differences in scan parameters, subjective reports and vital signs between scans. Pearson’s r was used to examine correlations between ΔVT and CADDS scores. Repeated-measures ANOVAs were used to determine differences in radiotracer characteristics and metabolism across scans.
Results
Vital signs and subjective ratings
There were significant increases in blood pressure and heart rate after the start of ketamine, and a gradual return to baseline levels 90 min after the start of infusion (Table 1). Oxygen saturation levels remained constant throughout ketamine infusion, with no significant changes from baseline.
Table 1.
Vital signs before, during and after ketamine infusion.
| Baseline |
Minutes after ketamine |
|||||||
|---|---|---|---|---|---|---|---|---|
| 10 | 20 | 30 | 40 | 50 | 60 | 90 | ||
| Systolic BP | 125.9 (7.9) | 144.8a (10.0) | 139.4a (12.8) | 132.6 (14.7) | 133.3 (8.3) | 133.4 (10.7) | 129.3 (11.9) | 124.0 (8.8) |
| Diastolic BP | 65.4 (4.6) | 74.3a (4.6) | 74.0a (3.1) | 72.1a(5.0) | 70.9 (3.3) | 71.7 (6.1) | 70.9a (4.6) | 64.4 (6.3) |
| Heart rate | 63.4 (15.3) | 80.0a (22.7) | 71.9a (20.0) | 70.3a(16.3) | 68.6 (11.7) | 67.6a (14.7) | 68.9 (13.0) | 64.1 (13.9) |
| SPO2 (%) | 98.7 (1.3) | 98.7 (1.0) | 98.6 (0.8) | 98.7 (0.8) | 98.3 (0.8) | 98.3 (0.8) | 98.1 (0.7) | 98.0 (1.4) |
BP: blood pressure; SPO2: oxygen saturation.
aSignificantly different from baseline at p < 0.05, as determined by paired-samples t-tests.
Baseline CADSS scores were 0 for all subjects. During ketamine administration, subjects scored higher on all subscales of the CADSS (amnesia, depersonalization and derealization; Figure 1, Table 2). Scores from CADSS administered post-ketamine and 24 h post-ketamine were not significantly different from baseline scores. Scores on the fatigue and confusion-bewilderment subscales of the POMS were significantly increased post-ketamine, while scores on the vigor-activity subscale were significantly decreased after ketamine infusion.
Figure 1.
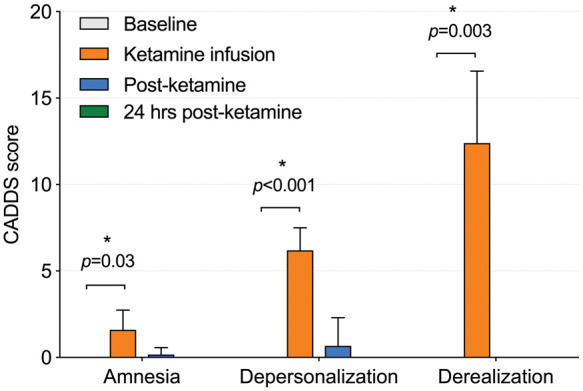
Clinician administered dissociative state scale (CADSS) subscale scores at baseline, during ketamine infusion, after ketamine infusion and 24 h post-ketamine. CADSS: clinician-administered dissociative symptoms scale. Error bars represent standard deviation.
Table 2.
Ratings acquired before, during, after and 24 h post-ketamine infusion.
| Baseline | During ketamine | Post-ketamine | 24 h post-ketamine | |
|---|---|---|---|---|
| CADSS amnesia | 0.0 (0.0) | 1.6 (1.1)a | 0.2 (0.4) | 0.0 (0.0) |
| CADSS depersonalization | 0.0 (0.0) | 6.2 (1.3)a | 0.7 (1.6) | 0.0 (0.0) |
| CADSS derealization | 0.0 (0.0) | 12.4 (4.2)a | 0.0 (0.0) | 0.0 (0.0) |
| POMS T | 0.6 (0.5) | 0.7 (1.3) | 1.1 (1.5) | 1.1 (2.2) |
| POMS D | 0.0 (0.0) | 0.0 (0.0) | 0.1 (0.4) | 1.0 (2.6) |
| POMS A | 0.0 (0.0) | 0.1 (0.4) | 2.1 (3.7) | 0.4 (0.8) |
| POMS F | 1.1 (1.6) | 2.6 (1.8) | 7.0 (5.1)a | 1.3 (1.7) |
| POMS C | 2.3 (1.3) | 3.3 (1.0) | 3.6 (7.8) | 3.0 (1.2) |
| POMS V | 8.6 (4.8) | 2.9 (3.0) | 1.4 (2.1)a | 8.0 (6.1) |
| POMS Total | −4.6 (6.5) | 3.9 (4.4) | 12.6 (7.4)a | −1.1 (5.4) |
| BDI | 1.7 (2.8) | 1.3 (1.1) | 1.3 (1.1) | 1.9 (3.3) |
| MADRS | 0.6 (1.0) | 0.3 (0.5) | 0.3 (0.5) | 0.4 (1.1) |
aSignificantly different from baseline at p < 0.05 (uncorrected), as determined by paired-samples t-tests.
CADSS: clinician administered dissociative state scale; POMS: profile of mood states; T: tension-anxiety; D: depression; A: anger-hostility; F: fatigue-inertia; C: confusion-bewilderment; V: vigor-activity; BDI: Beck depression inventory; MADRS: Montberg–Abserg depression rating scale.Values presented as mean (SD).
Tracer metabolism and clearance
By design, the injected dose and mass were higher in scan 2 than in scan 1 (dose was 49 ± 13 MBq in scan 1 and 118 ± 59 MBq in scan 2; mass was 2.1 ± 1.7 ng/kg in scan 1 and 10.6 ± 2.6 ng/kg in scan 2) and specific activity was lower in scan 2 than in scan 1 (119 ± 72 MBq/nmol in scan 1 and 36 ± 21 MBq/nmol in scan 2).
The plasma free fraction increased non-significantly following ketamine injection (p = 0.13; 4.3 ± 0.9% at baseline, 4.6 ± 0.8% immediately after ketamine infusion and 4.7 ± 0.7% 24 h after ketamine infusion). To assess the potential effects of ketamine on tracer metabolism, parent fraction values over time were evaluated before and after ketamine infusion. The plasma parent fraction between 3 and 30 min post-injection decreased across scans and reached trend significance (p = 0.08; 56 ± 10% at baseline, 45 ± 7% immediately after ketamine infusion, and 49 ± 6% 24 h post ketamine infusion). The delivery rate of [18F]FPEB from arterial plasma to the tissue (K1) did not differ between scans across cortical (frontal, parietal, occipital, temporal) ROIs (p = 0.32; 0.34 ± 0.05 ml/cm3/min at baseline, 0.36 ± 0.04 ml/cm3/min immediately after ketamine and 0.40 ± 0.08 ml/cm3/min 24 h after ketamine). Tracer clearance values, calculated as the injected dose divided by the extrapolated area under the metabolite-corrected arterial input function, and corrected for radioactivity carryover from the first scan, were significantly increased after ketamine (p = 0.03; 1.25 ± 0.55 L/h/kg at baseline, 1.48 ± 0.61 L/h/kg immediately after ketamine and 1.62 ± 0.64 L/h/kg 24 h post-ketamine).
Ketamine-induced change in [18F]FPEB VT/fP
We observed no significant differences between baseline and post-ketamine (p = 0.986) or 24 h post-ketamine (p = 0.892) scans. However, p-values for individual regions indicated significant decreases in frontal (p = 0.040; Cohen’s d = 0.80), parietal (p = 0.037; d = 0.75) and occipital (p = 0.045; d = 0.77) cortices immediately after ketamine infusion but not 24 h later (see Figure 3 and Table 3). Specifically, there was a mean reduction of 9 ± 12% in frontal cortex, 10 ± 13% in parietal cortex, 10 ± 12% in occipital cortex, 8 ± 12% in temporal cortex and 10 ± 14% in the cerebellum immediately after ketamine infusion, but no regional differences between baseline and 24 h post-ketamine scans (d = 0.27; 3% difference across ROIs). Regional values with effect sizes are shown in Table S1. Figure 2 indicates visually lower mean VT/fp values from the ketamine compared to baseline scans, with values from the 24 h post-ketamine scan being close to those from the baseline scan. When using VT as outcome measure (no correction for fP), there were no differences between baseline vs. post-ketamine scans (d = 0.17) or baseline vs. 24 h post-ketamine scans (d = 0.28) (Table S2). For comparison, data from our previous [11C]ABP688 ketamine study are shown in Table S3 (mean effect sizes for the post-ketamine vs. baseline scans across cortical regions were 0.75 for [18F]FPEB and 0.88 for [11C]ABP688; for 24 h post-ketamine vs. baseline scans, d = 0.27 for [18F]FPEB and 1.19 for [11C]ABP688).
Figure 3.
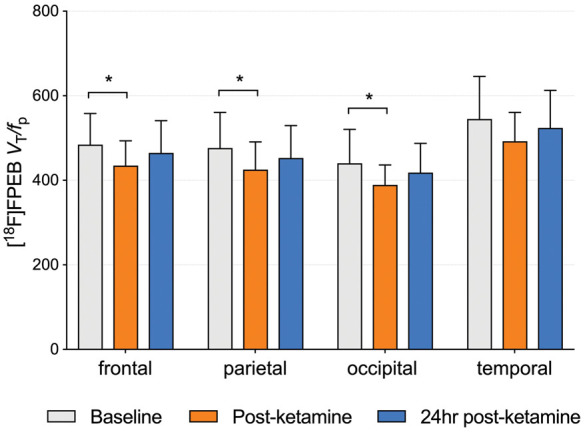
Average VT/fP across subjects (n = 7) from baseline, ketamine and 24 h post-ketamine scans. *Significant at p < 0.05. p-values were obtained from t-tests based on the fitted linear mixed-effects model. Error bars represent SD.
Table 3.
Estimated differences in VT/fp before and after ketamine within specific regions based on linear mixed-effects model.
| Region | Time point comparison | Estimate | 95% CI | Unadjusted p-value* |
|---|---|---|---|---|
| frontal | Baseline vs. post-ketamine | 49.529 | (2.215, 96.842) | 0.0407a |
| Baseline vs. 24 h post-ketamine | 19.514 | (−41.653, 80.682) | 0.5217 | |
| occipital | Baseline vs. post-ketamine | 51.200 | (3.182, 99.218) | 0.0373a |
| Baseline vs. 24 h post-ketamine | 21.814 | (−40.264, 83.893) | 0.4806 | |
| parietal | Baseline vs. post-ketamine | 51.3 | (1.259, 101.341) | 0.0448a |
| Baseline vs. 24 h post-ketamine | 23.443 | (−41.251, 88.137) | 0.4672 | |
| temporal | Baseline vs. post-ketamine | 52.286 | (−5.849, 110.421) | 0.0765 |
| Baseline vs. 24 h post-ketamine | 26.957 | (−48.2, 102.114) | 0.4717 |
*p-values were obtained from t-tests based on the fitted linear mixed-effects model.aSignificant at p < 0.05.
Figure 2.

Regional VT/fP values for each subject across baseline, ketamine and 24 h post-ketamine scans. Each black line represents a single subject. Average change across subjects is shown in red.
There were no significant correlations between change in CADSS scores and percent change in VT/fp. Blood ketamine levels over the first 30 minutes of infusion were variable across subjects (mean = 132±46 ng/mL; range 84-176 ng/mL). No significant correlations were observed between blood ketamine levels or injected dose of ketamine and scores on the CADSS (total or subscales). Further, there were no significant correlations between blood ketamine levels or administered dose and percent change in VT/fP.
Sex effects
In an exploratory manner, we examined the effects of ketamine on mGluR5 availability in men and women separately. In men we observed a non-significant 12% decrease in VT/fp across cortical regions immediately post-ketamine, which remained at this level 24 h post-ketamine (Figure 4). For women, while we observed a similar 10% decrease immediately post-ketamine, VT/fP returned to baseline levels 24 h post-ketamine. The sample sizes for men and women were small and findings were non-significant.
Figure 4.
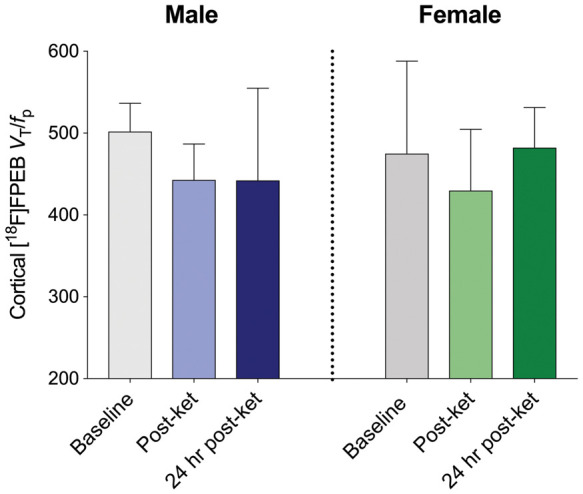
Average VT/fP across baseline, post-ketamine and 24 h post-ketamine scans stratified by sex. Mean cortical VT/fp values across scans for men (left; n = 3) and women (right; n = 4). Error bars represent SD.
Discussion
Using the mGluR5 radioligand [11C]ABP688, we previously showed a decrease in mGluR5 availability following ketamine administration.17 Here, we investigated whether the 18F–labelled mGluR5 radioligand FPEB could detect ketamine-induced changes in mGluR5 in healthy volunteers, to determine the feasibility of using [18F]FPEB in examining the effects of ketamine on the brain’s glutamate system. We demonstrate a decrease in [18F]FPEB VT/fP immediately after ketamine administration, with minimal difference between baseline and 24 h post ketamine [18F]FPEB VT/fP. Increases in heart rate, blood pressure and dissociative symptoms were consistent with the effects of ketamine.
In our previous study using [11C]ABP688, we observed a global reduction in mGluR5 availability of ∼20%.17 Here, we observed a global reduction of ∼10% following ketamine administration. Study populations were similar in terms of age, sex and education, and ketamine administration was the same across studies. The difference in magnitude of the observed reductions between studies is therefore likely related either to variability in the response to ketamine, or to differences between [11C]ABP688 and [18F]FPEB. That our [18F]FPEB findings follow the same direction as the [11C]ABP688 findings support the observation that ketamine administration results in a decrease in mGluR5 availability in healthy volunteers, likely due to an increase in glutamate levels.15 In line with this, drug-induced perturbation of the glutamate system has been shown to alter [11C]ABP688 binding in rats,46 baboons47 and rhesus monkeys.47,48 We demonstrate that [18F]FPEB is able to capture some of the effects of ketamine on mGluR5 availability.
However, these effects are likely underestimated. Our previously published same-day test–retest findings indicated significantly higher binding in the retest (afternoon) scan compared to the test scan with both [11C]ABP688 and [18F]FPEB, by an average of 34% and 28%, respectively.49 This replicated a study at a different facility also showing a significant increase in [11C]ABP688 binding in retest compared to test scans.49 The likelihood that these observed increases in radioligand binding are due to systematic errors is low, given that the effect has been observed across facilities and radiotracers. Instead, we hypothesize that the effect is driven by alterations in glutamatergic activity causing up or downregulation of glutamatergic receptor availability. One possible cause for alterations in glutamatergic activity is diurnal variation, with evidence indicating that the circadian rhythm and sleep-wake cycle are regulated in part by glutamatergic activity.50–53 Indeed, research has specifically shown that brain glutamate levels decrease during the light cycle and increase in the dark cycle.50 Therefore, it is possible that during the morning scan, higher levels of glutamate led to a downregulation of mGluR5, and that decreases in glutamate levels during the day led to mGluR5 upregulation in the afternoon scan. This is consistent with a [11C]ABP688 study in rodents showing that mGluR5 availability was affected by circadian variation.54 Based on this evidence, the observed decrease in mGluR5 availability following ketamine administration in the present study is likely underestimated. The current findings are in the opposite direction to the test–retest studies of mGluR5 radiotracers, suggesting that the effect of ketamine on mGluR5 availability is robust. Indeed, by using our same-day test–retest data to “correct” the post-ketamine data for the increased binding observed in the retest afternoon scans, we estimate that the “true” average signal change following ketamine administration would have been −31 ± 18% for [18F]FPEB and −39% ± 15% for [11C]ABP688. Due to the dynamic nature of psychiatric symptoms, it is desirable to assess the therapeutic and neurobiological effects of drugs such as ketamine on the same day, as per the current study design. However, future studies should weigh these benefits against the apparent diurnal effects of glutamatergic activity. That psychiatric disorders have been associated with disrupted circadian rhythms55 should also be considered in future mGluR5 studies. In such cases, “correcting” for the diurnal effects of radioligand binding to mGluR5 may not be feasible.
Given that [18F]FPEB and glutamate bind at different sites on the receptor, the reduction in mGluR5 availability is likely related to mechanisms other than direct competition. One possibility is that higher levels of extracellular glutamate lead to increased internalization of mGluR5. Indeed, many G-protein coupled receptors, including serotonin 1 A and 2 A receptors,56–58 as well as dopamine D2 receptors, have been shown to exhibit rapid agonist-induced internalization.5960 The ability of ligands to access internalized receptors is highly dependent upon their physicochemical properties, with access of some compounds to intracellular receptor impaired several orders of magnitude compared to receptor on the plasma membrane.60 Thus, internalized receptors could be differentially accessible to different PET tracers. If [18F]FPEB and [11C]ABP688 are differentially accessible to the cytoplasmic milieu, with the latter being less able to permeate the plasma membrane to reach internalized receptors, this would be consistent with our results ([11C]ABP688 change greater than [18F]FPEB change) and reminiscent of previous investigations into internalization of the D2 receptor and differential effects on apparent ligand affinity.60 In other words, an internalization-associated “affinity shift” could be larger in [11C]ABP688 than [18F]FPEB.47 While further work needs to clarify the mechanism of action, our findings suggest that [11C]ABP688 may be more sensitive to the glutamatergic effects of ketamine than [18F]FPEB, and hence may be a more suitable radioligand in paradigms involving drug-induced perturbations of the glutamate system. Further, our previous study indicated that [11C]ABP688 VT remained significantly lower than baseline at the 24 h post-ketamine scan in healthy volunteers, as well as in depressed individuals.18 Here, there was no significant difference between baseline and 24 h post-ketamine [18F]FPEB VT/fP, suggesting that [18F]FPEB may not be capturing the full effects of ketamine on mGluR5 availability. After stratifying by sex, we observed that [18F]FPEB binding remained at the same level 24 h post-ketamine as immediately post-ketamine in men but not women. These findings were not significant and the sample sizes were very small. However we have included them to highlight that sex could be an important factor to consider in future mGluR5 PET studies. Indeed, our test–retest study indicated a greater increase in [11C]ABP688 and [18F]FPEB binding in women compared to men.49
There are a number of limitations to this study. Firstly, the kinetic modelling used here assumes steady state conditions; however, blood pressure and heart rate were transiently increased during ketamine administration, possibly affecting radiotracer pharmacokinetics, which could differentially affect quantification of [18F]FPEB and [11C]ABP688. Our findings indicate that ketamine affected clearance of the radiotracer. However, the use of kinetic modelling and a metabolite-corrected arterial input function would have provided a correction for any ketamine-induced changes in radiotracer metabolism. The increase in plasma free fraction following ketamine administration reached trend significance. The plasma free fraction can be reliably measured with [18F]FPEB34 and so we hypothesize that the observed increase in fp is due to ketamine affecting [18F]FPEB binding to plasma proteins, though in-vitro experiments are needed to confirm this. Second, because there was only one synthesis for the first scan day, molar activity was lower for the second (post-ketamine) scan and the concentration of cold mass was higher. However, the maximum concentration of radioligand in plasma × plasma free fraction (Cp × fp) was 0.4 pM and, based on previous work indicating that the Kd of [18F]FPEB is 0.11 nM in the human cortex,61 Cp × fp was always around 300 times lower than Kd, such that we were well within tracer dose. Further, we observed no significant correlations between VT or VT/fp and injected mass across scans. Therefore, any effect of mass would have been minimal. Finally, we cannot make direct comparisons with our [11C]ABP688 study using the same paradigm due to the use of different outcome measures. Correction for fp is desirable in drug challenge studies due to potential drug-induced changes in plasma protein binding. Measurement of the free fraction with [11C]ABP688 is considered unreliable,62 hence the use of VT. The use of different outcome measures between studies (VT compared to VT/fp) could have contributed to differences in findings. The plasma free fraction for the post-ketamine scan required correction for residual activity from the baseline scan. Including these corrections could have introduced a source of measurement error and contributed to the increased variability observed in the current study (average CoV in percent change = 129%) compared to our previous [11C]ABP688 study17 (CoV = 100%).
Of note, the ketamine-induced change (ΔVT/fp and ΔVT) was similar in the cerebellum compared to cortical ROIs (see Tables S1 and S2). For [18F]FPEB, the cerebellum is very far from being an ideal reference region due to high specific binding, and ΔVT is only expected to be marginally lower in the cerebellum than in high binding regions. In details, ΔVT is expected to be regionally variant and equal to ΔBPND × fS, where fS is the fraction of specific binding in each region: fS = BPND/(1+BPND). Because fS has a non-linear relationship with BPND and flattens out at high BPND values (as is the case with [18F]FPEB), fS is similar for cerebellum and cortex, and thus we cannot expect to reliably measure a smaller ketamine effect in the cerebellum with [18F]FPEB. Conversely, [11C]ABP688 has lower BPND,63 and therefore the difference in fS between cerebellum and cortex is bigger, resulting in a smaller ketamine effect in the cerebellum compared to high binding cortical regions, as observed previously.17 Therefore, the relative results obtained with both [18F]FPEB and [11C]ABP688 are consistent (see SI for more details).
In conclusion, we demonstrate a decrease in mGluR5 following ketamine infusion, consistent with our previous report using [11C]ABP688. Given that the direction of results is opposite to that of the test–retest studies which implicate diurnal variability in mGluR5, we are likely underestimating the magnitude of the ketamine-induced decrease in mGluR5, which should be taken into account in future work. Examining the effects of agents that modulate glutamate functioning on symptoms in clinical populations will be critical in further understanding the neurobiology of neuropsychiatric disorders and discovering new treatments. Our findings suggest that the radioligand [18F]FPEB is able to capture some of the changes in mGluR5 in response to ketamine. However, compared to [11C]ABP688, the magnitude of the ketamine-induced change in mGluR5 was smaller and variability was higher. Further, the previously observed downregulation of mGluR5 at 24 h post-ketamine17 was not detected using [18F]FPEB. It is also important to note that the correction procedures necessary to account for residual [18F] activity may have introduced additional variance. Our findings suggest that [11C]ABP688 may be more suitable than [18F]FPEB for measuring changes in mGluR5 availability in drug challenge paradigms designed to probe glutamate transmission.
Supplemental Material
Supplemental material, JCB886316 Supplemetal Material for Measuring the effects of ketamine on mGluR5 using [18F]FPEB and PET by Sophie E Holmes, Jean-Dominique Gallezot, Margaret T Davis, Nicole DellaGioia, David Matuskey, Nabeel Nabulsi, John H Krystal, Jonathan A Javitch, Christine DeLorenzo, Richard E Carson and Irina Esterlis in Journal of Cerebral Blood Flow & Metabolism
Acknowledgements
We thank the staff at the Yale PET Center and the individuals who took part in this study.
Funding
The author(s) disclosed receipt of the following financial support for the research, authorship, and/or publication of this article: This work was supported by the National Institute of Mental Health (R01MH104459) and the National Center for PTSD (NCPTSD).
Declaration of conflicting interests
The author(s) declared the following potential conflicts of interest with respect to the research, authorship, and/or publication of this article: Dr. Krystal acknowledges the following relevant financial interests. He is a co-sponsor of a patent for the intranasal administration of ketamine for the treatment of depression that was licensed by Janssen Pharmaceuticals, the maker of s-ketamine. He has a patent related to the use of riluzole to treat anxiety disorders that was licensed by Biohaven Medical Sciences. He has stock or stock options in Biohaven Medical Sciences, ARett Pharmaceuticals, Blackthorn Therapeutics, and Luc Therapeutics. He consults broadly to the pharmaceutical industry, but his annual income over the past year did not exceed $5000 for any organization. He receives over $5000 in income from the Society of Biological Psychiatry for editing the journal Biological Psychiatry. He has fiduciary responsibility for the International College of Neuropsychopharmacology as president of this organization. The remaining authors declare no competing interests.
ORCID iD
Sophie E Holmes https://orcid.org/0000-0002-4929-1932
Authors’ contributions
IE and JHK conceived and planned the experiment. JDG and SEH analyzed the data with input from REC. CDL provided data from our previous study and assisted with interpretation of results. ND oversaw recruitment and scanning. MTD assisted with psychological screening. DM carried out medical screening and provided medical cover for ketamine administration. N.N was responsible for radiochemistry. JAJ provided expertise on interpretation of findings. SEH wrote the manuscript with input from all co-authors.
Supplemental material
Supplemental material for this article is available online.
References
- 1.Price RB, Shungu DC, Mao X, et al. Amino acid neurotransmitters assessed by proton magnetic resonance spectroscopy: relationship to treatment resistance in major depressive disorder. Biol Psychiatry 2009; 65: 792–800. [DOI] [PMC free article] [PubMed] [Google Scholar]
- 2.Sanacora G, Treccani G, Popoli M.Towards a glutamate hypothesis of depression: an emerging frontier of neuropsychopharmacology for mood disorders. Neuropharmacology 2012; 62: 63–77. [DOI] [PMC free article] [PubMed] [Google Scholar]
- 3.Averill LA, Purohit P, Averill CL, et al. Glutamate dysregulation and glutamatergic therapeutics for PTSD: evidence from human studies. Neurosci Lett 2017; 649: 147–155. [DOI] [PMC free article] [PubMed] [Google Scholar]
- 4.Holmes SE, Girgenti MJ, Davis MT, et al. Altered metabotropic glutamate receptor 5 markers in PTSD: in vivo and postmortem evidence. Proc Natl Acad Sci USA 2017; 114: 8390–8395. [DOI] [PMC free article] [PubMed] [Google Scholar]
- 5.Gigante AD, Bond DJ, Lafer B, et al. Brain glutamate levels measured by magnetic resonance spectroscopy in patients with bipolar disorder: a meta‐analysis. Bipolar Disord 2012; 14: 478–487. [DOI] [PubMed] [Google Scholar]
- 6.Marsman A, van den Heuvel MP, Klomp DW, et al. Glutamate in schizophrenia: a focused review and meta-analysis of 1H-MRS studies. Schizophren Bull 2011; 39; 120–129. [DOI] [PMC free article] [PubMed] [Google Scholar]
- 7.Niswender CM, Conn PJ.Metabotropic glutamate receptors: physiology, pharmacology, and disease. Ann Rev Pharmacol Toxicol 2010; 50: 295–322. [DOI] [PMC free article] [PubMed] [Google Scholar]
- 8.Esterlis I, Holmes SE, Sharma P, et al. Metabotropic glutamatergic receptor 5 and stress disorders: knowledge gained from receptor imaging studies. Biol Psychiatry 2018; 84: 95–105. [DOI] [PMC free article] [PubMed] [Google Scholar]
- 9.Deschwanden A, Karolewicz B, Feyissa AM, et al. Reduced metabotropic glutamate receptor 5 density in major depression determined by [11C] ABP688 PET and postmortem study. Am J Psychiatry 2011; 168: 727–734. [DOI] [PMC free article] [PubMed] [Google Scholar]
- 10.Pałucha A, Brański P, Szewczyk B, et al. Potential antidepressant-like effect of MTEP, a potent and highly selective mGluR5 antagonist. Pharmacol Biochem Behav 2005; 81: 901–906. [DOI] [PubMed] [Google Scholar]
- 11.Tronson NC, Guzman YF, Guedea AL, et al. Metabotropic glutamate receptor 5/Homer interactions underlie stress effects on fear. Biol Psychiatry 2010; 68: 1007–1015. [DOI] [PMC free article] [PubMed] [Google Scholar]
- 12.Schulz B, Fendt M, Gasparini F, et al. The metabotropic glutamate receptor antagonist 2-methyl-6-(phenylethynyl)-pyridine (MPEP) blocks fear conditioning in rats. Neuropharmacology 2001; 41: 1–7. [DOI] [PubMed] [Google Scholar]
- 13.Lener MS, Niciu MJ, Ballard ED, et al. Glutamate and gamma-aminobutyric acid systems in the pathophysiology of major depression and antidepressant response to ketamine. Biol Psychiatry 2017; 81: 886–897. [DOI] [PMC free article] [PubMed] [Google Scholar]
- 14.Rowland LM, Bustillo JR, Mullins PG, et al. Effects of ketamine on anterior cingulate glutamate metabolism in healthy humans: a 4-T proton MRS study. Am J Psychiatry 2005; 162: 394–396. [DOI] [PubMed] [Google Scholar]
- 15.Stone JM, Dietrich C, Edden R, et al. Ketamine effects on brain GABA and glutamate levels with 1H-MRS: relationship to ketamine-induced psychopathology. Mol Psychiatry 2012; 17: 664. [DOI] [PMC free article] [PubMed] [Google Scholar]
- 16.Tu JC, Xiao B, Naisbitt S, et al. Coupling of mGluR/homer and PSD-95 complexes by the Shank family of postsynaptic density proteins. Neuron 1999; 23: 583–592. [DOI] [PubMed] [Google Scholar]
- 17.DeLorenzo C, DellaGioia N, Bloch M, et al. In vivo ketamine-induced changes in [11C]ABP688 binding to metabotropic glutamate receptor subtype 5. Biol Psychiatry 2015; 77: 266–275. [DOI] [PMC free article] [PubMed] [Google Scholar]
- 18.Esterlis I, DellaGioia N, Pietrzak RH, et al. Ketamine-induced reduction in mGluR5 availability is associated with an antidepressant response: an [11 C] ABP688 and PET imaging study in depression. Mol Psychiatry 2018; 23: 824. [DOI] [PMC free article] [PubMed] [Google Scholar]
- 19.Lim K, Labaree D, Li S, Huang Y.Preparation of the metabotropic glutamate receptor 5 (mGluR5) PET tracer [18F]FPEB for human use: An automated radiosynthesis and a novel one-pot synthesis of its radiolabeling precursor. Appl Radiat Isotopes 2014; 94: 349–354. [DOI] [PMC free article] [PubMed] [Google Scholar]
- 20.Wong DF, Waterhouse R, Kuwabara H, et al. 18F-FPEB, a PET radiopharmaceutical for quantifying metabotropic glutamate 5 receptors: a first-in-human study of radiochemical safety, biokinetics, and radiation dosimetry. J Nucl Med 2013; 54: 388–396. [DOI] [PMC free article] [PubMed] [Google Scholar]
- 21.Sullivan JM, Lim K, Labaree D, et al. Kinetic analysis of the metabotropic glutamate subtype 5 tracer [18F] FPEB in bolus and bolus-plus-constant-infusion studies in humans. J Cereb Blood Flow Metab 2013; 33: 532–541 [DOI] [PMC free article] [PubMed] [Google Scholar]
- 22.Akkus F, Terbeck S, Ametamey SM, et al. Metabotropic glutamate receptor 5 binding in patients with obsessive-compulsive disorder. Int J Neuropsychopharmacol 2014; 17: 1915–1922. [DOI] [PubMed] [Google Scholar]
- 23.Abdallah CG, Hannestad J, Mason GF, et al. Metabotropic glutamate receptor 5 and glutamate involvement in major depressive disorder: a multimodal imaging study. Biolog Psychiatry 2017; 2: 449–456. [DOI] [PMC free article] [PubMed] [Google Scholar]
- 24.Fatemi SH, Wong DF, Brašić JR, et al. Metabotropic glutamate receptor 5 tracer [18 F]-FPEB displays increased binding potential in postcentral gyrus and cerebellum of male individuals with autism: a pilot PET study. Cerebell Atax 2018; 5: 3. [DOI] [PMC free article] [PubMed] [Google Scholar]
- 25.Akkus F, Ametamey SM, Treyer V, et al. Marked global reduction in mGluR5 receptor binding in smokers and ex-smokers determined by [11C] ABP688 positron emission tomography. Proc Natl Acad Sci USA 2013; 110: 737–742. [DOI] [PMC free article] [PubMed] [Google Scholar]
- 26.Leurquin-Sterk G, Crunelle C, Ceccarini J, et al. Alcohol addiction is associated with decreased limbic mGluR5 availability: a 18F-FPEB PET study in human. J Nucl Med 2016; 57(Supplement 2): 15.26514173 [Google Scholar]
- 27.Davis MT, Hilmer A, Holmes SE, et al. Preliminary evidence for dysregulation in MGluR5 as a biomarker of suicidal ideation in PTSD: a FPEB imaging study. PNAS 2019; 116: 11490. [DOI] [PMC free article] [PubMed] [Google Scholar]
- 28.First MB, Gibbon M.The structured clinical interview for DSM-IV axis I disorders (SCID-I) and the structured clinical interview for DSM-IV axis II disorders (SCID-II). In: MJ Hilsenroth, DL Segal. (eds) Comprehensive handbook of psychological assessment, vol. 2. Personality assessment. Hoboken, NJ, US: John Wiley & Sons Inc., 2004, pp. 134–143. [Google Scholar]
- 29.Hamilton M.A rating scale for depression. J Neurol Neurosurg Psychiatry 1960; 23: 56. [DOI] [PMC free article] [PubMed] [Google Scholar]
- 30.Montgomery SA, Åsberg M.A new depression scale designed to be sensitive to change. Br J Psychiatry 1979; 134: 382–389. [DOI] [PubMed] [Google Scholar]
- 31.Beck AT, Steer RA, Carbin MG.Psychometric properties of the beck depression inventory: twenty-five years of evaluation. Clin Psychol Rev 1988; 8: 77–100. [Google Scholar]
- 32.Bremner JD, Krystal JH, Putnam FW, et al. Measurement of dissociative states with the clinician‐administered dissociative states scale (CADSS). J Traum Stress 1998; 11: 125–136. [DOI] [PubMed] [Google Scholar]
- 33.McNair DM.Manual profile of mood states. San Diego, CA: Educational & Industrial testing service, 1971. [Google Scholar]
- 34.Park E, Sullivan JM, Planeta B, et al. Test-retest reproducibility of the metabotropic glutamate receptor 5 ligand [18F]FPEB with bolus plus constant infusion in humans. Eur J Nucl Med 2015; 42: 1530–1541. [DOI] [PMC free article] [PubMed] [Google Scholar]
- 35.DeLorenzo C, Gallezot J-D, Gardus J, et al. In vivo variation in same-day estimates of metabotropic glutamate receptor subtype 5 binding using [11C]ABP688 and [18F]FPEB. J Cereb Blood Flow Metab 2017; 37: 2716–2727. [DOI] [PMC free article] [PubMed] [Google Scholar]
- 36.Gallezot J-D, Nabulsi N, Neumeister A, et al. Kinetic modeling of the serotonin 5-HT(1B) receptor radioligand [(11)C]P943 in humans. J Cereb Blood Flow Metab 2010; 30: 196–210. [DOI] [PMC free article] [PubMed] [Google Scholar]
- 37.Anticevic A, Gancsos M, Murray JD, et al. NMDA receptor function in large-scale anticorrelated neural systems with implications for cognition and schizophrenia. Proc Natl Acad Sci USA 2012; 109: 16720–16725. [DOI] [PMC free article] [PubMed] [Google Scholar]
- 38.Driesen NR, McCarthy G, Bhagwagar Z, et al. Relationship of resting brain hyperconnectivity and schizophrenia-like symptoms produced by the NMDA receptor antagonist ketamine in humans. Mol Psychiatry 2013; 18: 1199. [DOI] [PMC free article] [PubMed] [Google Scholar]
- 39.Krystal JH, Karper LP, Seibyl JP, et al. Subanesthetic effects of the noncompetitive NMDA antagonist, ketamine, in humans: psychotomimetic, perceptual, cognitive, and neuroendocrine responses. Arch General Psychiatry 1994; 51: 199–214. [DOI] [PubMed] [Google Scholar]
- 40.Newcomer JW, Farber NB, Jevtovic-Todorovic V, et al. Ketamine-induced NMDA receptor hypofunction as a model of memory impairment and psychosis. Neuropsychopharmacology 1999; 20: 106–118. [DOI] [PubMed] [Google Scholar]
- 41.Papademetris X, Jackowski AP, Schultz RT, et al. Integrated intensity and point-feature nonrigid registration. Med Image Comput Comput Assist Interv 2001; 3216: 763–770. [DOI] [PMC free article] [PubMed] [Google Scholar]
- 42.Rueckert D, Sonoda LI, Hayes C, et al. Nonrigid registration using free-form deformations: application to breast MR images. IEEE Transac Med Imag 1999; 18: 712–721. [DOI] [PubMed] [Google Scholar]
- 43.Tzourio-Mazoyer N, Landeau B, Papathanassiou D, et al. Automated anatomical labeling of activations in SPM using a macroscopic anatomical parcellation of the MNI MRI single-subject brain. Neuroimage 2002; 15: 273–289. [DOI] [PubMed] [Google Scholar]
- 44.Gunn RN, Gunn SR, Cunningham VJ.Positron emission tomography compartmental models. J Cereb Blood Flow Metab 2001; 21: 635–652. [DOI] [PubMed] [Google Scholar]
- 45.Yasuno F, Brown AK, Zoghbi SS, et al. The PET radioligand [11C]MePPEP binds reversibly and with high specific signal to cannabinoid CB1 receptors in nonhuman primate brain. Neuropsychopharmacology 2007; 33: 259. [DOI] [PubMed] [Google Scholar]
- 46.Zimmer ER, Parent MJ, Leuzy A, et al. Imaging in vivo glutamate fluctuations with [11C] ABP688: a GLT-1 challenge with ceftriaxone. J Cereb Blood Flow Metab 2015; 35: 1169–1174. [DOI] [PMC free article] [PubMed] [Google Scholar]
- 47.Miyake N, Skinbjerg M, Easwaramoorthy B, et al. Imaging changes in glutamate transmission in vivo with the metabotropic glutamate receptor 5 tracer [11C] ABP688 and N-acetylcysteine challenge. Biol Psychiatry 2011; 69: 822–824. [DOI] [PubMed] [Google Scholar]
- 48.Sandiego CM, Nabulsi N, Lin S-F, et al. Studies of the metabotropic glutamate receptor 5 radioligand [11C]ABP688 with N-acetylcysteine challenge in rhesus monkeys. Synapse 2013; 67: 489–501. [DOI] [PMC free article] [PubMed] [Google Scholar]
- 49.DeLorenzo C, Kumar JD, Mann JJ, Parsey RV.In vivo variation in metabotropic glutamate receptor subtype 5 binding using positron emission tomography and [11C] ABP688. J Cereb Blood Flow Metab 2011; 31: 2169–2180. [DOI] [PMC free article] [PubMed] [Google Scholar]
- 50.Marquez de Prado B, Castaneda T, Galindo A, et al. Melatonin disrupts circadian rhythms of glutamate and GABA in the neostriatum of the awake rat: a microdialysis study. J Pineal Res 2000; 29: 209–216. [DOI] [PubMed] [Google Scholar]
- 51.Fuller PM, Gooley JJ, Saper CB.Neurobiology of the sleep-wake cycle: sleep architecture, circadian regulation, and regulatory feedback. J Biol Rhythms 2006; 21: 482–493. [DOI] [PubMed] [Google Scholar]
- 52.Meng T, Yuan S, Zheng Z, et al. Effects of endogenous melatonin on glutamate and GABA rhythms in the striatum of unilateral 6-hydroxydopamine-lesioned rats. Neuroscience 2015; 286: 308–315. [DOI] [PubMed] [Google Scholar]
- 53.Castañeda TR, de Prado BM, Prieto D, et al. Circadian rhythms of dopamine, glutamate and GABA in the striatum and nucleus accumbens of the awake rat: modulation by light. J Pineal Res 2004; 36: 177–185. [DOI] [PubMed] [Google Scholar]
- 54.Elmenhorst D, Mertens K, Kroll T, et al. Circadian variation of metabotropic glutamate receptor 5 availability in the rat brain. J Sleep Res 2016; 25: 754–761. [DOI] [PubMed] [Google Scholar]
- 55.Wulff K, Gatti S, Wettstein JG, et al. Sleep and circadian rhythm disruption in psychiatric and neurodegenerative disease. Nat Rev Neurosci 2010; 11: 589. [DOI] [PubMed] [Google Scholar]
- 56.Berry SA, Shah MC, Khan N, et al. Rapid agonist-induced internalization of the 5-hydroxytryptamine2A receptor occurs via the endosome pathway in vitro. Mol Pharmacol 1996; 50: 306–313. [PubMed] [Google Scholar]
- 57.Bouaziz E, Emerit MB, Vodjdani G, et al. Neuronal phenotype dependency of agonist-induced internalization of the 5-HT1A serotonin receptor. J Neurosci 2014; 34: 282–294. [DOI] [PMC free article] [PubMed] [Google Scholar]
- 58.Riad M, Rbah L, Verdurand M, et al. Unchanged density of 5-HT1A autoreceptors on the plasma membrane of nucleus raphe dorsalis neurons in rats chronically treated with fluoxetine. Neuroscience 2008; 151: 692–700. [DOI] [PubMed] [Google Scholar]
- 59.Macey TA, Gurevich VV, Neve KA.Preferential Interaction between the dopamine D2 receptor and Arrestin2 in neostriatal neurons. Mol Pharmacol 2004; 66: 1635–1642. [DOI] [PubMed] [Google Scholar]
- 60.Guo N, Guo W, Kralikova M, et al. Impact of D2 receptor internalization on binding affinity of neuroimaging radiotracers. Neuropsychopharmacology 2010; 35: 806. [DOI] [PMC free article] [PubMed] [Google Scholar]
- 61.Patel S, Hamill TG, Connolly B, et al. Species differences in mGluR5 binding sites in mammalian central nervous system determined using in vitro binding with [18F]F-PEB. Nucl Med Biol 2007; 34: 1009–1017. [DOI] [PubMed] [Google Scholar]
- 62.DeLorenzo C, Milak MS, Brennan KG, et al. In vivo positron emission tomography imaging with [11 C] ABP688: binding variability and specificity for the metabotropic glutamate receptor subtype 5 in baboons. Eur J Nucl Med Mol Imag 2011; 38: 1083–1094. [DOI] [PMC free article] [PubMed] [Google Scholar]
- 63.DeLorenzo C, Gallezot J-D, Gardus J, et al. In vivo variation in same-day estimates of metabotropic glutamate receptor subtype 5 binding using [11C] ABP688 and [18F] FPEB. J Cereb Blood Flow Metab 2017; 37: 2716–2727. [DOI] [PMC free article] [PubMed] [Google Scholar]
Associated Data
This section collects any data citations, data availability statements, or supplementary materials included in this article.
Supplementary Materials
Supplemental material, JCB886316 Supplemetal Material for Measuring the effects of ketamine on mGluR5 using [18F]FPEB and PET by Sophie E Holmes, Jean-Dominique Gallezot, Margaret T Davis, Nicole DellaGioia, David Matuskey, Nabeel Nabulsi, John H Krystal, Jonathan A Javitch, Christine DeLorenzo, Richard E Carson and Irina Esterlis in Journal of Cerebral Blood Flow & Metabolism