Abstract
Intracranial pressure (ICP) is typically measured invasively through a sensor placed inside the brain or a needle inserted into the spinal canal, limiting the patient population on which this assessment can be performed. Currently, non-invasive methods are limited due to lack of sensitivity and thus only apply to extreme cases of increased ICP, instead of use in general clinical practice. We demonstrate a novel application for near-infrared spectroscopy (NIRS) to accurately estimate ICP changes over time. Using a non-human primate (Rhesus Macaque) model, we collected optical data while we induced ICP oscillations at multiple ICP levels obtained by manipulating the height of a fluid column connected via a catheter to the lateral ventricle. Hemodynamic responses to ICP changes were measured at the occipital pole and compared to changes detected by a conventional intraparenchymal ICP probe. We demonstrate that hemoglobin concentrations are highly correlated with induced ICP oscillations and that this response is frequency dependent. We translated the NIRS data into non-invasive ICP measurements via a fitted non-parametric transfer function, demonstrating a match in both magnitude and time alignment with an invasively measured reference. Our results demonstrate that NIRS has the potential for non-invasive ICP monitoring.
Keywords: Intracranial pressure, near-infrared spectroscopy, non-human primates, transfer function, hemodynamics
Introduction
Elevated intracranial pressure (ICP) is a hallmark of many diseases, including traumatic brain injury (TBI), tumor, hematoma, hydrocephalus, venous sinus obstruction, encephalitis, meningitis, and subarachnoid hemorrhage, resulting from the uncompensated change in brain volume.1,2 Small to moderate elevation of ICP can lead to relatively benign symptoms such as headaches, whereas higher levels of ICP can result in herniation and death. Thus, the monitoring of ICP is critical to circumvent adverse sequalae in clinically at-risk patients.
ICP of up to 15 mmHg is considered normal in adult humans, while levels of 15 to 25 mmHg are still tolerable3 for short to moderate durations. Varying with disease, a mean ICP elevation over a prolonged time (>30 min) exceeding 20 to 25 mmHg is considered pathological and requires treatment.4 In TBI, measuring ICP has become a standard procedure when possible due to the correlation of ICP elevation with poor outcome.5–7 Therefore, accurate measurements of ICP are an important diagnostic and prognostic tool for monitoring disease progression, assessing hemodynamic status, and guiding treatment to avoid the substantial negative consequences of elevated ICP.
The most common clinically used ICP sensors are intra-parenchymal pressure probes or intra-ventricular catheters placed into the brain through a hole in the skull.8 Sub-arachnoid and epidural transducers are also used, but yield less accuracy.7 Depending on the surgical conditions, measuring fluid pressure via lumbar puncture can determine ICP with less risk than intracranial methods.7 Development of extracorporeal devices would reduce the risk of infection, hemorrhage, pain and discomfort caused by invasive ICP monitoring.7 In addition, an accurate measurement of ICP allows for further extrapolation to other clinically useful correlates, including cerebral perfusion pressure (CPP) defined as the pressure differential between mean arterial blood pressure (MAP) and ICP, such that CPP=MAP-ICP, and insight into cerebral autoregulation (CA).
Several attempts have been made to address this need. Swoboda et al.9 measured impedance mismatches between the carotid artery (influenced by ICP in the skull) and an unrelated artery (e.g. a finger) to extrapolate pressure changes in the main arterial supply to the brain. ICP can also be estimated non-invasively through the cochlear fluid pressure, which can be measured by tympanic membrane displacement.10 Other groups have utilized transcranial Doppler sonography, which measures the blood flow velocity in the middle cerebral artery, with mixed results.11,12 Near-infrared spectroscopy (NIRS),7 an optical, non-invasive method able to quantify the concentration of oxygenated hemoglobin (HbO) and deoxygenated hemoglobin (Hb) in the brain, has also been tested clinically,13,14 but extrapolation of NIRS-based signals into ICP measurements was limited by the lack of a general data analysis strategy. To this end, we introduce an experimental model where ICP baseline changes and oscillations were induced incrementally through fluid infusion in non-human primates (NHPs), a situation comparable to hydrocephalus. We demonstrate that NIRS and ICP are related in this setting, and we build a transfer function approach to translate HbO changes measured non-invasively with NIRS into ICP changes. Finally, we extrapolate to a clinical picture incorporating ICP, CPP, and CA as a fuller indication of vascular changes which may be associated with diagnostic and prognostic indicators.
Methods
Changes in ICP were induced via changes in fluid volume in NHPs, mimicking a form of hydrocephalus. ICP was altered actively by fluid injection via an intraventricular catheter and monitored with a traditional intraparenchymal ICP sensor, while hemoglobin concentration changes were measured non-invasively on the skull with NIRS. The proposed approach is illustrated in Figure 1. The NIRS-based hemodynamic response was used to fit a transfer function that translates changes in HbO concentration into changes in ICP. We will refer to the estimated ICP as ICPNIRS, to invasively measured intraparenchymal ICP as ICPip, and the conceptual idea of pressure as ICP.
Figure 1.
Experimental setup, showing the placement of the ICP sensor in the brain matter, the ventricular catheter and the NIRS probe. Hemodynamic responses from NIRS, here changes in oxygenated hemoglobin (ΔHbO), were used to estimate a transfer function to calculate estimates of non-invasive ICPNIRS changes.
Animal model and intraparenchymal pressure probe placement
Seven healthy male rhesus macaques (Macaca mulatta) with an average age of 8.3 ± 1.7 years and an average weight of 10.5 ± 2.5 kg were used in these experiments. All procedures were approved by the Institutional Animal Care and Use Committee of the University of Pittsburgh and complied with guidelines set forth in the National Institute of Health’s Guide for the Care and Use of Laboratory Animals. The facilities at the University of Pittsburgh are accredited by the Association for Assessment and Accreditation of Laboratory Animal Care International (AAALAC) and in compliance with the Standards for Humane Care and Use of Laboratory Animals of the Office of Laboratory Animal Welfare (OLAW D16-00118). Furthermore, this manuscript is in compliance with the Animal Research: Reporting in Vivo Experiments (ARRIVE) guidelines. All NHPs were initially sedated using 20 mg/kg of ketamine, 1 mg/kg diazepam, and 0.04 mg/kg atropine in the home cage. In the surgery room, animals were intubated and maintained under anesthesia using 1–3% isoflurane. After placing the A-line into the carotid artery for arterial blood pressure (ABP) measurements, animals were ventilated and given a paralytic, vecuronium bromide (0.1 mg/kg/h). Data streams of ICPip and ABP were recorded at 100 Hz using an MPR1 Datalogger from Raumedic. In order to monitor ICPip with the traditional intraparenchymal probe and to manipulate pressure via intraventricular fluid infusion, the skull was exposed and two small craniotomies were made to place the ICPip sensor (Precision Pressure Catheter, Raumedic Helmbrechts, Germany) into the brain frontal lobe parenchyma and a catheter in the lateral ventricle for fluid injection (Lumbar Catheter, Medtronic, Minneapolis MN). The holes were then sealed with bone wax to reduce the possibility of cerebrospinal fluid leakage.
The intraventricular catheter was connected to a saline reservoir. Changing the height of the reservoir relative to the animal’s head induced a pressure change through gravitational force. Alternatively, in three animals, ICP was changed by connecting the ventricular catheter to a syringe pump which applied mechanical force. While the gravitational system maintained a more stable elevated ICP baseline, the syringe pump allowed for fluid volume control and faster changes. An overview of the induced ICP changes and each system used to change ICP is given in Supplemental Figure 1. The baseline of ICP was changed from normal pressure (about 3–10 mmHg) in increments of 3 mmHg until reaching 15 mmHg, at which point pressure was increased in increments of 10 mmHg to a total height of 40 mmHg, which is considered severely elevated. At each baseline value, ICP oscillations were induced by rotating the reservoir or oscillating the piston in the syringe pump. The oscillations were set to five different frequencies distributed between 0.009 Hz and 0.059 Hz. These frequencies were chosen to fall before and after previously published autoregulatory cutoff frequencies.15,16 The order of ICP oscillation frequency was randomized once and then held the same in all experiments (see Supplemental Table 1). Due to the shorter duration of faster frequencies, the highest frequency was induced for eight periods, while all others were induced for four periods. This ensured enough signal length for later processing steps, including the elimination of noise and extraneous signals such as respiration that were unrelated to our primary goals. Each experiment lasted for a period of 10 to 15 h.
NIRS for extracranial ICP measurements
Cerebral hemoglobin concentration changes were measured with a multi-distance, frequency domain NIRS system, the OxiplexTS (ISS Inc., Champaign, IL, USA). Two wavelengths were used to illuminate the tissue, 690 nm and 830 nm. Source detector distances were set to 0.75 cm, 1.33 cm, 1.66 cm and 2 cm. The optical fibers were placed directly on the exposed skull to avoid contamination of the signal by blood circulation in the muscle and skin tissue. In all animals, the probes were placed over the visual cortex just anterior to the occipital pole, maximizing the distance from the point of fluid injection. Data were acquired at 5 Hz, sufficient to capture slow physiological waves and heart and respiration rates.
For calculating hemodynamic changes over time, the modified Beer–Lambert law was used based on the second longest source-detector separation (1.66 cm). The modified Beer–Lambert law translates light attenuation from two wavelengths into hemoglobin concentration changes.17 Temporal changes in oxygenated (ΔHbO), deoxygenated (ΔHb), and total (ΔHbT = ΔHbO + ΔHb) hemoglobin concentration were used for the calculations described below.
Signal processing
The 100 Hz ICPip data were down-sampled by first applying a low-pass filter to prevent aliasing and then selecting every 20th data point, resulting in a 5 Hz data-sampling rate, matching the optical data. Based on simultaneously placed markers during the recording, the pressure and hemodynamic data were aligned and truncated to be equal length.
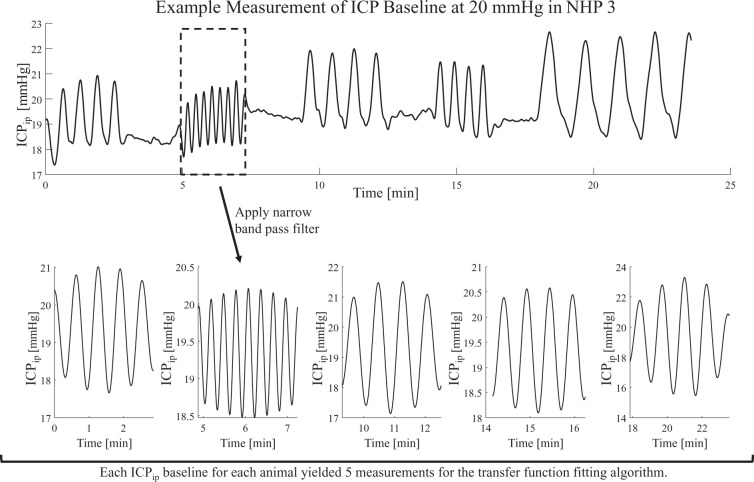
Using a narrow band-pass filter around the induced frequencies, a single frequency signal was approximated and extracted. Given the nature of the narrow band-pass, potential baseline drifts and artifacts were removed in this process and no further preparations of the signals were needed. The single frequency segment was then treated as an independent measurement (see Figure 2). To account for small variations in the frequency content from the intended frequency values shown in Supplemental Table 1, the actual induced frequencies were extracted from the ICPip data through auto-correlation. Narrow band pass filtering around the induced frequencies was derived from the Parks–McClellan algorithm18 for optimal finite response (FIR) filter design (‘firpm’, MATLAB, The MathWorks Inc., Natick, MA, USA). The high filter order of N ≥ 2000 was estimated by the Parks–McCellan algorithm (‘firpmord’, MATLAB, The MathWorks Inc., Natick, MA, USA). High order filters were used to remove all signals except the induced frequency content from ICPip oscillation.
Figure 2.
Example ICPip data from one animal. The raw data (top graph) were filtered around the induced frequencies. The period at which each frequency was induced was then treated as an independent measurement available for data fitting.
Using the Hilbert transform, the magnitude and phase information of the filtered signal were calculated. A measurement was discarded as unstable if the standard deviation of the phase difference between ΔHbO and ΔHb exceeded 30°, corresponding to unstable physiological responses to ICP oscillations. Furthermore, a measurement was discarded if the magnitude of ΔHbO at the induced frequencies did not exceed the noise level. Noise was defined as the magnitude of the same frequency at a time where no ICP oscillations were induced.
Transfer function analysis
Based on the extracted frequency content described above, a leave-one-out cross-validation was performed to estimate a generalized transfer function while avoiding over-fitting.19 Each of the five different frequencies induced during one baseline level of ICP was considered a separate input to the transfer function estimation. This method increased the amount of data sets available for cross-validation. The total amount of 38 measurements times 5 frequencies produced 190 data sets. After applying the signal quality criteria, 33 of these measurements were excluded, leaving 157 remaining data sets available for cross-validation.
Through L-curve analysis, the balance between precision and generalization was set at four poles and two zeros for the discrete-time, frequency domain transfer function. Under these conditions the “tfest” function (tfest, MATLAB, The MathWorks Inc., Natick, MA, USA) was used for data fitting. This algorithm optimizes the numerator and denominator of the transfer function based on a non-linear least-squares algorithm.20 The numerator and denominator of the fitted transfer function of the leave-one-out cross-validation were averaged. This averaged transfer function was then applied to low-pass filtered hemoglobin concentration measurements. Specifically, the estimated transfer function was then applied to low-pass filtered data, cutting off at 0.1 Hz, with a lower filter order of N = 3. All filters were applied using MATLABs ‘filtfilt’ function (‘filtfilt, MATLAB, The MathWorks Inc., Natick, MA, USA), which guaranties a zero-phase delay by applying the filter in both forward and backward direction. The final validation was therefore based on partially unknown data with a much wider frequency range than the narrow band filtered data used for finding the transfer function.
Results
We measured cerebral hemodynamic changes non-invasively with NIRS in seven anesthetized NHPs in which we were able to manipulate and measure ICP directly. In order to ensure good contact of the probe with the animal, data fidelity was checked by observing expected natural hemodynamic changes in the NIRS data (i.e. respiration and heartbeat oscillations), and later confirmed in the form of a fast Fourier transform (FFT). We observed heart rate and respiration frequencies in the FFTs of all animals used. A spectrogram of a representative measurement illustrating the frequency content over time can be found in Supplemental Figure 2.
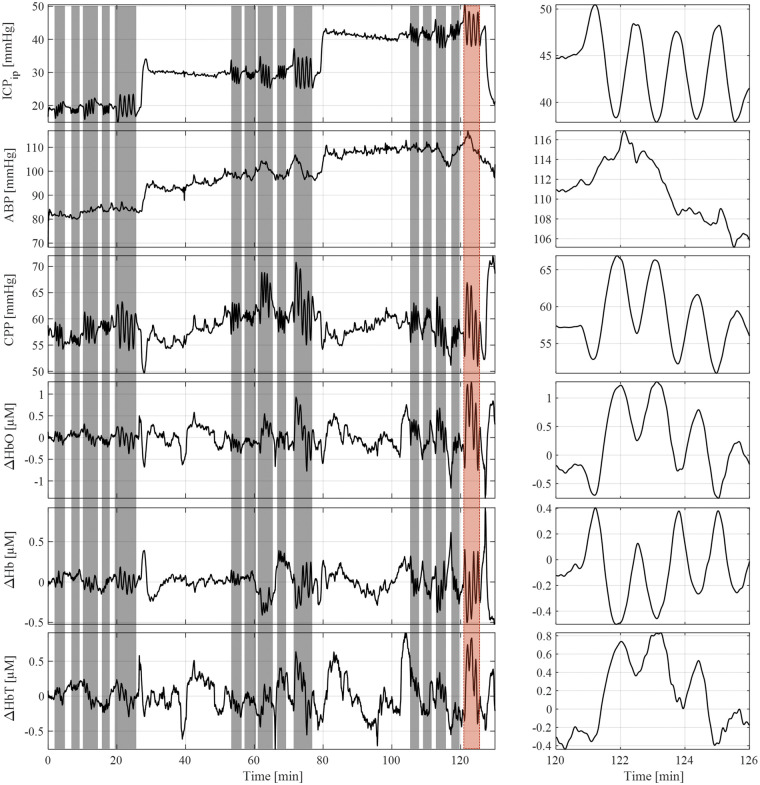
Baseline step increases in ICP were recorded for each trial by the conventional intraparenchymal pressure probe, as well as ABP, CPP, ΔHbO, and ΔHb. Figure 3 shows ICP oscillations had a notable effect on the hemodynamics, but did not induce oscillations in ABP. The data in this graph have been low-pass filtered to eliminate respiration and heart-rate influences on the signal.
Figure 3.
This representative measurement shows parts of the protocol. The top graph illustrates the baseline changes in ICPip with sinosoidal induced oscillations highlighted in grey. A close up of the induced oscillation indicated by the red background is shown on the right. Oscillations in ICP did not translate into ABP oscillations, shown in the second graph from the top. CPP, ΔHbO, ΔHb, and ΔHbT showed oscillations corresponding to the ICPip change induced.
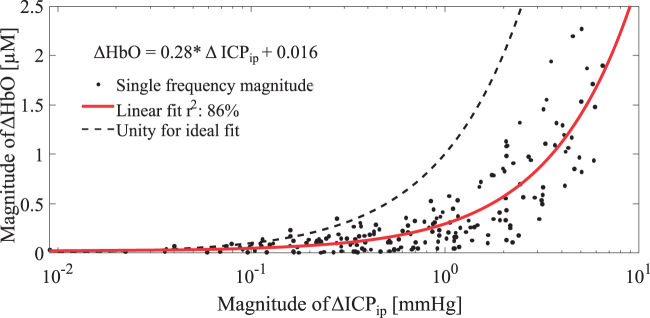
We first evaluated whether the magnitudes of ΔHbO alone as measured by extracranial NIRS were consistent with the changes in ICP observed via the invasive parenchymal probe. Using the narrow band pass filtered data, the magnitudes of the induced oscillations were extracted by means of the Hilbert transform. Figure 4 shows the relationship between ΔHbO magnitudes and ΔICPip magnitudes, where each dot corresponds to one of the 157 single frequency data sets. The red curve represents a linear fit, while the dashed black line indicates a function with unity slope. The magnitudes of ΔICPip obtained from the conventional intraparenchymal probe did not translate directly into ΔHbO (Figure 4). In addition, the phase difference between ΔHbO and ΔICPip was slightly larger than 180°, indicating the need for a more complex transfer function translating ΔHbO into ΔICPNIRS.
Figure 4.
Linear relationship between oscillation magnitudes in ΔHbO and invasively measured ΔICPip. The linear fit is shown as a function in the top left. Note that the x-axis is shown in logarithmic scale to improve visibility of low magnitude data points. A unity line is shown for reference to indicate an ideal fit.
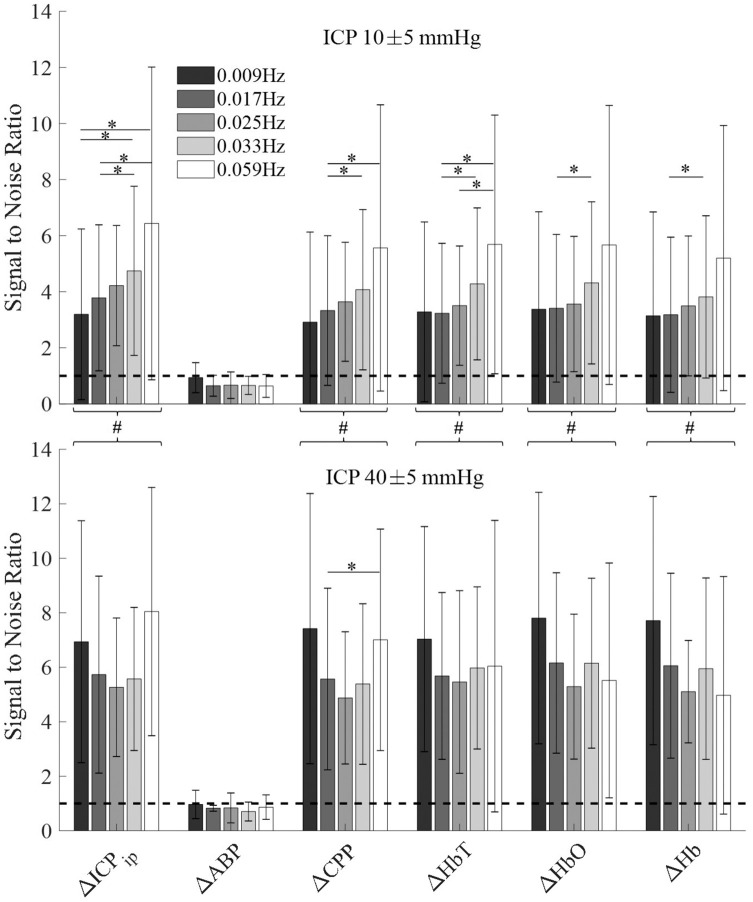
Signal-to-noise ratio (SNR) was defined as magnitudes of oscillation divided by the magnitudes of periods in which these oscillations were not induced into ICP. It thus yields a metric to understand which signal was influenced by ICP oscillations. High SNR was observed for ICPip, CPP, and hemodynamic measurements of ΔHbO, ΔHb and ΔHbT, as illustrated in Figure 5.
Figure 5.
The signal-to-noise ratio (SNR) was calculated as the ratio of frequency specific amplitudes. The amplitude during ICP oscillation is considered the signal, while amplitude of the same frequency without induced ICP oscillation is considered noise. The dashed line shows the noise level at SNR = 1. Error bars show the standard deviation at every given frequency. Top: Healthy baseline ICP. Bottom: Highly elevated baseline ICP. A single asterisk indicates significantly different (p < 0.05) average SNR calculated by a paired t-test across frequencies within one signal type. The pound sign indicates significantly higher SNR in high ICP baseline (p < 0.05) as indicated by two-sample t-test when treating all frequencies of a signal as one group.
We next measured the SNR at two different ICP baselines (Figure 5). Using an unpaired Student’s t-test, no significant differences were found between SNR at 10 mmHg and 40 mmHg for ABP (p = 0.21). Thus, responses remained at or below the level of the noise, leaving the SNR below 1. All other signals showed a significant increase in SNR (p < 0.05) when treating all frequencies of one signal as a single group. Frequency-dependent trends in the magnitude were observed at low ICP baseline values but reduced at highly elevated ICP, suggesting a loss of frequency-dependent magnitude changes.
In order to account for frequency dependent and ICP baseline-dependent changes in ΔHbO, we fit a transfer function to the hemodynamic data. The transfer function found, H(z), is given by
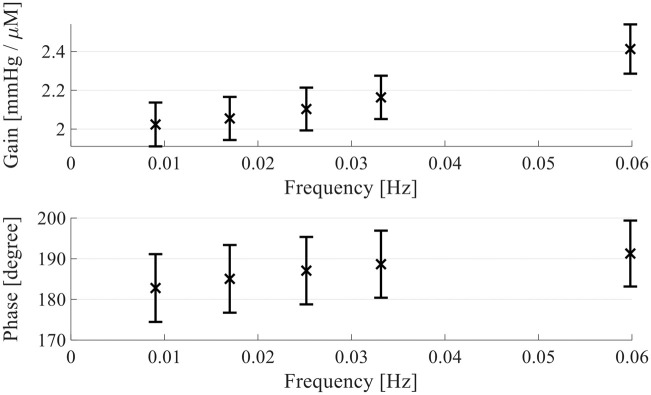
During the fitting, one of the zeros in the numerator was fitted to 0, such that the resulting transfer function is based on one zero and four poles. The outcome is visualized in the Bode plot in Figure 6. The error bars represent the standard deviation over all cross-correlation subsets and show an increase in gain over frequency. Similarly, the phase difference changes over frequency, confirming a frequency dependence for the translation of ΔHbO to ΔICPip.
Figure 6.
Bode plot of the found transfer function. The error bars show the standard deviation over all subsets of the cross-validation algorithm used to fit the transfer functions. The mean of all coefficients of all transfer functions is calculated and its gain (top) and phase delay (bottom) from ΔHbO to ΔICPip is shown above.
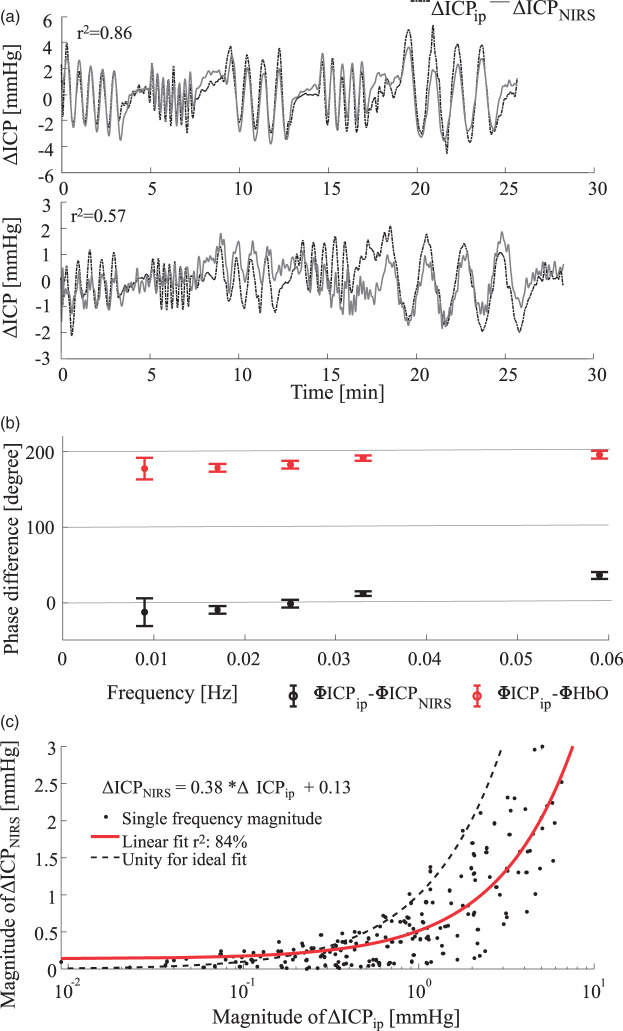
After applying the transfer function to low-pass filtered ΔHbO data of low filter order, the estimated, non-invasive ΔICPNIRS is plotted in Figure 7(a). Since the transfer function was applied to low-pass filtered data rather than narrow band pass filtered data, the test signal has a higher frequency content than the data used to fit the transfer function. The top graph in Figure 7(a) shows time traces of ICPip (dashed line) and our calculated NIRS-based ICPNIRS (solid line). The time traces qualitatively match well in terms of amplitude as well as phase delay (r2 = 0.86). The lower graph of Figure 7(a) represents a similar measurement at the same ICP baseline of 40 mmHg in a different animal. The transfer function result is underestimated but the dynamic trends nonetheless show high correlation (r2 = 0.57).
Figure 7.
(a) Comparison of invasive, parenchymal probe (dotted line) and non-invasive NIRS (solid line) ICP measurements. Top: Representative example of NHP 4 at a baseline of 40 mmHg. Bottom: Underestimation in animal 5 at a baseline of 40 mmHg. Pearson correlation is shown in the top left of both graphs. (b) Phase difference between invasively measured ICP and estimated NIRS-based ICPNIRS is shown as black error bars. The error bar indicates the standard deviation and the cross indicates the mean phase difference over all 157 single-frequency data sets. Similarly, the red line indicates the phase difference between invasive ICPip and measured ΔHbO. (c) Comparison of magnitudes after transfer function analysis. The red line indicates a linear fit to the magnitudes. The right sided, downward shift compared to the ideal unity line indicates a tendency for underestimation of the oscillation magnitudes.
The over- and under-estimations are also evident in a magnitude comparison in Figure 7(c). When comparing the magnitude differences to Figure 4, a clear improvement can be observed, as the linear fit (red line) now lies closer to the unity line (dashed line). The linear fit still lies below the unity line, indicating a tendency overall to underestimate the ICPip magnitudes.
Aside from the magnitude similarity, the minimization of phase lags between ICPNIRS and invasively measured ICP (ICPip) is indicative of a good transfer function. Figure 7(b) shows the average phase delay between ΔHbO and ΔICPip in red. Phase differences evolve around 180°. Applying the transfer function then allows for a phase delay evolving around 0° between ΔICPNIRS and ΔICPip shown in black.
Discussion
We developed an approach to estimate changes in ICP non-invasively using hemodynamic changes as measured with NIRS. Using a NHP model in which we induced ICP changes by means of fluid insertion, we showed that the magnitude and time lag of ICPNIRS changes can be reconstructed based on a transfer function approach and thus accurately estimate ICPip changes detected by a conventional invasive probe.
During induced ICP oscillation, we observed that ΔHb and ΔHbO were out of phase (close to 180°) with each other, which is consistent with blood flow and blood volume changes.21 The ICP changes induced in this study are expected to elicit a global effect across the brain. The change in ICP leads to a subsequent change in CPP under the assumption that ABP is uncorrelated. Confirmation of the assumed lack of ABP correlation is expressed in Figure 5, in which the SNR of the induced frequencies is close to 1 for ABP. If CPP decreases as a result of an ICP increase, it is thus expected that brain oxygenation and ΔHbO decrease. Taken together, our data therefore suggest that blood flow plays a role in ICP-induced changes. Our work is consistent with a previous study demonstrating the capacity of NIRS to capture fluid injections into the brain related to ICP,22 yet we expanded on this observation extensively in performing the frequency-dependent analysis that resulted in the transfer function demonstrated here.
One of the novel aspects to this study is that we induced changes in ICP rather than ABP. The upper image in Figure 5 shows average SNR of presumably auto-regulated measurements, while the lower image shows a highly elevated ICP baseline, at which auto-regulation can be assumed to be impaired. Autoregulation is typically quantified under the assumption that ABP changes are the cause of ICP changes. Very sparse information can be found about changes in ICP without ABP changes that influence the autoregulatory capability of the brain or cerebral blood flow directly. Our initial analysis showed hemoglobin concentration changes in the absence of significant reaction in ABP for oscillations in ICP with periods of up to 2 min. Our blood pressure measurements were obtained from the carotid artery, a systemic location external to the brain, due to the inability to access cerebral, local ABP. Autoregulation derived from carotid blood pressure alone might therefore lead to false conclusions about autoregulation impairment since hemoglobin concentrations significantly oscillate with ICP. This limitation underscores the need for the extrapolation to CPP, which will be possible by measuring ΔICPNIRS using NIRS and the algorithm described here in conjunction with ABP measurements.
While oscillations in ICP do not lead to ABP oscillations, we observed that long-term baseline changes in ICP do lead to transient increases in ABP baseline. This is seen as a systemic regulatory effect wherein the body alters ABP to ensure sufficient perfusion to the brain. Theoretically, the increase in ABP should stabilize CPP, which in turn ensures a steady cerebral blood flow. Whether this effect is due to the much higher amplitude of the ICP baseline compared to oscillation amplitudes, or to the extended period of ICP elevation, or to the long-term anesthesia remains unknown. We hypothesize that a long duration of ICP elevation triggers an ABP increase, while short duration oscillations induced in ICP do not trigger an ABP response, as observed in the time traces and SNR plots above (Figures 3, 5 and 7(a)).
The following assumptions need to be valid for using the transfer function to estimate ICP: (a) A reaction in cerebral hemodynamics to ICP changes must occur, (b) other influences on the signal, such as blood pressure elevation or hemorrhage, are excluded, and (c) a linear relationship between the pressure changes and the hemodynamic changes exists. The three conditions are addressed as follows:
We have shown that ΔHbO and ΔHb react to induced ICP changes. The magnitudes were dependent on the ICP baseline, making low-pressure cases less reliable for ICPNIRS estimation. Nonetheless, we found a reaction to pressure changes even at the very low baseline level.
During the experiment, no leakage of cerebrospinal fluid (CSF) or blood was observed. Furthermore, the blood pressure increase as a reaction to ICP changes was observed only during long-term baseline changes and not during short periods of induced sinusoidal changes. However, the effects of anesthesia through isoflurane are uncertain. Future work with an anesthetic known to have fewer potential effects on CA and hemodynamics will help to clarify this concern.
Given the small magnitude of changes in ICPip and ΔHbO, we assume local linearity. The linearity of CA and the hemodynamic response are discussed in the literature, and examples can be found for non-linear methods to quantify autoregulation impairment,23,24 with an overview of non-linear models given by Payne et al.25 However, linear models are more common and the high correlation between ΔHbO and ICPip shown in Figure 4 encourages this assumption.
According to Lassen’s curve,26 the lower limit of autoregulation can be reached and exceeded if ICP increases, resulting in a decrease of CPP. This implies that the highest ICP baselines we induced may fall outside the autoregulated range. The reason for autoregulatory impairment can be twofold. On one hand, high ICP can exceed the vasodilation limit of arterioles. On the other hand, fast inflow of saline through the catheter could exceed the fluid uptake rate of the brain. In either case, autoregulation would influence the capabilities of using simple, linear methods like transfer functions to estimate ICP from hemoglobin concentrations. Despite the autoregulatory behavior, we see large oscillations in ΔHbO. Application of the transfer function shows suitable, yet noisier oscillations compared to the invasive measurements. Additional methods to determine the CA impairment of individual subjects might further improve ICPNIRS estimation. Active autoregulation could be the cause for the trend toward underestimation of magnitudes seen in Figure 7(c). Furthermore, the transfer function approach can be extended to include ABP and cerebral blood flow measurements. As maintaining blood flow is the goal of CA, it has great potential to improve the prediction quality. Blood flow measurements could be added by diffuse correlation spectroscopy (DCS) or transcranial Doppler ultrasound. DCS is also a non-invasive method which measures microvascular blood flow and is based on near-infrared light.27
We demonstrated the feasibility of estimating time traces of ICP changes based on ΔHbO. However, we were only able to report relative changes. In order to quantify the ICP baseline, additional information is needed. With estimation of the ICP offset, the transfer function approach could be used to generate trends over time. Further quantitative ICP estimation of baseline values may be possible based on more sophisticated machine learning tools.
Conclusion
Non-invasive methods to estimate ICP are needed to improve treatment of TBI, hydrocephalus, stroke, and other diseases. Here, we introduced a method that allows for non-invasive, real time measurements of ICP. We have demonstrated that induced fluid pressure oscillations in CSF influence cerebral hemodynamics, which we have measured with NIRS. Fitting a transfer function to the measured changes yielded a mathematical tool to track ICP changes by changes in HbO over long periods of time. We have presented that a reliable fit is possible for both magnitude and phase alignment compared with an invasive reference measurement. While our transfer function approach makes substantial progress toward accurate non-invasive measurements of ICP through NIRS, further refinements of the experimental setup and the data analysis will be necessary to improve its applicability across physiological and experimental conditions. Important next steps include the estimation of ICP baseline through non-invasive measurements and the translation to human from non-human primates. Once this approach is more refined, the use of NIRS has high potential for clinical translation as a long-term bed-side instrument to observe trends in ICP as well as a short-term instrument to observe ICP reactions and recovery. Due to its non-invasive nature, NIRS-based ICPNIRS monitoring may be equally useful for low-risk patients that do not qualify for invasive measurements as well as in research settings on healthy subjects.
Supplemental Material
Supplemental material, JCB891359 Supplemental Material1 for Fluctuations in intracranial pressure can be estimated non-invasively using near-infrared spectroscopy in non-human primates by Alexander Ruesch, Samantha Schmitt, Jason Yang, Matthew A Smith and Jana M Kainerstorfer in Journal of Cerebral Blood Flow & Metabolism
Supplemental material, JCB891359 Supplemental Material2 for Fluctuations in intracranial pressure can be estimated non-invasively using near-infrared spectroscopy in non-human primates by Alexander Ruesch, Samantha Schmitt, Jason Yang, Matthew A Smith and Jana M Kainerstorfer in Journal of Cerebral Blood Flow & Metabolism
Supplemental material, JCB891359 Supplemental Material3 for Fluctuations in intracranial pressure can be estimated non-invasively using near-infrared spectroscopy in non-human primates by Alexander Ruesch, Samantha Schmitt, Jason Yang, Matthew A Smith and Jana M Kainerstorfer in Journal of Cerebral Blood Flow & Metabolism
Acknowledgements
The authors like to acknowledge R Stetler for editing.
Funding
The author(s) disclosed receipt of the following financial support for the research, authorship, and/or publication of this article: The authors acknowledge the financial support for the research, authorship and publication through the Center for Machine Learning and Health (CMLH) Fellowship, the American Heart Association (AHA) 17SDG33700047, and the National Institutes of Health (NIH) R21-EB024675.
Declaration of conflicting interests
The author(s) declared no potential conflicts of interest with respect to the research, authorship, and/or publication of this article.
Authors’ contributions
AR, SS, MS, and JK designed the study. AR, SS, JY, MS, and JK designed the experimental setup and conducted the experiments with animals. AR, MS and JK performed data analysis and interpretation. AR wrote the manuscript. All authors reviewed the manuscript.
Supplemental material
Supplemental material for this article is available online.
References
- 1.Dunn LT.Raised intracranial pressure. J Neurol Neurosurg Psychiatry 2002; 73: i23–i27. [DOI] [PMC free article] [PubMed] [Google Scholar]
- 2.Rangel-Castillo L, Gopinath S, Robertson CS.Management of intracranial hypertension. Neurol Clin 2008; 26: 521–541. [DOI] [PMC free article] [PubMed] [Google Scholar]
- 3.Doyle DJ, Mark PWS.Analysis of intracranial pressure. J Clin Monit 1992; 8: 81–90. [DOI] [PubMed] [Google Scholar]
- 4.Czosnyka M and Pickard JD. Monitoring and interpretation of intracranial pressure. J Neurol Neurosurg Psychiatry 2004; 75: 813–821. [DOI] [PMC free article] [PubMed] [Google Scholar]
- 5.Gu F, Jones PA, Lo TYM, et al. Visualizing the pressure and time burden of intracranial hypertension in adult and paediatric traumatic brain injury. Intensive Care Med 2015; 41: 1067–1076. [DOI] [PubMed] [Google Scholar]
- 6.Balestreri M, Czosnyka M, Steiner LA, et al. Association between outcome, cerebral pressure reactivity and slow ICP waves following head injury. Acta Neurochir Suppl 2005; 95: 25–28. [DOI] [PubMed] [Google Scholar]
- 7.Kawoos U, McCarron RM, Auker CR, et al. Advances in intracranial pressure monitoring and its significance in managing traumatic brain injury. Int J Mol Sci 2015; 16: 28979–28997. [DOI] [PMC free article] [PubMed] [Google Scholar]
- 8.Jantzen JPAH.Prevention and treatment of intracranial hypertension. Best Pract Res Clin Anaesthesiol 2007; 21: 517–538. [DOI] [PubMed] [Google Scholar]
- 9.Swoboda M, Hochman MG, Fritz FJ, et al. Non-invasive intracranial pressure sensor. Google Patents, 2013.
- 10.Reid A, Marchbanks RJ, Burge DM, et al. The relationship between intracranial pressure and tympanic membrane displacement. Br J Audiol 1990; 24: 123–129. [DOI] [PubMed] [Google Scholar]
- 11.Bellner J, Romner B, Reinstrup P, et al. Transcranial Doppler sonography pulsatility index (PI) reflects intracranial pressure (ICP). Surg Neurol 2004; 62: 45–51. [DOI] [PubMed] [Google Scholar]
- 12.Behrens A, Lenfeldt N, Ambarki K, et al. Transcranial Doppler pulsatility index: not an accurate method to assess intracranial pressure. Neurosurgery 2010; 66: 1050–1057. [DOI] [PubMed] [Google Scholar]
- 13.Kampfl A, Pfausler B, Denchev D, et al. Near infrared spectroscopy (NIRS) in patients with severe brain injury and elevated intracranial pressure. A pilot study. Acta Neurochir Suppl 1997; 70: 112–114. [DOI] [PubMed] [Google Scholar]
- 14.Budohoski KP, Zweifel C, Kasprowicz M, et al. What comes first? The dynamics of cerebral oxygenation and blood flow in response to changes in arterial pressure and intracranial pressure after head injury. Br J Anaesth 2012; 108: 89–99. [DOI] [PMC free article] [PubMed] [Google Scholar]
- 15.Fraser CD, Brady KM, Rhee CJ, et al. The frequency response of cerebral autoregulation. J Appl Physiol 2013; 115: 52–6. [DOI] [PubMed] [Google Scholar]
- 16.Kainerstorfer JM, Sassaroli A, Tgavalekos KT, et al. Cerebral autoregulation in the microvasculature measured with near-infrared spectroscopy. J Cereb Blood Flow Metab 2015; 35: 959–966. [DOI] [PMC free article] [PubMed] [Google Scholar]
- 17.Sassaroli A, Fantini S.Comment on the modified Beer–Lambert law for scattering media. Phys Med Biol 2004; 49: N255–N257. [DOI] [PubMed] [Google Scholar]
- 18.Parks TW, McClellan JH.Chebyshev approximation for nonrecursive digital filters with linear phase. IEEE Trans Circuit Theory 1972; 19: 189–194. [Google Scholar]
- 19.Kohavi R. A study of cross-validation and bootstrap for accuracy estimation and model selection. In: International joint conference on artificial intelligence (IJCAI), Montreal, Quebec, Canada, 20-25 August 1995, pp. 1137–1143. Burlington, MA: Morgan Kaufmann.
- 20.Drmac Z, Gugercin S, Beattie C.Quadrature-based vector fitting: implications for H2 system approximation. J Sci Comput 2014; 37: A625–A652. [Google Scholar]
- 21.Fantini S.Dynamic model for the tissue concentration and oxygen saturation of hemoglobin in relation to blood volume, flow velocity, and oxygen consumption: implications for functional neuroimaging and coherent hemodynamics spectroscopy (CHS). Neuroimage 2014; 85: 202–221. [DOI] [PMC free article] [PubMed] [Google Scholar]
- 22.Weerakkody RA, Czosnyka M, Zweifel C, et al. Near infrared spectroscopy as possible non-invasive monitor of slow vasogenic ICP waves. Acta Neurochir Suppl 2012; 114: 181–185. [DOI] [PubMed] [Google Scholar]
- 23.Panerai RB, Dawson SL, Potter JF, et al. Linear and nonlinear analysis of human dynamic cerebral autoregulation. Am J Physiol 1999; 277: H1089–H1099. [DOI] [PubMed] [Google Scholar]
- 24.Mitsis GD, Poulin MJ, Robbins PA, et al. Nonlinear modeling of the dynamic effects of arterial pressure and CO2 variations on cerebral blood flow in healthy humans. IEEE Trans Biomed Eng 2004; 51: 1932–1943. [DOI] [PubMed] [Google Scholar]
- 25.Payne S.Cerebral autoregulation: control of blood flow in the brain. Berlin: Springer International Publishing, 2016. [Google Scholar]
- 26.Lassen NA.Cerebral blood flow and oxygen consumption in man. Physiol Rev 1959; 39: 183–238. [DOI] [PubMed] [Google Scholar]
- 27.Boas DA, Yodh AG.Spatially varying dynamical properties of turbid media probed with diffusing temporal light correlation. J Opt Soc Am 1997; 14: 192–215. [Google Scholar]
Associated Data
This section collects any data citations, data availability statements, or supplementary materials included in this article.
Supplementary Materials
Supplemental material, JCB891359 Supplemental Material1 for Fluctuations in intracranial pressure can be estimated non-invasively using near-infrared spectroscopy in non-human primates by Alexander Ruesch, Samantha Schmitt, Jason Yang, Matthew A Smith and Jana M Kainerstorfer in Journal of Cerebral Blood Flow & Metabolism
Supplemental material, JCB891359 Supplemental Material2 for Fluctuations in intracranial pressure can be estimated non-invasively using near-infrared spectroscopy in non-human primates by Alexander Ruesch, Samantha Schmitt, Jason Yang, Matthew A Smith and Jana M Kainerstorfer in Journal of Cerebral Blood Flow & Metabolism
Supplemental material, JCB891359 Supplemental Material3 for Fluctuations in intracranial pressure can be estimated non-invasively using near-infrared spectroscopy in non-human primates by Alexander Ruesch, Samantha Schmitt, Jason Yang, Matthew A Smith and Jana M Kainerstorfer in Journal of Cerebral Blood Flow & Metabolism


