

Abstract
Objective:
To extensively use blood transcriptome analysis to identify potential diagnostic and therapeutic targets for cardiovascular diseases.
Methods:
Two gene expression datasets (GSE59867 and GSE62646) were downloaded from GEO DataSets to identify altered blood transcriptomes in patients with ST-segment elevation myocardial infarction (STEMI) compared to stable coronary artery disease (CAD). Thereafter, several computational approaches were taken to determine functional roles and regulatory networks of differentially expressed genes (DEGs). Finally, the expression of dysregulated two hub genes–suppressor of cytokine signaling 3 (SOCS3) and haptoglobin (HP)–were validated in a case–control study.
Results:
A total of 119 DEGs were identified in the discovery phase, consisting of 71 downregulated genes and 48 upregulated genes; two hub modules consisting of two hub genes–SOCS3 and HP–were identified. In the validation phase, both SOCS3 and HP were significantly downregulated in the stable CAD and acute coronary syndrome (ACS) patients when compared with healthy controls. Meanwhile, HP was significantly upregulated in STEMI patients when compared with stable CAD patients (p=0.041). Logistic regression analysis indicated that: downregulated expression of HP correlated with increased risk of CAD [odds ratio (OR)=0.52, 95% confidence interval (CI)=0.31~0.87, p=0.013]; and downregulated expression of SOCS3 correlated with increased risk of ACS (OR=0.66, 95% CI=0.46~0.94, p=0.023) when age, gender, history of hyperlipidemia, diabetes and hypertension were included as covariates.
Conclusion:
Future clarification of how SOCS3 and HP influence the pathogenesis of disease may pave the way for the development of novel diagnostic and therapeutic methods.
Keywords: SOCS3, HP, coronary artery disease, acute coronary syndrome, differentially expressed genes, microarray analysis
Introduction
Coronary artery disease (CAD), including stable CAD and acute coronary syndrome (ACS), is associated with substantial morbidity and mortality worldwide. According to the American Heart Association (AHA) and American College of Cardiology (ACC), CAD accounts for one in 7 deaths in the US, and about 7.9 million US adults have had a myocardial infarction (MI) (1, 2). Owing to the complexity of interactions between genetic factors and epigenetic regulatory mechanisms, cardiovascular risk factors, such as hypertension, diabetes, and hyperlipidemia, have been established but are not sufficient to fully explain and predict the risk of disease. Serum biomarkers such as brain natriuretic peptide (BNP), high-sensitivity C-reactive protein (hs-CRP), and inflammatory factors play a substantial role in this regard but nevertheless have limited value in terms of predictive capacity for the diagnosis of early CAD and its prognosis.
With the rapid development of new technologies, such as next generation sequencing, much progress has been made in the exploration of diagnostic and therapeutic biomarkers for cardiovascular diseases. Bioinformatics analysis of these big data provides novel clues and core data for identifying reliable and functional differentially expressed genes (DEGs), miRNAs and non-coding transcripts; nevertheless, reanalyzing these data using an online database remains necessary because doing so may lead to novel insights. Moreover, the integration of studies from various medical sources saves resources and provides evidence for mapping molecular pathogenetic networks.
We analyzed two publicly available microarray datasets retrieved from Gene Expression Omnibus (GEO), a database repository that archives, annotates, and freely shares high-throughput functional genomics data submitted by the international research community. Using computational approaches, we screened out common DEGs associated with ACS and stable CAD, conducted pathway analysis, constructed protein–protein interaction (PPI) networks as well as miRNA-mediated transcriptional regulation networks. Dysregulated critical hub genes, the genes with higher scores detected by MCODE software (Cytoscape), were validated in a Chinese case–control study. Using the bioinformatic analyses and clinical validation data, we hoped to provide novel insights into the pathogenesis of CAD and to identify novel altered transcripts that could be potential biomarkers for distinguishing different disease states.
Methods
Expression Profile Datasets Selection: In order to identify transcriptomes potentially involved in the development and progression of acute MI/ACS, several related datasets were taken into account. First, the GEO DataSets portal, which is publicly available (NCBI, https://www.ncbi.nlm.nih.gov/geo/), was searched for registered datasets of mRNA profiling by array. In particular, for the selection of suitable datasets, an advanced search was carried out by inserting the terms “[(“expression profiling by array” [DataSet Type] and acute myocardial infarction) and “Homo sapiens” [porgn: _txid9606]”]; “[(“mRNA profiling by array” [DataSet Type] and acute coronary syndrome) and “Homo sapiens” [porgn: _txid9606]”]. With this approach, we obtained a list of all acute MI/ACS datasets containing mRNA expression levels. Of these datasets, only those that fit the below criteria were selected for subsequent evaluation. Inclusion criteria: (1) datasets containing peripheral blood mononuclear cell mRNA expression levels of ST-segment elevation myocardial infarction (STEMI); (2) datasets reporting the mRNA expression levels of patients with acute MI and patients with stable CAD. Exclusion criteria: datasets containing information about the expression of circulating endothelial cells, platelets or nucleated cell–related cell lines.
The search criteria applied in GEO DataSets allowed us to preliminarily identify eight different datasets [GSE66360 (3), GSE9820 (4), GSE48060 (5), GSE34198, GSE9128 (6), GSE23746, GSE62646(7), GSE59867(8)] of acute MI/ACS expression profiling by array (published up to December 2018). However, most of them did not apply with respect to the exclusion and inclusion criteria. After the application of the aforementioned criteria, only two datasets were selected as discovery datasets for performing the differential analyses [(GSE62646: stable CAD (14 samples) vs. STEMI (28 samples) and GSE59867: stable CAD (46 samples) vs. STEMI (111 samples)].
Data processing and DEG identification: The raw microarray data of the two datasets downloaded from the GEO database (9) were processed with the LIMMA package of the R language (http://www.R-project.org, The R Foundation) to identify genes that were differentially expressed in peripheral blood between stable CAD patients and STEMI patients. The adjusted p values (adj. p) and Benjamini–Hochberg false discovery rate were applied to strike a balance between the discovery of statistically significant genes and the limitations of false positives. Probe sets without corresponding gene symbols or genes with more than one probe set were removed or averaged, respectively. |logFC| (fold change) >0.5 and adj. P<0.05 were set as the cut-off criteria for DEGs. The lists of dysregulated genes from the two selected GEO DataSets platforms were subsequently compared in order to identify the DEGs overlapping between the two datasets and with fold-change (|logFC|) >0.5. Venn diagrams were created using Venn diagram software (http://bioinformatics.psb.ugent.be/webtools/Venn/) to display the overlap of DEGs between the two discovery datasets.
Functional and pathway enrichment analysis: Upregulated and downregulated genes underwent Gene Ontology (GO) and Kyoto Encyclopedia of Genes and Genomes (KEGG) pathway analysis using the Database for Annotation, Visualization and Integrated Discovery (DAVID, version 6.8; david.ncifcrf.gov/home.jsp) software (10). GO and KEGG pathway enrichment analysis were performed to identify DEGs using the DAVID database. P<0.05 was considered statistically significant.
PPI network construction and module analysis: The Search Tool for the Retrieval of Interacting Genes (STRING, version 10.0; http://string-db.org) database was used to predict the PPI network (11). STRING was used to analyze the PPIs of DEGs, and an interaction with a combined score of >0.4 was considered statistically significant. Then, according to the interaction information, the network was constructed and visualized with Cytoscape software (12) (version 3.7.0, http://www.cytoscape.org/). The Cytoscape Network Analyzer plugin was used for further analysis, and the topological properties of the PPI network, node degree, were calculated to search for hub genes from the PPI network. Cytoscape’s Molecular Complex Detection (MCODE) was used to screen the significant modules of the PPI network with the cutoff paramaters set as follows: MCODE scores >5 (13, 14), degree cut-off=2, node score cut-off=0.2, Max depth=100 and k-score=2 (15-17). Cytoscape’s Biological Networks Gene Oncology (BiNGO) (version 3.0.3) tool was used to perform and visualize the biological process analysis of hub genes.
MiRNA regulatory network of hub genes: The interactive regulation network of hub genes and miRNAs, predicted and obtained from TargetScan (http://www.targetscan.org/) and miRDB (http://mirdb.org/miRDB/) was visually presented using Cytoscape software.
Patient sample preparation and peripheral blood collection: Three hundreds and two individuals were recruited to conduct a case–control study to seek further confirmation of a potential relationship between the expression of hub genes and the development of CAD. From September 2017 to July 2019, blood samples for subsequent RNA extraction from 100 patients with stable CAD, 102 patients with ACS and 100 healthy controls were enrolled in the Taihe Hospital of Shiyan of Hubei Province (Hubei, China). Informed consent was obtained from all individuals. The inclusion and exclusion criteria were the same as those described in our previous reports. At baseline, the collection and treatment approaches of peripheral blood samples from emergency CAD patients were identical to those in our previous research (18). In addition, a panel of 16 serum biomarkers was selected and analyzed at the core lab of Taihe Hospital. This case–control study was performed in accordance with the ethical guidelines of the Declaration of Helsinki and was approved by the Medical Ethics Committee of Taihe Hospital of the Hubei University of Medicine.
Cell culture and treatment: Human monocytic THP-1 cells were cultured in RPMI-1640 medium (Gibco, USA) containing 10% fetal bovine serum (FBS; Gibco) at 37 °C, 5% CO2 incubator and incubated with 50 ng/mL of Phorbol-12-myristate-13-acetate (PMA; Beyotime Biotechnology, Shanghai, China) for 48 h to differentiate into macrophages. Subsequently, THP-1 macrophages were exposed to ox-LDL in 2 ml of RPMI-1640 culture growth medium containing 1% FBS for 48 h to induce foam cells.
RNA extraction and quantitative polymerase chain reaction (qPCR): Total RNA was extracted from leukocytes and cultured cells using TRIZOL Regent (Invitrogen, Carlsbad, CA), and cDNA synthesis was performed with a HiScript® II Q RT SuperMix for qPCR Kit (Nanjing Vazyme Biotech Co., Ltd, Nanjing, China). Five nanograms of cDNA were used for real-time reactions using ChamQTM SYBR® qPCR Master Mix (Nanjing Vazyme Biotech Co., Ltd, Nanjing, China) and a ViiATM 7 Real-time PCR System (Applied Biosystems, Foster City, CA). Relative gene expression levels were calculated using the comparative crossing threshold method of relative quantification (ΔCq) and fold change (FC) values. ΔCq was designated as the mean Cq (mean of duplicates) of a target gene subtracted by the mean Cq (mean of duplicates) of a reference gene [glyceraldehyde 3-phosphate dehydrogenase (GAPDH)]. Based on recommendations from the manufacturer, the Cq expression cutoff was set to 30; this was applied to all calculations. In order to compare mean expression levels between the CAD group and the control group, FC was designated as 2-ΔCq. Detailed primer information and qPCR data processing are shown in Table S1.
Table S1.
Primer sequences used for qPCR
| Gene name | Primer sequence 5’-3’ | Method |
|---|---|---|
| SOCS3 | F: AGCAGCGATGGAATTACCTGGAAC | qPCR |
| R: TCCAGCCCAATACCTGACACAGAA | ||
| HP | F: TGAATGTGAAGCAGTATGTGGGA | qPCR |
| R: CATTGATCAGCGTGGCACC | ||
| GAPDH | F: GAAGGTGAAGGTCGGAGTC | qPCR |
| R: GAAGATGGTGATGGGATTTC |
Statistical analysis
For descriptions and comparisons of baseline demographic, clinical and laboratory characteristics, the normal distribution of quantitative data were expressed as mean ± standard deviation (SD); and comparison between the two groups was determined via student’s t-test. Abnormal distributions of quantitative data were expressed with median and inter quartile ranges, and Mann-Whitney U-tests were applied for comparison. The qualitative data were expressed by frequency and composition. The differences in constituent ratio between the two groups were compared by Chi-square test or Fisher’s exact test. The Pearson’s or Spearman’s rank correlation test was used to analyze correlation analysis. All p values were two sided and considered statis¬tically significant if p<0.05. Both univariate (unadjusted) and multivariate (adjusted) logistic regression were performed to determine independent clinical factors and biomarkers associated with CAD. All statistical analyses and plotting were performed using SPSS version 23.0 (SPSS Inc., Chicago, IL, USA), Prism 8 (GraphPad Prism 8.0.1, San Diego, California, USA) and R (http://www.R-project.org, The R Foundation).
Results
DEG screening and enrichment analysis: The differential analysis performed with the R language on the two datasets from the GEO database allowed for the identification of lists of dysregulated genes in STEMI patients compared to patients with stable CAD (Fig. 1). As shown in the Venn diagram of DEGs (Fig. 1a), a total of 119 common DEGs were obtained, of which 71 were downregulated and 48 were upregulated. Next, a principal component analysis (PCA) model for the DEGs was established for all participants (STEMI patients compared to stable CAD patients) in the two discovery datasets. Figure 1b shows the score plots of their first two principal components, which demonstrates a separation between them on the score plots. The DEG details are listed in Table 1. The volcanic maps showed more intuitively the distribution of up- and downregulated DEGs in the STEMI group compared to the stable CAD group (Fig. 1c). Furthermore, the heatmap of DEGs in these two microarrays shows a hierarchical clustering of changed transcription in different groups (Fig. 1d), which may help identify the function of unknown transcripts or the unknown function of known transcripts by gathering the same expression pattern or similar genes of a class. All of these analyses revealed the characteristics and functions of common and special DEG transcripts between the STEMI patients and stable CAD patients.
Figure 1.

Transcriptome of peripheral blood analysis in GSE59867 and GSE62646 microarray. (a) Venn diagram of 119 DEGs from two microarray datasets. (b) PCA score plots of STEMI group and stable CAD group in these two datasets. (c) The volcano plots of DEGs in two datasets. Red indicates genes with high levels of expression, blue indicates genes with low levels of expression, and gray indicates genes with no differential expression based on the criteria of P<0.05 and |logFC| >0.05, respectively. (d) Heatmap of DEGs in two microarrays showed hierarchical clustering of changed transcription of genes in clustering analysis in different groups
CAD - coronary artery disease; DEGs - differentially expressed genes; PCA - principal component analysis; STEMI - ST-segment elevation myocardial infarction
Table 1.
| DEGs | Gene symbol* |
|---|---|
| Upregulated (48) | LILRB4, FCGR1CP, FCGR1B, FCGR1A, STAB1, VSIG4, EDA2R, MIR223, CYP27A1, TNFAIP6, FMN1, RNASE1, STEAP4, ASGR2, TRIB1, NFE2, PRR13, FAM20C, AQP9, ECRP, RNASE2, LOC441081, FAM20A, SOCS3, SASH1, SLED1, TCN2, GPR162, CCR1, SIGLEC16, PPARG, ADM, SIGLEC9, LILRA5, LILRA3, TBC1D2, SH3PXD2B, LILRA6, FLVCR2, PLB1, CYP1B1, HP, CR1,TMEM176A, PADI2, EGR1, DYSF, ST14, TMEM150B, TSPO |
| Downregulated (71) | MYBL1, SNHG16, SNORD61, EPB41L4A, SNORD82, FGFBP2, DTHD1, SNORD45C, TGFBR3, SYNE2, PDGFD, BIRC3, FAM169A, KLRF1, KLRC1, CLEC2D, RORA, SH2D1A, SAMD3, TARP, CEP78, KLRC4-KLRK1, CD226, SNORA16A, SCARNA9, CLC, SNORD45B, SCARNA9L, SNORD54, SNORD58A, SNORD28, SNORD50A, HLA-DOB, HRH4, SNHG1, MYO6, SNORD59B, KLRG1, ODF2L, SNORD81, JAKMIP2, SNHG1, GNG2, LOC102725104, GBP5, C12orf75, NPM1, ARAP2, SNORA8, CPA3, KLRC4-KLRK1, KLRC3, VPS13A, KLRA1P, SYTL2, KLRC4-KLRK1, SLC4A4, PRSS23, SNORA20, SLCO4C1, KPNA5, SNORD6///TAF1D, MS4A3, KLRC2, SNORD73A, KLRD1, SNORD30, IL18RAP, C1orf21, WEE1, LINC00680-GUSBP4 |
8 hub genes (PPI network) are in bold italics. DEGs - differentially expressed genes; STEMI - ST-segment elevation myocardial infarction
According to the GO analysis of results from the DAVID database, the changes in biological processes of DEGs were significantly enriched in the cell surface receptor signaling pathway, regulation of immune response, innate immune response, signal transduction, inflammatory response, et al. (Table S2). KEGG pathway analysis revealed that the pathways enriched by dysregulated DEGs included osteoclast differentiation, antigen processing and presentation and inflammatory bowel disease.
Table S2.
Significant enriched GO terms and Kyoto Encyclopedia of Genes and Genomes pathways of common differentially expressed genes
| Term | Description | Count | P-value |
|---|---|---|---|
| Biological process | |||
| GO:0007166 | Cell surface receptor signaling pathway | 10 | 5.46E-06 |
| GO:0050776 | Regulation of immune response | 8 | 2.04E-05 |
| GO:0045087 | Innate immune response | 9 | 9.23E-04 |
| GO:0007165 | Signal transduction | 14 | 2.83E-03 |
| GO:0006968 | Cellular defense response | 4 | 3.10E-03 |
| GO:0045954 | Positive regulation of natural killer cell mediated cytotoxicity | 3 | 3.18E-03 |
| GO:0002250 | Adaptive immune response | 5 | 5.22E-03 |
| GO:0006954 | Inflammatory response | 7 | 8.86E-03 |
| GO:0002228 | Natural killer cell mediated immunity | 2 | 9.39E-03 |
| GO:0031100 | Organ regeneration | 3 | 2.06E-02 |
| GO:0007155 | Cell adhesion | 7 | 2.10E-02 |
| GO:0060850 | Regulation of transcription involved in cell fate commitment | 2 | 2.33E-02 |
| GO:0070301 | Cellular response to hydrogen peroxide | 3 | 2.95E-02 |
| GO:0007267 | Cell–cell signaling | 5 | 3.18E-02 |
| GO:0060670 | Branching involved in labyrinthine layer morphogenesis | 2 | 4.16E-02 |
| GO:0006955 | Immune response | 6 | 4.82E-02 |
| KEGG pathway | |||
| hsa04380 | Osteoclast differentiation | 6 | 5.44E-04 |
| hsa04612 | Antigen processing and presentation | 5 | 6.20E-04 |
| hsa05321 | IBD | 3 | 4.38E-02 |
IBD - inflammatory bowel disease; qPCR - quantitative polymerase chain reaction
PPI network analysis: To systematically analyze the biological functions of the DEGs obtained from the two groups, the PPI network of DEGs was constructed using Cytoscape with protein interaction information. With a PPI score >0.4, a PPI network with 112 nodes and 459 edges was constructed, as presented in Figure 2a. Two modules were obtained from a PPI network of DEGs using MCODE, one with 13 nodes and 38 edges (Fig. 2b, Cluster 1), and one with 6 nodes and 9 edges (Figure 2b, Cluster 2). The biological process analysis of the hub genes is shown in Figure 2c, which is mainly related to the cellular response to extracellular stimulus, cell adhesion, biological regulation, cellular metabolic process, and regulation of gluconeogenesis.
Figure 2.

PPI network of DEGs identified in STEMI. (a) DEGs identified in at least two datasets were used to construct the PPI network. SOCS3 and HP are shown in red, other hub genes as yellow and the rest of the nodes as blue. The lines between nodes represent the interactions between genes. The thickness of the line represents the combined score. (b) two modules contained SOCS3 (cluster 1) and HP (cluster 2). (c) the biological process analysis of hub genes was constructed using BiNGO. The color depth of nodes refers to the corrected P-value of ontologies. The size of nodes refers to the numbers of genes involved in the ontologies. P<0.05 was considered statistically significant
DEGs - differentially expressed genes; HP - haptoglobin; PPI - protein–protein interaction; SOCS3 - suppressor of cytokine signaling 3
Two hub gene probe expression in the datasets and gene-miRNA regulatory network: As presented in Figure S1, the probe expression levels of SOCS3 and HP were significantly upregulated in patients with STEMI when compared to stable CAD patients in GSE59867 (all p<0.001; Figure S1a, b), while in GSE62646, probe expression levels distinctly increased in patients with STEMI when compared to stable CAD patients (all p<0.05; Figure S1c and d).
Figure S1.

SOCS3 and HP expression levels of probe value in GSE59867 and GSE62646
HP - haptoglobin; SOCS3 - suppressor of cytokine signaling 3; STEMI - ST-segment elevation myocardial infarction
For the two hub genes, we identified a visualized gene-miRNA regulatory network constructed with Cytoscape, including two genes and 83 miRNAs. As shown in Figure S2, suppressor of cytokine signaling 3 (SOCS3) was potentially regulated by 78 miRNAs while haptoglobin (HP) was potentially regulated by five miRNAs. Within the network, hsa-miR-6836-5p and hsa-miR-6132 were demonstrated to interact with both of the two hub genes.
Figure S2.

The hub gene-miRNAs regulatory network. Red nodes stand for the hub genes, blue nodes represent miRNAs
Clinical parameters of participants in validation study: A total of 302 subjects were recruited for our study, including 100 healthy controls, 100 patients with stable CAD and 102 patients with ACS. The principal characteristics of all subjects are summarized in Table 2. With regard to age, gender, apolipoprotein B (apo B), and lactate dehydrogenase (LDH), no significant statistical difference was observed between the control and two patient groups. Approximately 55%, 29% and 12% of stable CAD patients, and 51%, 23%, and 12% of ACS patients, had experienced hypertension, diabetes and hyperlipidemia, respectively. In the analysis of lipid parameters, the levels of triglyceride (TG) and lipoprotein a [Lp(a)] were significantly increased in the patient groups, while the levels of total cholesterol (TC), high density lipoprotein cholesterol (HDL-C), low density lipoprotein cholesterol (LDL-C), and apolipoprotein A1 (apo A1) were significantly decreased in the patient groups compared to the control group (all p<0.05). Compared to the control group, stable CAD patients had more inconsistent patterns of variation of certain biomarkers relative to the ACS patients; for example, myocardial enzymes (aspartate aminotransferase (AST), creatine kinase (CK) and hydroxybutyrate dehydrogenase (HBDH)) were significantly decreased in stable CAD patients, while their levels were elevated in ACS patients, when compared to controls.
Table 2.
General characteristics of the study participants
| Characteristic | Patients | P | ||||
|---|---|---|---|---|---|---|
| Controls (n=100) | Stable CAD (n=100) | ACS (n=102) | P1 | P2 | ||
| Demographics | ||||||
| Age (years) | 57.39±7.69 | 58.32±8.39 | 59.74±9.67 | 0.415 | 0.057 | 0.415 |
| Male | 43 | 51 | 68 | 0.321 | 0.001 | 0.321 |
| Risk factors | ||||||
| Hypertension (%) | 12 | 55 | 51 | <0.001 | <0.001 | <0.001 |
| Diabetes mellitus (%) | 0 | 29 | 23 | <0.001 | <0.001 | <0.001 |
| Hyperlipidemia (%) | 0 | 12 | 12 | <0.001 | <0.001 | <0.001 |
| Clinical parameters | ||||||
| TC (mmol/L) | 5.04±0.84 | 3.73±0.99 | 3.92±1.01 | <0.001 | <0.001 | <0.001 |
| TG (mmol/L) | 1.04 (0.76, 1.33) | 1.45 (0.83, 2.02) | 1.16 (0.84, 1.98) | <0.001 | 0.002 | <0.001 |
| HDL-C (mmol/L) | 1.60±0.35 | 1.05±0.27 | 1.04±0.26 | <0.001 | <0.001 | <0.001 |
| LDL-C (mmol/L) | 2.42±0.54 | 2.01±0.70 | 2.18±0.75 | <0.001 | 0.016 | <0.001 |
| Apo-A1 (g/L) | 1.65±0.21 | 1.49±0.24 | 1.41±0.28 | <0.001 | <0.001 | <0.001 |
| Apo-B (g/L) | 0.89±0.17 | 0.84±0.19 | 0.86±0.20 | 0.112 | 0.291 | 0.112 |
| LP(a) (mg/L) | 90.45±88.38 | 176.21±204.23 | 166.20±170.11 | 0.011 | 0.008 | 0.011 |
| AST (IU/L) | 25.00 (22.00, 29.00) | 22.00 (17.00, 30.00) | 28.00 (18.25, 59.50) | 0.017 | 0.001 | 0.017 |
| CK(IU/L) | 113.77±64.89 | 76.68±38.63 | 294.60±493.64 | <0.001 | <0.001 | <0.001 |
| CKMB (IU/L) | 7.16±4.86 | 13.51±9.98 | 31.59±53.90 | <0.001 | <0.001 | <0.001 |
| LDH (IU/L) | 205.11±142.39 | 183.10±52.55 | 250.59±120.35 | 0.297 | 0.336 | 0.297 |
| HBDH (IU/L) | 127.05±22.99 | 119.05±27.98 | 182.22±108.70 | 0.046 | <0.001 | 0.046 |
| hs-CRP (mg/L) | 4.06 (2.41, 6.11) | 3.36 (1.30, 8.25) | 6.52 (2.84, 17.17) | 0.138 | <0.001 | 0.138 |
| HCY (µmol/L) | 12.10 (9.90, 14.80) | 13.00 (8.65, 15.97) | 15.40 (11.05, 20.20) | 0.974 | 0.023 | 0.974 |
| CysC (mg/L) | 0.60±0.09 | 0.65 (0.56,0.73) | 0.63±0.20 | <0.001 | 0.052 | <0.001 |
| GSP (mmol/L) | 2.60±0.274 | 2.77±0.54 | 1.73±1.07 | 0.014 | <0.001 | 0.014 |
| SOCS3 (fold change) | 1.00±1.04 | 0.84±0.83 | 0.75±0.68 | 0.040 | 0.005 | 0.040 |
| HP (fold change) | 1.00±0.70 | 0.54±0.73 | 0.73±0.72 | 0.001 | 0.048 | 0.001 |
P value<0.05 was considered statistically significant. P 1 value: CAD vs. controls comparison. P2 value: ACS vs. controls comparison. ACS - acute coronary syndrome; CAD - coronary artery disease; apo-A1 - apolipoprotein A1; apo-B - apolipoprotein B; AST - aspartate aminotransferase; CK - creatine kinase; CKMB - creatine phosphokinase isoenzymes; CysC - cystatin C; GSP - glycated serum protein; HBDH - hydroxybutyrate dehydrogenase; HCY - homocysteine; HDL-C - high density lipoprotein cholesterol; HP - haptoglobin; hs-CRP - high sensitivity C reactive protein; LDH - lactate dehydrogenase; LDL-C - low density lipoprotein cholesterol; LP(a) - lipoprotein a; SOCS3 - suppressor of cytokine signaling 3; TC - total cholesterol; TG – triglyceride
The ACS patients we recruited for this study consisted of STEMI and non-STEMI (NSTEMI) patients. To further investigate whether the state of disease was associated with the variation of two hub genes, we conducted a sub-group analysis in patients with a different disease state. As shown in Table S3, compared to stable CAD patients, STEMI patients had a more severe inflammatory reaction, i.e., higher levels of high sensitivity C reactive protein (hs-CRP; p=0.002) and higher levels of myocardial enzymes, i.e., AST (p<0.001), creatine kinase (CK; p<0.001), creatine phosphokinase with isoenzymes (CK-MB; p=0.029), lactate dehydrogenase (LDH; p=0.001) and HBDH (p<0.001). Meanwhile, patients with NSTEMI were shown to have higher levels of AST (p=0.002), CK-MB (p=0.043) and hs-CRP (p=0.047) when compared to stable CAD patients.
Table S3.
General characteristics of the study participants
| Characteristic | ACS patients | P | |||
|---|---|---|---|---|---|
| Stable CAD (n=100) | STEMI (n=100) | NSTEMI (n=87) | P1 | P2 | |
| Demographics | |||||
| Age (years) | 58.32±8.39 | 59.52±10.17 | 64.86±7.56 | 0.375 | 0.005 |
| Male | 51 | 58 | 10 | 0.037 | 0.283 |
| Risk factors | |||||
| Hypertension (%) | 55 | 42 | 9 | 0.382 | 0.786 |
| Diabetes mellitus (%) | 29 | 20 | 3 | 0.406 | 0.553 |
| Hyperlipidemia (%) | 12 | 8 | 4 | 0.638 | 0.221 |
| Clinical parameters | |||||
| TC (mmol/L) | 3.73±0.97 | 3.90±1.01 | 3.90±1.01 | 0.279 | 0.299 |
| TG (mmol/L) | 1.45 (0.83, 2.02) | 1.15 (0.84, 1.98) | 1.33 (0.98, 2.04) | 0.125 | 0.560 |
| HDL-C (mmol/L) | 1.05±0.27 | 1.04±0.27 | 1.06±0.27 | 0.742 | 0.939 |
| LDL-C (mmol/L) | 2.01±0.70 | 2.14±0.73 | 2.45±0.89 | 0.242 | 0.054 |
| Apo-A1 (g/L) | 1.49±0.24 | 1.43±0.29 | 1.41±0.28 | 0.249 | 0.017 |
| Apo-B (g/L) | 0.84±0.19 | 0.85±0.20 | 0.89±0.20 | 0.724 | 0.519 |
| LP(a) (mg/L) | 176.21±204.23 | 167.53±176.30 | 152.03±86.07 | 0.798 | 0.776 |
| AST (IU/L) | 22.00 (17.00, 30.00) | 27.00 (18.00, 58.00) | 40.50 (25.25, 59.75) | <0.001 | 0.002 |
| CK(IU/L) | 76.68±38.63 | 303.48±524.34 | 239.33±235.06 | <0.001 | 0.072 |
| CKMB (IU/L) | 13.51±9.98 | 31.87±57.67 | 29.88±20.43 | 0.029 | 0.043 |
| LDH (IU/L) | 183.10±52.55 | 241.55±107.31 | 305.89±179.85 | 0.001 | 0.076 |
| HBDH (IU/L) | 119.05±27.98 | 174.47±94.50 | 229.56±165.11 | <0.001 | 0.077 |
| hs-CRP (mg/L) | 3.36 (1.30, 8.25) | 5.67 (2.78, 16.57) | 12.66 (3.05, 20.84) | 0.002 | 0.047 |
| HCY (µmol/L) | 13.00 (8.65, 15.97) | 13.00 (9.80, 18.60) | 20.65 (17.35, 23.80) | 0.537 | 0.025 |
| CysC (mg/L) | 0.65 (0.56, 0.73) | 0.62 (0.54, 0.70) | 0.75±0.19 | 0.107 | 0.655 |
| GSP (mmol/L) | 2.77±0.54 | 1.89±1.10 | 1.06±0.61 | <0.001 | <0.001 |
| SOCS3 (fold change) | 1.00±0.99 | 0.91±0.84 | 0.77±0.56 | 0.489 | 0.386 |
| HP (fold change) | 1.00±1.34 | 1.42±1.37 | 0.97±0.93 | 0.041 | 0.945 |
P value<0.05 was considered statistically significant. P1 value: STEMI patients vs. stable CAD patients. P2 value: NSTEMI patients vs. stable CAD patients.
ACS - acute coronary syndrome; CAD - coronary artery disease; apo-A1 - apolipoprotein A1; apo-B - apolipoprotein B; AST - aspartate aminotransferase; CK - creatine kinase;
CKMB - creatine phosphokinase isoenzymes; CysC - cystatin C; GSP - glycated serum protein; HBDH - hydroxybutyrate dehydrogenase; HCY - homocysteine; HDL-C - high density lipoprotein cholesterol; HP - haptoglobin; hs-CRP - high sensitivity C reactive protein; LDH - lactate dehydrogenase; LDL-C - low density lipoprotein cholesterol; LP(a) - lipoprotein a; SOCS3 - suppressor of cytokine signaling 3; TC - total cholesterol; TG - triglyceride
SOCS3 and HP expression in the validation study: As shown in Table 2, the expression levels of both SOCS3 and HP were significantly downregulated in two groups of patients: SOCS3 was significantly downregulated in patients with stable CAD (p=0.040) as well as in patients with ACS (p=0.005) when compared to healthy controls (Fig. 3a). Meanwhile, HP expression was also shown to be significantly decreased in patients with stable CAD (p=0.001) as well as in patients with ACS (p=0.048) when compared to healthy controls (Fig. 3b). Consistent with the variation pattern shown in the datasets, the expression of HP was significantly upregulated in STEMI patients (p=0.041) compared to stable CAD patients (Fig. 3d). In contrast, SOCS3 mRNA levels were not significantly different between STEMI and stable CAD patients (Fig. 3c). SOCS3 mRNA levels were not significantly different between STEMI and stable CAD patients (Fig. 3c). Consistent with the variation pattern shown in the datasets, the expression of HP was significantly upregulated in STEMI patients (p=0.041) compared to stable CAD patients (Fig. 3d).
Figure 3.

Relative expression of SOCS3 and HP in healthy controls, patients from stable CAD, ACS, STEMI and NSTEMI
ACS - acute coronary syndrome; CAD - coronary artery disease; HP - haptoglobin; NSTEMI - non-ST-elevation myocardial infarction; SOCS3 - suppressor of cytokine signaling 3; STEMI - ST-segment elevation myocardial infarction
Correlation between SOCS3 and HP expression and risk factors for cardiovascular disease: To evaluate whether deterministic risk factors for CAD were correlated with SOCS3 and HP expression, we performed correlation analysis for all participants. As described in Table 3, according to the Pearson or Spearman correlation method, SOCS3 shows a positive association with TC (r=0.121, p=0.040) and a negative association with LP(a) (r=–0.151, p=0.045) and homocysteine (HCY; r=–0.137, p=0.035). In contrast, HP shows a positive association with hs-CRP (r=0.308, p<0.001) and a negative association with LP(a) (r=–0.199, p=0.008).
Table 3.
Correlation analysis of gene expression with detective parameters of all participants
| Clinical parameters | SOCS3 (n=302) | HP (n=302) | ||
|---|---|---|---|---|
| r | P1 | r | P2 | |
| TC | 0.121 | 0.040 | 0.096 | 0.106 |
| TG | 0.015 | 0.807 | 0.034 | 0.571 |
| HDL-C | 0.044 | 0.470 | 0.035 | 0.565 |
| LDL-C | 0.095 | 0.116 | 0.055 | 0.359 |
| Apo-A1 | -0.008 | 0.897 | -0.074 | 0.259 |
| Apo-B | 0.076 | 0.240 | 0.043 | 0.509 |
| LP(a) | -0.151 | 0.045 | -0.199 | 0.008 |
| AST | -0.033 | 0.566 | -0.067 | 0.248 |
| CK | -0.072 | 0.297 | -0.041 | 0.551 |
| CKMB | -0.110 | 0.108 | -0.044 | 0.519 |
| LDH | -0.084 | 0.220 | -0.042 | 0.539 |
| HBDH | -0.092 | 0.181 | -0.006 | 0.931 |
| hs-CRP | 0.062 | 0.291 | 0.308 | <0.001 |
| HCY | -0.137 | 0.035 | -0.076 | 0.244 |
| CysC | 0.012 | 0.851 | -0.016 | 0.797 |
| GSP | 0.110 | 0.107 | 0.060 | 0.380 |
P value<0.05 was considered statistically significant.
apo-A1 - apolipoprotein A1; apo-B - apolipoprotein B; AST - aspartate aminotransferase; CK - creatine kinase; CKMB - creatine phosphokinase isoenzymes; CysC - cystatin C; GSP - glycated serum protein; HBDH - hydroxybutyrate dehydrogenase;
HCY - homocysteine; HDL-C - high density lipoprotein cholesterol; HP - haptoglobin; hs-CRP - high sensitivity C reactive protein; LDH - lactate dehydrogenase; LDL-C - low density lipoprotein cholesterol; LP(a) - lipoprotein a; SOCS3 - suppressor of cytokine signaling 3; TC - total cholesterol; TG – triglyceride
Associations between SOCS3 and HP and risk factors for CAD: The association between lower levels of SOCS3 and HP and an increased risk for CAD was further evaluated by logistic stepwise regression. As summarized in Table 4, in the stable CAD patients, odds ratios (ORs) for HP were significant after adjustment for age, gender, hyperlipidemia, diabetes and hypertension [OR 0.52, 95% confidence interval (CI) 0.31~0.87, p=0.013]. In contrast, in the ACS patients, ORs for HP were significant after adjustment for age and gender (OR 0.48, 95% CI 0.30~0.79, p=0.003); however, these associations were abolished when hyperlipidemia, diabetes and hypertension were included as the covariates (OR 0.67, 95% CI 0.44~1.02, p=0.059). On the other hand, in the ACS patients, ORs for SOCS3 were significant after adjustment for age, gender, hyperlipidemia, diabetes and hypertension (OR 0.66, 95% CI 0.46~0.94, p=0.023).
Table 4.
Conditional logistic regression analysis of independent correlates between circulating leukocyte mRNA variability and stable CAD and ACS
| Stable CAD | ACS | ||||
|---|---|---|---|---|---|
| SOCS3 | HP | SOCS3 | HP | ||
| Model 1 | OR | 0.728 | 0.522 | 0.588 | 0.484 |
| 95% CI | 0.544~0.973 | 0.351~0.776 | 0.413~0.839 | 0.298~0.785 | |
| P-value | 0.032 | 0.001 | 0.003 | 0.003 | |
| Model 2 | OR | 0.772 | 0.521 | 0.658 | 0.667 |
| 95% CI | 0.537~1.108 | 0.311~0.873 | 0.459~0.943 | 0.437~1.016 | |
| P-value | 0.160 | 0.013 | 0.023 | 0.059 | |
Model 1 was adjusted for age and gender; Model 2 was adjusted for age, gender, hyperlipidemia, diabetes and hypertension.
ACS - acute coronary syndrome; CAD - coronary artery disease
Expression of SOCS3 and HP in THP-1-derived foam cells: To further determine the role of SOCS3 and HP in the process of foam cell formation, we examined the mRNA expression of SOCS3 and HP in foam cells derived from THP-1 cells. As shown in Figure 4, expression levels of SOCS3 mRNA were significantly upregulated in THP-1 macrophages and ox-LDL-induced THP-1 foam cells when compared to the control group (THP-1 monocytes; all p<0.001). Interestingly, there was a significant decrease of SOCS3 mRNA expression levels in ox-LDL-induced THP-1 foam cells compared to THP-1 macrophages (p<0.001). However, compared with the control group, HP mRNA expression levels showed no significant change in THP-1 macrophages and ox-LDL-induced THP-1 foam cells.
Figure 4.
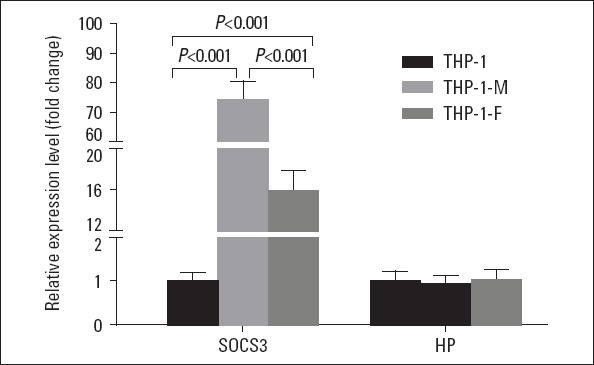
SOCS3 and HP mRNA expression in THP-1 monocytes, THP-1 macrophages, ox-LDL-induced THP-1 foam cells
HP - haptoglobin; SOCS3 - suppressor of cytokine signaling 3;
THP-1- THP-1 monocytes; THP-1-M - THP-1 macrophages; THP -1-F - THP-1 foam cell
Discussion
Despite significant advances in pharmacotherapy, revascularization strategies and heart transplantation, CAD remains a major cause of morbidity and mortality worldwide. Evaluation of risk factor profiles, including hypertension, metabolic syndrome and diabetes mellitus, plays an important role in disease prevention and risk stratification (19). Molecular biomarkers, such as myocardial enzymes, serum inflammatory markers, and blood lipid–metabolic parameters, have gained increased attention in this regard but have only provided modest increases in predictive capacity, stimulating the search for more sensitive disease markers to reveal initial dysregulation and the underlying mechanisms of disease (5). Gene expression profiling by microarray is a comprehensive tool to elucidate underlying mechanisms of disease and to identify disease-related genes as well as dysregulated pathways that may not have been previously linked to cardiovascular diseases (20). Nevertheless, the huge amount of data, either deriving from individual basic science experiments, or collected by large international consortia, often generates conflicting results. This discrepancy could be attributed to varying sample sizes, differing ethnic cohorts, inconsistency in disease states of recruited patients, or incorrect analysis by investigators. Under such circumstances, the integration of various transcriptome profiling datasets–so-called “data mining”–may be a promising way to eliminate bias and locate reliable biomarkers for disease.
To assess the feasibility and sensitivity of divergent gene expression profiling of peripheral blood, we initially conducted a whole-genome microarray analysis of the blood of two carefully selected discovery studies of patients with STEMI and patients with stable CAD. Our analysis revealed divergent gene expression of 119 DEGs consisting of 71 downregulated genes and 48 upregulated genes that were functionally enriched for cell surface receptor signaling, immune response, signal transduction, cellular defense response and pathway in STEMI patients compared to stable CAD patients. These findings are consistent with myocardial tissue–based studies of animal models of ischemia and reperfusion injury that also exhibited divergent gene expression profiles enriched in immune response and inflammation pathways, raising the possibility that transcriptional changes in relative pathways contributed to pathological myocardial changes.
We identified two DEGs as critical hub genes in the PPI network through the hub module analysis. In the datasets, both of two hub genes were significantly upregulated in STEMI patients compared with stable CAD patients. The expression levels of these DEGs were further validated in a case–control study; consistent with the variation pattern in the datasets, HP was significantly upregulated in STEMI patients when compared with stable CAD patients. However, SOCS3 showed no significant change in the two groups of patients.HP, an acute phase hemoglobin (Hb) binding serum protein primarily synthesized in the liver, functions mainly in infection and inflammation, where it acts as a natural antagonist for receptor-ligand activation of the immune system (21). Changes in the measured concentrations of HP in serum may help to assess disease status. Hb was reported to release at localized sites of inflammation, injury and in atherosclerotic plaque (22). The elevated expression of HP in STEMI patients, which was identified in the datasets and validated in our research, may reflect the activation of the inflammatory mechanism during the pathogenesis of CAD. The correlation analysis in this study also reinforced that the serum levels of the inflammatory biomarker hs-CRP were positively correlated with HP mRNA expression levels. In recent decades, substantial research efforts have been put into addressing the role of HP in the pathogenesis of CAD; Posta et al. (23) reported that in complicated atherosclerotic lesions, Hb oxidation triggers dysfunction and induces a proinflammatory response in the endothelium, while HP inhibited Hb fragmentation provoked by peroxide (23). HP prevents Hb-induced hypertension and renal damage from its intravascular sequestration function, which is a critically important stimulus capable of promoting the influx of macrophages into atherosclerotic lesions (24); the HDL-raising agent in ApoE-deficient mice decreases HP expression, which contributes to the attenuation of aortic lipid deposition (25); the previous study illustrated that endocytosis of HP/Hb complexes could be involved in the progression of atherosclerosis through the mediator CD163 (26, 27), and, furthermore, Srivastava (28) also uncovered that HP could play a potential role in macrophage cholesterol efflux and the progression of atherosclerosis. Hb-HP was increased in the HDL of atherogenic/hyperlipidemic mice and in the HDL of individuals with CAD (29) and the amount of Hb bound to HDL correlates with the proinflammatory properties of dysfunctional HDL (29). Recently, a study reported that HP regulates vascular health through several means (30). Strikingly, we found that, compared to healthy participants, HP expression levels were significantly downregulated in stable CAD and ACS patients, which is inconsistent with the previous study; in animal models of myocardial ischemia, the HP protein has been implicated in coronary collateral development (31); Jahagirdar et al. (25) found that HP protein levels were significantly upregulated in humans with cardiovascular disease, and HDL isolated from mice lacking this protein was involved in anti-inflammatory activity compared to Wild-type mice. We speculate that this discrepancy may be partly related to the different races or ethnic groups involved, the inconsistency between translation and transcription efficiency led by complications in the regulatory network, and, more importantly, the medications administered to the participants. The majority of the CAD patients involved in the current study were exposed to related primary disorders prior to recruitment; most of them received a wide range of medications on a daily basis. Medication may profoundly influence the internal regulatory network. It is also possible this is why the average serum cholesterol and glucose levels of patients were controlled at a relatively low level compared to the healthy controls.
SOCS3 is involved in negative regulation of cytokines that signal through the JAK/STAT pathway and is induced by various inflammatory mediators and proinflammatory cytokines. Recently, increasing evidence has demonstrated the extensive regulatory functions of SOCS3, including in immune disorders, diabetes, metabolic disorders, such as obesity, cancer and vascular inflammatory diseases (32-35). In this study, we found that SOCS3 was significantly downregulated in CAD patients, which might reflect the chronic inflammation status of the disease. Lack of SOCS3 in liver tissue was previously reported to simulate chronic inflammation via the nuclear factor kappa-light-chain-enhancer of activated B cells pathway, which may also result in systemic insulin resistance (36). In addition, SOCS3 was reported as an anti-inflammatory cytokine (37) that affects cardiac function via various inflammatory cytokines; SOCS3 deficiency in the heart promotes cardiac hypertrophy by enhancing the JAK/STAT activity induced by IL-6 (38); SOCS3 deficiency in T cells increases IL-17 production and reduces atherosclerotic lesion development and vascular inflammation, whereas overexpression of SOCS3 in T cells reduces IL-17 and accelerates atherosclerosis (39). Moreover, Barrett et al. (40) demonstrated that platelets promoted the development of atherosclerosis by increasing an inflammatory phenotype of plaque macrophages and SOCS3 expression. In vitro, we found a significant upregulation of SOCS3 during the progression of THP-1 foam cell formation, which is in stark contrast to the decreasing trend seen in the leukocytes of CAD patients. The discrepancy in our research in SOCS3 mRNA expression between the circulating leukocytes and in vitro THP-1 monocytes may be due to the heterogeneous composition of different blood cells within whole blood samples. In the peripheral blood cells, monocytes account for less than 10% of the total cell count, while circulating clotting factor (platelets), inflammatory cells (granulocytes), immune cells (lymphocytes), and other plasma components, such as exosome-transported non-coding RNA, collectively build up a complicated microenvironment that influences the expression of SOCS3. These inconsistent findings indicate that different leukocyte subtypes may weigh differently on the regulatory network in homeostasis and further in vitro studies based on sorting cells are necessary. Furthermore, we found a decreasing expression of SOCS3 in the THP-1 foam cells compared to THP-1 macrophages, which implied a dynamic regulatory role for SOCS3 in the progression of foam cell formation; and, this could partly explain the inconsistent expression patterns of certain genes between our validation data and the gene expression profiling by microarray from public resources.
Conclusion
The present study was designed to identify DEGs that may be involved in the pathogenesis of CAD. The expression of two critical hub genes was validated in a Chinese case–control study, and dysregulated SOCS3 and HP were identified and may be regarded as diagnostic biomarkers for CAD. However, further studies are needed to elucidate the biological function of these genes in CAD, including stable CAD and ACS.
Footnotes
Funding source: This research was supported by the National Natural Science Foundation of China (Grand No: 81600358; 81771522), Natural Science Foundation of Hubei Province (No: 2019CFB434) and Natural Science Foundation of Guangdong Province, China (No. 2019A1515010239).
Conflict of interest: None declared.
Peer-review: Externally peer-reviewed.
Authorship contributions: Concept – J.Z., C.P.; Design – J.Z., C.P.; Supervision – J.Z., C.P.; Fundings – H.L., J.Z., C.P.; Materials – X.Z., X.Lv, X.Li, Y.W., H.L.; Data collection and/or processing – X.Z., X.Lv, X.Li, Y.W., H.L.; Analysis and/or interpretation – X.Z., J.Z., C.P.; Literature search – J.Z., C.P.; Writing – X.Z., C.P.; Critical review – X.Z., X.Lv, X.Li, Y.W.
References
- 1.Jabbar AY, Baydoun H, Janbain M, Ferdinand KC. Current concepts in the management of stable ischemic heart disease and acute coronary syndrome in patients with hemophilia. Ann Transl Med. 2018;6:299. doi: 10.21037/atm.2018.05.29. [DOI] [PMC free article] [PubMed] [Google Scholar]
- 2.Benjamin EJ, Virani SS, Callaway CW, Chamberlain AM, Chang AR, Cheng S, et al. American Heart Association Council on Epidemiology and Prevention Statistics Committee and Stroke Statistics Subcommittee. Heart Disease and Stroke Statistics-2018 Update:A Report From the American Heart Association. Circulation. 2018;137:e67–e492. doi: 10.1161/CIR.0000000000000558. [DOI] [PubMed] [Google Scholar]
- 3.Muse ED, Kramer ER, Wang H, Barrett P, Parviz F, Novotny MA, et al. A Whole Blood Molecular Signature for Acute Myocardial Infarction. Sci Rep. 2017;7:12268. doi: 10.1038/s41598-017-12166-0. [DOI] [PMC free article] [PubMed] [Google Scholar]
- 4.Schirmer SH, Fledderus JO, van der Laan AM, van der Pouw-Kraan TC, Moerland PD, Volger OL, et al. Suppression of inflammatory signaling in monocytes from patients with coronary artery disease. J Mol Cell Cardiol. 2009;46:177–85. doi: 10.1016/j.yjmcc.2008.10.029. [DOI] [PubMed] [Google Scholar]
- 5.Suresh R, Li X, Chiriac A, Goel K, Terzic A, Perez-Terzic C, et al. Transcriptome from circulating cells suggests dysregulated pathways associated with long-term recurrent events following first-time myocardial infarction. J Mol Cell Cardiol. 2014;74:13–21. doi: 10.1016/j.yjmcc.2014.04.017. [DOI] [PMC free article] [PubMed] [Google Scholar]
- 6.Cappuzzello C, Napolitano M, Arcelli D, Melillo G, Melchionna R, Di Vito L, et al. Gene expression profiles in peripheral blood mononuclear cells of chronic heart failure patients. Physiol Genomics. 2009;38:233–40. doi: 10.1152/physiolgenomics.90364.2008. [DOI] [PubMed] [Google Scholar]
- 7.Kiliszek M, Burzynska B, Michalak M, Gora M, Winkler A, Maciejak A, et al. Altered gene expression pattern in peripheral blood mononuclear cells in patients with acute myocardial infarction. PLoS One. 2012;7:e50054. doi: 10.1371/journal.pone.0050054. [DOI] [PMC free article] [PubMed] [Google Scholar]
- 8.Maciejak A, Kiliszek M, Michalak M, Tulacz D, Opolski G, Matlak K, et al. Gene expression profiling reveals potential prognostic biomarkers associated with the progression of heart failure. Genome Med. 2015;7:26. doi: 10.1186/s13073-015-0149-z. [DOI] [PMC free article] [PubMed] [Google Scholar]
- 9.Edgar R, Domrachev M, Lash AE. Gene Expression Omnibus:NCBI gene expression and hybridization array data repository. Nucleic Acids Res. 2002;30:207–10. doi: 10.1093/nar/30.1.207. [DOI] [PMC free article] [PubMed] [Google Scholar]
- 10.Huang da W, Sherman BT, Lempicki RA. Systematic and integrative analysis of large gene lists using DAVID bioinformatics resources. Nat Protoc. 2009;4:44–57. doi: 10.1038/nprot.2008.211. [DOI] [PubMed] [Google Scholar]
- 11.Jensen LJ, Kuhn M, Stark M, Chaffron S, Creevey C, Muller J, et al. STRING 8--a global view on proteins and their functional interactions in 630 organisms. Nucleic Acids Res. 2009;37(Database issue):D412–6. doi: 10.1093/nar/gkn760. [DOI] [PMC free article] [PubMed] [Google Scholar]
- 12.Shannon P, Markiel A, Ozier O, Baliga NS, Wang JT, Ramage D, et al. Cytoscape:a software environment for integrated models of biomolecular interaction networks. Genome Res. 2003;13:2498–504. doi: 10.1101/gr.1239303. [DOI] [PMC free article] [PubMed] [Google Scholar]
- 13.Wu H, Fan L, Liu H, Guan B, Hu B, Liu F, et al. Identification of Key Genes and Prognostic Analysis between Chromophobe Renal Cell Carcinoma and Renal Oncocytoma by Bioinformatic Analysis. Biomed Res Int. 2020;2020:4030915. doi: 10.1155/2020/4030915. [DOI] [PMC free article] [PubMed] [Google Scholar]
- 14.Wang J, Liu H, Xie G, Cai W, Xu J. Identification of hub genes and key pathways of dietary advanced glycation end productsinduced nonalcoholic fatty liver disease by bioinformatics analysis and animal experiments. Mol Med Rep. 2020;21:685–94. doi: 10.3892/mmr.2019.10872. [DOI] [PMC free article] [PubMed] [Google Scholar]
- 15.Bader GD, Hogue CW. An automated method for finding molecular complexes in large protein interaction networks. BMC Bioinformatics. 2003;4:2. doi: 10.1186/1471-2105-4-2. [DOI] [PMC free article] [PubMed] [Google Scholar]
- 16.Tu H, Wu M, Huang W, Wang L. Screening of potential biomarkers and their predictive value in early stage non-small cell lung cancer:a bioinformatics analysis. Transl Lung Cancer Res. 2019;8:797–807. doi: 10.21037/tlcr.2019.10.13. [DOI] [PMC free article] [PubMed] [Google Scholar]
- 17.Zhang H, Zhong J, Tu Y, Liu B, Chen Z, Luo Y, et al. Integrated Bioinformatics Analysis Identifies Hub Genes Associated with the Pathogenesis and Prognosis of Esophageal Squamous Cell Carcinoma. Biomed Res Int. 2019;2019:2615921. doi: 10.1155/2019/2615921. [DOI] [PMC free article] [PubMed] [Google Scholar]
- 18.Peng C, Lei P, Li X, Xie H, Yang X, Zhang T, et al. Down-regulated of SREBP-1 in circulating leukocyte is a risk factor for atherosclerosis: a case control study. Lipids Health Dis. 2019;18:177. doi: 10.1186/s12944-019-1125-1. [DOI] [PMC free article] [PubMed] [Google Scholar]
- 19.Eisen A, Giugliano RP, Braunwald E. Updates on Acute Coronary Syndrome:A Review. JAMA Cardiol. 2016;1:718–30. doi: 10.1001/jamacardio.2016.2049. [DOI] [PubMed] [Google Scholar]
- 20.Pedrotty DM, Morley MP, Cappola TP. Transcriptomic biomarkers of cardiovascular disease. Prog Cardiovasc Dis. 2012;55:64–9. doi: 10.1016/j.pcad.2012.06.003. [DOI] [PMC free article] [PubMed] [Google Scholar]
- 21.Dobryszycka W. Biological functions of haptoglobin--new pieces to an old puzzle. Eur J Clin Chem Clin Biochem. 1997;35:647–54. [PubMed] [Google Scholar]
- 22.Schaer DJ, Buehler PW, Alayash AI, Belcher JD, Vercellotti GM. Hemolysis and free hemoglobin revisited:exploring hemoglobin and hemin scavengers as a novel class of therapeutic proteins. Blood. 2013;121:1276–84. doi: 10.1182/blood-2012-11-451229. [DOI] [PMC free article] [PubMed] [Google Scholar]
- 23.Posta N, Csősz É, Oros M, Pethő D, Potor L, Kalló G, et al. Hemoglobin oxidation generates globin-derived peptides in atherosclerotic lesions and intraventricular hemorrhage of the brain, provoking endothelial dysfunction. Lab Invest. 2020;100:986–1002. doi: 10.1038/s41374-020-0403-x. [DOI] [PMC free article] [PubMed] [Google Scholar]
- 24.Kolodgie FD, Gold HK, Burke AP, Fowler DR, Kruth HS, Weber DK, et al. Intraplaque hemorrhage and progression of coronary atheroma. N Engl J Med. 2003;349:2316–25. doi: 10.1056/NEJMoa035655. [DOI] [PubMed] [Google Scholar]
- 25.Jahagirdar R, Zhang H, Azhar S, Tobin J, Attwell S, Yu R, et al. A novel BET bromodomain inhibitor, RVX-208, shows reduction of atherosclerosis in hyperlipidemic ApoE deficient mice. Atherosclerosis. 2014;236:91–100. doi: 10.1016/j.atherosclerosis.2014.06.008. [DOI] [PubMed] [Google Scholar]
- 26.Ross R. Atherosclerosis is an inflammatory disease. Am Heart J. 1999;138(5 Pt 2):S419–20. doi: 10.1016/s0002-8703(99)70266-8. [DOI] [PubMed] [Google Scholar]
- 27.Kristiansen M, Graversen JH, Jacobsen C, Sonne O, Hoffman HJ, Law SK, et al. Identification of the haemoglobin scavenger receptor. Nature. 2001;409:198–201. doi: 10.1038/35051594. [DOI] [PubMed] [Google Scholar]
- 28.Srivastava RAK. Dysfunctional HDL in diabetes mellitus and its role in the pathogenesis of cardiovascular disease. Mol Cell Biochem. 2018;440:167–87. doi: 10.1007/s11010-017-3165-z. [DOI] [PubMed] [Google Scholar]
- 29.Watanabe J, Grijalva V, Hama S, Barbour K, Berger FG, Navab M, et al. Hemoglobin and its scavenger protein haptoglobin associate with apoA-1-containing particles and influence the inflammatory properties and function of high density lipoprotein. J Biol Chem. 2009;284:18292–301. doi: 10.1074/jbc.M109.017202. [DOI] [PMC free article] [PubMed] [Google Scholar]
- 30.Lempiäinen J, Ijäs P, Niiranen TJ, Kaste M, Karhunen PJ, Lindsberg PJ, et al. Haptoglobin Hp1 Variant Does Not Associate with Small Vessel Disease. Brain Sci. 2019;10:18. doi: 10.3390/brainsci10010018. [DOI] [PMC free article] [PubMed] [Google Scholar]
- 31.Lohr NL, Warltier DC, Chilian WM, Weihrauch D. Haptoglobin expression and activity during coronary collateralization. Am J Physiol Heart Circ Physiol. 2005;288:H1389–95. doi: 10.1152/ajpheart.00938.2004. [DOI] [PubMed] [Google Scholar]
- 32.Andoh A, Shioya M, Nishida A, Bamba S, Tsujikawa T, Kim-Mitsuyama S, et al. Expression of IL-24, an activator of the JAK1/STAT3/SOCS3 cascade, is enhanced in inflammatory bowel disease. J Immunol. 2009;183:687–95. doi: 10.4049/jimmunol.0804169. [DOI] [PubMed] [Google Scholar]
- 33.Emanuelli B, Peraldi P, Filloux C, Chavey C, Freidinger K, Hilton DJ, et al. SOCS-3 inhibits insulin signaling and is up-regulated in response to tumor necrosis factor-alpha in the adipose tissue of obese mice. J Biol Chem. 2001;276:47944–9. doi: 10.1074/jbc.M104602200. [DOI] [PubMed] [Google Scholar]
- 34.Inagaki-Ohara K, Mayuzumi H, Kato S, Minokoshi Y, Otsubo T, Kawamura YI, et al. Enhancement of leptin receptor signaling by SOCS3 deficiency induces development of gastric tumors in mice. Oncogene. 2014;33:74–84. doi: 10.1038/onc.2012.540. [DOI] [PubMed] [Google Scholar]
- 35.Yin Y, Liu W, Ji G, Dai Y. The essential role of p38 MAPK in mediating the interplay of oxLDL and IL-10 in regulating endothelial cell apoptosis. Eur J Cell Biol. 2013;92:150–9. doi: 10.1016/j.ejcb.2013.01.001. [DOI] [PubMed] [Google Scholar]
- 36.Torisu T, Sato N, Yoshiga D, Kobayashi T, Yoshioka T, Mori H, et al. The dual function of hepatic SOCS3 in insulin resistance in vivo. Genes Cells. 2007;12:143–54. doi: 10.1111/j.1365-2443.2007.01044.x. [DOI] [PubMed] [Google Scholar]
- 37.Ariel O, Gendron D, Dudemaine PL, Gevry N, Ibeagha-Awemu EM, Bissonnette N. Transcriptome Profiling of Bovine Macrophages Infected by Mycobacterium avium spp. paratuberculosis Depicts Foam Cell and Innate Immune Tolerance Phenotypes. Front Immunol. 2020;10:2874. doi: 10.3389/fimmu.2019.02874. [DOI] [PMC free article] [PubMed] [Google Scholar]
- 38.Terrell AM, Crisostomo PR, Wairiuko GM, Wang M, Morrell ED, Meldrum DR. Jak/STAT/SOCS signaling circuits and associated cytokine-mediated inflammation and hypertrophy in the heart. Shock. 2006;26:226–34. doi: 10.1097/01.shk.0000226341.32786.b9. [DOI] [PubMed] [Google Scholar]
- 39.Taleb S, Romain M, Ramkhelawon B, Uyttenhove C, Pasterkamp G, Herbin O, et al. Loss of SOCS3 expression in T cells reveals a regulatory role for interleukin-17 in atherosclerosis. J Exp Med. 2009;206:2067–77. doi: 10.1084/jem.20090545. [DOI] [PMC free article] [PubMed] [Google Scholar]
- 40.Barrett TJ, Schlegel M, Zhou F, Gorenchtein M, Bolstorff J, Moore KJ, et al. Platelet regulation of myeloid suppressor of cytokine signaling 3 accelerates atherosclerosis. Sci Transl Med. 2019;11:eaax0481. doi: 10.1126/scitranslmed.aax0481. [DOI] [PMC free article] [PubMed] [Google Scholar]