

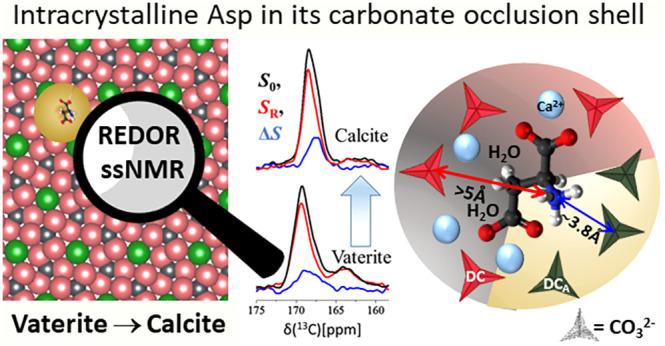
Abstract
In many marine organisms, biomineralization—the crystallization of calcium-based ionic lattices—demonstrates how regulated processes optimize for diverse functions, often via incorporation of agents from the precipitation medium. We study a model system consisting of l-aspartic acid (Asp) which when added to the precipitation solution of calcium carbonate crystallizes the thermodynamically disfavored polymorph vaterite. Though vaterite is at best only kinetically stable, that stability is tunable, as vaterite grown with Asp at high concentration is both thermally and temporally stable, while vaterite grown at 10-fold lower Asp concentration, yet 2-fold less in the crystal, spontaneously transforms to calcite. Solid-state NMR shows that Asp is sparsely occluded within vaterite and calcite. CP-REDOR NMR reveals that each Asp is embedded in a perturbed occlusion shell of ∼8 disordered carbonates which bridge to the bulk. In both the as-deposited vaterites and the evolved calcite, the perturbed shell contains two sets of carbonate species distinguished by their proximity to the amine and identifiable based on 13C chemical shifts. The embedding shell and the occluded Asp act as an integral until which minimally rearranges even as the bulk undergoes extensive reorganization. The resilience of these occlusion units suggests that large Asp-free domains drive the vaterite to calcite transformation—which are retarded by the occlusion units, resulting in concentration-dependent lattice stability. Understanding the structure and properties of the occlusion unit, uniquely amenable to ssNMR, thus appears to be a key to explaining other macroscopic properties, such as hardness.
Introduction
Crystalline calcium carbonate is the most widespread1−4 of minerals synthesized by marine organisms. In most systems, the final products are aragonite and/or calcite, though mechanistically the initial product is typically a highly disordered amorphous calcium carbonate (ACC).5−7 Vaterite, a third polymorph, is unstable with respect to either calcite or aragonite, and though it is a frequent intermediate, it is rarely the final product.8 Control over the crystallization pathway is essential so as to achieve “cost-effective” processing and/or to equip the final product with designated special properties and functionalities. For example, soluble ACC is stabilized in gastroliths by trapped phosphate anions, whereas in sea urchins transient ACC is cast first and then subsequently transformed into calcite spicules.7,9−12
One mechanism of control is the interaction of the growing inorganic phase with biomolecules which serve to regulate both early and late crystal growth events, including prenucleation cluster formation.13−15 As the growth processes may well incorporate these biomolecules within the solid lattice, their influence may be long-lived.16,17 Even where the incorporated organic matter represents a quite small contribution to the total (e.g., as little as 0.1 wt %), the resulting nanocomposites demonstrate improved physical properties in multiple dimensions, including fracture behavior, hardness, lattice strain, texture, solubility, and more.5,18−21
Bio-organics extracted from biogenic calcium carbonates are typically proteinaceous22,23 and often rich in those amino acids with acidic side chains (Asp and Glu).24,25 While local order must inevitably be disrupted so as to incorporate foreign species, the resulting mesocrystalline material diffracts as if it were single crystalline,26−29 even where upon finer examination it is clear that there are small lattice distortions attributable to the incorporated organic additives.30,31 As yet, the description of the interaction interface between mineral and occluded bio-organic molecules is unavailable; experimental access is made more difficult as these interfacial regions are scarce within the bulk; their location is unpredictable, and the interfaces are disordered. As such the notion of intracrystalline occlusion, although broadly and loosely used, remains obscure and devoid of the essential physicochemical description. Characterization is therefore a formidable challenge for traditional X-ray diffraction and absorption techniques.32 The important roles of these interfaces are widely recognized and were also alluded to in a recent study of Asp and Gly occlusion within calcite where improved mechanical properties were attributed to the dissipation of energy within the occluded molecular species.18
Solid-state NMR techniques are well and uniquely equipped to probe the interface between inorganic and organic components, and to focus on the rare occluded molecules buried within the lattice.33−42 The interface—that region where the perturbative effects of the occluded organic appear—plays a special role in determining how the composite differs from unperturbed bulk systems. Our main interface-specific tool is the dipole–dipole coupling by which one nuclear spin species feels the presence of a nearby nuclear spin, over lengths comparable to a unit cell dimension (<1 nm). Thus, although our sensitivity is heavily influenced by the tools with which we probe the interface structure, conveniently for us we will find below not only that those dimensions are “reasonable” and comparable to typical unit cell dimensions, but moreover that at the longest distances we can probe the local electronic environment which would appear to be substantially relaxed back toward the bulk. More importantly, experimental techniques exist so that it is possible to switch these dipole–dipole couplings on and off, and to choose to observe the effects from nuclear reporters chosen from either the carbonate phase or the occluded amino acids. A comparison between the signals thus observed both “without” and “with” the dipole–dipole couplings, and in particular the difference spectrum, represents only those NMR-active species which appear in the vicinity of others, thus allowing the study of inorganic–bio-organic interactions.
13C MAS NMR spectroscopy is an established technique useful in the characterization of both long-range order in the crystalline polymorphs and short-range order in the amorphous forms of calcium carbonates.43−47 In bulk calcium carbonates, 13C direct excitation (DE) MAS spectra quantitatively reveal the distribution of all chemical environments.44,47−49 Combining cross-polarization (CP) with MAS enhances selectively the spectroscopic signature of 13C’s found in hydrogen-rich environments; indeed, most of the available direct evidence characterizing the disordered interfaces in biominerals has accumulated largely from solid-state NMR studies.37,45,46,50−56 The chemical shifts observed in MAS spectroscopy describe the local chemical (electronic) environment—representing local sites, in amorphous and crystalline polymorphs alike. Thus, CP MAS provides a convenient method for following evolution from the precursor into final polymorphic forms, detecting both phase separation and transformation—and has been previously demonstrated to illuminate critical mechanistic details of the relevant biomimetic pathways.44,48,57,58 The CP MAS combines sensitivity to the local electronic structure with spatial selectivity guaranteeing that what is observed arises from only the vicinity of the included organic matter. In what follows we will present both CP MAS studies of our occluded Asp molecules as well as experiments, including REDOR NMR, which exploit other more specific dipolar interactions.59−61
Our model biomimetic system is formed when l-aspartic acid (Asp) is added to a solution which precipitates calcium carbonate. Absent any Asp, the most stable polymorph, calcite, precipitates. At low Asp concentration, the initially precipitated vaterite spontaneously transforms at room temperature to calcite, while at sufficiently high Asp concentration the vaterite produced is both thermally and temporally stable. We take advantage of CP and REDOR MAS NMR as local probes to identify the chemical structure of the perturbed nearest group of carbonates in both low and high Asp vaterite precipitates as well as in the resulting calcite precipitate. We will refer to this group as the interaction shell, or equivalently the occlusion unit. This unit is pliant (i.e., amenable to small-scale rearrangements) yet persistent (resistant to large-scale displacements of nearby species). A statistical model of the concentration-dependent distribution of these occlusion units helps clarify the source of vaterite’s apparent concentration-dependent stability.
Experimental Section
Materials
CaCl2, NaHCO3, [98% 13C] NaH13CO3, l-aspartic acid (Asp), and [98% 15N]Asp were purchased from Sigma-Aldrich and used without further purification.
Synthesis of Vaterite Coprecipitated with Amino Acid
There are two general approaches to the incorporation of amino acids as occlusions in calcium carbonate: one referred to as the “fast precipitation” method, and the second as the “slow” or “diffusive” procedure as described in ref (30). In this work our samples were prepared by the former approach, where solutions of Ca2+ and Asp are mixed with solutions containing carbonate and Asp. Two such samples were prepared, differing only in the [Asp]. In each, the calcium-containing solution was prepared as 100 mL of 50 mM CaCl2·2H2O and 3.5 (0.35) mg/mL of Asp (either 26 or 2.6 mM). The second solution consisted of 100 mL of 50 mM NaHCO3 and 3.5 (0.35) mg/mL of Asp. Both solutions were equilibrated by addition of NaOH and/or HCl to a pH of 7. The solution of CaCl2/Asp was added to the NaHCO3/Asp via a syringe pump at a rate of 1.5 mL/min with continuous stirring over a ∼1 h period. As the solubility of CaCO3 is only 0.15 mM, solid is deposited continuously until the solution in the syringe pump is exhausted. The resulting precipitate was filtered and air-dried at room temperature. 13C- and 15N-enriched samples were synthesized using the same procedure with [10% 13C]NaHCO3 and [98% 15N]Asp.30
The pKa’s of the ionizable protons in Asp are 1.9 (α-carboxyl), 9.6 (ammonium group), and 3.7 (side chain acid).62 At the pH range described above where the solution should be either close to neutral or slightly basic after the addition of carbonate, Asp is primarily found as the singly charged anionic species, with both carboxylic acids deprotonated and negatively charged while the amine is protonated and positively charged.
Amino Acid Analysis
The amounts of the amino acids incorporated into the vaterite and calcite polymorphs during precipitation were measured at Aminolab, Rehovot Israel. For that, samples of our CaCO3 crystal powders containing amino acids were completely dissolved in 0.1 M HCl and subjected to analysis. The amounts were quantified against standard solutions of l-Asp.
Solid-State NMR
13C and/or 15N NMR measurements were carried out on two solid-state NMR spectrometers: 300 and 500 MHz AVANCE III (Bruker) spectrometers using a 4 mm triple-resonance MAS NMR probe with zirconia rotors. Samples were routinely spun at 5000 ± 2 Hz. Cross-polarization (CP) magic angle spinning (MAS) echo experiments (indirect excitation) were carried out with a 5.0 μs π/2, 10.0 μs π pulse widths, and an echo interval τ (200 μs) identical to the rotor period TR. During periods of 1H decoupling, the rf field strength was 100 kHz. For CP via the Hartmann–Hahn matching condition, rf levels of the X-channel (13C, 15N) were set at 50 kHz while the rf level of the 1H channel was ramped between 30 and 70 kHz, with contact times (ct’s) of 1–2 ms. Experiments were repeated using relaxation delays of 3 or 4 s. Up to 30k transients were acquired. For these relatively short CP intervals, the transfer of magnetization is unlikely to be efficient beyond 0.5 nm; where somewhat longer range interactions were of interest, 8 ms (13C–1H) contact time was used.
Direct excitation (DE) 13C and 15N echo experiments were executed with 5.0 μs π/2 pulse widths, 10.0 μs π pulse widths, and an echo interval τ equal to the rotor period TR (200 μs). The 1H decoupling field was 100 kHz. For quantitative DE 13C experiments, we waited 2400 s between repeats of the experiment (closely to fully relaxed); 10 s relaxation delays were found adequate to obtain quantitative DE 15N spectra.
1H–13C 2D-HETCOR63,64 experiments employed the wPMLG565 homonuclear decoupling scheme during t1 (1H chemical shift evolution period), followed by CP with 2 ms contact time used to transfer magnetization from 1H sites to 13C and 15N where chemical shift information could be accumulated in t2. The relaxation delay was 4 s. We accumulated 32–48 separate t1 increments and acquired 3072 data points in the directly sampled t2 dimension. Before applying the 2D FT algorithm, the data set was zero filled in both dimensions to 1024 and 4096 points, respectively.
Spectral sensitivity is enhanced where we isotopically enrich the carbonate source to 10% in 13C. At this labeling level, the 13C signal is 10-fold enhanced as compared to natural abundance—and yet at this enrichment level experiments can be analyzed on the assumption that dipole–dipole couplings between nearby 13C nuclei are weak and cannot significantly complicate the interpretation. Depending on the details of the experiment, the 13C spectrum either reflects contributions from all carbon sites found in the sample (DE NMR), or in the CP experiment from only the region near to the amino acid (CP NMR) as magnetization is sourced from 1H sites, found exclusively in the organic matter (and possibly water molecules). Enrichment of the amine group 99.8%[15N] of Asp enhances the spectral sensitivity sufficiently so that it is possible to directly observe the amine (15N) of the amino acid and provides a tool for studying exclusively the mineral carbonates with the occluded amine group in Asp—as the 13C–15N REDOR experiment yield signals only where 13C sites are in intimate contact with 15N.
13C{15N} and 15N{13C} REDOR experiments60 (13C{15N} indicates that 13C was observed while the dipole coupling to 15N was activated) were conducted using refocusing π pulses applied to each rotor period (TR) on the observe channel, and dephasing π pulses in the middle of each rotor period on the nonobserved nuclei. This sequence was followed by two additional rotor periods with a chemical shift echo π pulse in the middle. REDOR π pulses employed xy8 phase cycling66 for the refocusing and recoupling pulses. Data acquisition employed an alternating block scheme, collecting a single S0 transient with recoupling pulses turned off, followed by collection of an SR transient where the recoupling pulses are turned on. REDOR difference data were obtained by subtracting the SR signal from the S0 signal so as to create the REDOR difference signal ΔS = S0 – SR representing only the chemical shifts of species where the observed nucleus is “close to” (typically <0.5 nm) partner nuclear spin, i.e., only where a 13C spin is sufficiently close to an 15N nuclear spin. While CPMAS provides a picture of some sort of average electronic structure over a nanometer range, as reflected in the chemical shifts of the observed nuclear spins, REDOR spectroscopy provides a window into local structure in that it looks at the distance, or distribution of distances, between spins which are quite close (<0.5 nm). As such the CP is employed to light up carbonates that are in intimate contact with the amino acid, while the CP-REDOR will serve to select distinct subsets within those carbonates.
Results
Polymorph Selection and Stability Control
That influence of the l-aspartic amino acid in the aqueous precipitation solution is unmistakable: calcite precipitates absent any Asp, while in its presence vaterite—the least stable CaCO3 polymorph—precipitates. The two polymorphs are easily distinguished in the 13C DE MAS NMR spectra, with calcite showing a single characteristic peak and vaterite two peaks of unequal intensity (Figure 1a,c)67−69 representing quantitatively all carbon environments found in the precipitates. While multiple studies have shown that acidic amino acids can influence the initial selection of vaterite,70,71 we additionally find here that vaterite deposited from low-concentration Asp solution (2.6 mM; denoted low-[Asp]) is metastable and evolves over the course of 5 days at room temperature so as to yield calcite (Figure 1b,c). Samples grown in 10-fold more concentrated Asp solution (high-[Asp]) are both temporally (years) and thermally (up to 200 °C) stable. Thus, while Asp is essential in the initial seeding of the vaterite polymorph, once occluded in the vaterite lattice (vide infra) it is also implicated in lattice stability.
Figure 1.
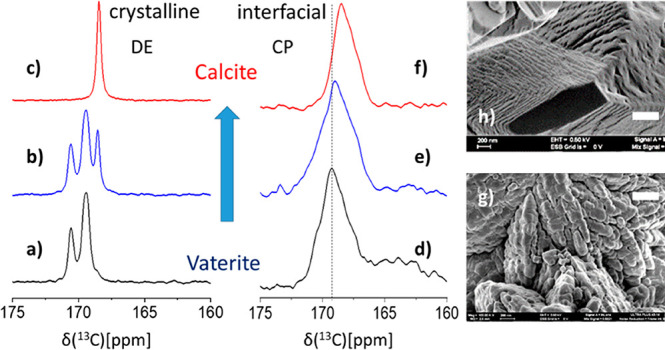
75.4 MHz 13C DE MAS (a–c) and CP MAS (d–f) spectra, carbonate region, of the transient [10%-13C]CaCO3 low-[Asp] coprecipitate as a function of time. Crystalline bulk phases: (a) as-synthesized vaterite, (b) after 1 day, intermediate state of partial conversion shows both vaterite and calcite, (c) after 5 days, final state with only calcite (low-[Asp]). Interfacial carbonates and how they evolve in concert with the bulk phase transformation are shown in parallel (d–f) by the CP MAS spectra. Contributions of the line-shapes of the interfacial carbonates (CP) are not visible in the quantitative DE spectra, therefore indicating that the interfacial carbonates are a small fraction of the total. A vertical line is drawn on the CP spectra to emphasize the spectral changes. The broad ∼164 ppm peak is attributed to coprecipitated NaHCO346,72 whose varying CP dynamics possibly impedes its detection within the calcite host (f). A vertical line is drawn on the CP spectra to emphasize the spectral changes. (g, h) Representative SEM images of the low-[Asp] vaterite and calcite coprecipitates; white scale bars represent 400 nm.
The two initial vaterite precipitates, metastable and stable, appear indistinguishable both spectroscopically by 13C DE MAS (SI, Figure S1) and morphologically (Figure 1g,h; and SI, Figure S2). In both we find ∼150 nm nanospheres which aggregate and partially coalesce in ∼2 μm particles. In contrast, significant morphological changes are observed after conversion of low-[Asp] vaterite to calcite, where the ∼2 μm particles display rectangular faceted edges; the high magnification clearly shows (Figure 1h) that the nanogranular pattern is retained. While nanogranularity is commonly observed for vaterite lattices,73 when found on calcite facets it is often taken as evidence for nonclassical ion-by-ion crystallization pathways—as is the case here.74 Polymorph identity is corroborated by the X-ray powder diffraction data shown in the SI, Figure S3.
Asp Incorporation Level vs Solution Concentration
A key question is that of the actual incorporation levels found in the carbonate lattice grown from 15N-enriched Asp solutions. Quantitative 15N DE MAS NMR spectra (Figure S4a) suggest that the high-[Asp] sample contains double the Asp level as the low-[Asp] precipitate. This observation is further substantiated by the amino acid analyses of our precipitates (Experimental Section) showing Asp levels of ∼1.2 and 0.5 mol %, respectively. Despite having a growth solution 10-fold more concentrated than was the low-[Asp] solution, the corresponding incorporation level is only ∼2-fold higher in the high-[Asp] sample. The decrease in incorporation efficiency at higher amino acid concentration is consistent with what has previously been reported for samples prepared by the diffusive method where it was observed that increasing Asp concentration in the precipitation solution not only led to decreased incorporation efficiency but also reduced absolute levels of incorporation.18 That at higher Asp concentration the incorporation is diminished represents anticooperativity between Asp molecules in close proximity to one another. Thus, the dramatic stabilization demonstrated for the high-[Asp] vaterite may be attributed to the 2-fold increase of Asp concentrations in the solid-state lattices. The implications of this observation will be addressed below.
Exploring the Asp–Carbonate Interaction Interface
We selectively access the interfacial region where carbonates are in proximity to the amino acids via 13C CP MAS NMR75−78 where the detected 13C magnetization is transferred from nearby hydrogen (1H) sites. Magnetization transfer during the cross-polarization period falls off rapidly with increasing 1H···13C distance, and thus, the CP MAS spectra of the coprecipitates (Figure 1d–f) represent exclusively the fraction of carbonates that are sufficiently close (≤1 nm) to hydrogen atoms–which are found only in the amino acids and/or water molecules. These CP-exposed carbonate sites differ significantly from those of the bulk crystalline carbonates (DE MAS spectra Figure 1a–c) both in chemical shift—which represents local chemical environments—and in line-widths, whose increase represents the increase in heterogeneity, and therefore disorder, in the local environment.
In 13C CP MAS NMR, we observe the doubling of the intensity of the 13C peak representing the interfacial carbonates (SI, Figure S5) in the high-[Asp] vs the low-[Asp] precipitates. Doubling the number of interfacial carbonates upon doubling Asp concentration within the vaterite precipitates suggests that the Asp molecules are sparsely distributed at both concentrations and have intimate contact with similar numbers of carbonates per Asp, as were the Asp to aggregate or clump in phase-separated crystals, the increase in surface area, and thus CP-able carbonates intimate with the amino acid surface, would grow less rapidly than the increase in amino acid signal.
Asp–Carbonate Connectivities across the Interaction Interface
1H–13C 2D HETCOR experiments (Figure 2c) show for both low- and high-[Asp] vaterite and low-[Asp] calcite coprecipitates that there are broad cross-peaks of similar intensity between the interfacial carbonates to the hydrogen species of Asp–CH, CH2, and the charged −NH3+– and of water molecules. These cross-peaks suggest that all hydrogen-containing amino acid environments are exposed to the inorganic matrix in the vaterite hosts and remain so in calcite following the spontaneous transformation. These observations are consistent with molecularly dispersed Asp that is occluded within the inorganic matrices, both before and after any bulk rearrangement.
Figure 2.

75.4 MHz 13C CPMAS NMR spectra of (a) unlabeled high-[Asp] vaterite coprecipitate (black trace) and its 5-fold vertical expansion (blue trace) exposing the 13C peaks of the occluded amino acid; (b) neat l-Aps (crystalline form). The chemical shifts of the carboxylic groups of neat l-Asp and of occluded Asp represent protonated and deprotonated (negatively charged) species, respectively, as is noted by the red and blue dashed lines. The asterisk denotes spinning sidebands. (c) 300 MHz 2D 1H–13C PMLG565 HETCOR63,64 spectra of the high- and low-[Asp] vaterite and the evolved low-[Asp] calcite coprecipitates. The cross-peaks show connectivities arising from 1H···13C distances of up to 5 Å between hydrogen species and the host matrix carbonates. The 13C dimension (projections) shows two distinct types of interfacial carbonates of the vaterite and calcite coprecipitates as identified below in the REDOR experiments (Table 1). The 1H-dimension resolves the main groups of hydrogens: the CαH and CβH2, charged amine, water, and bicarbonates. The low-[Asp] vaterite and calcite coprecipitates show also the bicarbonate cross-peak of residual NaHCO3.72
The small water–carbonate cross-peaks in the 2D-HETCOR (Figure 2c) spectra of the high-[Asp] vaterite and the low-[Asp] vaterite and calcite precipitates clearly indicate the co-occlusion of water molecules that survive also the vaterite-to-calcite transformation. Any water contributing to the CP (cross-)peak must reflect molecules of limited mobility, similar to the structural water found in ACCs.43,48,52 These weak water–carbonate cross-peaks further indicate that water molecules contribute only a small fraction, ∼10%, to the total intensity in the carbonates peak (Figure 1d–f); the similar relative peak intensities of water vs Asp hydrogen species (1H projections; Figure 2b) suggest a similar Asp:water ratio throughout the composites.
Complementary information regarding the occluded Asp is obtained by comparing its 13C CP MAS spectral signatures when occluded in the carbonate lattice vs that as neat amino acid (Figure 2). Asp carboxylic groups report ∼4 ppm downfield shift relative to the neat acid, indicating that they are found as deprotonated anions.62 This, combined with the HETCOR spectra (Figure 2c), identifies the occluded amino acid as the Asp1– anion—where both carboxylates are deprotonated, and the amine is protonated. The chemical shifts of Cα and Cβ are similar to those in neat Asp, yet all four peaks are much broader—which is similar to that observed for the amine group via their 15N spectra (SI, Figure S4a), all reporting structural heterogeneity at the amino acid which, of course, is intimately connected to that observed for the surrounding carbonates and is consistent with kinetically controlled incorporation.
What have we observed? The 13C DE and CP excitation schemes differentiate between two types of carbonates. The DE spectra show the bulk portions of our mesocrystals representing regions of either vaterite or calcite largely unperturbed by Asp, and where the vast majority of 13C nuclei are in uniform crystalline environments. The CP spectra show the much smaller fraction of interfacial carbonates that, along with the occluded Asp, are structurally disordered (Figure 1d,f). The CP MAS signal observed from a calcite sample prepared by the precipitation protocol described, except that no amino acids were added (SI, Figure S6), is significantly weaker. This demonstrates that the majority of the CP MAS peak in our carbonate/Asp samples reflects only those carbonates found within the CP-able “sphere of influence” of the amino acids and their associated water molecules.76
The change in the spectral line-shape of the carbonate CP MAS peaks (Figure 1d–f) as the bulk vaterite-to-calcite transformation occurs (Figure 1a–c) indicates that the interaction interface with Asp rearranges. The simultaneous evolution of the 15N amino acid amine DE MAS spectra of the low-[Asp] vaterite coprecipitate and the resulting low-[Asp] calcite (SI, Figure S4b) indicates that the same rearrangement simultaneously impacts both the amino acid and the interfacial carbonates. In the rest of this paper we refine the implications of this observation so as to propose a molecular-functional portrayal of this model system.
Interaction Shell Composition: Two Functionalities of Interfacial Carbonates
A more selective, short-distance technique (<5 Å) is the CP-REDOR technique which identifies and probes’ pairwise interactions—and in opportune cases quantifies distances between rare spins.60 Herein, the REDOR measurements rely on the specific dipole–dipole interaction between a single 13C (of the 10% labeled carbonates) and 15N (of the 100% labeled amines), at distances limited to no more than 5 Å. Using REDOR we access three different pieces of information. First, we distinguish between interfacial carbonates based on whether they are “close by” or “far from” the Asp amine groups (−15NH3+). Second, we determine the average 13C···15N distance between an amine and the “close-by” carbonates. Finally, we estimate the association number—the number of “close-by” carbonates proximate to one amine—and infer the number of remaining “farther-from” amine carbonates in the interaction shell.
The 13C{15N} CP-REDOR NMR experiment (Figure 3) is run as two parallel experiments, yielding one 13C spectrum that represents all CP-able carbon species, S0, and a second where dipolar interactions lower the intensity of 13C carbonates close to 15N-amine, SR. The SR spectrum represents the more distant carbonates (≥5 Å), while the REDOR difference spectrum ΔS = S0 – SR selects for only those 13C sites close to a nitrogen 15N spin (≤5 Å).
Figure 3.

75.4 MHz 13C{15N} CP-REDOR spectra of the transient as-synthesized low-[Asp] vaterite polymorph (a), and 5 days later (top) after phase transformation to calcite is nearly complete (b). The S0 spectra (black traces, left) represent all carbonates that are proximate to hydrogenated species (Asp and water molecules), namely, the interaction shell carbonates. The different chemical shifts of the SR and ΔS carbonate peaks (orange and blue) demonstrate that in each host matrix there are two distinct groups of carbonates. The ΔS peaks represent the “close-by” carbonates (black pseudotriangles in part e), whose distance to the amine (measured from the 13C to 15N) is shorter of 5 Å; the SR peaks represent the remaining interfacial carbonates, the red pseudotriangles, “farther-from” the amine, yet within the CP-able region. Based on the observed selectivity the S0 CP-REDOR spectra were deconvoluted (DMFIT79) to two carbonate groups (c, d) whose chemical shifts and line-widths are listed in Table 1. CP-REDOR employed dipolar evolution of 12.8 ms (64 TR). (e) Schematic structural illustration of the arrangement of interfacial carbonates (pseudotriangles representing the 3 oxygen atoms and the carbon atoms found at their center) surrounding an occluded Asp molecule within the calcite host. Dark pseudotriangles represent DCA’s “close-by” the positively charged amine with an average 3.8 Å distance (13C{15N} REDOR); red represents DCs farther from the amine. There are 3–4 DCA’s directly associated with each amine (15N{13C} REDOR) and likewise 3–4 DCs (deconvolution pf the CP MAS spectra in Figure 1) associated with the other moieties (two positively charged carboxylates, methylene and methine) via interactions mediated by calcium ions and water molecules (2D-HETCOR).
The ΔS peaks of the low-[Asp] vaterite precipitate, and of the very same sample after 5 days as it has evolved to low-[Asp] calcite (Figure 3a,b, blue traces), appear at specific chemical shifts corresponding to distinct subsets of the interfacial carbonates. Thus, there are at least two classes of interfacial carbonates that differ both in their chemical shifts and in their proximity to the amine nitrogen. This selectivity in the REDOR spectra allows us to deconvolve the S0 peaks (Figure 3c,d) providing the chemical shifts and line-widths of the two classes of 13C sites in the interfacial region, either “close-by” or “farther-from” the amine, which we denote DV, DVA, DC, and DCA, as listed in Table 1. DV and DC stand for Disordered Vaterite and Disordered Calcite, and the A subscript stands for “close-by” the amine (vide infra). In summary, CO32–’s which are relatively near to 15N amine sites appear in the ΔS spectrum shifted to lower chemical shifts while carbonates farther from 15N preferentially appear in the SR spectrum at the high ppm region. As all carbonates are within the CP-able sphere we infer that those farther from the amine must be closer to the methylene and methine hydrogens and to water molecules as illustrated schematically in Figure 3e.
Table 1. Deconvolution of the Two Classes of Interfacial Carbonate Populations (Figure 3c,d).
| DV | DVA | vaterite | DC | DCA | calcite | |
|---|---|---|---|---|---|---|
| δisoa (ppm) | 169.4 | 168.8 | 170.6, 169.5 | 168.6 | 167.4 | 168.6 |
| δνb (ppm) | 1.8 | 2.7 | 0.4, 0.6 | 1.2 | 1.5 | 0.2 |
| populationsb | 0.5 | 0.5 | 0.5 | 0.5 |
Isotropic chemical shifts of the DVA and DCA carbonate peaks were determined directly from the ΔS peak positions of the low-[Asp] vaterite and low-[Asp] calcite samples (Figure 3a,b), respectively. These chemical shifts and line-widths served to deconvolute the S0 REDOR spectra to yield the respective peak positions and line-widths of the DV and DC carbonate peaks. The two sets of REDOR-extracted peak positions and line-widths served to deconvolute the CP MAS spectra (Figure 1) from which the relative populations were estimated assuming similar CP dynamics. Chemical shifts and line-widths of the crystalline polymorphs—vaterite and calcite—were determined from the DE MAS spectra and are given for a reference (consistent with literature values). The accuracy of the determined isotropic chemical shifts (δiso) and line-widths (δν) is ±0.1 for DV, DC, and DCA and ±0.2 for DVA.
Populations accuracy is estimated at ±0.1.
The chemical shifts identified in Table 1 for the DV and DC carbonates are, reassuringly, centered about the chemical shifts of their host lattices, indicating that the near-range chemical environment is essentially that of the host bulk lattice, minimally perturbed by carbonate substitution by a carboxylate in the Ca2+ coordination shell—yet the observed range of chemical shift as measured by the line-width of these peaks is larger, representing structural heterogeneity about the average environment of the host. Accordingly, we have denoted these peaks as disordered vaterite, DV, and disordered calcite, DC.46,52 In contrast, chemical shifts of the peaks we label as DVA and DCA, where subscript A denotes their proximity to the amine of the occluded amino acid, are found at a substantial shift from that of the host carbonate, consistent with an electronic environment that is more perturbed by Ca2+ substitution by −NH3+.
The carbonate peaks of both vaterite precipitates—the as-synthesized, transient low-[Asp] and the stable high-[Asp]—are indistinguishable in the CP MAS spectra (SI, Figure S5) and likewise indistinguishable in the 13C{15N} CP-REDOR spectra (Figure S7, ΔS peaks shown). The former illustrates that the chemical environments (reflected by 13C chemical shifts) of the interfacial carbonates are independent of Asp concentration, and the latter—as we discuss in more detail below—that the 13C···15N average distances are similarly concentration-independent.
Average NH3+···CO32– Distances of DVA and DCA Carbonates
Applying the REDOR experiment with increasing dipolar interaction time leads to a buildup curve representing ΔS/S0 (see Figure 4) vs t, from which the dipolar interaction strength and the distance between the nuclei of interest, rC···N, are calculated. For each of the three coprecipitates we find that rC···N = 3.8 Å provides the best fit to the average distance between either the 13C in the DVA or DCA carbonates and the 15N in the amine. As disorder is inherent, both at the DVA and DCA carbonates and the occluded Asp, the “single” REDOR-determined distance must be understood to represent at best an average over some distribution. Note that said average rC···N value is the same for all three calcium carbonate samples: high- and low-[Asp] vaterites, and the calcite which evolves from the latter. The persistence of this average distance regardless of Asp occlusion level, and, moreover, before and after the spontaneous transformation from vaterite to calcite, further testifies to the stability of the interaction shell. Given the typical formula unit dimension of about 4 Å, the CP-REDOR experiment would appear to identify only nearest-neighbor carbonates to the −15NH3+.
Figure 4.
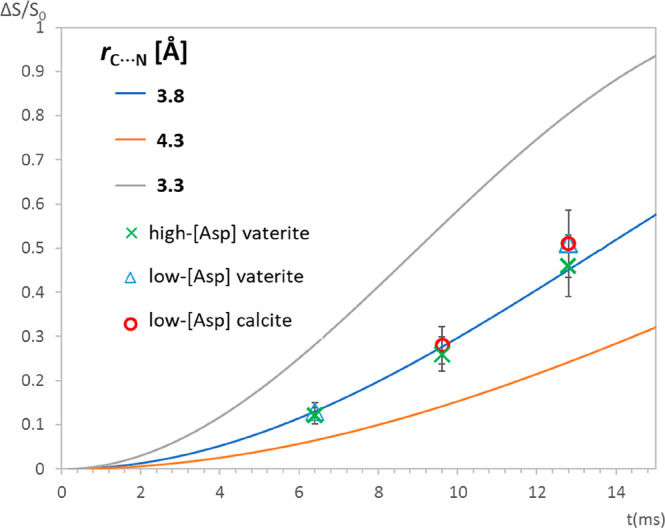
75.4 MHz 13C{15N} CP-REDOR ΔS/S0 evolution as a function of dipolar evolution time for the three coprecipitates: high-[Asp] vaterite, low-[Asp] vaterite, and the fully evolved low-[Asp] calcite (respective δiso(13C) values for the three curves are as listed in Table 1: 168.8, 168.8, and 167.4 ppm). The vertical error bars represent uncertainties arising from the spectral deconvolutions of the DVA and DCA components in their respective S0 spectra (at the three time points). The central line (blue) represents the best fit REDOR evolution for rC···N = 3.8 Å. The other two lines represent calculated REDOR evolution for isolated spin pairs with internuclear distances of ±0.5 Å. Simulations were performed using Spinevolution.80
3–4 DVA or DCA Carbonates Are Associated with Each Asp Amine
As the amino acids are dispersed individually, in the 13C{15N} CP-REDOR experiment described above, each DVA or DCA carbonate has exactly one single nearby 15N neighbor. Repeating the CP-REDOR experiment where we instead detect the 15N signature of the labeled amino acid (Figure 5), we anticipate that only the same distance distribution can be found—though there are multiple nearby carbonates (DVA or DCA). Thus, the signal may be attenuated by different numbers of nearby 13C-labeled carbonates. Where the carbonates are 13C-labeled to only 10%, a single nearby carbonate would attenuate the 15N peak intensity by no more than 10%, and where there are n nearby carbonates, the maximal cumulative signal attenuation may reach n × 10%. Hence, the 15N REDOR peak attenuation determines the minimal number of C sites within the REDOR distance limits of the 15N-amine—i.e., n is an estimate of the association number of carbonates near each amine.
Figure 5.
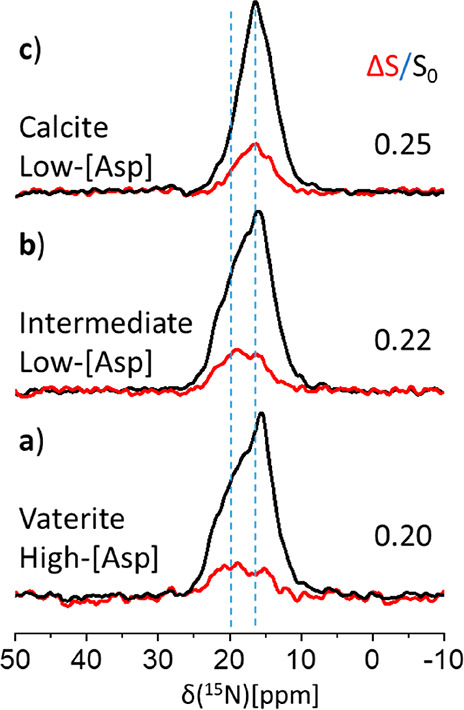
50.2 MHz 15N{13C} CP-REDOR of (a) stable high-[Asp] vaterite, (b) the partially transformed low-[Asp] vaterite, and (c) the fully transformed high-[Asp] calcite. The S0 spectra (black traces) represent all [15N]l-Asp amines. The similarity of the (integrated) relative intensity of the REDOR ΔS peaks (red traces), with ΔS/S0 ∼0.20–0.25, demonstrates that each amine is associated with at least 3 interfacial carbonates (Table S1). Dipolar evolution of 12.8 ms (64 TR) was employed.
This effect is best represented by the REDOR difference peak, ΔS, in Figure 5, and quantified by ΔS/S0. We find ΔS/S0 ≥ 20% in the 15N{13C} CP-REDOR spectra of each of the three coprecipitates—high-[Asp] vaterite and low-[Asp] vaterite–calcite intermediate and final low-[Asp] calcite, at a fixed REDOR evolution time (12.8 ms dipolar recoupling, 64 TR) indicating that the association number is greater than 2. We can further refine this estimate as we know that, for our measured average distance of rC···N ∼ 3.8 Å (found above in the 13C{15N} CP-REDOR experiment), the 15N signal attenuation, ΔS/S0, at 12.8 ms is 0.46 ± 0.03 (Figure 5). Correcting for this partial attenuation of the 15N REDOR peak [see the SI, Table S1] we find that n, the association number, is 3–4. Thus, 3–4 carbonates are associated with each 15N amine at an average distance of 3.8 Å.
The broad line-widths of the amine peak (S0) in the 15N CP-REDOR spectra (Figure 5) clearly reveal heterogeneity; this heterogeneity is similar to that exhibited in the 15N DE MAS spectra (SI, Figure S4). Nonetheless the ΔS peak is not simply an attenuated version of the S0 spectrum, as is seen most clearly for the vaterite precipitates: at higher 15N chemical shifts in the vaterite, the attenuation is larger—suggesting that these shifts are likely more closely associated with 13C carbonates than are found at lower nitrogen shifts. This observation further substantiates the above suggested distance distribution with rC···N representing an average distance. The 15N peak of the spontaneously evolved calcite coprecipitate narrows (Figure S4a, Figure 5), and the ΔS and S0 peak line-shapes become similar (Figure 5c), indicating decreased heterogeneity and therefore narrower distributions of both the association number and rC···N within the calcite host. These observations imply that the vaterite-to-calcite transformation is accompanied by a small structural rearrangement of the interaction interface which decreases local heterogeneity, while maintaining the same average distance and association number as found within the vaterite host.
To reiterate, in all three samples we find the same average association number and amine to carbonates distance, thus suggesting that locally the structure of the amino acid–carbonate interaction region is independent of both concentration of Asp and the host crystal lattice. The interaction interface containing the amino acid undergoes small rearrangements as the bulk lattice transforms between vaterite and calcite.
Asp Is Molecularly Occluded within an Interaction Shell of Less than Ten Perturbed Carbonates
The number of carbonates within the CP-able volume surrounding an individually occluded Asp molecule is obtained by reference to the deconvoluted CP spectra (Figure 3) where the two sets of interfacial carbonate components, DVA vs DV (or DCA vs DC), are comparable in the low- and high-[Asp] samples (Table 1). As the REDOR analysis above counts 3–4 DVA or DCA carbonates (15N{13C} REDOR), this implies that there are also 3–4 DV or DC carbonates. Hence, the CP-able volume (at 1–2 ms contact time) consists of about 6–8 interfacial carbonates.
Water Molecules Segregate to the DC/DV Subregion of the Interface
As the water–carbonate cross-peaks (2D HETCOR spectra, Figure 2c) are centered on the interfacial carbonates remote from the amine, DV and DC, we conclude that the co-occluded water resides preferentially in their vicinity and not within the tightly amine-associated region of the DVA’s or DCA’s. This evidence suggests that occluded Asp selectively segregates coadsorbed water molecules into this subregion of the interface, and once there they become an integral part thereof.
How Far from Occluded Asp Is the “Bulk” Lattice Regained?
The above CP MAS experiments (1–2 ms) probe primarily nearest neighbors of Asp in the vaterite and calcite hosts. At longer CP times (8 ms), contributions from more distant carbonates are evident as the resulting spectral line-shapes differ (Figure 6). These new peaks are best visualized by subtraction of the short CP spectrum (2 ms) from the long CP as shown by the Δ(CP) spectra in Figure 6. The exposed difference peaks are more nearly those of the bulk lattice, suggesting that the majority of the lattice disruption associated with the occluded Asp is relaxed within the nearest layer of 8 surrounding carbonates at distances less than 1 nm from Asp.
Figure 6.
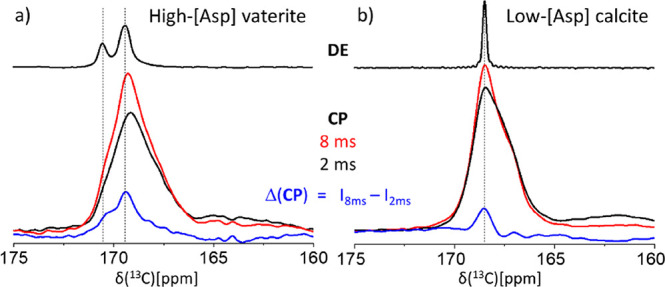
75.4 MHz 13C CP MAS spectra of the (a) stable high-[Asp] vaterite and the (b) low-[Asp] calcite. The red and black spectra were obtained with 2 and 8 ms cross-polarization times (contact times), respectively. The blue traces represent weighted subtraction of the 2 ms spectra from the respective 8 ms spectra, emphasizing the appearance of host lattice carbonate peaks at the unperturbed chemical shifts (dashed lines); top, vaterite and calcite DE MAS reference spectra.
Discussion
In either crystalline or amorphous lattices, foreign agents may be incorporated during growth, and where the growth is kinetically controlled these additives or impurities appear on no predictable length scale. While well-ordered periodic structures of sufficient dimension can be studied via numerous characterization techniques, with methodologies suitable to inherently disordered systems with nanoscopic dimensions, the choices are rare. Nevertheless, a whole multitude of terms are used throughout the scientific literature in describing this phenomenon—inclusion, occlusion, incorporation—which suggest a knowledge of structure which may at molecular dimensions be elusive. Accompanying the multitude of terms are a comparable number of questions, on topics as varied as the magnitude of disruption to the surrounding matrix, the specific chemical interactions bridging between the matrix and the occlusion, and the size of the region which is only poorly described by reference to the bulk, as these hybrid structures affect macroscopic properties well beyond our observation of lattice stability with respect to bulk transformations. The solid-state MAS NMR techniques described above are suited to address this array of fundamental questions and to project on a variety of macroscopic properties. In this final section we attempt to tie together all the results in a structural model for the occlusion, and to suggest how that model impacts macroscopic properties.
Structural Model of Asp Occlusion Shell
We can now portray the buried interface in our Asp–CaCO3 composite. Solid-state NMR, as our main characterization tool, identifies the polymorphs comprising the bulk, vaterite, and calcite in our system and monitors transformations when they occur—though of course many other techniques are equally sensitive. In contrast, solid-state NMR is uniquely capable of directly and selectively observing the inherent disorder in the interaction shell including both interfacial carbonates and the occluded Asp. Moreover, our NMR data (CP and 2D HETCOR) unambiguously identify the incorporated amino acid as dominated by the Asp1– species—where each carboxylate is deprotonated while the amine is protonated. CP-REDOR NMR further partitions the interfacial carbonates into two groups based on their proximity to the amine group of Asp: 3–4 carbonates are at an average distance of ∼3.8 Å from the amine, and a similar number of carbonates are distant from the amine, but still within a short range of the other hydrogens of Asp. Long-range CP (<1 nm) demonstrates that the relaxation back to bulklike environments occurs shortly beyond the nearest layer of carbonates.
As the number of interfacial carbonates doubles upon doubling the concentration of occluded Asp (low- and high-[Asp]), and the number of carbonates near each Asp remains fixed (6–8), we conclude that the Asp molecules are sparsely distributed in intimate contact with similar numbers of surrounding carbonates per Asp. Moreover, as low-[Asp] vaterite spontaneously transforms to low-[Asp] calcite, the Asp molecules remain occluded and maintain their surrounding carbonates with at most minor rearrangement. An important implication of the above facts is that the amino acids are occluded as individual molecules surrounded by a disordered layer of carbonates where Asp–Asp contacts are avoided.
The 3–4 negatively charged carbonates, which we have identified above as being near, ∼3.8 Å, the positively charged amine, we labeled as DVA and DCA. Are these coordination numbers and distances reasonable? We take inspiration from ionic lattices, and in particular from potassium carbonate whose monovalent cation is similar in size to the ammonium cation (no structure exists for ammonium carbonate which is unstable). In K2CO3 six carbonates coordinate the potassium cation with K···C distances between 3.45 and 3.9 Å.81 In our system, as a significant fraction of the volume surrounding the amine is blocked by the covalent bonding network of the Asp molecule we expect to find fewer associating carbonates, 3–4 nearest neighbors, than are found in pure ionic salts, and the distances we have found are appropriate for the similarly sized −NH3+ cation. Thus, our estimated association number of 3–4 carbonates, and average distances less than 4 Å, seems reasonable.
The second carbonates group farther from the charged amine we have labeled as DV and DC, because their 13C chemical shifts look similar to those of the bulk lattices. As these carbonates are farther from the amine, they must be closer to the negatively charged carboxylate anions. This provides an electrostatic barrier which can only be resolved if there are Ca2+ ions which are available to coordinate to both, which, of course, is consistent with the chemical shifts of these carbonates looking to be more nearly bulklike—as the nearest charge-balancing cation is identical in the bulk as it is in the interface.
The above directs us to construct an atomistic model of the occluded Asp and its nearby interfacial carbonates which is consistent with all these data, and with ordinary chemical intuition as shown in Figure 7. The model describes the molecular occlusion of Asp in the parent precipitates—high- and low-[Asp] vaterites, as well as in the spontaneously evolving low-[Asp] calcite. None of our NMR evidence indicates changes in the average interaction distances or association numbers, and therefore, our visualization suggests that each interfacial regime is similar to all others.
Figure 7.

Visualization82 of the vaterite-to-calcite transformation, summarizing our observations of the interfacial regions superposed on the crystal lattice. At left, the vaterite lattice (pseudotriangles), calcium cations, and water molecules. The dark and red triangles represent the DVA and DV carbonates, respectively; the red and blue arrows represent the REDOR-invisible and REDOR-measurable 15N–13C distances, respectively. At right, the calcite lattice with the occluded interfacial region on top; the aspartic acid remains entrapped in the lattice. The dark and red triangles represent the DCA and DC carbonates that emerged from the DVA and DV carbonates as a result of the transformation. Water molecules reside primarily at the DV and DC regions mediating with calcium cations the interactions to the methylene, methine, and charged carboxylates of Asp. Small-scale reorientation of the amino acid, and adjustments in the orientations and distances of the bulky carbonates, are possible, but the interfacial region remains largely unchanged as the lattice undergoes relaxation to the more stable and denser calcite phase. Calcium atoms indicated in light blue, oxygen in red, carbon in gray, nitrogen in blue.
Insights to Lattice Stability Provided by a Randomly Doped Cubic Lattice Model
That a resilient interfacial region centered on an isolated occluded Asp molecule exists has implications for the regulation of lattice stability, and possibly to other macroscopic properties such as hardness. Our observations have demonstrated that, between 0.5 and 1.2 mol % of Asp, as are found for our low- and high-[Asp] calcium carbonates, there is a critical concentration above which the barrier to the solid–solid phase transition from vaterite to calcite is high enough to suppress the spontaneous transformation to calcite.
Given the macroscopic densities of CaCO3 (2.66 g/cm3 for vaterite, and 2.71 g/cm3 for calcite), a formula unit in either of our calcium carbonate polymorphs occupies a volume of approximately 64 Å3. For a crystal incorporating Asp at the 0.5 and 1.2 mol % levels, the average volume expected to contain a single Asp is 13 000–5000 Å3. While these volumes may seem large, if we consider instead the average Asp···Asp distances, they are surprisingly short at only about 25–17 Å, and any “Asp-free bulk” found in these mesocrystals is likely to contain no more than a few hundred CaCO3 formula units. This suggests that at even modest concentrations Asp impurities are an essential feature of the bulk, rather than an irrelevant irritant. As the perturbed region of the crystal is composed of not just an individual Asp, but rather includes a persistent shell of distorted CaCO3 units nearby, the volume of unperturbed “bulk” is reduced yet further.
To first order the Asp can be assumed to incorporate randomly, though the observed anticooperativity implies that close Asp–Asp distances are avoided. To estimate distance distributions we assume, for the sake of simplicity, a cubic lattice model (as illustrated in Figure 8a and detailed in the SI). A formula unit of CaCO3 is represented by a white cube of a 4 Å edge, where each Asp impurity is represented by a red, double-sized block—quite nearly the volume of an Asp molecule. The latter are implanted randomly in a large volume so as to achieve the prespecified concentrations, though care is taken to avoid all contacts between impurities—thus recognizing the NMR observations of anticooperativity of insertion and that each Asp is embedded in a shell of only calcium carbonate and water. As many of the properties of random distributions are not sensitive to crystallographic verisimilitude, from each such model lattice we assess the distribution of nearest neighbor distances between red (Asp) blocks, or between red and white blocks, as shown in Figure 8b,c. These distributions should approximately represent the distances found in our samples and with some care represent also the volumes of Asp-free domains—and more importantly the strong dependence on the dopant concentration as seen for the two experimental 0.5 and 1.2 mol % occlusion levels.
Figure 8.

(a) Illustration of the cubic CaCO3 lattice doped with l-Asp. A CaCO3 formula unit is represented by a white cube (of 4 Å edge) while an occluded Asp is represented by a red box made of two connected cubes. (b, c) Simulations of distance distributions of nearest neighbor red sites representing Asp pairs, for white and red sites representing CO32– and Asp, for the two experimental occlusion levels of 0.5 and 1.2 mol %. No red boxes are allowed to adjoin other red boxes. The distance units are given in multiples of the lattice unit (see the SI).
The simulations show, for example, that at 0.5 mol % of red cubes in a white matrix over 80% of occluded molecules have another occluded molecule within 4 lattice units—while at 1.2 mol % nearly 90% of the red sites have near-neighbors within 3 lattice units. For the white cubes representing carbonates, large Asp-free regions are quite rare; at 0.5 mol % nearly 80% have red neighbors within 4 lattice units—and at 1.2 mol % less than 5% of white cubes are further than that from the nearest red neighbor. Thus, even at seemingly low concentration of occlusion sites they are proximate to much of the “bulk” material.
What are the implications of the above findings? We are interested in the unstable–stable transition in doped vaterite as the Asp impurity concentration increases. The resilience of the occlusion cluster is evidence that this unit is not driving the transformation; in fact, if there is any direct effect, it is more likely that these occlusions resist the transformation. What would then be the driving force of the transformation? An effective driving force appears to require Asp-free domains whose size and abundance are larger than some critical values, as in low-[Asp] vaterite; above the critical Asp concentration, as in high-[Asp] vaterite, sufficiently large Asp-free domains become rare, and it would seem that Asp-free domains of sufficient size are the loci for initiation and propagation of the solid–solid phase transformation. The remaining nanogranular pattern of vaterite in the forming calcite facets (SI, Figure S6; Figure 1h) further suggests that the transformation initiates in multiple remote loci, yet their ability to propagate and efficiently coalesce across granule boundaries is quite limited. The above analysis portrays the mechanism of the solid–solid phase transformation—vaterite-to-calcite—that we observe experimentally.
We note that dopant concentration should also affect factors such as the thermodynamic driving force for the transformation, i.e., the difference in the chemical potentials of the starting vaterite and the final calcite, none of which are those of the pure polymorphs as both are infiltrated composites. As such, the above realizations should serve as a point of origin for computational studies to further elucidate the role exerted by randomly incorporated small molecules in the stabilization/destabilization of such perturbed lattices.
Macroscopic Properties: Beyond Lattice Stability
Using practically the same model system, Meldrum and co-workers18 showed recently that hardness of calcite increases as the concentration of incorporated amino acids (Asp or Gly) is increased, until it eventually matches that of biogenic calcites. They have attributed the increase in hardness to a retardation of dislocation motions by the occluded amino acids defects. A question raised by the authors related to whether the occluded amino acid acts individually as a point defect, or—cooperatively with the occluding environment—as a second phase particle defect.
This issue would appear to be directly addressed by our NMR results, which describe the occlusion shell and the occluded amino acid as a resilient perturbing unit. The occlusion unit is characterized by flexibility with regard to mild perturbations, as the dihedral angles between covalent bonds can reorient nondestructively so as to facilitate mild reorganization. This resilience should increase in proportion to the increasing dopant concentration. That the observed hardness is sensitive to occlusion level but insensitive to the identity of the occluded amino acid is also consistent with our description of the perturbing unit, as the occlusion shell containing an amino acid and the surrounding carbonates presents a similar external surface of disordered carbonates to the unperturbed lattice.
The origin of the observed retardation would appear to be in the geometric constraints which characterize covalent bonds, which are highly directional and not easily lengthened or shortened. Rearrangements in a background field of distributed charges which are not strongly directional must inevitably be more readily accomplished than the reorganization of a multiatom complex—a molecule—highly constrained by the fixed bond lengths and angles.
Although both stability and hardness respond similarly to increased defect concentration there are essential differences. Hardness measures the response—shearing—of the crystalline composite matrix when subjected to external force, while stability is a measure of response—overall reorganization—to internal chemical and ultimately thermodynamic driving forces. While the underlying principles may differ, the understanding of both mechanisms appears to find its roots in our detailed description of the occlusion shell.
The importance of our observations extends far beyond our particular systems. In many disparate synthetic fields new and desirable properties are sought by optimizing kinetic control in exchange for thermodynamic control. Accessing structures such as the “Asp-doped” calcite, or the recent example of Balcite lattices with a wide range of Ba:Ca ratios,83 requires evolution through intermediate precipitation–crystallization pathways which can lead to relatively high concentrations of trapped foreign species or varied compositions that would otherwise have been rejected on the pathway to single crystals grown from solutions at close to thermodynamic equilibrium conditions. The direct molecular level identification of the forming interfacial structures in such composites is a key to comprehensive understanding of their properties and for their rational design.
Conclusions
Intracrystalline occlusions and the resulting buried interfaces are critical components of composite systems as they are often responsible for enhancing materials properties. As few techniques are available to directly observe these interfaces, a detailed understanding of their structural–functional role is limited. In this work we have shown that ssNMR can sensitively probe such molecular occlusions as are found in our model system where Asp, coprecipitated with CaCO3, leads to vaterite formation. We observe that Asp occlusion level tunes the vaterite lattice stability. At high Asp, the lattice is temporally and thermally stable. However, at low Asp, its stability decreases, and vaterite spontaneously transforms to calcite via solid–solid transformation at ambient conditions.
We have shown that Asp, the surrounding inorganic interface, and co-occluded water molecules act as one disordered unit whose structural details are relatively insensitive to both dopant concentration and host lattice (though, of course, the carbonate chemical shifts which reflect the electronic environment do reflect the host bulk). Most important is the realization that these units are resilient—of high stability—even as the bulk undergoes significant rearrangement. The resilience of these occluded units is understood to stem from their strong yet flexible interactions internally and with their immediate occluding matrix, and in that provide “fixed” points around which rearrangements may have to occur. These observations explain the concentration-dependent lattice stability and also highlight the mechanistic details of the solid–solid transformation (low-[Asp]). Moreover, the realization of the structure of the occlusion unit and its properties, as accomplished here, appear to go beyond stability suggesting insight into understanding factors governing also other properties, for example, lattice hardness.18
Where we can reveal the nature of the interaction interface (in this work, those carbonates impacted by the presence of occluded Asp), this study highlights important fundamental aspects that are central also to the broad field of crystal growth and design, to the accompanying phase transformations, and to the intricate details of “intracrystalline” occlusions. As demonstrated by this study, solid-state NMR is uniquely equipped to identify the internal structure, the interactions between the components, the structure of the interfaces whether buried or exposed, and the roles played in determining the materials properties and functionality. Such NMR-based insight constitutes an essential complementary component to be employed in concert with other spectroscopic, microscopic, and structural methods where both a fundamental understanding and practical applications are sought.
Acknowledgments
We dedicate this Article to Prof. Jacob Schaefer from Washington University in St. Louis. This research was supported by the Israel Science Foundation grant 2001/17 and in part by the Julia and Joshua Ruch Faculty Exchange Program, administered by the Jacobs Technion-Cornell Institute.
Supporting Information Available
The Supporting Information is available free of charge at https://pubs.acs.org/doi/10.1021/jacs.0c03590.
13C and 15N DE MAS spectra of the [10%-13C]CaCO3–Asp coprecipitates, SEM images of the vaterite and calcite coprecipitates, REDOR association number simulations (15N···13Cn), and assumptions made for the computer model of randomly doped cubic lattice (PDF)
The authors declare no competing financial interest.
Supplementary Material
References
- Simkiss K.; Wilbur K. M.. Biomineralization; Academic Press: San Diego, CA, 1989. [Google Scholar]
- Lowenstam H. A.; Weiner S.. On Biomineralization; Oxford University Press: New York, 1989. [Google Scholar]
- Lowenstam H. A. Minerals Formed by Organisms. Science 1981, 211 (4487), 1126–1131. 10.1126/science.7008198. [DOI] [PubMed] [Google Scholar]
- Nudelman F.; Sommerdijk N. A. J. M. Biomineralization as an Inspiration for Materials Chemistry. Angew. Chem., Int. Ed. 2012, 51 (27), 6582–6596. 10.1002/anie.201106715. [DOI] [PubMed] [Google Scholar]
- Weiner S.; Addadi L. Crystallization Pathways in Biomineralization. Annu. Rev. Mater. Res. 2011, 41 (1), 21–40. 10.1146/annurev-matsci-062910-095803. [DOI] [Google Scholar]
- Meldrum F. C.; Coelfen H. Controlling Mineral Morphologies and Structures in Biological and Synthetic Systems. Chem. Rev. 2008, 108 (11), 4332–4432. 10.1021/cr8002856. [DOI] [PubMed] [Google Scholar]
- Vidavsky N.; Addadi S.; Mahamid J.; Shimoni E.; Ben-Ezra D.; Shpigel M.; Weiner S.; Addadi L. Initial Stages of Calcium Uptake and Mineral Deposition in Sea Urchin Embryos. Proc. Natl. Acad. Sci. U. S. A. 2014, 111 (1), 39–44. 10.1073/pnas.1312833110. [DOI] [PMC free article] [PubMed] [Google Scholar]
- Zou Z.; Bertinetti L.; Politi Y.; Fratzl P.; Habraken W. J. E. M. Control of Polymorph Selection in Amorphous Calcium Carbonate Crystallization by Poly(Aspartic Acid): Two Different Mechanisms. Small 2017, 13 (21), 1603100. 10.1002/smll.201603100. [DOI] [PubMed] [Google Scholar]
- Vidavsky N.; Masic A.; Schertel A.; Weiner S.; Addadi L. Mineral-Bearing Vesicle Transport in Sea Urchin Embryos. J. Struct. Biol. 2015, 192 (3), 358–365. 10.1016/j.jsb.2015.09.017. [DOI] [PubMed] [Google Scholar]
- Beniash E.; Addadi L.; Weiner S. Cellular Control Over Spicule Formation in Sea Urchin Embryos: A Structural Approach. J. Struct. Biol. 1999, 125 (1), 50–62. 10.1006/jsbi.1998.4081. [DOI] [PubMed] [Google Scholar]
- Killian C. E.; Wilt F. H. Molecular Aspects of Biomineralization of the Echinoderm Endoskeleton. Chem. Rev. 2008, 108 (11), 4463–4474. 10.1021/cr0782630. [DOI] [PubMed] [Google Scholar]
- Wilt F. H. Developmental Biology Meets Materials Science: Morphogenesis of Biomineralized Structures. Dev. Biol. 2005, 280 (1), 15–25. 10.1016/j.ydbio.2005.01.019. [DOI] [PubMed] [Google Scholar]
- Elhadj S.; Yoreo J. J. De; Hoyer J. R.; Dove P. M. Role of Molecular Charge and Hydrophilicity in Regulating the Kinetics of Crystal Growth. Proc. Natl. Acad. Sci. U. S. A. 2006, 103 (51), 19237–19242. 10.1073/pnas.0605748103. [DOI] [PMC free article] [PubMed] [Google Scholar]
- Gebauer D.; Völkel A.; Cölfen H. Stable Prenucleation Calcium Carbonate Clusters. Science 2008, 322 (5909), 1819–1822. 10.1126/science.1164271. [DOI] [PubMed] [Google Scholar]
- Nielsen M. H.; Aloni S.; De Yoreo J. J. In Situ TEM Imaging of CaCO3 Nucleation Reveals Coexistence of Direct and Indirect Pathways. Science (Washington, DC, U. S.) 2014, 345 (6201), 1158–1162. 10.1126/science.1254051. [DOI] [PubMed] [Google Scholar]
- Dunlop J. W. C.; Fratzl P. Biological Composites. Annu. Rev. Mater. Res. 2010, 40 (1), 1–24. 10.1146/annurev-matsci-070909-104421. [DOI] [Google Scholar]
- Weiner S.; Addadi L. Design Strategies in Mineralized Biological Materials. J. Mater. Chem. 1997, 7, 689–702. 10.1039/a604512j. [DOI] [Google Scholar]
- Kim Y.-Y.; Carloni J. D.; Demarchi B.; Sparks D.; Reid D. G.; Kunitake M. E.; Tang C. C.; Duer M. J.; Freeman C. L.; Pokroy B.; Penkman K.; Harding J. H.; Estroff L. A.; Baker S. P.; Meldrum F. C. Tuning Hardness in Calcite by Incorporation of Amino Acids. Nat. Mater. 2016, 15 (8), 903–910. 10.1038/nmat4631. [DOI] [PubMed] [Google Scholar]
- Weber E.; Pokroy B. Intracrystalline Inclusions within Single Crystalline Hosts: From Biomineralization to Bio-Inspired Crystal Growth. CrystEngComm 2015, 17 (31), 5873–5883. 10.1039/C5CE00389J. [DOI] [Google Scholar]
- DiMasi E.Biomineralization Sourcebook Characterization of Biominerals and Biomimetic Materials; CRC Press, 2014. [Google Scholar]
- Aparicio C.; Ginebra M. P.. Biomineralization and Biomaterials: Fundamentals and Applications; Woodhead Publishing, 2015. 10.1016/C2014-0-02825-0. [DOI] [Google Scholar]
- Towe K. M.; Thompson G. R. Structure of Some Bivalve Shell Carbonates Prepared by Ion-Beam Thinning - Comparison Study. Calcif. Tissue Res. 1972, 10 (1), 38. 10.1007/BF02012534. [DOI] [PubMed] [Google Scholar]
- Herman A.; Addadi L.; Weiner S. Interactions of Sea-Urchin Skeleton Macromolecules with Growing Calcite Crystals - a Study of Intracrystalline Proteins. Nature 1988, 331 (6156), 546–548. 10.1038/331546a0. [DOI] [Google Scholar]
- Weiner S.; Hood L. Soluble-Protein of Organic Matrix of Mollusk Shells - Potential Template for Shell Formation. Science 1975, 190 (4218), 987–988. 10.1126/science.1188379. [DOI] [PubMed] [Google Scholar]
- Marin F.; Luquet G.; Marie B.; Medakovic D. Molluscan Shell Proteins: Primary Structure, Origin, and Evolution. Curr. Top. Dev. Biol. 2007, 80, 209–276. 10.1016/S0070-2153(07)80006-8. [DOI] [PubMed] [Google Scholar]
- Sommerdijk N. A. J. M.; de With G. Biomimetic CaCO3 mineralization Using Designer Molecules and Interfaces. Chem. Rev. 2008, 108 (11), 4499–4550. 10.1021/cr078259o. [DOI] [PubMed] [Google Scholar]
- Colfen H.; Mann S. Higher-Order Organization by Mesoscale Self-Assembly and Transformation of Hybrid Nanostructures. Angew. Chem., Int. Ed. 2003, 42 (21), 2350–2365. 10.1002/anie.200200562. [DOI] [PubMed] [Google Scholar]
- Cölfen H.; Qi L. M. A Systematic Examination of the Morphogenesis of Calcium Carbonate in the Presence of a Double-Hydrophilic Block Copolymer. Chem. - Eur. J. 2001, 7 (1), 106–116. . [DOI] [PubMed] [Google Scholar]
- Colfen H.; Antonietti M. Mesocrystals: Inorganic Superstructures Made by Highly Parallel Crystallization and Controlled Alignment. Angew. Chem., Int. Ed. 2005, 44 (35), 5576–5591. 10.1002/anie.200500496. [DOI] [PubMed] [Google Scholar]
- Borukhin S.; Bloch L.; Radlauer T.; Hill A. H.; Fitch A. N.; Pokroy B. Screening the Incorporation of Amino Acids into an Inorganic Crystalline Host: The Case of Calcite. Adv. Funct. Mater. 2012, 22 (20), 4216–4224. 10.1002/adfm.201201079. [DOI] [Google Scholar]
- Hood M. A.; Leemreize H.; Scheffel A.; Faivre D. Lattice Distortions in Coccolith Calcite Crystals Originate from Occlusion of Biomacromolecules. J. Struct. Biol. 2016, 196 (2), 147–154. 10.1016/j.jsb.2016.09.010. [DOI] [PubMed] [Google Scholar]
- Metzler R. A.; Tribello G. A.; Parrinello M.; Gilbert P. U. P. A. Asprich Peptides Are Occluded in Calcite and Permanently Disorder Biomineral Crystals. J. Am. Chem. Soc. 2010, 132 (33), 11585–11591. 10.1021/ja103089r. [DOI] [PubMed] [Google Scholar]
- Shaw W. J.; Long J. R.; Dindot J. L.; Campbell A. A.; Stayton P. S.; Drobny G. P. Determination of Statherin N-Terminal Peptide Conformation on Hydroxyapatite Crystals. J. Am. Chem. Soc. 2000, 122 (8), 1709–1716. 10.1021/ja9842823. [DOI] [Google Scholar]
- Ndao M.; Ash J. T.; Breen N. F.; Goobes G.; Stayton P. S.; Drobny G. P. A 13C{31P} REDOR NMR Investigation of the Role of Glutamic Acid Residues in Statherin- Hydroxyapatite Recognition. Langmuir 2009, 25 (20), 12136–12143. 10.1021/la901647n. [DOI] [PMC free article] [PubMed] [Google Scholar]
- Duer M. J. The Contribution of Solid-State NMR Spectroscopy to Understanding Biomineralization: Atomic and Molecular Structure of Bone. J. Magn. Reson. 2015, 253, 98–110. 10.1016/j.jmr.2014.12.011. [DOI] [PubMed] [Google Scholar]
- Goobes G.; Goobes R.; Schueler-Furman O.; Baker D.; Stayton P. S.; Drobny G. P. Folding of the C-Terminal Bacterial Binding Domain in Statherin upon Adsorption onto Hydroxyapatite Crystals. Proc. Natl. Acad. Sci. U. S. A. 2006, 103 (44), 16083–16088. 10.1073/pnas.0607193103. [DOI] [PMC free article] [PubMed] [Google Scholar]
- Jäger C.; Welzel T.; Meyer-Zaika W.; Epple M. A Solid-State NMR Investigation of the Structure of Nanocrystalline Hydroxyapatite. Magn. Reson. Chem. 2006, 44 (6), 573–580. 10.1002/mrc.1774. [DOI] [PubMed] [Google Scholar]
- Laurencin D.; Wong A.; Hanna J. V.; Dupree R.; Smith M. E. A High-Resolution Ca-43 Solid-State NMR Study of the Calcium Sites of Hydroxyapatite. J. Am. Chem. Soc. 2008, 130 (8), 2412–2413. 10.1021/ja710557t. [DOI] [PubMed] [Google Scholar]
- Bonhomme C.; Gervais C.; Babonneau F.; Hayakawa S.; Osaka A.. Substituted Hydroxyapatites: A Case Study for Solid State NMR; Okayama University, 2008. [Google Scholar]
- Vyalikh A.; Simon P.; Kollmann T.; Scheler U. Local Environment in Biomimetic Hydroxyapatite - Gelatin Nanocomposites As Probed by NMR Spectroscopy. J. Phys. Chem. C 2011, 115, 1513. 10.1021/jp1082399. [DOI] [Google Scholar]
- Raghunathan V.; Gibson J. M.; Goobes G.; Popham J. M.; Louie E. A.; Stayton P. S.; Drobny G. P. Homonuclear and Heteronuclear NMR Studies of a Statherin Fragment Bound to Hydroxyapatite Crystals. J. Phys. Chem. B 2006, 110 (18), 9324–9332. 10.1021/jp056644g. [DOI] [PubMed] [Google Scholar]
- Best S. M.; Duer M. J.; Reid D. G.; Wise E. R.; Zou S. Towards a Model of the Mineral-Organic Interface in Bone: NMR of the Structure of Synthetic Glycosaminoglycan- and Polyaspartate-Calcium Phosphate Composites. Magn. Reson. Chem. 2008, 46 (4), 323–329. 10.1002/mrc.2168. [DOI] [PubMed] [Google Scholar]
- Michel F. M.; MacDonald J.; Feng J.; Phillips B. L.; Ehm L.; Tarabrella C.; Parise J. B.; Reeder R. J. Structural Characteristics of Synthetic Amorphous Calcium Carbonate. Chem. Mater. 2008, 20 (14), 4720–4728. 10.1021/cm800324v. [DOI] [Google Scholar]
- Gebauer D.; Gunawidjaja P. N.; Ko J. Y. P.; Bacsik Z.; Aziz B.; Liu L.; Hu Y.; Bergström L.; Tai C. W.; Sham T. K.; Edén M.; Hedin N. Proto-Calcite and Proto-Vaterite in Amorphous Calcium Carbonates. Angew. Chem., Int. Ed. 2010, 49 (47), 8889–8891. 10.1002/anie.201003220. [DOI] [PubMed] [Google Scholar]
- Jager C.; Colfen H. Fine Structure of Nacre Revealed by Solid State C-13 and H-1 NMR. CrystEngComm 2007, 9, 1237–1244. 10.1039/b708600h. [DOI] [Google Scholar]
- Nebel H.; Neumann M.; Mayer C.; Epple M. On the Structure of Amorphous Calcium Carbonate--a Detailed Study by Solid-State NMR Spectroscopy. Inorg. Chem. 2008, 47 (17), 7874–7879. 10.1021/ic8007409. [DOI] [PubMed] [Google Scholar]
- Akiva-Tal A.; Kababya S.; Balazs Y. S.; Glazer L.; Berman A.; Sagi A.; Schmidt A. In Situ Molecular NMR Picture of Bioavailable Calcium Stabilized as Amorphous CaCO3 Biomineral in Crayfish Gastroliths. Proc. Natl. Acad. Sci. U. S. A. 2011, 108 (36), 14763–14768. 10.1073/pnas.1102608108. [DOI] [PMC free article] [PubMed] [Google Scholar]
- Kababya S.; Gal A.; Kahil K.; Weiner S.; Addadi L.; Schmidt A. Phosphate–Water Interplay Tunes Amorphous Calcium Carbonate Metastability: Spontaneous Phase Separation and Crystallization vs Stabilization Viewed by Solid State NMR. J. Am. Chem. Soc. 2015, 137 (2), 990–998. 10.1021/ja511869g. [DOI] [PubMed] [Google Scholar]
- Ben Shir I.; Kababya S.; Schmidt A. Molecular-Level Structure-Property Relationships in Biogenic Calcium Carbonates: The Unique Insights of Solid-State NMR Spectroscopy. Isr. J. Chem. 2014, 54 (1–2), 74–85. 10.1002/ijch.201300121. [DOI] [Google Scholar]
- Nassif N.; Pinna N.; Gehrke N.; Antonietti M.; Jäger C.; Cölfen H. Amorphous Layer around Aragonite Platelets in Nacre. Proc. Natl. Acad. Sci. U. S. A. 2005, 102 (36), 12653–12655. 10.1073/pnas.0502577102. [DOI] [PMC free article] [PubMed] [Google Scholar]
- Becker A.; Ziegler A.; Epple M. The Mineral Phase in the Cuticles of Two Species of Crustacea Consists of Magnesium Calcite, Amorphous Calcium Carbonate, and Amorphous Calcium Phosphate. Dalt. Trans. 2005, 5 (10), 1814. 10.1039/b412062k. [DOI] [PubMed] [Google Scholar]
- Cartwright J. H. E.; Checa A. G.; Gale J. D.; Gebauer D.; Sainz-Díaz C. I. Calcium Carbonate Polyamorphism and Its Role in Biomineralization: How Many Amorphous Calcium Carbonates Are There?. Angew. Chem., Int. Ed. 2012, 51 (48), 11960–11970. 10.1002/anie.201203125. [DOI] [PubMed] [Google Scholar]
- Gebauer D. Bio-Inspired Materials Science at Its Best-Flexible Mesocrystals of Calcite. Angew. Chem., Int. Ed. 2013, 52 (32), 8208–8209. 10.1002/anie.201303933. [DOI] [PubMed] [Google Scholar]
- Gröger C.; Lutz K.; Brunner E. NMR Studies of Biomineralisation. Prog. Nucl. Magn. Reson. Spectrosc. 2009, 54 (1), 54–68. 10.1016/j.pnmrs.2008.02.003. [DOI] [Google Scholar]
- Jantschke A.; Koers E.; Mance D.; Weingarth M.; Brunner E.; Baldus M. Insight into the Supramolecular Architecture of Intact Diatom Biosilica from DNP-Supported Solid-State NMR Spectroscopy. Angew. Chem., Int. Ed. 2015, 54 (50), 15069–15073. 10.1002/anie.201507327. [DOI] [PubMed] [Google Scholar]
- Xu J.; Zhu P.; Gan Z.; Sahar N.; Tecklenburg M.; Morris M. D.; Kohn D. H.; Ramamoorthy A. Natural-Abundance 43Ca Solid-State NMR Spectroscopy of Bone. J. Am. Chem. Soc. 2010, 132, 11504. 10.1021/ja101961x. [DOI] [PMC free article] [PubMed] [Google Scholar]
- Lin C.-J.; Yang S.-Y.; Huang S.-J.; Chan J. C. C. Structural Characterization of Mg-Stabilized Amorphous Calcium Carbonate by Mg-25 Solid-State NMR Spectroscopy. J. Phys. Chem. C 2015, 119 (13), 7225–7233. 10.1021/jp512971a. [DOI] [Google Scholar]
- Hughes C. E.; Williams P. A.; Harris K. D. M. CLASSIC NMR”: An In-Situ NMR Strategy for Mapping the Time-Evolution of Crystallization Processes by Combined Liquid-State and Solid-State Measurements. Angew. Chem., Int. Ed. 2014, 53 (34), 8939–8943. 10.1002/anie.201404266. [DOI] [PMC free article] [PubMed] [Google Scholar]
- Gullion T.; Schaefer J. Detection of Weak Heteronuclear Dipolar Coupling by Rotational Echo Double Resonance Nuclear Magnetic Resonance. Adv. Magn. Opt. Reson. 1989, 13, 57–83. 10.1016/B978-0-12-025513-9.50009-4. [DOI] [Google Scholar]
- Gullion T.; Schaefer J. Rotational-Echo Double-Resonance NMR. J. Magn. Reson. 1989, 81 (1), 196–200. 10.1016/0022-2364(89)90280-1. [DOI] [PubMed] [Google Scholar]
- Griffiths J. M.; Griffin R. G. NMR Methods for Measuring Dipolar Couplings in Rotating Solids. Anal. Chim. Acta 1993, 283 (3), 1081–1101. 10.1016/0003-2670(93)80267-O. [DOI] [Google Scholar]
- Platzer G.; Okon M.; Mcintosh L. P. PH-Dependent Random Coil 1H, 13C, and 15N Chemical Shifts of the Ionizable Amino Acids: A Guide for Protein PK a Measurements. J. Biomol. NMR 2014, 60 (2–3), 109–129. 10.1007/s10858-014-9862-y. [DOI] [PubMed] [Google Scholar]
- Burum D. P.; Linder M.; Ernst R. R. Low-Power Multipulse Line Narrowing in Solid-State NMR. J. Magn. Reson. 1981, 44 (1), 173–188. 10.1016/0022-2364(81)90200-6. [DOI] [Google Scholar]
- Caravatti P.; Braunschweiler L.; Ernst R. R. Heteronuclear Correlation Spectroscopy in Rotating Solids. Chem. Phys. Lett. 1983, 100 (4), 305–310. 10.1016/0009-2614(83)80276-0. [DOI] [Google Scholar]
- Vinogradov E.; Madhu P. K.; Vega S. High-Resolution Proton Solid-State NMR Spectroscopy by Phase-Modulated Lee-Goldburg Experiment. Chem. Phys. Lett. 1999, 314 (5–6), 443–450. 10.1016/S0009-2614(99)01174-4. [DOI] [Google Scholar]
- Gullion T.; Baker D. B.; Conradi M. S. New, Compensated Carr-Purcell Sequences. J. Magn. Reson. 1990, 89 (3), 479–484. 10.1016/0022-2364(90)90331-3. [DOI] [Google Scholar]
- Nebel H.; Epple M. Continuous Preparation of Calcite, Aragonite and Vaterite, and of Magnesium-Substituted Amorphous Calcium Carbonate (Mg-ACC). Z. Anorg. Allg. Chem. 2008, 634 (8), 1439–1443. 10.1002/zaac.200800134. [DOI] [Google Scholar]
- Goodwin A. L.; Michel F. M.; Phillips B. L.; Keen D. A.; Dove M. T.; Reeder R. J. Nanoporous Structure and Medium-Range Order in Synthetic Amorphous Calcium Carbonate. Chem. Mater. 2010, 22 (10), 3197–3205. 10.1021/cm100294d. [DOI] [Google Scholar]
- Gertman R.; Ben Shir I.; Kababya S.; Schmidt A. In Situ Observation of the Internal Structure and Composition of Biomineralized Emiliania Huxleyi Calcite by Solid-State NMR Spectroscopy. J. Am. Chem. Soc. 2008, 130 (40), 13425–13432. 10.1021/ja803985d. [DOI] [PubMed] [Google Scholar]
- Addadi L.; Joester D.; Nudelman F.; Weiner S. Mollusk Shell Formation: A Source of New Concepts for Understanding Biomineralization Processes. Chem. - Eur. J. 2006, 12 (4), 980–987. 10.1002/chem.200500980. [DOI] [PubMed] [Google Scholar]
- Tambutté S.; Holcomb M.; Ferrier-Pagès C.; Reynaud S.; Tambutté É.; Zoccola D.; Allemand D. Coral Biomineralization: From the Gene to the Environment. J. Exp. Mar. Biol. Ecol. 2011, 408 (1–2), 58–78. 10.1016/j.jembe.2011.07.026. [DOI] [Google Scholar]
- Moore J. K.; Sakwa-Novak M. A.; Chaikittisilp W.; Mehta A. K.; Conradi M. S.; Jones C. W.; Hayes S. E. Characterization of a Mixture of CO2 Adsorption Products in Hyperbranched Aminosilica Adsorbents by 13C Solid-State NMR. Environ. Sci. Technol. 2015, 49 (22), 13684–13691. 10.1021/acs.est.5b02930. [DOI] [PubMed] [Google Scholar]
- Schenk A. S.; Cantaert B.; Kim Y. Y.; Li Y.; Read E. S.; Semsarilar M.; Armes S. P.; Meldrum F. C. Systematic Study of the Effects of Polyamines on Calcium Carbonate Precipitation. Chem. Mater. 2014, 26 (8), 2703–2711. 10.1021/cm500523w. [DOI] [Google Scholar]
- Gal A.; Weiner S.; Addadi L. A Perspective on Underlying Crystal Growth Mechanisms in Biomineralization: Solution Mediated Growth versus Nanosphere Particle Accretion. CrystEngComm 2015, 17 (13), 2606–2615. 10.1039/C4CE01474J. [DOI] [Google Scholar]
- Kolodziejski W.; Klinowski J. Kinetics of Cross-Polarization in Solid-State NMR: A Guide for Chemists. Chem. Rev. 2002, 102 (3), 613–628. 10.1021/cr000060n. [DOI] [PubMed] [Google Scholar]
- Feng J.; Lee Y. J.; Kubicki J. D.; Reeder R. J.; Phillips B. L. NMR Spectroscopy of Citrate in Solids: Cross-Polarization Kinetics in Weakly Coupled Systems. Magn. Reson. Chem. 2008, 46 (5), 408–417. 10.1002/mrc.2191. [DOI] [PubMed] [Google Scholar]
- Taylor R. E.; Chim N.; Dybowski C.. NMR Characterization of Partially Deuterated -Glycine; Department of Chemistry and Biochemistry University of California, 2006. [Google Scholar]
- Phillips B. L.; Lee Y. J.; Reeder R. J. Organic Coprecipitates with Calcite: NMR Spectroscopic Evidence. Environ. Sci. Technol. 2005, 39 (12), 4533–4539. 10.1021/es048733x. [DOI] [PubMed] [Google Scholar]
- Massiot D.; Fayon F.; Capron M.; King I.; Le Calvé S.; Alonso B.; Durand J.-O.; Bujoli B.; Gan Z.; Hoatson G. Modelling One- and Two-Dimensional Solid-State NMR Spectra. Magn. Reson. Chem. 2002, 40 (1), 70–76. 10.1002/mrc.984. [DOI] [Google Scholar]
- Veshtort M.; Griffin R. G. SPINEVOLUTION: A Powerful Tool for the Simulation of Solid and Liquid State NMR Experiments. J. Magn. Reson. 2006, 178 (2), 248–282. 10.1016/j.jmr.2005.07.018. [DOI] [PubMed] [Google Scholar]
- Gatehouse B. M.; Lloyd D. J. Crystal Structure of Anhydrous Potassium Carbonate. J. Chem. Soc., Dalton Trans. 1973, 1, 70. 10.1039/dt9730000070. [DOI] [Google Scholar]
- Momma K.; Izumi F. VESTA 3 for Three-Dimensional Visualization of Crystal, Volumetric and Morphology Data. J. Appl. Crystallogr. 2011, 44 (6), 1272–1276. 10.1107/S0021889811038970. [DOI] [Google Scholar]
- Whittaker M. L.; Joester D. ACBC to Balcite: Bioinspired Synthesis of a Highly Substituted High-Temperature Phase from an Amorphous Precursor. Adv. Mater. 2017, 29 (26), 1606730. 10.1002/adma.201606730. [DOI] [PubMed] [Google Scholar]
Associated Data
This section collects any data citations, data availability statements, or supplementary materials included in this article.