

Abstract
Purpose
To compare the prognostic value and reproducibility of visual versus AI-assisted analysis of lung involvement on submillisievert low-dose chest CT in COVID-19 patients.
Materials and Methods
This was a HIPAA-compliant, institutional review board-approved retrospective study. From March 15 to June 1, 2020, 250 RT-PCR confirmed COVID-19 patients were studied with low-dose chest CT at admission. Visual and AI-assisted analysis of lung involvement was performed by using a semi-quantitative CT score and a quantitative percentage of lung involvement. Adverse outcome was defined as intensive care unit (ICU) admission or death. Cox regression analysis, Kaplan-Meier curves, and cross-validated receiver operating characteristic curve with area under the curve (AUROC) analysis was performed to compare model performance. Intraclass correlation coefficients (ICCs) and Bland- Altman analysis was used to assess intra- and interreader reproducibility.
Results
Adverse outcome occurred in 39 patients (11 deaths, 28 ICU admissions). AUC values from AI-assisted analysis were significantly higher than those from visual analysis for both semi-quantitative CT scores and percentages of lung involvement (all P<0.001). Intrareader and interreader agreement rates were significantly higher for AI-assisted analysis than visual analysis (all ICC ≥0.960 versus ≥0.885). AI-assisted variability for quantitative percentage of lung involvement was 17.2% (coefficient of variation) versus 34.7% for visual analysis. The sample size to detect a 5% change in lung involvement with 90% power and an α error of 0.05 was 250 patients with AI-assisted analysis and 1014 patients with visual analysis.
Conclusion
AI-assisted analysis of lung involvement on submillisievert low-dose chest CT outperformed conventional visual analysis in predicting outcome in COVID-19 patients while reducing CT variability. Lung involvement on chest CT could be used as a reliable metric in future clinical trials.
Summary
AI-assisted analysis of lung involvement in patients with COVID-19 outperformed conventional visual analysis in predicting adverse outcome while reducing variability; AI-assisted quantification of lung involvement in COVID-19 could be used as a reliable metric in clinical trials.
Key Points
■ Area under the curve (AUC) values from automated AI analysis and AI analysis with manual correction were significantly higher than those from visual analysis for both semi-quantitative CT scores and percentages of lung involvement (0.888 and 0.903 vs 0.760 and 0.878 and 0.880 vs 0.774, respectively). Kaplan-Meier curve analysis using the identified cutoffs (CT score ≥7 and lung involvement percentage ≥12.0% for visual analysis, CT score ≥8 and lung involvement percentage ≥19.8% for automated AI analysis, and CT score ≥8 and lung involvement percentage ≥20.5% for AI analysis with manual correction) showed that these values could be used to predict patient outcome (P<0.001 by log rank test for all analyses).
■ Intra- and interreader agreement was significantly higher for AI-assisted analysis with manual correction when compared to visual analysis.
■ Using an AI-assisted analysis can reduce the required sample size for clinical trials aiming to reliably detect a change in the extent of COVID-19 lung involvement by a factor of 4 (e.g., 250 patients vs 1014 patients to detect a 5% change in the extent of lung involvement with a power of 90% and an α error of 0.05).
Introduction
Severe Acute Respiratory Syndrome CoronaVirus 2 (SARS-CoV-2) is a novel enveloped RNA betacoronavirus belonging to the same family of viruses causing severe acute respiratory syndrome (SARS) and Middle East respiratory syndrome (MERS) (1). Patients with SARS-CoV-2 infection can develop clinical coronavirus disease 2019 (COVID-19) which was declared a pandemic by the World Health Organization (WHO) on the 11th of March 2020 (2,3). The full spectrum of COVID-19 severity is still being clarified but appears to be wide, ranging from asymptomatic status or mild upper respiratory tract symptoms to severe viral pneumonia, multiple organ dysfunction and even death (4).
Chest computed tomography (CT) has emerged as an accurate tool for the initial diagnosis of patients with possible COVID-19 infection (5). Additionally, CT may represent a non-invasive tool for patient prognostication as the extent of lung involvement on chest CT appears to be an important prognostic marker (6,7). Multiple Artificial Intelligence (AI) software packages are currently being developed to aid radiologists in the quantification of lung involvement in COVID-19. However, little is known about the reproducibility of these software packages and how they may improve outcome prediction. We hypothesized that the use of semiautomated AI may both improve CT reproducibility and allow for more accurate patient prognostication. We assessed COVID-19 patients who underwent chest CT at our institution by conventional visual and AI-based quantification of lung injury. We also determined the impact of chest CT variability on sample size estimates that would be applicable in a clinical trial (e.g., to determine the potential response to novel antiviral therapies). The aim of this study was therefore to determine reader and software variability in the measurement of lung injury in COVID-19 and assess its impact on patient prognosis.
Materials and Methods
This retrospective study was compliant with the Health Insurance Portability and Accountability Act (HIPAA) and was approved by our institutional review board (Imelda Hospital, Bonheiden, Belgium). Informed consent was waived. From March 15th to June 1st 2020, 250 consecutive patients with clinical suspicion of COVID-19 pneumonia were tested with both RT-PCR and CT within a 2-hour interval of hospital admission. Epidemiological, demographic, clinical, and laboratory data at admission were obtained from the electronic patient management system. Two PCR platforms (Aries system, Luminex, Austin, USA and Rotorgene Q, Qiagen, Hilden, Germany) were used to detect SARS-CoV-2 in nasopharyngeal swabs (eSwab, Copan Diagnostics, Brescia, Italy), both using the E-gene as target. Primers and probe sequences for the E-gene were provided by the Belgian National Reference Center (University Hospitals Leuven, Belgium). No cross reactivity for other human Coronaviruses, Influenza or Respiratory Syncytial Virus (RSV) has been shown for both platforms. Part of the patient population has been previously reported in studies assessing the accuracy of chest CT for COVID-19 diagnosis and the impact of gender on the extent of lung injury (5,8).
Adverse outcome was defined as death or intensive care unit (ICU) admission. In patients with multiple events, only the first event was considered for event-free survival analysis. Only patients with a final outcome (death or discharge) were included in the final analysis. No patients were excluded from analysis after initial inclusion. No adverse event occurred from the chest CT exams.
CT scan protocol
All patients underwent non-contrast low-dose chest CT by using a Somatom Definition AS 64-slice 0.6 mm detector scanner (Siemens Healthineers, Forchheim, Germany). We used vendor-supplied software (CareDose 4D and CarekV, Siemens Healthineers) to calculate size-specific radiation dose estimates for the low-dose chest CT protocol which was adapted from the protocol used for lung cancer screening with reference values in an average patient of 100 kVp and 20 mAs (9). We used a 0.5 second rotation time and a pitch of 1.2 to limit motion artifacts in dyspneic patients. Effective radiation dose was calculated by multiplying the dose-length product (DLP) by 0.014 mSv/mGy · cm as the constant k-value for thoracic imaging (10). Reconstruction parameters were: 1 mm/0.7 mm slice thickness/increment with a standard lung-tissue kernel (I50f medium sharp) and 3 mm/3 mm slice thickness/increment with a standard soft tissue kernel (I31f medium smooth), sinogram-affirmed iterative reconstruction (SAFIRE) strength 3, 450 mm FOV and 512 x 512 matrix size.
CT image analysis
Visual analysis of lung involvement was performed by using a semi-quantitative scoring system as previously described (5). In short, each lobe was scored from 0 to 5 with a total score ranging from 0 to 25: score 0, 0% involvement; score 1, <5% involvement; score 2, 5-25% involvement; score 3, 26-50% involvement; score 4, 51-75% involvement, score 5, 76-100% involvement. Involvement was visually defined as any area of GGO, crazy-paving or consolidation and percentage was estimated by combining axial, coronal, and sagittal reconstructions. For the semi-quantitative score, a higher number indicated a higher ranking and involvement (e.g., a score of >7 indicates all scores from 8 to 25).
AI-powered analysis of lung involvement was performed at a dedicated workstation using CT pneumonia analysis v.2.0. (Siemens Healthineers, Forchheim, Germany). The algorithm uses non-contrast CT data to automatically identify and 3D-segment both the lung parenchyma and abnormal areas of ground-glass opacities (GGO) and consolidation (11). The software outputs a percentage of total lung involvement (both GGO and consolidation). This percentage was translated to the same semi-quantitative scoring system used for visual analysis. Segmentation errors were manually corrected by trained readers. In cases of bacterial pneumonia coinfection, the total area of GGO and consolidation was included.
The following outcome measures were thus evaluated by the readers: Semi-quantitative CT score (ranging from 0 to 25): CT scores from visual analysis, AI without manual correction (AI-auto), and AI with manual correction (AI-manual). Percentage of lung involvement (ranging from 0 to 100%): percentage scores of lung involvement (combined GGO and consolidation) from visual analysis, AI-auto, and AI-manual.
Both metrics of lung involvement are reported, because there is precedence for both approaches to assess the extent of lung involvement in COVID-19 (6,7). The truly quantitative approach with percentages of lung involvement is likely more accurate and will increasingly become available through the rapid development of multiple AI-based software packages for COVID-19. However, we opted to include the semi-quantitative approach as it has been used in early COVID-19 studies with good prognostic value and may be only approach available to some institutions for the foreseeable future (6). Intra- and interreader reproducibility were assessed for both visual analysis and AI-based analysis with manual correction. Six radiologists (C.G., A.Da., L.J., Y.D.B., A.De., and R.S.) independently scored the lung involvement on a subset of the patient population. Two cardiothoracic radiologists (C.G. and R.S. with 8 and 7 years of cardiothoracic imaging experience, respectively) assessed reproducibility. One reader (R.S.) reread a random sample of 50 scans after 1 week to assess intrareader reproducibility. Fifty randomly selected cases first read by another reader were reread by C.G. after 1 week to assess interreader reproducibility.
Statistical analysis
All statistical analysis was performed by using R v.4.0.0. (Foundation for statistical computing, Vienna, Austria). Data were tested for normal distribution with the Shapiro-Wilk test. Summary statistics for all continuous variables are reported as means ± standard deviations (SD) or as medians with interquartile ranges (IQR), as appropriate. Summary statistics for categorical variables are reported as absolute numbers and percentages. For continuous variables, a threshold that balances sensitivity and specificity, as identified by the Youden index, was calculated from receiver-operating characteristic (ROC) curve analysis (12). It is important, however, to realize this is just one approach to cutting the ROC curve and future, larger studies are needed to determine optimal thresholds considering other predictors of adverse outcome. We assessed discrimination with the 5-fold cross-validated area under the ROC (AUROC), reported with corresponding 95% confidence intervals (13). Survival curves were estimated using the Kaplan-Meier method and compared by using the log-rank test. Cox-model results were shown by hazard ratio (HR) estimates with 95% confidence intervals (CI). We checked the proportional-hazards assumption for each variable by testing Schoenfeld residuals and using the double-log plot method. In case of violation of the proportional-hazards assumption, the restricted mean survival time (RMST) was calculated as a measure of average survival from time 0 to a specified time point and estimated as the area under the survival curve (AUC) up to that point (14). Intra- and interreader agreement were assessed by using intraclass correlation coefficients (ICCs), Bland-Altman analysis with 95% limits of agreement (LOAs), Spearman rank correlation r, and coefficient of variation (CV) (15). A two-way model with measures of agreement was used to calculate the ICC values. ICCs of >0.75 and of 0.40–0.75 indicate strong and average agreement, respectively. A difference between ICCs was considered to be statistically significant when there was no overlap between their respective 95% CI limits. There were no missing data elements for the analyses. P<0.05 was considered to indicate a statistically significant difference. Sample size estimates were derived from the interreader SD of lung involvement as described by Machin and Altman (16,17). The sample size required by chest CT to show a change with 90% power and an α error of 0.05 was calculated by using the following formula:
 |
,
where α is the significance level, P is the study power, f is the value of the factor for different values of α and P (f = 10.5 for a P of 90% and an α error of 0.05), σ is the interstudy standard deviation, δ is the desired percentage difference to be detected, and n is the sample size needed (18). Chest CT reproducibility and sample size were calculated for both a visual and an AI-assisted analysis, as defined above.
Results
Patient demographics, CT findings and dose parameters, and outcome data are summarized in Table 1. The mean age for all patients was 67 years ± 17 years (SD) with fever, cough, and dyspnea as the most frequent clinical symptoms at presentation. Median time from symptom onset and ER presentation with RT-PCR and chest CT was 7 days (IQR: 4-10 days). Median time between CT scan acquisition and report was 20 minutes (IQR: 12-42 minutes). Median time for automated AI analysis was 9 minutes (IQR: 8-9 minutes), which increased to 12 minutes (IQR: 8-13 minutes) with manual correction. Manual correction was required in 154 patients (65.6%). However, manual correction changed the percentage of lung involvement with more than 1% in only 33 patients (13.2%), when compared to the automated AI analysis (Figure 3F).
Table 1:
Patient Characteristics, CT findings and Radiation Dose Parameters

Figure 3:

Bland-Altman plots show reproducibility between visual analysis, automated AI-assisted analysis, and AI-assisted analysis with manual correction. No significant bias was observed with narrower limits of agreement for AI-assisted analysis without and with manual correction.
CT radiation dose
Mean DLP for all patients was 43.2±24.9 mGy.cm, resulting in an effective radiation dose of 0.60±0.35 mSv (Table 1).
Outcome prediction
Adverse outcome occurred in 39 patients (15.6%) with 28 ICU admissions and 11 deaths. Five patients (17.9%) died in the ICU (6 other deaths occurred in frail older patients who were not transferred to the ICU) (19). Median time of ICU admission was 18 days (IQR:14-25 days). AUROC analyses identified the following values as Youden index based cutoffs for predicting the endpoint: a CT score of ≥7 (AUROC: 0.760, 95% CI: 0.680-0.841, P-value<0.001) and a lung involvement percentage of ≥12.0% (AUC: 0.774, 95% CI 0.693-0.854, P-value<0.001) for visual analysis, a CT score of ≥8 (AUC: 0.888, 95% CI 0.820-0.956, P-value<0.001) and a lung involvement percentage of ≥19.8% (AUC: 0.878, 95% CI 0.823-0.933, P-value<0.001) for automated AI analysis, and a CT score of ≥8 (AUC: 0.903, 95% CI: 0.836-0.969, P-value<0.001) and a lung involvement percentage of ≥20.5% (AUC: 0.880, 95% CI: 0.823-0.937, P-value<0.001) for AI analysis with manual correction (Figure 1). AUROC values from automated AI analysis and AI analysis with manual correction were significantly higher than those from visual analysis for both semi-quantitative CT scores and percentages of lung involvement (all P<0.001). Kaplan-Meier curve analysis using the identified cutoffs showed that these values could be used to predict patient outcome (P<0.001 by log rank test for all analyses) (Figure 2). Visually, it was clear that most adverse events occur within the first week after chest CT, which was confirmed by analysis of Schoenfeld residuals with violation of the proportional hazards assumption (20). The restricted mean survival time (RMST) was estimated at 1 week, and the difference and ratio of RMST were estimated by bootstrap simulation (Table 2). For example, for AI analysis with manual correction a percentage of lung involvement of more than 20.5% resulted in an RMST difference of -2.5 days (95% CI: -3.2;-1.7 days) and a RMST ratio of 0.640 (95% CI: 0.539-0.760), which significantly favored the group with less lung involvement (both P<0.001). Additional Kaplan-Meier curves with groups based on quartiles of lung involvement are presented in Figure E1.
Figure 1:

Cross-validated Receiver-operating characteristic (ROC) curve analysis for prediction of adverse outcome based on semi-quantitative CT score (A-C) or quantitative percentage of lung involvement (D-F). AI-assisted analysis without and with manual correction outperformed visual analysis for both types of assessment (B/C vs A and E/F vs D).
Figure 2:

Kaplan-Meier curves showing the time to adverse outcome according to the cutoffs of semi-quantitative CT score (A-C) and quantitative percentage of lung involvement (D-F). AI-assisted analysis improved outcome prediction with clear divergence of curves.
Table 2:
Restricted mean survival time (RMST) difference, RMST ratio, and restricted mean time lost (RMTL) ratio for the different types of analysis. Arm 1 = semi-quantitative CT score or percentage of lung involvement higher than optimal cutoff. Arm 0 = semi-quantitative CT score or percentage of lung involvement lower than optimal cutoff.

Reader reproducibility
Intrareader agreement was high for both visual and AI-assisted analysis with manual correction (Table 3). However, AI-assisted analysis resulted in significantly higher ICC values with lower CV for semi-quantitative CT scores (ICC: 0.986 vs 0.935, CV: 11.4% vs 24.9%) and quantitative percentage of lung involvement (ICC: 0.997 vs 0.958, CV: 9.7% vs 25.3%). No significant intrareader bias was observed with Bland-Altman analysis for both types of analysis (Online appendix, Figure E2).
Table 3:
Intrareader and interreader reproducibility for visual and AI-assisted analysis of lung involvement.

Interreader agreement was also high for both visual and AI-assisted analysis with manual correction (Table 3). However, AI-assisted analysis resulted in significantly higher ICC values with lower CV for semi-quantitative CT scores (ICC: 0.960 vs 0.885, CV: 16.6% vs 25.6%) and quantitative percentage of lung involvement (ICC: 0.986 vs 0.925, CV: 17.2% vs 34.7%). No significant intrareader bias was observed with Bland-Altman analysis for both types of analysis (Online appendix, Figure E3).
Visual analysis vs AI-assisted analysis reproducibility
For semi-quantitative CT scores, visual analysis demonstrated average agreement with AI-assisted analysis without and with manual correction (ICC: 0.670 and 0.682, respectively), whereas the agreement between both AI-assisted analyses was excellent (ICC: 0.990). Overall, no significant bias was observed with Bland-Altman analysis along the different types of CT analysis (Table 4, Figure 3). However, in patients with more extensive lung involvement, there was a tendency for visual analysis to yield higher semi-quantitative CT score when compared to AI-assisted analysis (Figure 3A-3B).
Table 4:
Reproducibility between visual analysis, automated AI-assisted analysis, and AI-assisted analysis with manual correction.

For quantitative percentage of lung involvement, visual analysis demonstrated excellent agreement with AI-assisted analysis without and with manual correction (ICC: 0.873 and 0.871, respectively). Agreement between both AI-assisted analyses, however, was even better (ICC: 0.997). No significant bias was observed with Bland-Altman analysis along the different types of CT analysis (Table 4, Figure 3). Example analyses are shown in Figures 4 and 5.
Figure 4:

Example images from a 48-year-old female patient with RT-PCR confirmed COVID-19. CT scan was obtained 14 days after the start of symptom onset at ER presentation and show bilateral subpleural areas of consolidation in the lower lobes consistent with limited late-stage COVID-19 (arrows in A,B,C). AI-assisted analysis semi-quantitative CT score of 2/25 and quantitative lung involvement of 0.29%. No manual correction was required. Visual assessment: semi-quantitative CT score of 2/25 and quantitative lung involvement of 1%. 3D reconstruction highlights the areas of consolidation in the lower lobes (D). Window center, -600 HU; window width 1600 HU; slice thickness, 1 mm; and increment, 0.7 mm for all images.
Figure 5:

Example images from a 68-year-old female patient with RT-PCR confirmed COVID-19. CT scan was obtained 7 days after the start of symptom onset at ER presentation and show bilateral extensive subpleural areas of ground-glass opacities and consolidation consistent with extensive COVID-19. Automated AI-assisted analysis (A,B) failed to detect small areas of ground-glass opacities in the left upper lobe and included part of the thoracic wall into the area of consolidation in the right upper lobe (arrows in A and B) (semiquantitative CT score 8/25, percentage of lung involvement 23.60%). Reader manual correction added these small areas of ground-glass opacities and corrected the segmentation of the thoracic wall (arrows in C and D) (semiquantitative CT score 9/25, percentage of lung involvement 25.24%). Patient was admitted to the ICU 1 day later. Window center, -600 HU; window width 1600 HU; slice thickness, 1 mm; and increment, 0.7 mm for all images.
Sample size estimation for clinical trials
On the basis of the interreader variability of chest CT, we estimated sample sizes needed to detect significant decreases in lung involvement during a clinical trial (Figure 6). For example, a clinical trial intended to show a change of 5% in lung involvement over time (i.e., a change from 20% to 15% in lung involvement) with a power of 90% would require 250 patients in each group for an AI-assisted analysis, whereas 1014 patients would be required in each group for a visual analysis.
Figure 6:
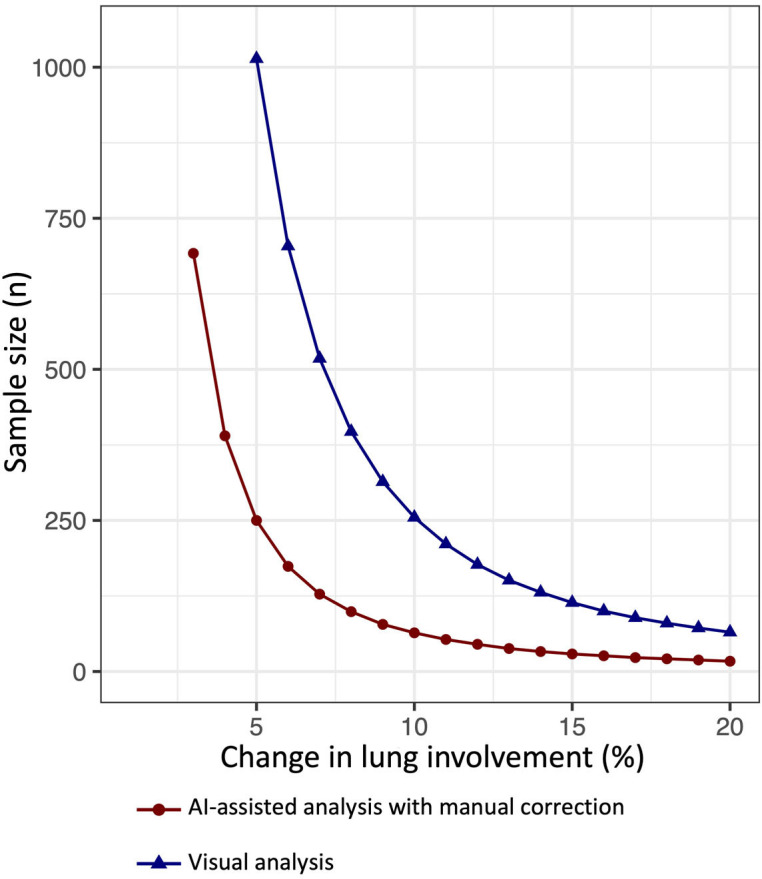
Graph shows the estimated sample size required in each group to detect a change in percentage of lung involvement with 90% power and 0.05 α error. The x-axis represents the desired detectable change in lung involvement and the y-axis the corresponding sample size needed for visual analysis (blue) and AI-assisted analysis with manual correction (red).
Discussion
The extent of lung involvement on chest CT in COVID-19 patients has important prognostic value and is associated with short-term clinical deterioration. Improved risk stratification of COVID-19 patients is crucial for cost-effective patient management by prompting safe hospital discharge of low-risk patients and prolonged in-hospital and follow-up surveillance of high-risk patients. The role of chest CT as a potential tool for COVID-19 diagnosis has been extensively studied with conflicting recommendations, ranging from using CT as a first-line screening modality to warnings against its overuse and a false sense of security (21,22). Our results suggest that chest CT may be viewed as a risk stratification tool rather than a diagnostic tool per se. However, it is important to realize that chest CT should not be viewed as the sole prognosticator in COVID-19 subjects as multiple clinical and biochemical factors have been previously shown to be associated with adverse outcome (4,8,23,24).
Importantly, we found that an AI-assisted approach improved patient risk stratification and reduced variability over a conventional visual approach. These results are in line with previous studies showing superior performance of an AI-driven approach for several medical image segmentation applications, ranging from organ segmentation to segmentation of the vascular network of the human eye (25,26). This success can be attributed to its capability to learn representative and unique image features from large datasets, rather than relying on individually estimated features based on the subjective experience of human experts. Colombi et al. (7) previously found similar prognostic performance of visual and software-based quantification of lung involvement on chest CT. The superior performance of an AI-assisted approach in our study could be attributed to the recent developments within these software packages, whereas their software merely depended on a density-based approach. A density-based approach works well in normal lungs. Conversely, in lungs with severe COVID-19 involvement average density is increased and thus thresholding without further texture analysis leads to errors (27).
Another important advantage of an AI-assisted approach is a reduction in reader variability. Understanding variability in measurements of lung involvement on chest CT is crucial to interpret changes in lung involvement over time and accurately predict patient outcome. Our results suggest that the reproducibility of AI-assisted chest CT analysis is sufficient to accurately monitor treatment response in clinical trials with reasonable sample sizes. However, using only a visual analysis resulted in a substantially larger sample sizes (by a factor of 4) and therefore is not recommended for future clinical trials. Interestingly, these excellent reproducibility results were obtained using low-dose scans with a mean effective radiation dose of 0.60 mSv ± 0.35 mSv (SD), suggesting high performance of the AI algorithm even in the presence of substantial image noise. Using a low-dose approach for COVID-19 patients may results in important radiation dose reductions on a population level as CT scans are extensively being used in the diagnostic and prognostic work-up of possible COVID-19 patients. Furthermore, a low-dose approach is even more critical in clinical studies where CT is used for follow-up or therapy response assessment as these patients would receive multiple CT scans. However, it is important to note that during a public health crisis radiation dose consideration should not be the determining factor in deciding imaging strategies.
This study has several limitations. First, this study represents a single-center experience with one type of AI software. The software we used is freely available through the postprocessing software by one of the major CT manufacturers worldwide (Syngo.Via, Siemens Healthineers) and thus has the potential for broad clinical use. However, these results are only valid for the current version of the AI software (v.2.0.) and further research evaluating and comparing different AI-based software packages is warranted. Second, true interstudy variability was not assessed in our study as this requires a second CT scan within a very short time frame (likely within hours of the first scan due to the virulent nature of COVID-19). Previous studies, however, have suggested very low interstudy variability in lung volume and nodule assessment on chest CT exams (28,29). Therefore, interstudy variability can be approached by using the interreader variability. Third, overall risk stratification of COVID-19 patients should not solely rely on chest CT findings. Integration of clinical, biochemical, and radiological findings is essential for an optimal risk prognostication. Larger studies are needed to allow for a more comprehensive, multivariable risk stratification of COVID-19 patients. Finally, the use of advanced deep-learning based iterative reconstruction algorithms and state-of-the-art hardware may result in better image quality at similar radiation doses and could theoretically further improve image segmentation (30).
In conclusion, AI-assisted analysis of lung involvement on submillisievert low-dose chest CT outperformed conventional visual analysis in predicting outcome in COVID-19 patients while reducing CT variability. Lung involvement on chest CT could be used as a reliable metric in clinical trials.
Footnotes
Conflicts of interest: none declared
References
- 1.Corman VM, Muth D, Niemeyer D, Drosten C. Hosts and sources of endemic human coronaviruses. Adv Virus Res. Elsevier; 2018. p. 163–188. [DOI] [PMC free article] [PubMed] [Google Scholar]
- 2.Huang C, Wang Y, Li X, et al. Clinical features of patients infected with 2019 novel coronavirus in Wuhan, China. Lancet. Elsevier; 2020;395(10223):497–506. [DOI] [PMC free article] [PubMed] [Google Scholar]
- 3.World Health Organization . Coronavirus disease (COVID-19) outbreak. URL https://www.who.int/emergencies/diseases/novel-coronavirus-2019. 2020;
- 4.Grasselli G, Zangrillo A, Zanella A, et al. Baseline Characteristics and Outcomes of 1591 Patients Infected With SARS-CoV-2 Admitted to ICUs of the Lombardy Region, Italy. JAMA. . [DOI] [PMC free article] [PubMed]
- 5.Dangis A, Gieraerts C, Bruecker Y De, et al. Accuracy and reproducibility of low-dose submillisievert chest CT for the diagnosis of COVID-19. Radiol Cardiothorac Imaging. Radiological Society of North America; 2020;2(2):e200196. [DOI] [PMC free article] [PubMed] [Google Scholar]
- 6.Li K, Fang Y, Li W, et al. CT image visual quantitative evaluation and clinical classification of coronavirus disease (COVID-19). Eur Radiol. Springe r; 2020;1–10. [DOI] [PMC free article] [PubMed] [Google Scholar]
- 7.Colombi D, Bodini FC, Petrini M, et al. Well-aerated lung on admitting chest CT to predict adverse outcome in COVID-19 pneumonia. Radiology. Radiological Society of North America; 2020;201433. [DOI] [PMC free article] [PubMed] [Google Scholar]
- 8.Dangis A, De Brucker N, Heremans A, et al. Impact of gender on extent of lung injury in COVID-19. Clin Radiol. Elsevier; 2020;75(7):554. [DOI] [PMC free article] [PubMed] [Google Scholar]
- 9.de Koning HJ, van der Aalst CM, de Jong PA, et al. Reduced lung-cancer mortality with volume CT screening in a randomized trial. N Engl J Med. Mass Medical Soc; 2020;382(6):503–513. [DOI] [PubMed] [Google Scholar]
- 10.Valentin J. International Commission on Radiological Protection ., 2007. The 2007 recommendations of the International Commission on Radiological Protection. Ann ICRP. 103. [DOI] [PubMed] [Google Scholar]
- 11.Siemens Healthineers . https://www.siemens-healthineers.com/en-be/medical-imaging/digital-transformation-of-radiology. Accessed September 1st 2020.
- 12.Fluss R, Faraggi D, Reiser B. Estimation of the Youden Index and its associated cutoff point. Biometrical J. Wiley Online Library; 2005;47(4):458–472. [DOI] [PubMed] [Google Scholar]
- 13.LeDell E, Petersen M, van der Laan M, LeDell ME. Package ‘cvAUC.’ 2014. [Google Scholar]
- 14.Royston P, Parmar MKB. The use of restricted mean survival time to estimate the treatment effect in randomized clinical trials when the proportional hazards assumption is in doubt. Stat Med. Wiley Online Library; 2011;30(19):2409–2421. [DOI] [PubMed] [Google Scholar]
- 15.Bland JM, Altman D. Statistical methods for assessing agreement between two methods of clinical measurement. Lancet. Elsevier; 1986;327(8476):307–310. [PubMed] [Google Scholar]
- 16.Machin D, Campbell MJ, Tan SB, Tan SH. Sample sizes for clinical, laboratory and epidemiology studies. Wiley Online Library; 2018. [Google Scholar]
- 17.Altman DG. Practical statistics for medical research. CRC press; 1990. [Google Scholar]
- 18.Symons R, Morris JZ, Wu CO, et al. Coronary CT Angiography: Variability of CT Scanners and Readers in Measurement of Plaque Volume. Radiology. Radiological Society of North America; 2016;161670. 19. [DOI] [PMC free article] [PubMed] [Google Scholar]
- 19.De Smet R, Mellaerts B, Vandewinckele H, et al. Frailty and mortality in hospitalized older adults with COVID-19: retrospective observational study. J Am Med Dir Assoc. Elsevier; 2020; [DOI] [PMC free article] [PubMed] [Google Scholar]
- 20.Stensrud MJ, Hernán MA. Why Test for Proportional Hazards? Jama. American Medical Association; 2020;323(14):1401–1402. [DOI] [PubMed] [Google Scholar]
- 21.Ai T, Yang Z, Hou H, et al. Correlation of chest CT and RT-PCR testing in coronavirus disease 2019 (COVID-19) in China: a report of 1014 cases. Radiology. Radiological Society of North America; 2020;200642. [DOI] [PMC free article] [PubMed] [Google Scholar]
- 22.Hope MD, Raptis CA, Shah A, Hammer MM, Henry TS. A role for CT in COVID-19? What data really tell us so far. Lancet. Elsevier; 2020;395(10231):1189–1190. [DOI] [PMC free article] [PubMed] [Google Scholar]
- 23.Ruan Q, Yang K, Wang W, Jiang L, Song J. Clinical predictors of mortality due to COVID-19 based on an analysis of data of 150 patients from Wuhan, China. Intensive Care Med. Springer; 2020;1–3. [DOI] [PMC free article] [PubMed] [Google Scholar]
- 24.Richardson S, Hirsch JS, Narasimhan M, et al. Presenting characteristics, comorbidities, and outcomes among 5700 patients hospitalized with COVID-19 in the New York City area. Jama. 2020; [DOI] [PMC free article] [PubMed] [Google Scholar]
- 25.Moeskops P, Viergever MA, Mendrik AM, De Vries LS, Benders MJNL, Išgum I. Automatic segmentation of MR brain images with a convolutional neural network. IEEE Trans Med Imaging. IEEE; 2016;35(5):1252–1261. [DOI] [PubMed] [Google Scholar]
- 26.Liskowski P, Krawiec K. Segmenting retinal blood vessels with deep neural networks. IEEE Trans Med Imaging. IEEE; 2016;35(11):2369–2380. [DOI] [PubMed] [Google Scholar]
- 27.Wang J, Li F, Li Q. Automated segmentation of lungs with severe interstitial lung disease in CT. Med Phys. Wiley Online Library; 2009;36(10):4592–4599. [DOI] [PMC free article] [PubMed] [Google Scholar]
- 28.Kaza E, Dunlop A, Panek R, et al. Lung volume reproducibility under ABC control and self-sustained breath-holding. J Appl Clin Med Phys. Wiley Online Library; 2017;18(2):154–162. [DOI] [PMC free article] [PubMed] [Google Scholar]
- 29.Zhao B, James LP, Moskowitz CS, et al. Evaluating variability in tumor measurements from same-day repeat CT scans of patients with non–small cell lung cancer. Radiology. Radiological Society of North America, Inc.; 2009;252(1):263–272. [DOI] [PMC free article] [PubMed] [Google Scholar]
- 30.Symons R, Pourmorteza A, Sandfort V, et al. Feasibility of Dose-reduced Chest CT with Photon-counting Detectors: Initial Results in Humans. Radiology. Radiological Society of North America; 2017;162587. [DOI] [PMC free article] [PubMed] [Google Scholar]