

Abstract

Comprehensive profiling of humoral antibody response to severe acute respiratory syndrome (SARS) coronavirus-2 (CoV-2) proteins is essential in understanding the host immunity and in developing diagnostic tests and vaccines. To address this concern, we developed a SARS-CoV-2 proteome peptide microarray to analyze antibody interactions at the amino acid resolution. With the array, we demonstrate the feasibility of employing SARS-CoV-1 antibodies to detect the SARS-CoV-2 nucleocapsid phosphoprotein. The first landscape of B-cell epitopes for SARS-CoV-2 IgM and IgG antibodies in the serum of 10 coronavirus disease of 2019 (COVID-19) patients with early infection is also constructed. With array data and structural analysis, a peptide epitope for neutralizing antibodies within the SARS-CoV-2 spike receptor-binding domain’s interaction interface with the angiotensin-converting enzyme 2 receptor was predicted. All the results demonstrate the utility of our microarray as a platform to determine the changes of antibody responses in COVID-19 patients and animal models as well as to identify potential targets for diagnosis and treatment.
Short abstract
A SARS-CoV-2 proteome peptide microarray was developed to perform the proteome-wide analysis of serum antibody’s epitopes at amino acid resolution.
Introduction
Severe acute respiratory syndrome coronavirus 2 (SARS-CoV-2) has since proven to be highly contagious, with the median incubation period of 4 d.1−3 Infection of SARS-CoV-2, called COVID-19, results in a range of symptoms, ranging from a mild cough to pneumonia. It is estimated that 17.9% of patients might be asymptomatic,4 which may lead to two or even three transmissions per infected individual.3,5,6 Particular subsets of the population are extremely vulnerable to COVID-19, including the elderly, those with underlying conditions, and immunocompromised individuals. On the evening of January 30, 2020, the World Health Organization listed the novel coronavirus outbreak as a public health emergency of international concern.7 The novel coronavirus had spread worldwide by August 11, 2020,8 with 20 014 574 confirmed cases and 734 755 deaths in 188 countries.9 The high transmission rates of SARS-CoV-2, limited diagnostic tests, and no antiviral treatment options pose huge challenges for the control and treatment of SARS-CoV-2-infected patients.10,11
SARS-CoV-2 is 82% similar to the original SARS virus attributed to the outbreak in 2003.12 Generally, a SARS-CoV-2 virus has a polyprotein (the open reading frame 1a and 1b, Orf1ab), four structural proteins (envelope, E; membrane, M; nucleocapsid phosphoprotein, N; spike, S), and five accessary proteins (Orf3a, Orf6, Orf7a, Orf8, Orf10).13 The largest polyprotein encoded by Orf1ab can be proteolytically cleaved into 16 putative nonstructural proteins (nsps), which might be involved in viral RNA replication and transcription.12 The E and M proteins are important in the viral assembly of a coronavirus. The N protein forms complexes with genomic RNA and is important to enhance the efficiency of viral transcription and assembly.14 The S protein is on the surface of the viral particle, enabling the infection of host cells by binding to the host cell receptor, angiotensin-converting enzyme 2 (ACE2), via the S-protein’s receptor binding domain (RBD) within the S-protein’s subunit 1.15,16 The accessory proteins may have functions in signaling inhibition, apoptosis induction, and cell cycle arrest.13
The identification of B-cell and T-cell epitopes for SARS-CoV-2 proteins is essential in developing effective diagnostic tests and vaccines, especially for structural N and S proteins. These epitopes have thus far been predicted either by bioinformatics or measured using T-cell based assays.17−20 However, proteome-wide analysis of the humoral antibody response to SARS-CoV-2 proteins using an immuno-proteomics platform has not been performed to date. Here, we use a peptide-based SARS-CoV-2 peptide microarray to analyze antibody interactions in high throughput at the amino acid resolution.
Results
Development of a SARS-CoV-2 Proteome Microarray
To produce the SARS-CoV-2 proteome microarray (Figure 1a), we first extracted the reference sequences of 10 proteins encoded by the SARS-CoV-2 coronavirus genome from the National Center for Biotechnology Information (NCBI) database (Accession No. MN908947.3). Using these reference sequences, we prepared a peptide library containing 966 peptides representing SARS-CoV-2 proteins, in which each peptide was 15 amino acids long with a 5 amino acid overlap. All peptides were labeled with a C-terminal biotin group and printed onto a three-dimensional (3D) modified microscope slide using biotin–streptavidin chemistry,21 such that the peptides were immobilized on the slide via their C-terminus. Full-length SARS-CoV-2 N protein, full-length E, and five S truncated proteins were also printed (Supporting Information Table 1).
Figure 1.
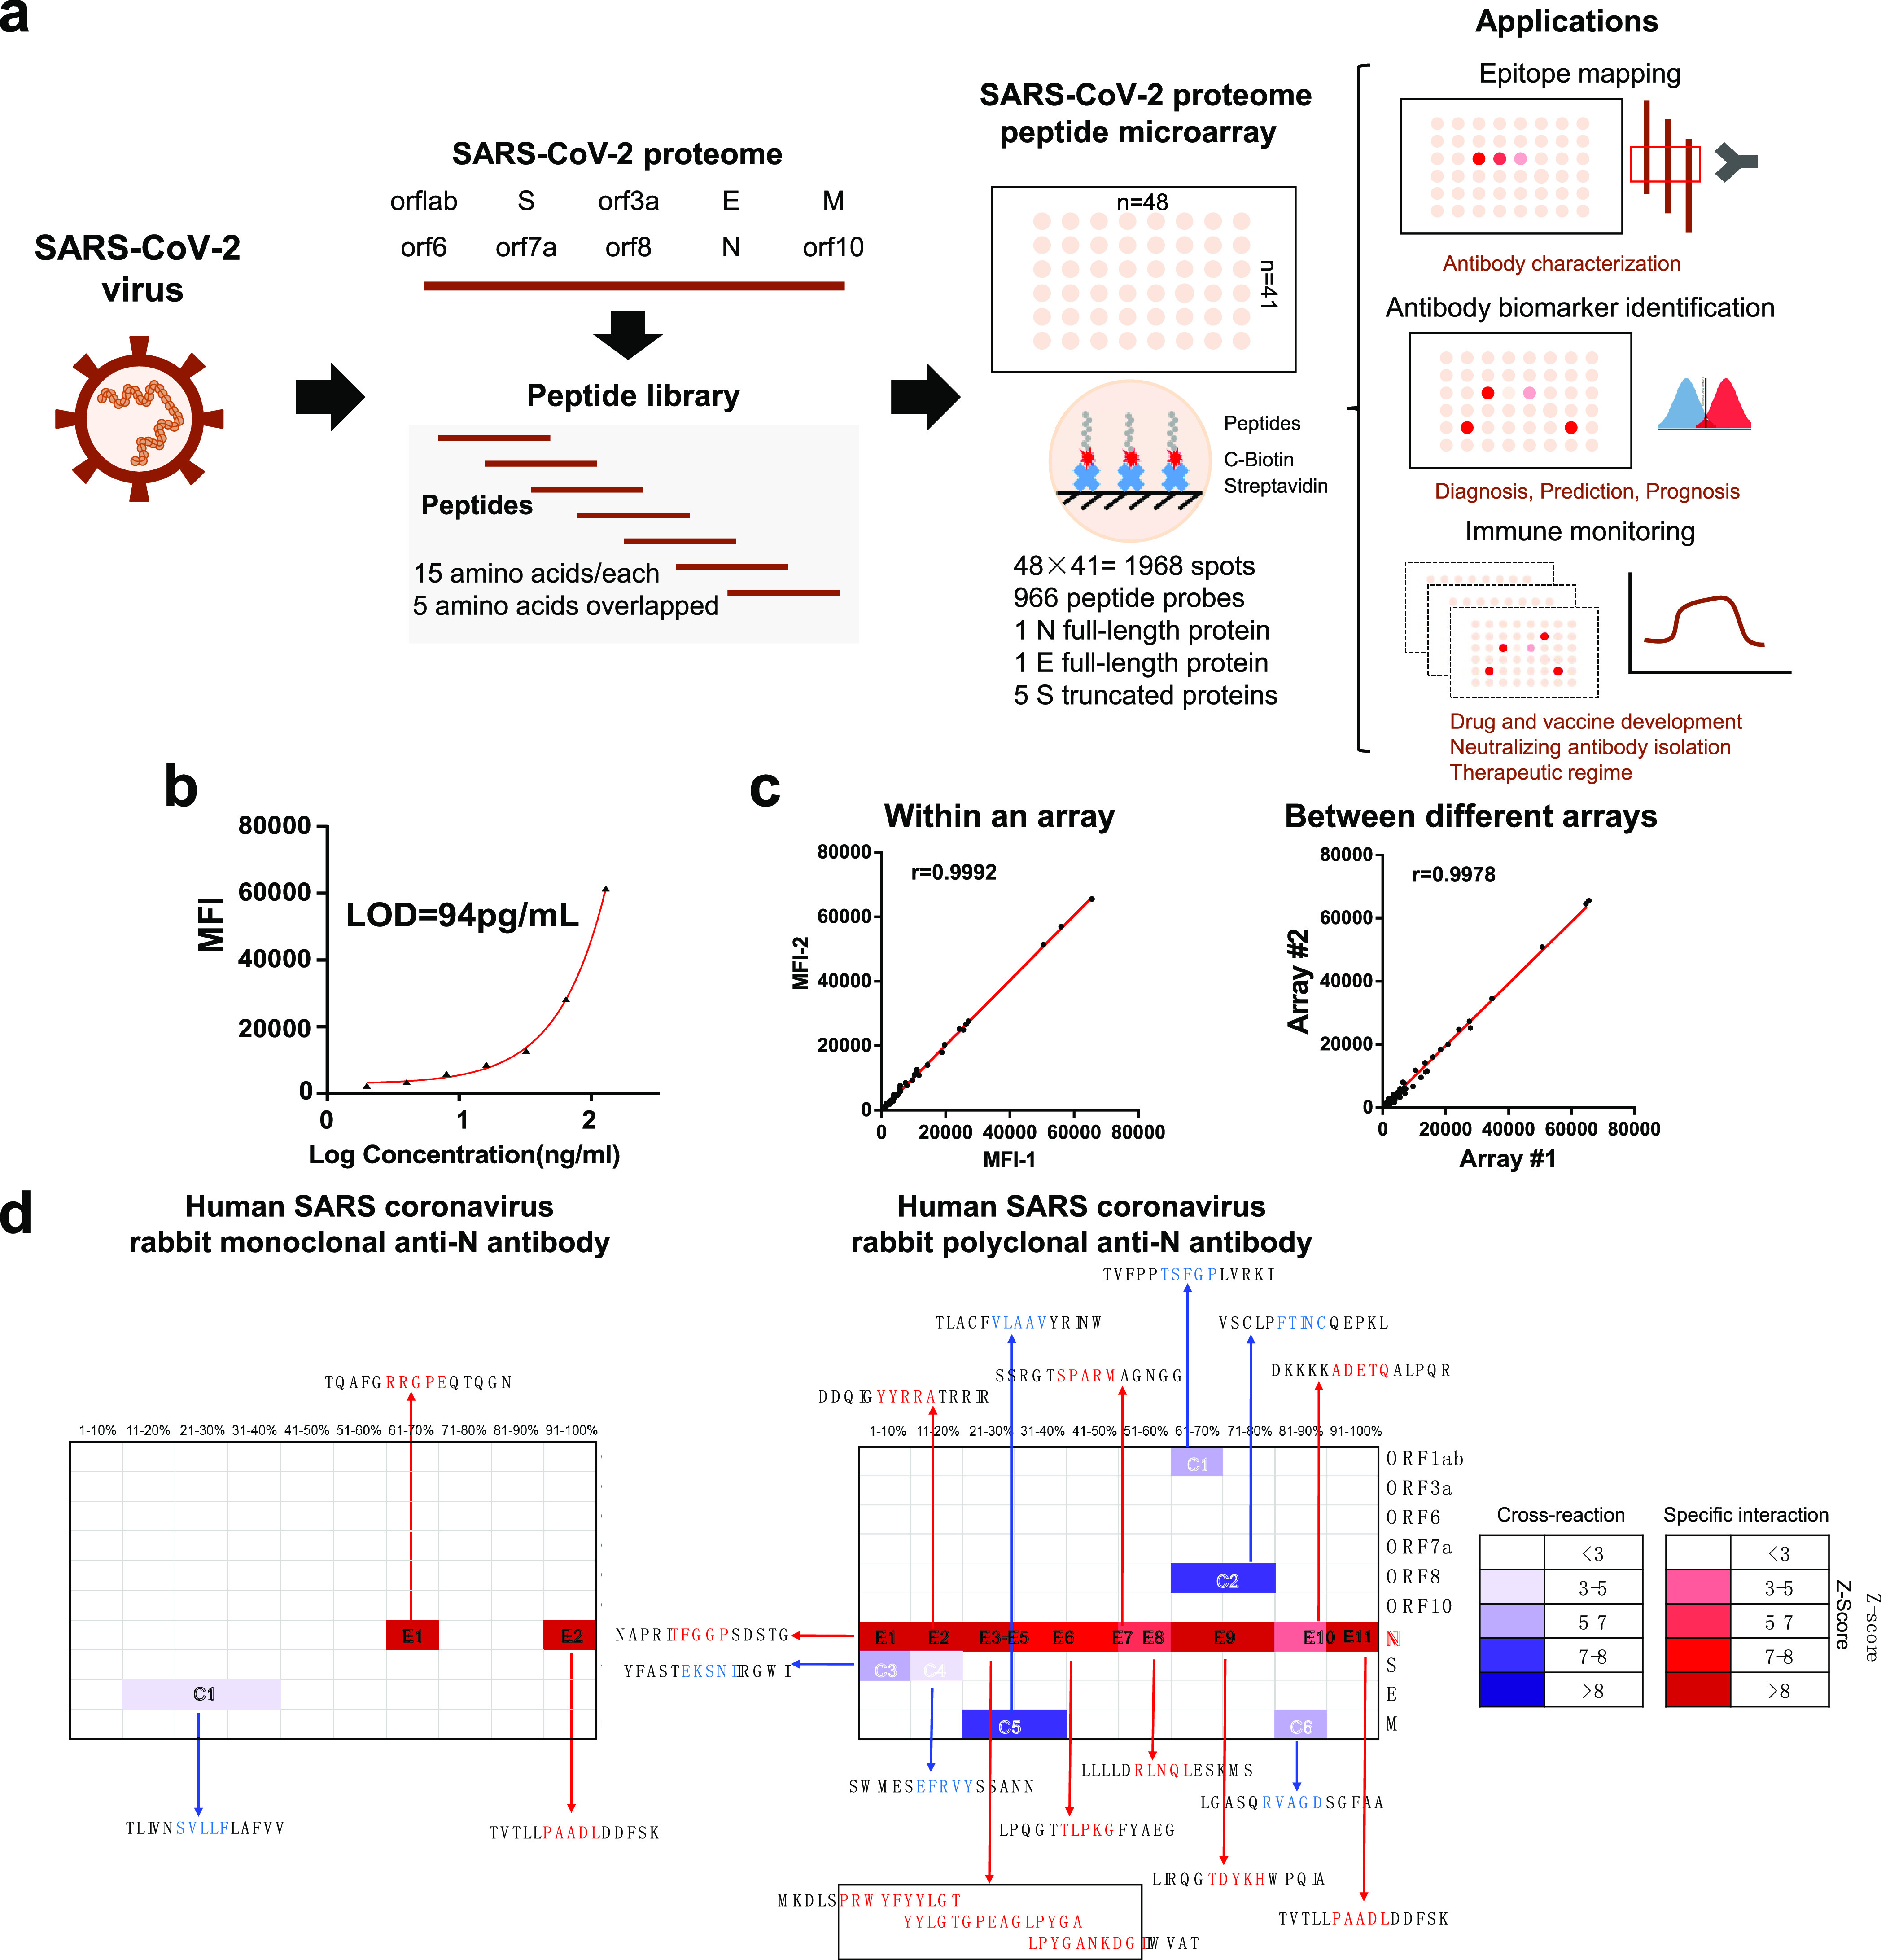
SARS-CoV-2 proteome microarray fabrication and application in antibody characterization. (a) The schematic illustration of SARS-CoV-2 proteome microarray fabrication and biomedical applications. (b) Dynamic range of serum antibody detection using SARS-CoV-2 proteome microarray. The LOD was calculated using the signal of the buffer control plus two standard deviations. (c) Reproducibility of serum antibody detection using the SARS-CoV-2 proteome microarray. (d) Epitope binding of the anti-SARS-CoV-1 N protein antibody using the SARS-CoV-2 proteome microarray. The specific antibody binding to the target epitope is selected with a Z-score higher than 3 as a threshold. The false-colored rainbow color from blue to red corresponds to the Z-score from low to high, respectively.
Using serum spiked with anti-SARS antibodies, we next determined the optimal lengths of time to block the array, incubate with serum samples, and incubate with the detection antibody. Optimal signal-to-noise ratios were obtained with blocking for 1 min, serum incubation for 30 min, and detection antibody incubation for 30 min (Supporting Information, Figures 1–3). Serum screening using the SARS-CoV-2 proteome microarray can be performed in 1.5 h while keeping a good dynamic range (∼2 orders of magnitude) and lowest limit of detection (LOD) (94 pg/mL) (Figure 1b). This represents a significant decrease in time compared to the standard ∼18 h using protein microarrays.22 The intra- and inter-array R correlations were 0.9992 and 0.9978, respectively, demonstrating that the SARS-CoV-2 proteome microarray has a high reproducibility (Figure 1c).
Epitope Mapping of SARS-COV-1 Antibodies for SARS-CoV-2 N Protein Detection
Since the SARS-CoV-1 and SARS-CoV-2 genomes are highly similar, we tested rabbit monoclonal and polyclonal anti-SARS-CoV-1 N protein antibodies on the SARS-CoV-2 proteome microarray (Figure 1d and Supporting Information, Figure 4). The monoclonal Ab displayed high specificity to two epitopes (RRGPE and PAADL) on the SARS-CoV-2 N protein with a Z-score higher than 3.23 Minor cross-reactivity was observed on the epitope (SVLLF) of the E protein. The polyclonal antibody bound to 11 epitopes (E1-E11) on the N protein with cross reactivity to six epitopes on M, S, Orf8, and Orf1ab proteins. The cross-reactive epitopes on M, S, Orf8, and Orf1ab proteins are different than those present in the N-protein (Figure 1d), and the results were validated using full-length N- and S-proteins (Supporting Information, Figure 5).
Landscape of B-Cell Epitopes of IgM and IgG Antibodies in the Serum of COVID-19 Patients
Using the SARS-CoV-2 proteome microarray, we screened IgM and IgG antibodies in the serum of 10 COVID-19 patients who were in the early stage of infection (days of symptoms onset, 3.0 ± 5.92) (Supporting Information, Table S2) to construct a landscape of humoral responses to the SARS-CoV-2 proteome (Figure 2). Sixty-one (61) IgG and IgM antibody epitopes were identified in seven SARS-CoV-2 proteins (M, N, S, Orf1ab, Orf3a, Orf7a, and Orf8) with a Z-score higher than 3 in at least one COVID-19 patient (Table 1).23 The Orf1ab has the maximal number of IgM and IgG epitopes (n = 32). These epitopes were distributed on the proteins of nsp1–4, nsp6, nsp8–10, and nsp12–16 (Figures 2 and 3). Additional binding epitopes were identified on S (n = 8), N (n = 8), M (n = 5), Orf3a (n = 4), Orf7a (n = 3), and Orf8 (n = 1) proteins (Figure 4 and Table 1). Notably, four immunodominant epitopes with antibodies in more than 80% of the COVID-19 patients were present in the N (residue 206–210, SPARM), S (residue 816–820, SFIED), and Orf3a (residue 136–140, KNPLL; residue 176–180, SPISE) proteins. However, antibodies to E, Orf6, and Orf10 were not detected (Figure 4).
Figure 2.

Landscape of humoral IgM antibody response to SARS-CoV-2 Orf1ab proteome. The x-axis represents the sequence of amino acids of SARS-CoV-2 nonstructural proteins (nsps) from the N-terminal to C-terminal. The y-axis represents the serum samples from COVID-19 patients. The false-colored rainbow color from blue to red corresponds to the signals of antibody binding from low to high, respectively.
Table 1. Epitopes Identified in the Serum of COVID-19 Patients using SARS-CoV-2 Proteome Microarrays.
| epitopea |
||||
|---|---|---|---|---|
| protein name | IgG | IgM | total number | |
| M | 16-LLEQW-20 | 6-GTITV-10 | 5 | |
| 106-TRSMW-110 | 176-LSYYK-180 | |||
| 196-YSRYR-200 | 196-YSRYR-200 | |||
| S | 26-PAYTN-30 | 816-SFIED-820 | 8 | |
| 186-FKNLR-190 | 886-WTFGA-890 | |||
| 356-KRISN-360 | 1046-GYHLM-1050 | |||
| 456-FRKSN-460 | ||||
| 806-LPDPSKPSKRSFIED-820 | ||||
| 1196-SLIDL-1200 | ||||
| N | 66-FPRGQ-70 | 206-SPARM-210 | 8 | |
| 96-GGDGK-100 | 386-QKKQQ-390 | |||
| 166-TLPKG-170 | ||||
| 206-SPARM-210 | ||||
| 226-RLNQL-230 | ||||
| 256-KKPRQ-260 | ||||
| 316-GMSRI-320 | ||||
| 366-TEPKK DKKKKADETQALPQRQKKQQTVTLPAADL-400 | ||||
| Orf1ab | nsp1 | 166-SSGVT-170 | 32 | |
| nsp2 | 306-VASPN-310 | 296-FMGRI-300 | ||
| 386-EYHNESGLKTILRKG-400 | 336-FVKAT-340 | |||
| 546-SIFSR-550 | ||||
| nsp3 | 1046-VEEAK-1050 | 1496-TPEEH-1500 | ||
| 1106-SGHNL-1110 | 1636-HTTDPSFLGRYMSAL-1650 | |||
| 1346-LKKCK-1350 | 2656-KLSHQ-2660 | |||
| 2186-TNSRI-2190 | ||||
| nsp4 | 3206-RYLAL-3210 | |||
| nsp6 | 3836-DAFKL-3840 | |||
| nsp8 | 4076-DYNTY-4080 | |||
| nsp9 | 4226-KYLYF-4230 | |||
| nsp10 | 4346-KGKYV-4350 | |||
| nsp12 | 4516-MADLV-4520 | 4616-QTTPG-4620 | ||
| 4676-DRYFK-4680 | ||||
| 4716-TSFGP-4720 | ||||
| 5136-EFYAY-5140 | ||||
| nsp13 | 5346-RPFLC-5350 | |||
| 5746-FNSVC-5750 | ||||
| 5836-ISPYN-5840 | ||||
| nsp14 | 6206-AVHEC-6210 | 5976-YRRLI-5980 | ||
| 6366-QLPFF-6370 | ||||
| nsp15 | 6716-ELEDF-6720 | 6536-VIWDY-6540 | ||
| nsp16 | 6926-ISDMY-6930 | |||
| Orf3a | 66-LKKRWQ-70 | 136-KNPLL-140 | 4 | |
| 136-KNPLL-140 | 176-TSPIS-180 | |||
| 176-TSPIS-180 | 216-STQLS-220 | |||
| 216-STQLS-220 | ||||
| Orf7a | 116-LKRKT-120 | 26-GTTVL-30 | 3 | |
| 66-ACPDG-70 | ||||
| 116-LKRKT-120 | ||||
| Orf8 | 36-PCPIHFYSKWYIRVGARKSA PLIEL-60 | 36-PCPIHFYSKWYIRVGARKSAPLIEL-60 | 1 | |
Bound by serological antibodies identified with a Z-score higher than 3 in at least one COVID-19 patient.
Figure 3.

Landscape of the humoral IgG antibody response to the SARS-CoV-2 Orf1ab proteome. The x-axis represents the sequence of amino acids of the SARS-CoV-2 nonstructural proteins (nsps) from the N-terminal to C-terminal. The y-axis represents the serum samples from the COVID-19 patients. The false-colored rainbow color from blue to red corresponds to the signals of antibody binding from low to high, respectively.
Figure 4.

Landscape of the humoral antibody response to SARS-CoV-2 proteins other than Orf1ab. (a, b) The distribution of human IgM and IgG antibodies to SARS-CoV-2 individual proteins (S, E, M, N, Orf3a, Orf6, Orf7a, Orf8, and Orf10), respectively. The x-axis represents the sequence of amino acids of SARS-CoV-2 proteins from the N-terminal to C-terminal. The y-axis represents the serum samples from COVID-19 patients. The false-colored rainbow color from blue to red corresponds to the signals of antibody binding from low to high, respectively.
Furthermore, with overlapping peptides representing the full-length S protein, human IgM and human IgG antibodies were found to target three and six epitopes, respectively (Figure 4 and Table 1). Likewise for the N-protein, IgM antibodies targeted two epitopes, and IgG antibodies bound to eight epitopes (Figure 4 and Table 1). Structural analysis shows that all epitope peptides within the RNA binding domain loop of the N protein are easily accessible to antibodies (Figure 5a). Six epitopes were identified in the S protein, with three epitopes located at the surface and three epitopes located inside the protein (Figure 5b).
Figure 5.

Structural analysis of immunogenic epitopes in SARS-CoV-2 proteins. (a, b) The structural analysis of the nucleocapsid phosphoprotein RNA binding domain (PDB ID: 6VYO) and spike trimer protein (PDB ID: 6VXX). The epitope is labeled with yellow or red and indicated with a red arrow.
To help understand the translational potential of these peptide epitopes in COVID-19 diagnosis, we compared the expression of serum antibodies targeting these immunogenic epitopes in 10 COVID-19 patients with 10 control patients with nucleic acid testing negative (Supporting Information, Table 1). These control patients were suspected to have COVID-19 due to displaying similar symptoms but were confirmed to not have COVID-19 via polymerase chain reaction (PCR) testing. Statistical analyses identified one IgG epitope and five IgM epitopes (Mann–Whitney U-test, p < 0.01) (Figure 6a). One IgG and IgM epitope (816-SFIED-820) was located on the S protein, and one IgM epitope (206-SPARM-210) was located on the N protein; both of these proteins have been utilized as biomarkers in COVID-19 diagnosis. In addition, we identified three potential new epitope biomarkers from Orf3a (136-KNPLL-140 and 176-TSPIS-180) and nsp2 (296-FMGRI-300), which should be validated in a different cohort in the future (Table 1).
Figure 6.

Identification of potential peptide epitopes for SARS-CoV-2 detection and neutralization. (a) Box-plot analysis of antibody responses to immunogenic epitopes of SARS-COV-2 between COVID-19 patients and control patients. The significance was performed using the Mann–Whitney U-test (p-value < 0.01). (**), (***), and (****) represent a p-value less than 0.01, 0.001, and 0.0001, respectively. (b) Z-Score of serum antibody binding to the peptides within the spike protein’s RBD (amino acid residues 431–505). (c) Identification of antibody binding epitope (FRKSN) through sequence alignment. (d) Schematic illustration of the epitope on the RBD (FRKSN) recognized by potential neutralizing antibody in S-protein-ACE2 protein complex (PDB ID: 6M17).
Identification of an Epitope for Potential Neutralizing Antibodies in the Serum of COVID-19 Patients
There is a subdomain (residue 438–498) within the SARS-CoV-2 S-protein’s RBD that directly engages the ACE2 receptor, which makes it a potential target for developing neutralizing antibodies.24 However, the identification of neutralizing antibodies to competitively inhibit the binding of the SARS-CoV-2 virus to the host ACE2 receptor has proved challenging. In this work, we analyzed the immunological response to seven peptide sequences within the RBD subdomain (residue 438–498). Some IgM antibodies from patients “P45” and “P52” and IgG antibodies from patients “P10”, “P15”, “P33”, “P45”, and “P52” bind to the same epitope (residues 456–460, FRKSN) (Figure 6b,c). Structural analysis of the RBD-ACE2 complex demonstrates that the epitope located within the RBD loop engages with the ACE2 receptor25 (Figure 6d), thus supporting our data. Interestingly, this epitope (residues 456–460, FRKSN) was validated from a neutralizing antibody (B38) isolated from a convalescent patient.26 With a mouse model, the antibody blocked the binding of S-RBD to ACE2 and reduced virus titers in infected lung. The results provide evidence for the existence of a linear epitope for neutralizing antibodies in COVID-19 patients.
Discussion
Comprehensive profiling of the humoral antibody response to SARS-CoV-2 proteins is essential to understand the host immunity and identify the targets for COVID-19 diagnostics and treatment. In this work, we created an SARS-CoV-2 proteome microarray with good reproducibility and sensitivity (Figure 1a–c) that enables the high-throughput scanning of serum antibodies with SARS-CoV-2 proteins within 1.5 h.
By epitope mapping a set of monoclonal and polyclonal antibodies previously prepared to target SARS-CoV-1 proteins, we demonstrate that the antibodies can also be used to detect SARS-CoV-2 proteins (Figure 1d and Supporting Information Figure S5).27 SARS-CoV-1 antibodies could provide a quick alternative for developing an immunoassay to detect SARS-CoV-2 antigens.
Furthermore, we constructed the first landscape of B-cell epitopes of serum IgM and IgG antibodies, representing the comprehensive antibody response of COVID-19 patients to SARS-CoV-2 infection (Figures 2–4). In addition, we experimentally validated four B-cell epitopes previously predicted by bioinformatics,17,19 including two epitopes on the S protein (residues 806–820, LPDPSKPSKRSFIED; residues 456–460, FRKSN), one epitope on the N protein (residues 166–170, TLPKG), and one epitope on the M protein (residues 6–10, GTITV). IgG and IgM serum antibodies to one and five epitopes, respectively, were differentially expressed between 10 COVID-19 patients and 10 control patients with similar symptoms but negative for SARS-CoV-2. These epitopes should be validated in future studies (Figure 6a).
As part of the humoral response of the adaptive immune system, neutralizing antibodies is critical in viral clearance and saving the lives of COVID-19 patients.16,26 In this work, we identified a peptide epitope (residue 456–460, FRKSN) located at the interface of the SARS-CoV-2 S-RBD-ACE2 receptor interaction in the serum of five mild COVID-19 patients (P10, P15, P33, P45, P52) (Figure 6b). This epitope may serve as an antigen to stimulate neutralizing antibodies to the RBD-ACE2 interaction and increase CD4+/CD8+ T-cell responses.17,28
The number of days after symptom onset ranged from 1 to 20 d (P10, 20 d; P15, 1 d; P33, 3 d; P45, 5 d; P52, 2 d). The result is consistent with previous reports and indicates humoral antibodies in early SARS-CoV-2 infection may confer protection.29,30 The results might also explain why most infected people can recover without medical intervention.
There are several limitations to this study. First, the chemically synthesized peptides on the microarray do not have conformational epitopes. To address this issue, we included full-length N, S, and E proteins on our microarrays as a comparison. Second, the peptides do not have post-translational modifications, yet the SARS-CoV-2 S protein is glycosylated in vivo.15 However, specific glycosylation on peptides is challenging and thus was not considered in this study.31 Third, 80 000 genomic sequences of SARS-CoV-2 have been submitted to the Global Initiative on Sharing All Influenza Data (GISAID) database (https://www.gisaid.org/) since the preparation of our proteome microarray. These new strains could be included in the next version of the SARS-CoV-2 proteome microarrays. Fourth, we specifically studied the binding of IgG and IgM antibodies in serum to the peptide array; however, the influence of total immunoglobulins on binding was not explored. Total immunoglobulin profiling and the analysis of purified antibodies should be investigated in the future.
Conclusion
Altogether, we demonstrate that our SARS-CoV-2 peptide-based microarray can serve as a platform to determine the changes of humoral antibody response in COVID-19 patients and animal models. The array can also help identify potential targets for COVID-19 diagnosis and treatment. Scientists who wish to acquire these arrays to help fight this COVID-19 pandemic are encouraged to contact us.
Materials and Methods
Preparation of SARS-CoV-2 Proteome Microarray
All biotin-labeled peptides were obtained from China Peptides and Guoping Pharmaceutical Company. All SARS-CoV-2 E, N, and S proteins were obtained from Sino Biological, Inc. Among them, the SARS-CoV-2 E protein (catalogue No. DRA33) was expressed in Escherichia coli. The N protein (catalogue No. 40588-V08B) was expressed in insect cells. Three S proteins (S1+S2 ECD: catalogue No. 40589-V08B1, S2 ECD: catalogue No. 40590-V08B, S1 Subunit: catalogue No. 40591-V08B1) were expressed in insect cells, and two S proteins (S1 Subunit: catalogue No. 40591-V08H, RBD: catalogue No. 40592-V05H) were expressed in human HEK293 cells. These peptides and proteins were printed onto a 3D modified slide surface (Capital Biochip Corp) in parallel and in duplicate using an Arrayjet microarrayer. Phosphate buffered saline (PBS), bovine serum albumin (BSA, 100 μg/mL) (Sigma-Aldrich), and hemagglutinin (HA) peptides (500 μg/mL) (China Peptides) were used as negative controls. Biotinylated BSA (100 μg/mL), human IgG and IgM (10 μg/mL), and polio peptides (500 μg/mL) (China Peptides) were used as positive controls. The peptide microarrays were stored at −20 °C until ready to use. No unexpected or unusually high safety hazards were encountered in this work.
Characterization of Anti-SARS Antibody using SARS-CoV-2 Proteome Microarray
The peptide microarrays were assembled in an incubation tray and blocked with 5% (w/v) milk in 1X PBS with 0.2% (v/v) Tween-20 (PBST) for 1 min at room temperature. After it was washed with PBST three times, the array was incubated with a rabbit anti-SARS-CoV-1 N-protein monoclonal or a rabbit anti-SARS-CoV-1 N-protein polyclonal antibody (1 μg/mL) (catalogue Nos. 40143-R001 and 40143-T62, respectively; Sino Biological) for 30 min at room temperature. After it was washed again, the array was incubated with an Alexa Fluor 555 labeled goat antirabbit IgG (H+L), cross-adsorbed, secondary antibody (Jackson ImmunoResearch) for 30 min. The arrays were washed, dissembled from the tray, and dried with centrifugation for 2 min at 2000 rpm. The resulting array was scanned with a GenePix 4300A microarray scanner (Molecular Devices). The median fluorescent signal intensity of each spot was extracted using GenePix Pro7 software (Molecular Devices). The median background signal was subtracted from the median spot signal intensity.
Detection of Serum Antibody using SARS-CoV-2 Proteome Microarray
All COVID-19 patients were diagnosed according to the “Diagnosis and Management Plan of Pneumonia with New Coronavirus Infection” (trial version 7). The serum samples of COVID-19 and control patients were collected with written informed consent under the approval of the intuitional review board (IRB) from Peking Union Medical College Hospital (Ethical No. ZS-2303) and Beijing Proteome Research Center. All experiments were performed according to the standards of the Declaration of Helsinki.
Prior to the antibody detection, the peptide microarrays were assembled in an incubation tray and blocked with 5% (w/v) milk in 1X PBS with 0.2% (v/v) Tween-20 (PBST) for 1 min at room temperature. After it was washed with PBST three times, the array was incubated with 1:300 diluted serum for 30 min at room temperature. After it was washed again, the array was then incubated for 30 min with a mixture containing Cy3 Affinipure donkey antihuman IgG(H+L) and Alexa fluor 647 Affinipure goat antihuman IgM FC5 μantibody (Jackson ImmunoResearch) (2 μg/mL). Finally, the array was washed with PBST and water, dissembled from the tray, and dried with centrifugation for 2 min at 2000 rpm. The array was scanned with a GenePix 4300A microarray scanner (Molecular Devices) at 10 μm resolution using a laser at 532 nm with 100% power/PMT Gain 800 for IgG and 635 nm with 100% power/PMT Gain 900 for IgM. The median fluorescent signal intensity with background subtraction was extracted using GenePix Pro7 software (Molecular Devices).
Data Analysis
The raw fluorescence signal intensity was the median signal intensity subtracted by the median background intensity of each spot, and then averaged across duplicate spots. The resulting signals were normalized with a Z-score, which is shown below.23
where P is any peptide or protein on the microarray, and P1···Pn represents the aggregate measure of all of the peptides or proteins. The heatmap of antibody response to the peptides was visualized using the MultiExperiment Viewer software version 4.9 (Dana-Farber Cancer Institute).32 Statistical analyses were performed using the GraphPad Prism software version 6.0 (GraphPad Software, Inc.) with the Mann–Whitney U-test (p-value < 0.01).
Acknowledgments
This work was supported by the National Key R&D Program of China (2020YFE0202200), State Key Laboratory of Proteomics (SKLP-C202001, SKLP-O201703, and SKLP-K201505), the Beijing Municipal Education Commission, the National Natural Science Foundation of China (81671618, 81871302, 81673040, and 31870823), the National Program on Key Basic Research Project (2018YFA0507503, 2017YFC0906703, and 2018ZX09733003), and the CAMS Initiative for Innovative Medicine (2017-I2M-3-001 and 2017-I2M-B&R-01). We also thank Dr. B. Petritis for her critical review and editing of this manuscript.
Supporting Information Available
The Supporting Information is available free of charge at https://pubs.acs.org/doi/10.1021/acscentsci.0c00742.
Author Contributions
X.H., Y.L., and X.W. provided the clinical samples. H.W., X.W., X.H., X.Z., T.L., J.D., T.F., S.G., H.D., and X.Y. executed the microarray experiments. D.W., X.Z., T.L., and X.Y. executed the bioinformatics and statistical analysis. X.Y. and Y.L. conceived the idea, designed experiments, analyzed the data, and wrote the manuscript.
Author Contributions
∥ (H.W., X.W., X.Z., and X.H.) These authors contributed equally to this work.
The authors declare no competing financial interest.
Supplementary Material
References
- Huang C.; Wang Y.; Li X.; Ren L.; Zhao J.; Hu Y.; Zhang L.; Fan G.; Xu J.; Gu X.; et al. Clinical features of patients infected with 2019 novel coronavirus in Wuhan, China. Lancet 2020, 395 (10223), 497–506. 10.1016/S0140-6736(20)30183-5. [DOI] [PMC free article] [PubMed] [Google Scholar]
- Li Q.; Guan X.; Wu P.; Wang X.; Zhou L.; Tong Y.; Ren R.; Leung K. S. M.; Lau E. H. Y.; Wong J. Y.; et al. Early Transmission Dynamics in Wuhan, China, of Novel Coronavirus-Infected Pneumonia. N. Engl. J. Med. 2020, 382 (13), 1199–1207. 10.1056/NEJMoa2001316. [DOI] [PMC free article] [PubMed] [Google Scholar]
- Guan W. J.; Ni Z. Y.; Hu Y.; Liang W. H.; Ou C. Q.; He J. X.; Liu L.; Shan H.; Lei C. L.; Hui D. S. C.; et al. Clinical Characteristics of Coronavirus Disease 2019 in China. N. Engl. J. Med. 2020, 382 (18), 1708–1720. 10.1056/NEJMoa2002032. [DOI] [PMC free article] [PubMed] [Google Scholar]
- Mizumoto K.; Kagaya K.; Zarebski A.; Chowell G. Estimating the Asymptomatic Proportion of 2019 Novel Coronavirus onboard the Princess Cruises Ship, 2020. medRxiv 2020, 10.1101/2020.02.20.20025866. [DOI] [Google Scholar]
- Mahase E. China coronavirus: mild but infectious cases may make it hard to control outbreak, report warns. BMJ. 2020, 368, m325. 10.1136/bmj.m325. [DOI] [PubMed] [Google Scholar]
- Phan L. T.; Nguyen T. V.; Luong Q. C.; Nguyen T. V.; Nguyen H. T.; Le H. Q.; Nguyen T. T.; Cao T. M.; Pham Q. D. Importation and Human-to-Human Transmission of a Novel Coronavirus in Vietnam. N. Engl. J. Med. 2020, 382 (9), 872–874. 10.1056/NEJMc2001272. [DOI] [PMC free article] [PubMed] [Google Scholar]
- Wang C.; Horby P. W.; Hayden F. G.; Gao G. F. A novel coronavirus outbreak of global health concern. Lancet 2020, 395 (10223), 470–473. 10.1016/S0140-6736(20)30185-9. [DOI] [PMC free article] [PubMed] [Google Scholar]
- Holshue M. L.; DeBolt C.; Lindquist S.; Lofy K. H.; Wiesman J.; Bruce H.; Spitters C.; Ericson K.; Wilkerson S.; Tural A.; et al. First Case of 2019 Novel Coronavirus in the United States. N. Engl. J. Med. 2020, 382, 929–936. 10.1056/NEJMoa2001191. [DOI] [PMC free article] [PubMed] [Google Scholar]
- Dong E.; Du H.; Gardner L. An interactive web-based dashboard to track COVID-19 in real time. Lancet Infect. Dis. 2020, 20 (5), 533–534. 10.1016/S1473-3099(20)30120-1. [DOI] [PMC free article] [PubMed] [Google Scholar]
- Du Toit A. Outbreak of a novel coronavirus. Nat. Rev. Microbiol. 2020, 18 (3), 123–123. 10.1038/s41579-020-0332-0. [DOI] [PMC free article] [PubMed] [Google Scholar]
- Chan J. F.; Yuan S.; Kok K. H.; To K. K.; Chu H.; Yang J.; Xing F.; Liu J.; Yip C. C.; Poon R. W.; et al. A familial cluster of pneumonia associated with the 2019 novel coronavirus indicating person-to-person transmission: a study of a family cluster. Lancet 2020, 395 (10223), 514–523. 10.1016/S0140-6736(20)30154-9. [DOI] [PMC free article] [PubMed] [Google Scholar]
- Chan J. F.; Kok K. H.; Zhu Z.; Chu H.; To K. K.; Yuan S.; Yuen K. Y. Genomic characterization of the 2019 novel human-pathogenic coronavirus isolated from a patient with atypical pneumonia after visiting Wuhan. Emerging Microbes Infect. 2020, 9 (1), 221–236. 10.1080/22221751.2020.1719902. [DOI] [PMC free article] [PubMed] [Google Scholar]
- Narayanan K.; Huang C.; Makino S. SARS coronavirus accessory proteins. Virus Res. 2008, 133 (1), 113–121. 10.1016/j.virusres.2007.10.009. [DOI] [PMC free article] [PubMed] [Google Scholar]
- Dinesh D.; Chalupska D.; Silhan J.; Veverka V.; Boura E. Structural basis of RNA recognition by the SARS-CoV-2 nucleocapsid phosphoprotein. medRxiv 2020, 10.1101/2020.04.02.022194. [DOI] [PMC free article] [PubMed] [Google Scholar]
- Walls A. C.; Park Y. J.; Tortorici M. A.; Wall A.; McGuire A. T.; Veesler D. Structure, Function, and Antigenicity of the SARS-CoV-2 Spike Glycoprotein. Cell 2020, 181 (2), 281–292. 10.1016/j.cell.2020.02.058. [DOI] [PMC free article] [PubMed] [Google Scholar]
- Wang Q.; Zhang Y.; Wu L.; Niu S.; Song C.; Zhang Z.; Lu G.; Qiao C.; Hu Y.; Yuen K. Y.; et al. Structural and Functional Basis of SARS-CoV-2 Entry by Using Human ACE2. Cell 2020, 181 (4), 894–904. 10.1016/j.cell.2020.03.045. [DOI] [PMC free article] [PubMed] [Google Scholar]
- Baruah V.; Bose S. Immunoinformatics-aided identification of T cell and B cell epitopes in the surface glycoprotein of 2019-nCoV. J. Med. Virol. 2020, 92 (5), 495–500. 10.1002/jmv.25698. [DOI] [PMC free article] [PubMed] [Google Scholar]
- Ahmed S. F.; Quadeer A. A.; McKay M. R. Preliminary Identification of Potential Vaccine Targets for the COVID-19 Coronavirus (SARS-CoV-2) Based on SARS-CoV Immunological Studies. Viruses 2020, 12 (3), 254. 10.3390/v12030254. [DOI] [PMC free article] [PubMed] [Google Scholar]
- Grifoni A.; Sidney J.; Zhang Y.; Scheuermann R. H.; Peters B.; Sette A. A Sequence Homology and Bioinformatic Approach Can Predict Candidate Targets for Immune Responses to SARS-CoV-2. Cell Host Microbe 2020, 27 (4), 671–680. 10.1016/j.chom.2020.03.002. [DOI] [PMC free article] [PubMed] [Google Scholar]
- Grifoni A.; Weiskopf D.; Ramirez S.; Smith D.; Crotty S.; Sette A.; et al. Targets of T cell responses to SARS-CoV-2 coronavirus in humans with COVID-19 disease and unexposed individuals. Cell 2020, 181, 1489–1501. 10.1016/j.cell.2020.05.015. [DOI] [PMC free article] [PubMed] [Google Scholar]
- Xu M.; Deng J.; Xu K.; Zhu T.; Han L.; Yan Y.; Yao D.; Deng H.; Wang D.; Sun Y.; et al. In-depth serum proteomics reveals biomarkers of psoriasis severity and response to traditional Chinese medicine. Theranostics 2019, 9 (9), 2475–2488. 10.7150/thno.31144. [DOI] [PMC free article] [PubMed] [Google Scholar]
- Yu X.; Song L.; Petritis B.; Bian X.; Wang H.; Viloria J.; Park J.; Bui H.; Li H.; Wang J.; et al. Multiplexed Nucleic Acid Programmable Protein Arrays. Theranostics 2017, 7 (16), 4057–4070. 10.7150/thno.20151. [DOI] [PMC free article] [PubMed] [Google Scholar]
- Cheadle C.; Vawter M. P.; Freed W. J.; Becker K. G. Analysis of microarray data using Z score transformation. J. Mol. Diagn. 2003, 5 (2), 73–81. 10.1016/S1525-1578(10)60455-2. [DOI] [PMC free article] [PubMed] [Google Scholar]
- Wang C.; Li W.; Drabek D.; Okba N. M. A.; van Haperen R.; Osterhaus A. D. M. E.; van Kuppeveld F. J. M.; Haagmans B. L.; Grosveld F.; Bosch B.-J. A human monoclonal antibody blocking SARS-CoV-2 infection. Nat. Commun. 2020, 11 (1), 1–6. 10.1038/s41467-020-16256-y. [DOI] [PMC free article] [PubMed] [Google Scholar]
- Yan R.; Zhang Y.; Li Y.; Xia L.; Zhou Q. Structure of dimeric full-length human ACE2 in complex with B0AT1. BioRxiv 2020, 10.1101/2020.02.17.951848. [DOI] [Google Scholar]
- Wu Y.; Wang F.; Shen C.; Peng W.; Li D.; Zhao C.; Li Z.; Li S.; Bi Y.; Yang Y.; et al. A noncompeting pair of human neutralizing antibodies block COVID-19 virus binding to its receptor ACE2. Science 2020, 368 (6496), 1274–1278. 10.1126/science.abc2241. [DOI] [PMC free article] [PubMed] [Google Scholar]
- Colwill K.; et al. A roadmap to generate renewable protein binders to the human proteome. Nat. Methods 2011, 8 (7), 551–558. 10.1038/nmeth.1607. [DOI] [PubMed] [Google Scholar]
- Jiang S.; He Y.; Liu S. SARS vaccine development. Emerging Infect. Dis. 2005, 11 (7), 1016–1020. 10.3201/1107.050219. [DOI] [PMC free article] [PubMed] [Google Scholar]
- Wu F.; Wang A.; Liu M.; Jiang S.; Lu H.; Wen Y.; Huang J. Neutralizing antibody responses to SARS-CoV-2 in a COVID-19 recovered patient cohort and their implications. medRxiv 2020, 10.1101/2020.03.30.20047365. [DOI] [Google Scholar]
- Long Q. X.; Liu B. Z.; Deng H. J.; Wu G. C.; Deng K.; Chen Y. K.; Liao P.; Qiu J. F.; Lin Y.; Cai X. F.; et al. Antibody responses to SARS-CoV-2 in patients with COVID-19. Nat. Med. 2020, 26, 845–848. 10.1038/s41591-020-0897-1. [DOI] [PubMed] [Google Scholar]
- Duivelshof B. L.; Jiskoot W.; Beck A.; Veuthey J. L.; Guillarme D.; D’Atri V. Glycosylation of biosimilars: Recent advances in analytical characterization and clinical implications. Anal. Chim. Acta 2019, 1089, 1–18. 10.1016/j.aca.2019.08.044. [DOI] [PubMed] [Google Scholar]
- Chu V. T.; Gottardo R.; Raftery A. E.; Bumgarner R. E.; Yeung K. Y. MeV+R: using MeV as a graphical user interface for Bioconductor applications in microarray analysis. Genome Biol. 2008, 9 (7), R118. 10.1186/gb-2008-9-7-r118. [DOI] [PMC free article] [PubMed] [Google Scholar]
Associated Data
This section collects any data citations, data availability statements, or supplementary materials included in this article.