Abstract
Mesenchymal stromal cells (MSC) hold promise as a novel immune‐modulatory therapy in organ transplantation. First clinical studies have used autologous MSCs; however, the use of allogeneic "off‐the‐shelf" MSCs is more sustainable for broad clinical implementation, although with the risk of causing sensitization. We investigated safety and feasibility of allogeneic MSCs in renal transplantation, using a matching strategy that prevented repeated mismatches. Ten patients received two doses of 1.5 × 10⁶/kg allogeneic MSCs 6 months after transplantation in a single‐center nonrandomized phase Ib trial, followed by lowering of tacrolimus (trough level 3 ng/mL) in combination with everolimus and prednisone. Primary end point was safety, measured by biopsy proven acute rejection (BPAR) and graft loss 12 months after transplantation. Immune monitoring was performed before and after infusion. No BPAR or graft loss occurred and renal function remained stable. One patient retrospectively had DSAs against MSCs, formed before infusion. No major alterations in T and B cell populations or plasma cytokines were observed upon MSC infusion. Administration of HLA selected allogeneic MSCs combined with low‐dose tacrolimus 6 months after transplantation is safe at least in the first year after renal transplantation. This sets the stage to further explore the efficacy of third‐party MSCs in renal transplantation.
Keywords: clinical research/practice, clinical trial, immune regulation, immunosuppression/immune modulation, kidney transplantation/nephrology, monitoring: immune, stem cells
Short abstract
The authors report that administration 6 months after kidney transplantation of allogeneic bone marrow–derived mesenchymal stromal cells selected to have no repeated HLA mismatches with the kidney donor was safe 1 year after transplantation with no instances of biopsy‐proven acute rejection, graft loss, or de novo antibodies against either donor.
Abbreviations
- (dn)DSA
(de novo) donor specific anti‐HLA antibodies
- (s)AE
(serious) adverse event
- BKV
BK viremia
- BM
bone marrow
- BPAR
biopsy proven acute rejection
- CCMO
Central Committee on Research involving Human Subjects
- CMV
cytomegalovirus
- CNI
calcineurin inhibitor
- eGFR
estimated glomerular filtration rate
- HLA
human leukocyte antigen
- IFTA
interstitial fibrosis and tubular atrophy
- MedDRA©
Medical Dictionary for Regulatory Activities
- MFI
mean fluorescence intensity
- MSC
mesenchymal stromal cell
- NK
natural killer
- SAB
single antigen bead
- SR
Sirius Red
- Treg
regulatory T cell
1. INTRODUCTION
Since the late 1980s short‐term kidney graft survival improved due to the prevention of acute rejection; however, improvement in long‐term survival was hampered. 1 An important cause of late graft failure is interstitial fibrosis and tubular atrophy (IFTA) due to nonimmunological (eg, drug toxicity) and immunological mechanisms 2 , 3 and therefore new immunosuppressive protocols aim to reduce calcineurin inhibitors (CNI). However, this in turn has been shown to promote the formation of de novo donor specific antihuman leukocyte antigen (HLA) antibodies (dnDSAs) and rejection, which increases the chance of graft loss. 4
In order to improve graft survival, cellular therapy has gained interest. Mesenchymal stromal cells (MSCs) have anti‐inflammatory, immune‐regulatory, and reparative properties, which make them a promising therapy in transplantation. 5 , 6 Most clinical studies in renal transplantation have used autologous MSCs 7 , 8 , 9 but for acute treatment indications, allogeneic MSCs are more feasible due to standardized quality control and the possibility to use "off‐the‐shelf" products. 10 However, they potentially can elicit an antidonor immune response against the kidney allograft or the MSCs. 11 In renal transplantation only a few studies have been performed with allogeneic MSCs 12 , 13 and the use of unmatched MSCs resulted in dnDSA formation in the study of Erpicum et al. 13
In contrast to previous studies, where MSCs were administered early after renal transplantation with the aim to induce tolerance, we infused the MSCs 6 months after transplantation. This later timepoint could give the opportunity to lower CNI levels in order to reverse or stabilize IFTA and retain long‐term renal function. 14 Therefore, the primary aim of this phase Ib study is to prove safety and feasibility of infusion of third‐party MSCs where a matching strategy prevented repeated mismatches with the kidney allograft to minimize the risk of an antidonor immune response against the allograft.
2. MATERIAL AND METHODS
2.1. Study design and patients
This is a 12‐month, nonrandomized, prospective, single‐center, phase Ib study where 10 patients received a first solitary renal transplant from a living (unrelated) donor and fulfilled the study criteria as described. 15
All patients received alemtuzumab (anti‐CD52) induction and prednisone, tacrolimus (Advagraf®), and everolimus (Certican®) as maintenance therapy (Figure 1). Tacrolimus was reduced to trough levels of 1.5‐3 ng/mL after the second MSC infusion. Details of target levels and comedication have been described previously. 15 Primary end point was safety assessed by the occurrence of biopsy proven acute rejection (BPAR) or graft loss with a target of <3 patients, based on an occurrence of <25% BPAR/graft loss in the overall renal transplant population. Peripheral lymphocyte subsets, anti‐HLA antibodies, and serum cytokine and chemokine levels before and after MSC infusion were measured. 16 , 17 Secondary end points were adverse events including infections, renal function, and fibrosis measured by Sirius Red (SR) scoring.
FIGURE 1.

Schematic presentation of study interventions and immunosuppressive regimen. Patients received induction therapy with alemtuzumab (Campath®) 15 mg on day 0 and day 1 after transplantation [Tx]). Prednisolone started on day 0 with 500 mg, 250 mg on day 1, 125 mg on day 2, 100 mg on day 3, 50 mg on day 4, and 10 mg/day from day 5, then reduced to 7.5 mg after 3 months (week 12) and to 5 mg at 6 months (week 26). Target trough level of everolimus (Certican®) was 3‐8 ng/mL. The tacrolimus (Advagraf®) target was 8‐10 ng/mL the first 6 weeks post Tx, 4‐7 ng/mL from 6 to 24 weeks, and lowered to 1.5‐3 ng/mL at week 26. A renal biopsy was performed 24 weeks after transplantation, before MSC infusion, and 52 weeks after transplantation. In week 25 and week 26 1‐2 × 10⁶/kg allogeneic MSC were infused. W, weeks; Tx, transplantation; MSC, mesenchymal stromal cells; C0, trough level
Written informed consent was obtained from all participants. The protocol was approved by the local ethics committee and by the Central Committee on Research involving Human Subjects (CCMO) (EudraCT: 2013‐005407‐14; Clinical‐Trials.gov: NCT02387151).
2.2. MSC products
Bone marrow (BM)‐derived MSCs were obtained from healthy independent third‐party donors. 15 The protocol was approved by the local ethics committee (P11.089) and by the CCMO. Details of BM donors, processing and expansion of the MSCs is described in the Supporting Information and Table S1.
The MSC product was infused via peripheral infusion within 30 minutes. Patients received two doses of 1‐2 × 10⁶ MSCs per kg body weight at week 25 and 26 after transplantation.
2.3. Monitoring
Patients were monitored according to the assessment schedule (Table S2).
(Serious) adverse events (SAE) were documented according to MedDRA® (Medical Dictionary for Regulatory Activities), the international medical terminology developed under the auspices of the International Council for Harmonization of Technical Requirements for Pharmaceuticals for Human Use.
Renal function was measured by estimated glomerular filtration rate (eGFR) using the Chronic Kidney Disease Epidemiology Collaboration (CKD‐EPI) formula. 15 In addition, iohexol clearance at week 24 and week 52 was done retrospectively. Iohexol was measured with a validated High Performance Liquid Chromatography with Diode Array Detector assay. 18 Validation was performed according to European Medicines Agency Guidelines on bioanalytical method validation (2011). Iohexol GFR was calculated, based on samples at T = 5 minutes, T = 1, T = 2, T = 3 and T = 4 hours after iohexol administration, with nonlinear regression.
Renal biopsy was performed 6 months after transplantation (1 week before the first MSC infusion) and 6 months after the second MSC infusion. Biopsies were scored using the Banff classification from 2018 19 by a pathologist from our center after completion of the study and stained for SR to quantify the extent of interstitial fibrosis, which correlates with long‐term graft failure. 20 The amount of collagen I and III deposition was measured in multiple slices per biopsy by computerized image analysis and expressed as percentage of positivity per region of the kidney. 20
During the study cytomegalovirus (CMV)‐, Epstein‐Barr virus, and BK‐virus (BKV) were detected through polymerase chain reaction testing as indicated (Table S2) and on clinical indication.
Quantification of tacrolimus and everolimus was performed using a previously validated liquid chromatography–mass spectrometry (LC–MS)/MS assay. 21
2.4. HLA typing and HLA antibody detection
Recipients, kidney donors and MSC donors were typed for HLA class I by Luminex SSO (Lifecodes, ImmuCor, Peachtree Corners, GA) and HLA‐DRB1, ‐DRB3, 4, 5, and ‐DQB1 by rSSO. 22 MSCs were selected specifically for each patient without repeated HLA mismatches on the split antigen level for HLA‐A, ‐B, ‐DR, and ‐DQ (Figure 2).
FIGURE 2.
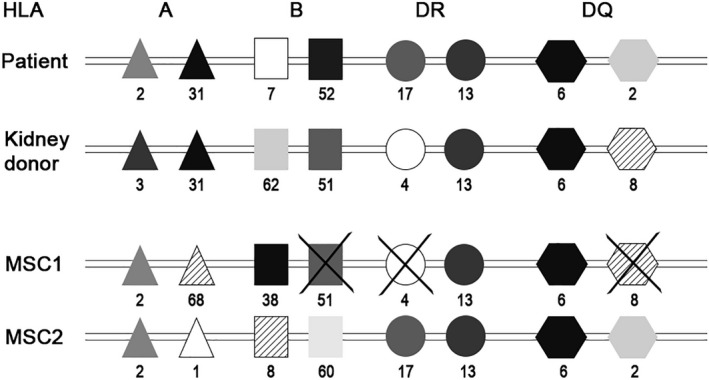
MSC selection procedure regarding HLA matching. This figure shows the method of MSC selection for patient 3. In this patient the HLA mismatch with the kidney donor was 1‐2‐1 (and 1 for HLA DQ). MSC1 has three repeated mismatches, HLA‐B, HLA‐DR, and HLA‐DQ, therefore the product was not selected. MSC2 has mismatches with the recipient (1‐2‐0, 0) but no repeated mismatches between the mismatches with the kidney donor, so this product was selected for infusion. HLA, human leukocyte antigen; MSC, mesenchymal stromal cells
The presence of serum HLA antibodies was determined as indicated (Table S2). Samples were screened using Luminex assay (ImmuCor) and analyzed with a Luminex 100 reader. Provider suggested definitions of the negative/positive discriminations were used. When positive, a single antigen bead (SAB) assay (Lifecodes, ImmuCor) was performed as standard of care. After completion of the study all samples before MSC infusion and 26 weeks after the second MSC infusion were tested using this SAB assay (Lifecodes, ImmuCor). Assignment of positivity was assessed according to manufacturer's instructions.
2.5. Immunological monitoring
Phenotypical analysis of leukocyte subpopulations was performed according to the One study protocol at several timepoints (Table S2). 16 Absolute cell counts were obtained by using the BD Multitest kit (BD Biosciences, San Jose, CA).
Levels of 29 systemic proinflammatory and anti‐inflammatory cytokines and chemokines, summarized in the Supporting information, were measured before and 4 hours after MSC infusion using multiplex assays (Biorad, Hercules, CA). 17
2.6. Statistical analysis
Comparisons between measurements before and after MSC infusion were done using paired t tests in SPSS version 25.0. P values < .05 were considered statistically significant.
3. RESULTS
3.1. Clinical course of MSC treated patients
Ten patients, aged 24 to 68 years, were included and received MSC infusions between March 2015 and May 2018. Four of 10 patients received a kidney from a related donor, stated as the type of transplant in Table 1. All patients received the target MSC dose and had stable vital signs before and after infusion monitored using Modified Early Warning Scores (Table S3).
TABLE 1.
Baseline characteristics
| Patient | 1 | 2 | 3 | 4 | 5 | 6 | 7 | 8 | 9 | 10 |
|---|---|---|---|---|---|---|---|---|---|---|
| Recipient | ||||||||||
| Age (y) | 24 | 59 | 56 | 46 | 68 | 47 | 59 | 59 | 39 | 44 |
| Gender | ♂ | ♀ | ♂ | ♀ | ♀ | ♂ | ♂ | ♂ | ♂ | ♀ |
| Weight (kg) | 70 | 69 | 75 | 75 | 62 | 79 | 90 | 83 | 85 | 83 |
| Primary diagnosis | HT | Anti‐GBM | TIN | ADPKD | ADPKD | IgA | ADPKD | IgA | Unknown | SLE |
| PRA (%)* | 4 | 36 | 4 | 4 | 0 | 4 | 4 | 5 | 4 | 5 |
| Donor | ||||||||||
| Age (y) | 56 | 61 | 69 | 49 | 63 | 43 | 60 | 59 | 49 | 63 |
| Gender | ♂ | ♂ | ♂ | ♀ | ♀ | ♂ | ♀ | ♀ | ♀ | ♀ |
| Transplant | ||||||||||
| Type | LR | LUR | LUR | LR | LUR | LR | LUR | LUR | LUR | LR |
| Cold ischemia time (h:min) | 2:39 | 2:51 | 3:15 | 4:40 | 2:57 | 3:19 | 2:52 | 3:04 | 3:22 | 3:12 |
| Warm ischemia time (min) | 25 | 33 | 26 | 45 | 22 | 27 | 26 | 33 | 33 | 27 |
| Cytomegalovirus IgG status | D−/R− | D−/R+ | D−/R− | D−/R− | D+/R+ | D−/R− | D−/R− | D+/R+ | D−/R+ | D−/R− |
| Epstein‐Barr virus IgG status | D+/R+ | D+/R+ | D+/R+ | D+/R+ | D+/R+ | D+/R+ | D+/R+ | D+/R+ | D−/R+ | D+/R+ |
Characteristics of 10 renal recipients and their kidney donors. The second warm ischemia time is given. For cytomegalovirus and Epstein‐Barr virus, the IgG status of the donor (D) and recipient (R) were given positive or negative.
Abbreviations: ADPKD, autosomal dominant polycystic kidney disease; GBM, glomerular basement membrane; HT, hypertension; L(U)R, living (un) related; PRA, panel reactive antibody; SLE, systemic lupus erythematosus; TIN, tubulointerstitial nephritis.
All patients had a functioning kidney graft at the end of the study and no BPAR occurred. Banff classification (Table S4) showed some changes between the first and second biopsy in six patients. In two patients the IFTA score was higher in the second biopsy and two patients developed nonspecific changes. In two patients, the second biopsy showed a small focus of borderline rejection; however, renal function remained stable and no signs of rejection were observed during the study. In patient 10 the second renal biopsy was cancelled because of a vital anticoagulation indication due to a transient ischemic attack 5 months after MSC infusion.
In total 10 infectious events occurred before MSC infusion and 11 events occurred afterwards. Three patients had BKV with stable renal function and no signs of BK nephropathy. In one patient this occurred two months after transplantation and it resolved after lowering immunosuppression. Two BKV reactivations occurred both 5 months after MSC infusion and resolved spontaneously within several weeks. Six couples were both CMV IgG negative (Table 1). From the patients with a positive CMV IgG, one had a CMV reactivation (1.5 log) 1 month after the first MSC infusion that decreased to zero within 1 month. Patient 3 had a herpes zoster reactivation 3 months after MSC infusion. The other infectious adverse events were mainly viral upper respiratory tract infections (10/21) and three urinary tract infections. One viral infection occurred the week after MSC infusion, five viral infections and one urinary tract infections occurred several months after MSC infusion.
Renal function remained stable in five patients during the study follow‐up (Figure 3). Patient 9 had a slight decrease in both eGFR and iohexol clearance. Four patients had an improved renal function between 6 and 12 months after transplantation. In most patients eGFR and iohexol clearance were comparable; however, two patients had an improvement of their iohexol clearance that was not reflected in eGFR. Mean eGFR at week 24, before MSC infusion, was 47 mL/min (±13) and mean eGFR at week 52 was 50 mL/min (±13; P = .289).
FIGURE 3.
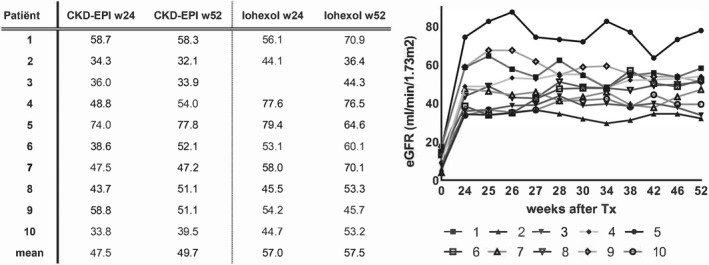
Kidney function before and after MSC infusion. The table on the left shows the values of the Chronic Kidney Disease Epidemiology Collaboration (CKD‐EPI) compared to the iohexol clearance in mL/min measured 24 and 52 weeks after kidney transplantation. In patient 3 iohexol clearance at week 24 is missing due to 1 missing laboratory measurement. Mean renal function is the mean of all patients. The figure on the right shows the eGFR calculated with CKD‐EPI formula for all 10 patients during study follow‐up. Week 0 is calculated just before transplantation, week 24 is the moment of renal biopsy, before MSC infusions (week 25 and 26). W, week; eGFR, estimated glomerular filtration rate; MSC, mesenchymal stromal cells
Most immunosuppressive drug levels were within or slightly out of the target range (Table S5). Tacrolimus trough levels decreased after MSC infusion as meant per protocol from a mean of 6.1 (±1.7) ng/mL before infusion to 3.0 (±0.9) ng/mL afterwards. Mean everolimus trough level was 5.7 ng/mL before and after MSC infusion. Prednisone was tapered to 5 mg in all patients according to the protocol.
3.2. SR staining before and after MSC infusion
Comparing SR scores in the renal biopsies 6 and 12 months after transplantation, an obvious rise was observed in the first two patients (Figure 4) and patient 8 had a marked improvement of the SR score. Other values were comparable and there was no significant difference in mean SR score before and after MSC infusion (P = .949). Regarding the improvement in patient 8, this patient experienced perioperative bleeding, requiring a second operation. Renal function improved very slowly afterwards and a kidney biopsy 9 days after transplantation showed acute tubular necrosis without signs of rejection. Renal function improved further until 12 months after transplantation (Figure 3), which could reflect the improvement of the SR score.
FIGURE 4.
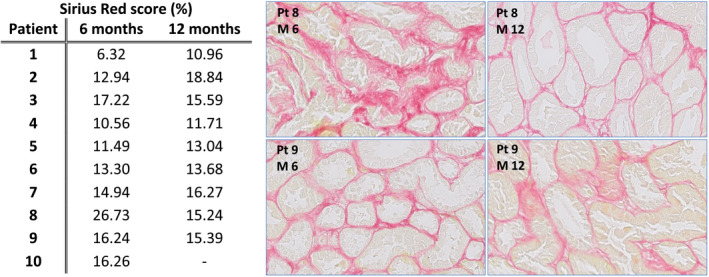
Sirius Red scores. This figure shows in the table on the left the Sirius Red score in percentages scored for the first biopsy at 6 months after transplantation (before MSC infusion) and the second biopsy 12 months after transplantation. The last patient had a vital anticoagulation indication (transient ischemic attack) so no renal biopsy was performed and therefore this value is missing. Two biopsies were shown as example, the biopsy of patient 8 had an important improvement of Sirius Red score, which is also seen in the picture. The second example from patient 9 had a stable Sirius Red score. MSC, mesenchymal stromal cells.
3.3. HLA mismatches and DSAs
All kidney donors and MSC products had HLA mismatches with the patients (Table 2). As meant per protocol there were no repeated HLA mismatches with the kidney graft in nine patients. In patient 2 it was not possible to find a suitable MSC product and a repeated mismatch on HLA‐DQ was accepted. Patient 2 had class I (HLA‐B) antibodies before transplantation, after previous pregnancy, which were not directed against the kidney donor or the selected MSCs. None of the patients had dnDSAs using Luminex screening before and after MSC infusion. After completion of the study, SAB assays showed no dnDSAs against the kidney graft. Retrospectively, patient 4 happened to have a class II DSA (DQ8) directed against the MSCs with an mean fluorescence intensity (MFI) of 1696, already formed before MSC infusion in week 24, which was also measurable at the end of the study with an MFI of 1936.
TABLE 2.
HLA mismatches on split level between patient, kidney donor and MSCs
| Patient/kidney/MSC | HLA‐A | HLA‐B | HLA‐DR | HLA‐DQ | |||||||||
|---|---|---|---|---|---|---|---|---|---|---|---|---|---|
| 1 | Patient | A68 | B60 | B44 | DR4 | DR11 | DQ7 | ||||||
| Kidney | A68 | A31 | 1 | B27 | B44 | 1 | DR4 | DR11 | 0 | DQ7 | DQ8 | 1 | |
| MSC | A2 | A32 | 2 | B51 | 1 | DR8 | DR12 | 2 | DQ7 | DQ4 | 1 | ||
| 2 | Patient | A2 | A68 | B44 | B53 | DR15 | DQ6 | ||||||
| Kidney | A29 | A66 | 2 | B35 | B39 | 2 | DR1 | DR11 | 2 | DQ7 | DQ5 | 2 | |
| MSC | A2 | 0 | B44 | B62 | 1 | DR4 | DR7 | 2 | DQ7 | DQ9 | 2 | ||
| 3 | Patient | A2 | A31 | B7 | B52 | DR13 | DR17 | DQ2 | DQ6 | ||||
| Kidney | A3 | A31 | 1 | B51 | B62 | 2 | DR13 | DR4 | 1 | DQ8 | DQ6 | 1 | |
| MSC | A1 | A2 | 1 | B8 | B60 | 2 | DR13 | DR17 | 0 | DQ2 | DQ6 | 0 | |
| 4 | Patient | A2 | B39 | B44 | DR4 | DR8 | DQ2 | DQ4 | |||||
| Kidney | A2 | 0 | B62 | B44 | 1 | DR4 | DR1 | 1 | DQ2 | DQ5 | 1 | ||
| MSC | A2 | A68 | 1 | B35 | B60 | 2 | DR4 | DR17 | 1 | DQ2 | DQ8 | 1 | |
| 5 | Patient | A2 | A29 | B44 | B51 | DR7 | DR11 | DQ2 | DQ7 | ||||
| Kidney | A2 | A74 | 1 | B72 | B27 | 2 | DR17 | DR11 | 1 | DQ2 | DQ6 | 1 | |
| MSC | A2 | A32 | 1 | B51 | 0 | DR8 | DR12 | 2 | DQ4 | DQ7 | 1 | ||
| 6 | Patient | A1 | A24 | B7 | B27 | DR4 | DR17 | DQ2 | DQ7 | ||||
| Kidney | A1 | A2 | 1 | B8 | B62 | 2 | DR4 | DR17 | 0 | DQ2 | DQ8 | 1 | |
| MSC | A24 | A25 | 1 | B18 | B39 | 2 | DR8 | DR15 | 2 | DQ4 | DQ6 | 2 | |
| 7 | Patient | A2 | A32 | B44 | DR7 | DR11 | DQ2 | DQ7 | |||||
| Kidney | A2 | A32 | 0 | B44 | B18 | 1 | DR7 | DR16 | 1 | DQ2 | DQ5 | 1 | |
| MSC | A2 | A32 | 0 | B51 | 1 | DR8 | DR12 | 2 | DQ4 | DQ7 | 1 | ||
| 8 | Patient | A2 | A32 | B44 | B51 | DR11 | DR12 | DQ7 | |||||
| Kidney | A3 | A24 | 2 | B44 | 0 | DR11 | DR7 | 1 | DQ7 | DQ2 | 1 | ||
| MSC | A2 | 0 | B7 | B8 | 2 | DR11 | DR15 | 1 | DQ7 | DQ6 | 1 | ||
| 9 | Patient | A2 | A24 | B8 | B35 | DR17 | DR14 | DQ2 | DQ5 | ||||
| Kidney | A3 | 1 | B7 | B65 | 2 | DR13 | DR15 | 2 | DQ6 | 1 | |||
| MSC | A2 | 0 | B44 | B62 | 2 | DR4 | DR7 | 2 | DQ7 | DQ9 | 2 | ||
| 10 | Patient | A1 | A2 | B8 | B62 | DR15 | DQ6 | ||||||
| Kidney | A1 | 0 | B8 | 0 | DR15 | DR17 | 1 | DQ6 | DQ2 | 1 | |||
| MSC | A2 | A31 | 1 | B7 | B60 | 2 | DR4 | DR14 | 2 | DQ7 | DQ5 | 2 | |
This table shows the HLA mismatches for A‐, B‐, DR‐ and DQ‐locus on split level between the patient and kidney donor and between the patient and MSC donor. For HLA‐DR only DRB1 was taken into account.
Abbreviations: HLA, human leucocyte antigen; MSC, mesenchymal stromal cell.
3.4. Cellular response and cytokine levels after MSC infusion reflect safety
Absolute numbers of CD45+ leukocytes remained stable after transplantation (P = .088 between week 0‐52; Figure 5). Monocytes increased after transplantation (P = .034 between week 0‐52) although the level before and after the two MSC infusions did not differ significantly (P = .228; Figure 5). CD19+ B cells and CD 56+ NK cells decreased after induction therapy and an increase was seen from week 25; however, no statistically significant change was measured after MSC infusions (Figure 5). CD8+ T cells, CD4+ T cells as well as naïve and memory regulatory T cells (Tregs) demonstrated a decrease after induction therapy and T cell numbers did not return to baseline levels at week 52, 12 months, after transplantation (Figure 6). In CD4+ T cells a significant increase after two MSC infusions was seen (P = .028). The percentages of naïve and memory Tregs within CD4+ T cells did not change after MSC infusions (Figure S1).
FIGURE 5.
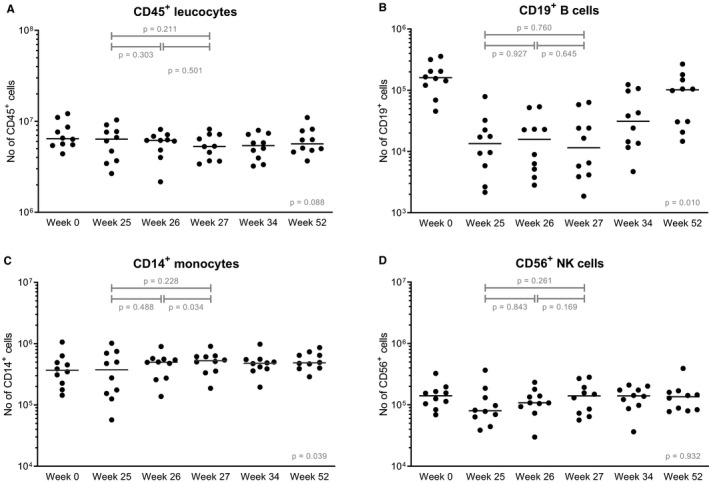
Leukocytes before and after MSC infusion. Absolute numbers of (A) CD45+ leukocytes, (B) CD19+ B cells, (C) CD14+ monocytes, and (D) CD56+ NK cells are shown at baseline before transplantation, so before induction therapy, before the first MSC infusion (week 25) and before the second MSC infusion (week 26) and three time points after both infusions (week 27, week 34, and week 52). Median values are given for every time point (horizontal bars). The y‐axis is a logarithmic scale. P values are given for the differences between week 25‐26 (after the first infusion), week 26‐27 (after the second infusion), and for week 25‐27 (before MSC infusion and after both infusions). The P value given at week 52 is the difference before transplantation (week 0) and week 52. MSC, mesenchymal stromal cells; NK, natural killer
FIGURE 6.
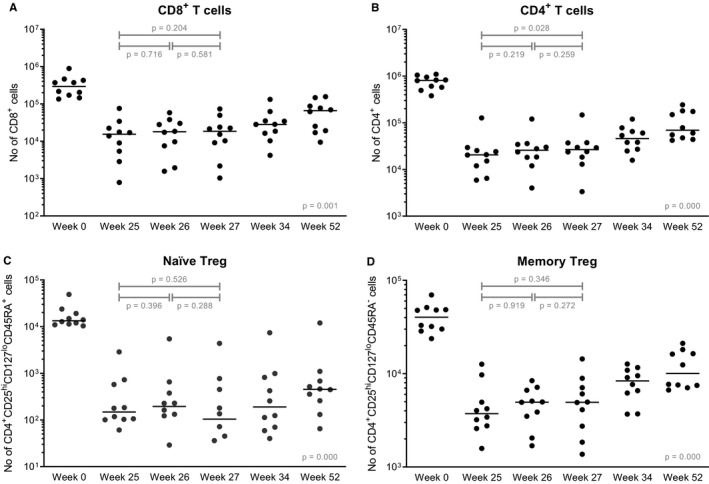
T cell subsets before and after MSC infusions. Absolute numbers of (A) CD8+ T cells, (B) CD4+ T cells, (C) naïve Tregs, and (D) memory Tregs are shown at baseline before transplantation, so before induction therapy, before the first MSC infusion (week 25) and before the second MSC infusion (week 26) and three time points after both infusions (week 27, week 34, and week 52). In the population of naïve Treg cells there were one and two patients respectively with a value of 0 cells in week 26 and week 27, these values were not plotted. Median values are given for every time point (horizontal bars). The y‐axis is a logarithmic scale. P values are given for the differences between week 25‐26 (after the first infusion), week 26‐27 (after the second infusion), and for week 25‐27 (before MSC infusion and after both infusions). The P value given at week 52 is the difference before transplantation (week 0) and week 52. MSC, mesenchymal stromal cells; Treg, regulatory T cell
Cytokine levels before and 4 hours after both MSC infusions are shown in Figure 7. Tumor necrosis factor alpha (TNFα) showed a consistent decrease in all patients 4 hours after the first MSC infusion (P = .000), although this effect was not seen after the second infusion (P = .977) levels remained lower for at least 6 months after the first infusion (P = .008; data not shown). Anti‐inflammatory cytokine IL4 showed significant differences after the first and second infusion; however, the effect did not sustain and levels returned to the value before infusion. Anti‐inflammatory cytokine interleukin (IL)10 showed a significant decrease after the second infusion and this effect remained (P = .018 between week 25 T0 and week 52, data not shown). Proinflammatory cytokine interferon gamma (IFNγ) did not show significant differences. Levels of other cytokines (supporting information) and chemokines were within physiological range and no major changes were observed 4 hours after MSC infusions (data not shown).
FIGURE 7.
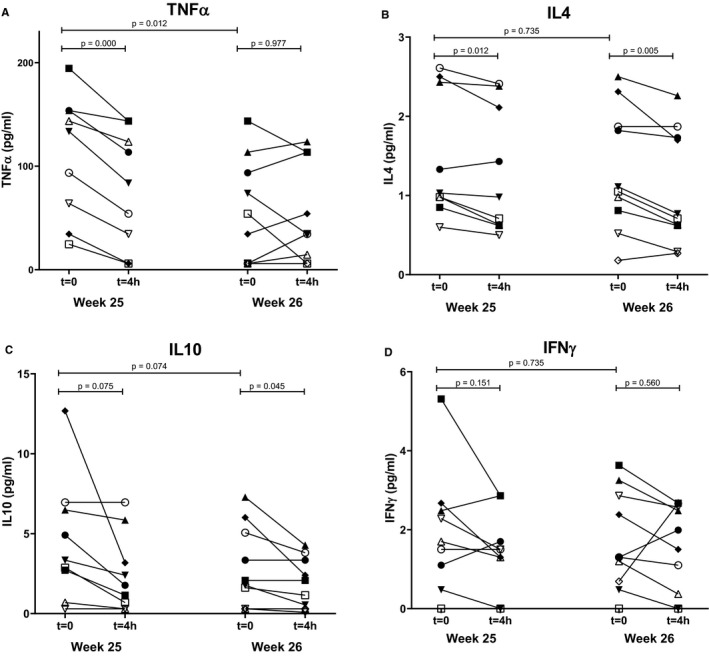
Cytokine levels of TNFα, IL4, IL10, and IFNγ and before and after MSC infusion. Levels of (A) TNFα, (B) IL4, (C) IL10, and (D) IFNγ, measured by multiplex assays before and 4 hours after the first and second MSC infusion (week 25 and week 26 after transplantation). IL, interleukin; IFN, interferon; MSC, mesenchymal stromal cells; TNF, tumor necrosis factor
3.5. (Serious) adverse events during study follow‐up
In total, 117 AEs were reported (Figure 8). All SAEs occurred in 6 patients and 11 of the 12 events occurred before MSC infusion. The SAE after MSC infusion was a second pneumoniae several months after the infusion. The SAEs were classified as serious due to (prolonged) admission. There were no AEs directly related to the MSC infusions.
FIGURE 8.
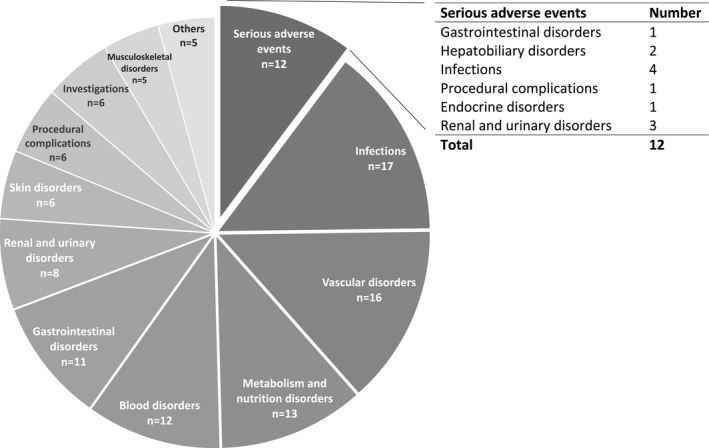
All (serious) adverse events were classified according to MedDRA® (Medical Dictionary for Regulatory Activities). During follow‐up 12 serious adverse events and 105 adverse events occurred. Most frequent reported adverse events are infectious problems. There were no adverse events directly related to the MSC infusions. MSC, mesenchymal stromal cells
Most AEs (72%) occurred before MSC infusions. Of the AEs after MSC infusion, 45% was related to comedication, 10% to the primary disease, and 34% were uncomplicated infections.
4. DISCUSSION
This clinical study, with a follow‐up of 12 months, demonstrates safe infusion of HLA selected allogeneic BM‐derived MSCs 6 months after renal transplantation in combination with low‐dose tacrolimus. All 10 patients had a functioning kidney graft and no BPAR or MSC‐related adverse events were observed. MSC trials in renal transplantation reported different outcomes regarding renal function after infusion. 7 , 23 In our study renal function was stable after MSC infusion.
Unselected allogeneic MSCs bore a risk of dnDSA development. 11 In renal transplantation, only one study determined DSAs and 4 of the 10 patients developed dnDSAs against the single dose of unmatched third‐party MSCs, one of which was also directed against the kidney graft. 13 However, only one DSA had an MFI > 1500 and renal function remained stable rendering clinical relevance of the dnDSAs in this trial unclear. In our study no dnDSAs were formed against the allograft and retrospectively one patient happened to have DSAs against the MSCs, formed before infusion. Of importance, after MSC infusion the MFI of the antibody was comparable to the level before infusion. The low occurrence of DSA formation in our study might also have been influenced by the time of infusion, 6 months after transplantation, when there is relative immunological and inflammatory quiescence as compared to the perioperative phase. It should also be noted that in this study we used alemtuzumab as a relatively strong induction therapy to allow comparability to our ongoing cell therapy studies 24 and due to a possible higher immunological risk with the use of third‐party MSCs and the lowering of CNI. 25
Several studies in the transplant setting have demonstrated that MSCs could skew the immune system toward a more tolerogenic response, which is even sustained 4 years after renal transplantation. 9 , 26 However, our first clinical study demonstrated no change in total numbers and subsets of T cells, B cells, NK cells, and monocytes after autologous MSCs 6 months after transplantation, 8 which we confirm in the current study. Only CD4+ T cells increased during the infusion; however, this could be due to repopulation after induction therapy.
In vitro studies demonstrate that MSCs can act pro‐ or anti‐inflammatory after infusion, depending on the milieu reflected by cytokines. 26 , 27 In a mouse study an increase of pro‐inflammatory cytokines was found 2 hours after the MSC infusion. 17 In renal transplantation, TNFα, IFNγ, IL4, and IL10 are studied before and no significant differences were found between groups treated with or without MSCs. 12 In the current study, TNFα and IL10 were consistently lower in all patients after MSC infusions and this effect remained. However, the implication of this observation is unclear because we can compare levels only within the patient but not with a control group.
A tacrolimus trough level of 3 ng/mL at 6 months after transplantation, as reached in our study, is a risk factor for dnDSA development. 4 Although the design of our study does not allow conclusions on efficacy, the fact that there was no dnDSA formation against the kidney or after MSC infusion is suggestive of a potential immune‐modulatory effect of MSC therapy for example via suppression of B cell terminal differentiation. 28 Alternatively, the induction with alemtuzumab may also play a role in this observation. However, previous studies suggested rather an increased risk on dnDSA development after alemtuzumab induction. 29
So far, clinical trials using MSCs in renal transplantation have reported differences in infectious complications compared to control populations. 8 , 13 We report no increased risk of infectious complications, including BKV and CMV, compared to renal recipients with standard immunosuppression. 30 However, we have to take into account that the risk of CMV in this study was low due to 6 CMV negative donors and recipients.
In the current study we observed slight changes in Banff scores before and after MSC infusion. To address the potential role of MSCs in these observations, future studies with a control group receiving a comparable immunosuppressive regimen would be of interest.
In conclusion, our study proves safety of infusion of HLA selected allogeneic MSCs 6 months after transplantation. Our current design also underlines the feasibility of the strategy used to develop and implement MSCs as immunomodulatory therapy in the setting of renal transplantation.
DISCLOSURE
The authors of this manuscript have no conflicts of interest to disclose as described by the American Journal of Transplantation.
Supporting information
Fig S1
Supplementary Material
Supplementary Material
ACKNOWLEDGMENTS
MedDRA® trademark is registered by International Federation of Pharmaceutical Manufacturers & Associations on behalf of International Council for Harmonisation of Technical Requirements for Pharmaceuticals for Human Use. We thank the research department of the Leiden University Medical Center for their help with the study visits. We thank the research technicians from the Transplant Immunology lab for technical assistance with the immune monitoring and cytokine and chemokine assays.
Dreyer GJ, Groeneweg KE, Heidt S, et al. Human leukocyte antigen selected allogeneic mesenchymal stromal cell therapy in renal transplantation: The Neptune study, a phase I single‐center study. Am J Transplant. 2020;20:2905–2915. 10.1111/ajt.15910
DATA AVAILABILITY STATEMENT
The data that support the findings of this study are available from the corresponding author upon reasonable request.
REFERENCES
- 1. Coemans M, Süsal C, Döhler B, et al. Analyses of the short‐ and long‐term graft survival after kidney transplantation in Europe between 1986 and 2015. Kidney Int. 2018;94(5):964‐973. [DOI] [PubMed] [Google Scholar]
- 2. El‐Zoghby ZM, Stegall MD, Lager DJ, et al. Identifying specific causes of kidney allograft loss. Am J Transplant. 2009;9(3):527‐535. [DOI] [PubMed] [Google Scholar]
- 3. Wekerle T, Segev D, Lechler R, Oberbauer R. Strategies for long‐term preservation of kidney graft function. Lancet. 2017;389(10084):2152‐2162. [DOI] [PubMed] [Google Scholar]
- 4. Süsal C, Aykut G, Morath C, et al. Relevance of donor‐specific antibody monitoring after kidney transplantation: findings from the collaborative transplant study and the Heidelberg transplant center. HLA. 2019;94:11‐15. [DOI] [PubMed] [Google Scholar]
- 5. Reinders ME, de Fijter JW, Rabelink TJ. Mesenchymal stromal cells to prevent fibrosis in kidney transplantation. Curr Opin Organ Transplant. 2014;19(1):54‐59. [DOI] [PubMed] [Google Scholar]
- 6. Casiraghi F, Remuzzi G, Perico N. Mesenchymal stromal cells to promote kidney transplantation tolerance. Curr Opin Organ Transplant. 2014;19(1):47‐53. [DOI] [PubMed] [Google Scholar]
- 7. Perico N, Casiraghi F, Gotti E, et al. Mesenchymal stromal cells and kidney transplantation: pretransplant infusion protects from graft dysfunction while fostering immunoregulation. Transpl Int. 2013;26(9):867‐878. [DOI] [PubMed] [Google Scholar]
- 8. Reinders MEJ, de Fijter JW, Roelofs H, et al. Autologous bone marrow‐derived mesenchymal stromal cells for the treatment of allograft rejection after renal transplantation: results of a phase I study. Stem Cells Transl Med. 2013;2(2):107‐111. [DOI] [PMC free article] [PubMed] [Google Scholar]
- 9. Mudrabettu C, Kumar V, Rakha A, et al. Safety and efficacy of autologous mesenchymal stromal cells transplantation in patients undergoing living donor kidney transplantation: a pilot study. Nephrology. 2015;20(1):25‐33. [DOI] [PubMed] [Google Scholar]
- 10. Stolzing A, Jones E, McGonagle D, Scutt A. Age‐related changes in human bone marrow‐derived mesenchymal stem cells: consequences for cell therapies. Mech Ageing Dev. 2008;129(3):163‐173. [DOI] [PubMed] [Google Scholar]
- 11. Avivar‐Valderas A, Martín‐Martín C, Ramírez C, et al. Dissecting allo‐sensitization after local administration of human allogeneic adipose mesenchymal stem cells in perianal fistulas of Crohn's disease patients. Front Immunol. 2019;10:1244. [DOI] [PMC free article] [PubMed] [Google Scholar]
- 12. Peng Y, Ke M, Xu LU, et al. Donor‐derived mesenchymal stem cells combined with low‐dose tacrolimus prevent acute rejection after renal transplantation: a clinical pilot study. Transplantation. 2013;95(1):161‐168. [DOI] [PubMed] [Google Scholar]
- 13. Erpicum P, Weekers L, Detry O, et al. Infusion of third‐party mesenchymal stromal cells after kidney transplantation: a phase I‐II, open‐label, clinical study. Kidney Int. 2019;95(3):693‐707. [DOI] [PubMed] [Google Scholar]
- 14. Alagesan S, Griffin MD. Autologous and allogeneic mesenchymal stem cells in organ transplantation: what do we know about their safety and efficacy? Current Opinion in Organ Transplantation. 2014;19(1):65‐72. [DOI] [PubMed] [Google Scholar]
- 15. Reinders MEJ, Dreyer GJ, Bank JR, et al. Safety of allogeneic bone marrow derived mesenchymal stromal cell therapy in renal transplant recipients: the neptune study. J Transl Med. 2015;13:344. [DOI] [PMC free article] [PubMed] [Google Scholar]
- 16. Streitz M, Miloud T, Kapinsky M, et al. Standardization of whole blood immune phenotype monitoring for clinical trials: panels and methods from the ONE study. Transplant Res. 2013;2(1):17. [DOI] [PMC free article] [PubMed] [Google Scholar]
- 17. Hoogduijn MJ, Roemeling‐van Rhijn M, Engela AU, et al. Mesenchymal stem cells induce an inflammatory response after intravenous infusion. Stem Cells Dev. 2013;22(21):2825‐2835. [DOI] [PubMed] [Google Scholar]
- 18. Soman RS, Zahir H, Akhlaghi F. Development and validation of an HPLC‐UV method for determination of iohexol in human plasma. J Chromatogr B Analyt Technol Biomed Life Sci. 2005;816(1–2):339‐343. [DOI] [PubMed] [Google Scholar]
- 19. Roufosse C, Simmonds N, Clahsen‐van Groningen M, et al. A 2018 reference guide to the Banff classification of renal allograft pathology. Transplantation. 2018;102(11):1795‐1814. [DOI] [PMC free article] [PubMed] [Google Scholar]
- 20. Grimm PC, Nickerson P, Gough J, et al. Computerized image analysis of Sirius Red‐stained renal allograft biopsies as a surrogate marker to predict long‐term allograft function. J Am Soc Nephrol. 2003;14(6):1662‐1668. [DOI] [PubMed] [Google Scholar]
- 21. Moes D, van der Bent SAS, Swen JJ, et al. Population pharmacokinetics and pharmacogenetics of once daily tacrolimus formulation in stable liver transplant recipients. Eur J Clin Pharmacol. 2016;72(2):163‐174. [DOI] [PMC free article] [PubMed] [Google Scholar]
- 22. Verduyn W, Doxiadis IIN, Anholts J, et al. Biotinylated DRB sequence‐specific oligonucleotides. Comparison to serologic HLA‐DR typing of organ donors in eurotransplant. Hum Immunol. 1993;37(1):59‐67. [DOI] [PubMed] [Google Scholar]
- 23. Perico N, Casiraghi F, Introna M, et al. Autologous mesenchymal stromal cells and kidney transplantation: a pilot study of safety and clinical feasibility. Clin J Am Soc Nephrol. 2011;6(2):412‐422. [DOI] [PMC free article] [PubMed] [Google Scholar]
- 24. Reinders MEJ, Bank JR, Dreyer GJ, et al. Autologous bone marrow derived mesenchymal stromal cell therapy in combination with everolimus to preserve renal structure and function in renal transplant recipients. J Transl Med. 2014;12:331. [DOI] [PMC free article] [PubMed] [Google Scholar]
- 25. Haynes R, Harden P, Judge P, et al. Alemtuzumab‐based induction treatment versus basiliximab‐based induction treatment in kidney transplantation (the 3C Study): a randomised trial. Lancet (London, UK). 2014;384(9955):1684‐1690. [DOI] [PubMed] [Google Scholar]
- 26. Perico N, Casiraghi F, Todeschini M, et al. Long‐term clinical and immunological profile of kidney transplant patients given mesenchymal stromal cell immunotherapy. Front Immunol. 2018;9:1359. [DOI] [PMC free article] [PubMed] [Google Scholar]
- 27. Luk F, de Witte SF, Bramer WM, Baan CC, Hoogduijn MJ. Efficacy of immunotherapy with mesenchymal stem cells in man: a systematic review. Expert Rev Clin Immunol. 2015;11(5):617‐636. [DOI] [PubMed] [Google Scholar]
- 28. Asari S, Itakura S, Ferreri K, et al. Mesenchymal stem cells suppress B‐cell terminal differentiation. Exp Hematol. 2009;37(5):604‐615. [DOI] [PMC free article] [PubMed] [Google Scholar]
- 29. Todeschini M, Cortinovis M, Perico N, et al. In kidney transplant patients, alemtuzumab but not basiliximab/low‐dose rabbit anti‐thymocyte globulin induces B cell depletion and regeneration, which associates with a high incidence of de novo donor‐specific anti‐HLA antibody development. J Immunol. 2013;191(5):2818‐2828. [DOI] [PubMed] [Google Scholar]
- 30. Ekberg H, Tedesco‐Silva H, Demirbas A, et al. Reduced exposure to calcineurin inhibitors in renal transplantation. N Engl J Med. 2007;357(25):2562‐2575. [DOI] [PubMed] [Google Scholar]
Associated Data
This section collects any data citations, data availability statements, or supplementary materials included in this article.
Supplementary Materials
Fig S1
Supplementary Material
Supplementary Material
Data Availability Statement
The data that support the findings of this study are available from the corresponding author upon reasonable request.


