

Abstract
Aims
Limited knowledge exists on the preferences of people with Type 2 diabetes towards diabetes care. Consequently, these care preferences cannot yet be considered in the development of tailored diabetes care approaches. Therefore, this study aimed to assess care preferences and their determinants in people with Type 2 diabetes.
Methods
A discrete choice experiment was conducted to elicit people's preferences. People with Type 2 diabetes, treated in 30 Dutch primary care practices, were asked to choose repeatedly between two hypothetical diabetes care packages, which differed in six attributes: role division in daily diabetes care planning, lifestyle education method, type of medication management support, consultation frequency, emotional support and time spend on self‐management. A mixed‐logit model was used to estimate the relative importance of the included attributes. Preference heterogeneity among people with different person‐ and disease‐related characteristics was investigated.
Results
In total, 288 participants completed the experiment. They preferred to plan their daily diabetes care together with a healthcare provider, to receive individual lifestyle education, medication and emotional support from a healthcare provider, one consultation visit every 3 months and to spend less time on self‐management. Participants did not prefer to receive emotional support from a psychologist. Heterogeneity in preferences could partly be explained by differences in sex, education level and glucose‐lowering drug use.
Conclusion
People with Type 2 diabetes show a preference for traditional care models. Emotional support was identified by participants as the most important attribute. It is therefore important to adequately guide them when changes in diabetes care organization are implemented.
What's new?
There is increasing consensus that the preferences of people with Type 2 diabetes should be used to develop tailored diabetes care approaches.
In this study, participants with Type 2 diabetes clearly indicated that they did not prefer to receive emotional support from a psychologist and preferred traditional care models, such as one consultation every 3 months.
The information from this study can be used to tailor Type 2 diabetes care by identifying subgroups of people with Type 2 diabetes with varying preferences towards Type 2 diabetes care, and can potentially lead to more person‐centred care.
Introduction
In the Netherlands, around one million people (6%) currently live with diabetes, of whom ~ 94% have Type 2 diabetes 1. The majority (85%) are treated in primary care by a team consisting of a general practitioner (GP) and a practice nurse 1, 2, 3, 4. In general, primary care providers strictly adhere to the guidelines from the Dutch college of General Practitioners on Type 2 diabetes and the Dutch Diabetes Federation Health Care Standard for Type 2 diabetes 3, 5, 6. These care protocols recommend primary healthcare providers to monitor people with Type 2 diabetes two to four times per year, including an annual check‐up by the GP.
Internationally, Dutch diabetes care is considered to be of very high quality, mainly due its multidisciplinary approach 5, but it also has its drawbacks. Barring some exceptions for older people, the diabetes guidelines are highly standardized 3. This is in contrast to National Institute for Health and Care Excellence (NICE) guidelines in the UK and the latest consensus report by the American Diabetes Association and the European Association for the Study of Diabetes on the management of Type 2 diabetes, which are more lenient towards the type of glucose‐lowering drugs that are prescribed 7, 8. Not all people seem to benefit from this ‘one‐size‐fits‐all’ approach, leading to differential treatment effects 9. Furthermore, current Type 2 diabetes care places a heavy financial burden on society, health systems, individuals and employees 10. Thus, ways need to be found to provide the right care, to the right person, at the right time, creating more sustainable diabetes care.
There is increasing consensus that person‐centred care, defined as ‘care that is respectful of and responsive to individual patient care preferences, needs, and values and ensuring that patient values guide all clinical decisions’ 11, could prevent the over‐, under‐ and misuse of diabetes care, and improve the management of Type 2 diabetes 12. Individual care preferences, defined as what people want from their health care 13, can help healthcare providers and those they care for develop mutually accepted treatment goals leading to improved health outcomes 13. The number of studies on care preferences of people with Type 2 diabetes has increased substantially in the past decade 14. However, most of these studies assessed pharmaceutical care preferences, such as dosing schedule and risk of side effects 15. Limited knowledge exists on the preferences of people with Type 2 diabetes related to more general treatment attributes, such as the frequency of consultations or emotional support. Consequently, these care preferences cannot yet be considered in the development of tailored diabetes care approaches. Therefore, the first aim of this study was to assess the preferences of people with Type 2 diabetes towards the non‐pharmaceutical aspects of diabetes care using a discrete choice experiment. Because people often have diverse preferences for healthcare interventions and preferences tend to change through the course of an illness 16, the second aim was to examine whether these preferences are characterized by heterogeneity, and if so, the extent to which this heterogeneity could be explained by relevant characteristics of people with Type 2 diabetes.
Participants and methods
Population and study design
Eighty‐four primary care practices in Maastricht and surrounding areas, in the south of the Netherlands, received an email asking for permission to invite people with Type 2 diabetes in their practices to participate in the study. Thirty practices were willing to participate. The practices were also asked to provide data from their electronic health register on participants’ biomedical characteristics (BMI, HbA1c, triglycerides and prescriptions of glucose‐lowering drugs) and date of diabetes diagnosis. Subsequently, participants received an invitation via regular mail including a letter containing information about the study, an informed consent document, a discrete choice experiment survey to elicit their preferences, a questionnaire on their background characteristics and a return envelope. One month after the first mailing, a reminder was sent via regular mail to those who had not returned the informed consent document and/or the questionnaires. Data collection took place from October to December 2017. Approval of the study was obtained from the Medical Ethical Committee of the Maastricht University Medical Center (METC 17‐04‐104).
Discrete choice experiment
A discrete choice experiment is an increasingly used method of eliciting participants’ preferences in health care 17. In a discrete choice experiment, participants have to answer a series of choice tasks. Each choice task consists of at least two scenarios with several attributes (e.g. frequency of consultations and emotional support approach) that vary along different levels (e.g. one consultation every 6 months or yearly consultations). Participants are asked to choose the preferred scenario in each choice task.
Identification of attributes and levels
In this study, a three‐step process was followed to identify the attributes. First, a list of diabetes care attributes was compiled by conducting a literature review on preferences of people towards diabetes care regarding non‐pharmaceutical treatment attributes. Second, to complement the attribute list, five telephone interviews with healthcare providers were held. Attributes were identified by asking healthcare providers to describe the steps they take during consultations with people with Type 2 diabetes. Third, three focus groups, each with four to six participants with Type 2 diabetes, were organized to determine the most important attributes of diabetes care. During the focus groups, the list of previously identified attributes (based on steps 1 and 2) was presented. In addition, participants were asked to name attributes of diabetes care that were not included on the list. The final list comprised > 10 potential attributes for inclusion. However, to ensure that participants were able to consider all attributes listed when making their choice, most discrete choice experiments contain fewer than 10 attributes 18. To scale back the attribute list, the nominal group technique was used: participants in the focus groups were asked to individually select a top five of attributes from the final list 19. These attributes were awarded points: from 5 points for the most important attribute to 1 point for the least important attribute. Per attribute, the mean importance score was then calculated by dividing the total awarded points per attribute by the total number of participants in all focus groups. This process led to the inclusion of six attributes (role division in daily diabetes care planning, lifestyle education method, type of medication management support, consultation frequency, emotional support and time spend on self‐management) with three to four levels each (Table 1). The levels were discussed and determined by the researchers (DH, AE and MB), taking into account their clinical plausibility. In a face‐to‐face pilot study including eight participants with Type 2 diabetes, participants’ understanding of the attributes and levels was tested, as well as the task complexity and length of the discrete choice experiment questionnaire. Minor adjustments to some levels of the attributes were made accordingly.
Table 1.
Attributes and levels used in the discrete choice experiment
| Attribute | Levels |
|---|---|
| Role division in diabetes care planning | Person with Type 2 diabetes and healthcare provider |
| Person with Type 2 diabetes | |
| Healthcare provider only | |
| Lifestyle education method | Individual education |
| Group education | |
| Digital education (app or website) | |
| Type of medication management support | Via healthcare provider |
| Via aid (app, website, medicine box) | |
| No help | |
| Consultation frequency | One visit every 2 months with practice nurse |
| One visit every 3 months with practice nurse | |
| One visit every 6 months with general practitioner | |
| Yearly visit with GP | |
| Emotional support approach | GP or practice nurse |
| Psychologist | |
| No emotional support | |
| Time spend on self‐management | 30 min |
| 1 h | |
| 2 h |
GP, general practitioner.
Experimental design
The attributes and levels were combined to construct choice tasks. Ngene was used to create a Bayesian efficient design to maximize the D‐efficiency (a summary measure of the variance covariance matrix) of the chosen choice tasks. By incorporating prior information about the preferences of the attribute levels (positive or negative sign) the precision of the estimated parameters for a given number of choice tasks was maximized, thus increasing the statistical efficiency of the design. The prior information was derived from the pilot results. The D‐score of our design was 0.16.
Instrumental design
The design contained 30 choice tasks and was blocked into three 10‐choice task survey versions. Participants were randomly assigned to one of the three survey versions. In each choice task, participants had to choose between two care plans (A and B). The fourth choice task was repeated at the end of the discrete choice experiment survey to assess the test–retest reliability of participants’ choices. Thus, each participant received a total of 11 choice tasks. Participants who answered < 50% of the choice tasks were excluded from the analysis (see Fig 1 for an example of a choice task).
Figure 1.
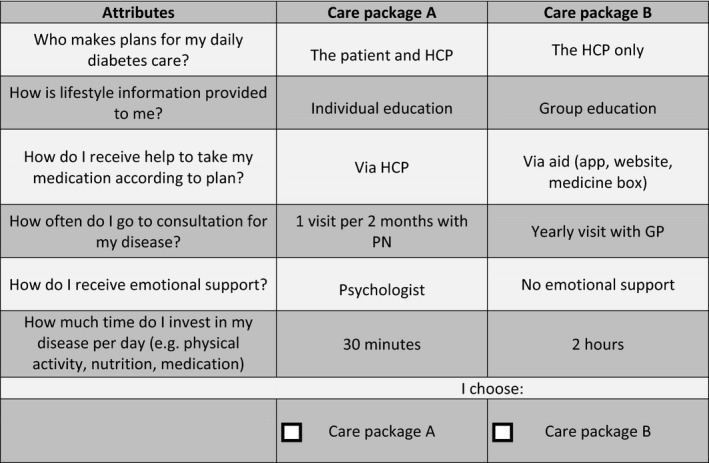
Example of a discrete choice experiment choice task. HCP, healthcare provider; PN, practice nurse; GP, general practitioner.
Statistical analyses
Participants’ characteristics are presented as means (sd) for continuous variables and counts and percentages for dichotomous variables. Descriptive statistics were performed in RStudio version 1.0.153 (Boston, MA, USA).
For the discrete choice experiment, a panel mixed‐logit model was estimated, allowing for determination of the mean preferences of the sample. The level of each attribute that was most similar to current guideline‐informed diabetes care in the Netherlands was used as the reference attribute parameter. A positive regression coefficient (β) suggests that participants prefer more of that level within an attribute, whereas a negative coefficient suggests that participants prefer less of that level within an attribute. To determine the relevant importance of each attribute, the relative importance score was calculated based on the difference between the highest and lowest coefficients of each attribute divided by the total amount of these differences. A significant (P < 0.05) standard deviation (sd) of the attribute levels indicates preference heterogeneity.
In subgroup analyses, preliminary joint models were estimated using interaction terms to investigate potential preference heterogeneity among people with different person‐ and disease‐related characteristics. Person‐related characteristics included age (< 65 and ≥ 65 years), sex and education level (low/medium and high). Disease‐related characteristics included glucose‐lowering drugs (diet with or without oral glucose‐lowering drugs and insulin with or without oral glucose‐lowering drugs), Type 2 diabetes duration (recently diagnosed, i.e. ≤ 5 years, and long‐standing, i.e. > 5 years), and predicted glycaemic control trajectory (stable, adequate glycaemic control, improved glycaemic control and deteriorated glycaemic control trajectory). Participants’ glycaemic control trajectories were predicted using a risk score (including BMI, HbA1c and plasma triglycerides measured ± 3 months from diagnosis) that was previously developed to stratify people with recently diagnosed diabetes into one of the three glycaemic control trajectories 20. Because of the low number of participants in the deteriorated glycaemic control trajectory (n = 6), this group was not included in the subgroup analysis. Parameters estimated for the interaction terms that are statistically different from zero (5% level) indicate a difference in preference between subgroups. The discrete choice experiment analyses were performed in NLOGIT version 5.
For further details regarding the analysis, see the Supporting Information.
Results
Thirty (35.7%) care practices gave permission to invite a total of 929 people with Type 2 diabetes. Of these, 24 people had an incorrect address and four lived in Belgium. Thus, 901 people received an invitation (Fig. 2). Of these, 288 participants answered ≥ 50% of the choice tasks. In total, 80% of participants passed the test–retest task. Their preferences did not differ from those who did not pass the test. Therefore, all 288 participants were included in the analyses. The average age of the participants was 67.4 (sd 10.7) years, 65% were men, and more than two‐thirds (72%) had a low or medium education level. Further characteristics of the population are presented in Table 2.
Figure 2.
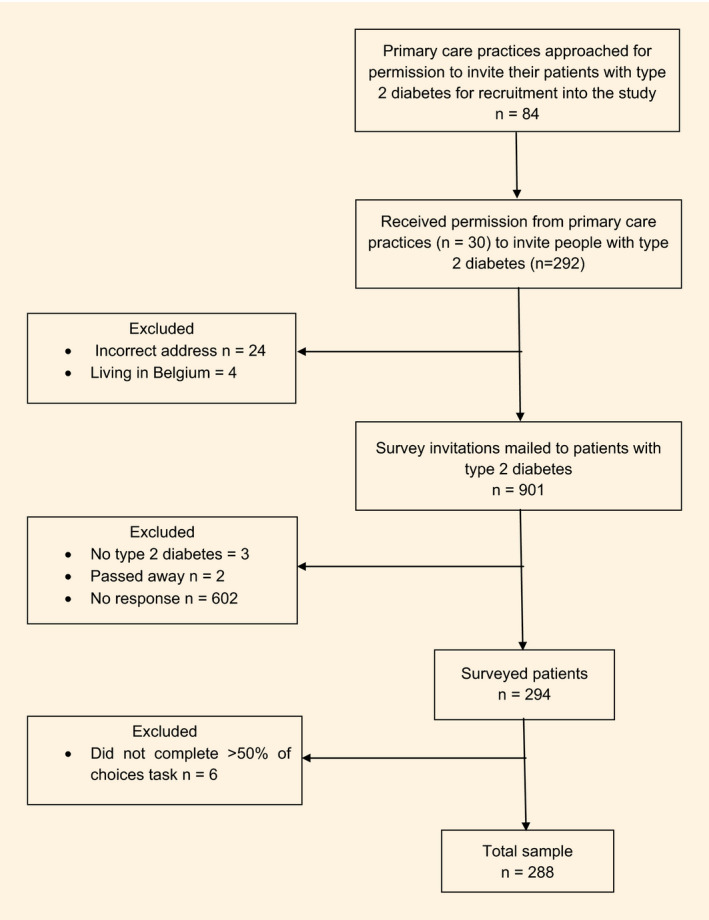
Study flow chart.
Table 2.
Demographic and clinical characteristics of the study population
| Characteristic | Participants (n = 288) |
|---|---|
| Age, mean (sd) | 67.4 (10.7) |
| Age, n (%) | |
| ≥ 65 years | 168 (58.9) |
| Missing, n | 3 |
| Men, n (%) | 187 (64.9) |
| Missing, n | 0 |
| Country of birth, n (%) | |
| The Netherlands | 240 (90.6) |
| Other | 25 (9.4) |
| Missing, n | 23 |
| Education | |
| Low/medium | 188 (72.0) |
| High | 73 (28.0) |
| Missing, n | 27 |
| BMI, kg/m2, mean (sd) | 30.4 (5.0) |
| Missing, n | 0 |
| HbA1c, mmol/mol, mean (sd) | 52.0 (10.0) |
| HbA1c, % (sd) | 6.8 (3.0) |
| Missing, n | 0 |
| Triglycerides, mmol/l, mean (sd) | 2.1 (1.2) |
| Not recorded, n | 1 |
| Diabetes duration, n (%) | |
| Recently diagnosed Type 2 diabetes (≤ 5 years) | 174 (60.4) |
| Long‐standing Type 2 diabetes (>5 years) | 114 (39.6) |
| Missing, n | 0 |
| Diabetes medication, n (%) | |
| Diet and/or oral glucose‐lowering drugs | 206 (84.8) |
| Oral glucose‐lowering drugs and insulin | 37 (15.2) |
| Missing, n | 45 |
| Glycaemic control trajectory, n (%) | |
| Stable, adequate glycaemic control | 75 (77.3) |
| Improved glycaemic control | 16 (6.0) |
| Deteriorated glycaemic control | 6 (6.2) |
| Missing, n | 191 |
Low/medium education: elementary, preparatory, secondary vocational, senior general secondary education or senior secondary vocational education; high education: pre‐university, higher professional or academic education.
Diabetes care preferences in the overall population
The results from the panel mixed‐logit model are presented in Table 3. Participants showed a preference for planning their daily diabetes care together with a healthcare provider and did not prefer to plan their daily diabetes care by themselves. They preferred individual‐based lifestyle education provided by a healthcare provider over group‐based lifestyle education. Participants preferred medication management support from a healthcare provider, but not by an aid (i.e. an app, website or medicine box). Of the different possibilities in consultation frequency, participants preferred one visit every 3 months with a practice nurse. They did not prefer yearly consultation visits or one consultation every 6 months with a GP. They preferred receiving emotional support from a GP or practice nurse, but they clearly indicated wanting to avoid emotional support delivered by a psychologist. This attribute had the highest negative β (−0.68). When deciding on their diabetes care preferences, participants were mostly driven by emotional support (mean relative importance: 25.4%) and frequency of consultations (mean relative importance: 24.2%). The statistically significant standard deviation for all but three attribute levels (digital education, one visit every 2 months with practice nurse, and no emotional support), indicated that there was significant preference heterogeneity within the population.
Table 3.
Results from the panel mixed logit model
| Attribute | Preference estimates | Mean relative importance (%) | ||
|---|---|---|---|---|
| Coefficient | 95% CI | |||
| Role division in diabetes care planning | 16.3 | |||
| Person with Type 2 diabetes and healthcare provider (reference) | Mean | 0.37 | 0.13 to 0.61 | |
| sd | – | – | ||
| Person with Type 2 diabetes | Mean | −0.41 | −0.54 to −0.28 | |
| sd | 0.55 | 0.40 to 0.70 | ||
| Healthcare provider | Mean | 0.04 | −0.07 to 0.15 | |
| sd | 0.22 | −0.02 to 0.46 | ||
| Lifestyle education method | 18.1 | |||
| Individual education (reference) | Mean | 0.43 | 0.23 to 0.63 | |
| sd | – | – | ||
| Group education | Mean | −0.44 | −0.54 to −0.33 | |
| sd | 0.22 | 0.03 to 0.41 | ||
| Digital education | Mean | 0.01 | −0.09 to 0.10 | |
| sd | 0.11 | −0.13 to 0.35 | ||
| Type of medication management support | 8.5 | |||
| Via healthcare provider (reference) | Mean | 0.22 | 0.00 to 0.44 | |
| sd | – | – | ||
| Via aid (app, website, medicine box) | Mean | −0.19 | −0.30 to −0.08 | |
| sd | 0.23 | 0.01 to 0.45 | ||
| No help | Mean | −0.03 | −0.14 to 0.08 | |
| sd | 0.35 | 0.17 to 0.52 | ||
| Consultation frequency | 24.2 | |||
| One visit every 3 months with practice nurse (reference) | Mean | 0.55 | 0.13 to 0.97 | |
| sd | – | – | ||
| One visit every 2 months with practice nurse | Mean | 0.20 | 0.07 to 0.33 | |
| sd | 0.08 | −0.21 to 0.38 | ||
| One visit every 6 months with GP | Mean | −0.15 | −0.27 to −0.02 | |
| sd | 0.37 | 0.15 to 0.58 | ||
| Yearly visit with GP | Mean | −0.61 | −0.77 to −0.44 | |
| sd | 0.69 | 0.50 to 0.88 | ||
| Emotional support | 25.4 | |||
| GP or practice nurse (reference) | Mean | 0.54 | 0.26 to 0.81 | |
| sd | – | – | ||
| Psychologist | Mean | −0.68 | −0.81 to −0.54 | |
| sd | 0.37 | 0.20 to 0.54 | ||
| No emotional support | Mean | 0.14 | −0.00 to 0.28 | |
| sd | 0.09 | −0.57 to 0.75 | ||
| Time spend on self‐management* | Mean | −0.004 | −0.006 to −0.002 | 7.5 |
| sd | 0.01 | 0.009 to 0.01 | ||
CI, confidence interval; GP, general practitioner.
The time spend on self‐management attribute was coded as a continuous variable in the choice model. Nevertheless, in the choice tasks it was presented at three possible levels: 30 minutes, 1 hour and 2 hours.
Subgroup analysis
Subgroup analyses indicated that the observed heterogeneity in the discrete choice experiment was (at least in part) explained by age, sex, education level and type of glucose‐lowering drugs (Tables S1–S6).
Men least preferred planning their daily diabetes care by themselves (β men −0.54 vs. β women −0.19; P = 0.016). Preference for having their daily diabetes care planned by a healthcare provider, was also stronger and statistically significant for men compared to women (β men 0.16 vs. β women −0.14; P = 0.012)Participants treated with glucose‐lowering drugs had a preference to let their GP plan their daily diabetes care. This preference was stronger for participants treated with insulin (β treated with oral glucose lowering drugs 0.02 vs. β treated with insulin 0.23; P = 0.032). Participants treated with insulin also significantly did not prefer to plan their daily diabetes care by themselves to the same degree as participants using oral glucose‐lowering drugs (β treated with oral glucose lowering drugs −0.33 vs. β treated with insulin −0.85; P = 0.007). In terms of medication management support, participants treated with insulin preferred less not receiving any support, whereas participants treated with oral glucose‐lowering drugs were indecisive about their preference for medication management support (β treated with oral glucose lowering drugs 0.02 vs β treated with insulin −0.38; P = 0.021). Participants with a high education level preferred to receive digital lifestyle education, in contrast to participants with low and medium education levels who least preferred receiving digital lifestyle education (β high education 0.17 vs. β low/medium education −0.05; P = 0.030).
No significant differences in preference estimates were found according to age (< 65, ≥ 65), diabetes duration (recently diagnosed, long standing) and predicted glycaemic control trajectories (stable adequate, improved).
Discussion
In this study, preferences of people with Type 2 diabetes for their diabetes care were investigated using a discrete choice experiment. Our outcomes can be helpful to provide person‐centred Type 2 diabetes care.
Previous research has shown that people's preferences regarding health care are influenced by their experience of care 21. In the Netherlands, people seem to be satisfied with the primary health care they receive, with more than 85% of people claiming to have confidence in their GP 22. It is therefore not surprising that our participants preferred to receive current care, such as one consultation visit per 3 months. Another reason for the preference towards current care could be that people who receive care do not know what they want beyond what they already know. In past qualitative research, people were unable to describe the role of the practice nurse beyond clinical checks and they indicated not knowing what else they could expect from their practice nurse 23. Nevertheless, health care needs to adapt to the growing number of people with chronic disease by moving from a standardized to a more personalized approach 11, 24. Previous research has shown that most people with Type 2 diabetes are able to maintain adequate glycaemic control when consultations with healthcare providers are reduced 25. Such changes in diabetes care organization are needed to keep health care sustainable. Taking into consideration that people with Type 2 diabetes prefer current care, it is important to discuss these changes with them when implemented.
In the current study, emotional support was identified as the most important attribute. Strikingly, our participants clearly indicated that they did not prefer to receive emotional support from a psychologist, even though mental health problems and Type 2 diabetes frequently occur together 26. It is possible that the prevalence of mental health problems in the current study was low, because of the relatively low average HbA1c values in this study (i.e. 52 mmol/mol; 7%). Hyperglycaemia and mental health disorders are positively correlated 27. Moreover, care from a GP/practice nurse is viewed as more accessible, more comprehensive, because it manages both physical and mental problems, and less stigmatizing compared with care from a psychologist 28, which might also explain why participants showed a preference for receiving emotional support from a GP or practice nurse.
Participants in this study preferred individual over group lifestyle education. The few non‐pharmaceutical preference studies that have previously been conducted, found the same result 29, 30. However, the literature is indecisive when it comes to the best education method for people with Type 2 diabetes 31. Both individual as well as group education methods have been shown to improve glycaemic control. In this respect, it would be preferable to give people the option of whether they want to learn individually or in a group.
Participants also preferred one visit every 2 or 3 months over one visit every 6 months. However, it is frequently presumed that due to the digital revolution, face‐to‐face interactions with healthcare providers will become less common and exchanges will increasingly be mediated by electronic devices 32. Although innovations in e‐health technology have the potential to improve access to many types of healthcare services, it needs to be understood that connectivity and comfort levels with e‐health applications differ between individuals 33. Indeed, subgroup analyses in this study revealed that participants with lower education levels had a tendency towards wanting to avoid digital lifestyle education.
Other explanations for the observed preference heterogeneity were sex and type of glucose‐lowering drugs. Men and participants treated with insulin had a stronger aversion to planning their daily diabetes care by themselves compared with women and participants treated with oral glucose‐lowering drugs, respectively. For participants treated with insulin, this seems self‐evident because insulin use requires more knowledge and skills 34. A possible explanation for the difference found between men and women could be that more men than women with Type 2 diabetes live alone (considering the facts that there are more men than women with Type 2 diabetes and that more men than women live alone) 35. Socially isolated individuals are more likely to have newly diagnosed and prevalent Type 2 diabetes 36.
This study has several strengths and limitations. One of the major strengths is the use of a discrete choice experiment to elicit people's preferences. This method takes trade‐offs into account, which are difficult to measure in other methods, such as simple rating scale exercises 17. It has, however, been criticized for being too difficult to understand 37. This can lead to inaccurate choices that do not reflect true preferences and, as a recent meta‐analysis revealed, affect response rates 38, which might have led to selective non‐response. Deciding about health‐related services is different and more complex than other, more everyday decisions, such as where to buy a bike or what to order for lunch. To improve the comprehension of the discrete choice experiment and the precision of the parameter estimates in this study, a face‐to‐face pilot study was conducted and an explanation on how to complete the choice tasks was provided, as well as an example choice task. In total, 80% of participants passed the test–retest task, which provides an indication that the true preferences of the participants are reflected in this discrete choice experiment. Another strength of our study is the participation of multiple primary care practices. These practices were located in different neighbourhoods, thereby representing people with various socio‐economic backgrounds. However, our study only included participants from the south of the Netherlands. Compared with other parts of the Netherlands, the south has a predominantly Caucasian population. It is therefore unclear to what extent the preferences of the participants in our study represent the preferences of the general population with Type 2 diabetes of the Netherlands or elsewhere.
Conclusion
Emotional support was identified as the most important attributes to the participants in this study, followed by frequency of consultations. In future research, it would therefore be interesting to compare diabetes care preferences between people with and without mental health problems. Furthermore, this discrete choice experiment revealed that people with Type 2 diabetes prefer to receive the care they currently receive. Therefore, it is important to adequately guide people when changes in diabetes care are implemented to keep healthcare sustainable. Heterogeneity in preferences was detected and could be explained by differences in sex, education level and type of glucose‐lowering drugs. This information can be used to tailor Type 2 diabetes care by identifying subgroups of people with varying preferences towards Type 2 diabetes care. For example, digital lifestyle education could replace some of the consultation visits for people with high education levels, whereas people with lower education levels might benefit more from frequent individual lifestyle education with a healthcare provider. This could potentially lead to more person‐centred care.
Funding sources
This research was supported by a grant from Novo Nordisk B.V.
Competing interests
None declared.
Supporting information
Doc. S1. Detailed description analysis.
Table S1. Results from the panel mixed logit model stratified on age.
Table S2. Results from the panel mixed logit model stratified on sex.
Table S3. Results from the panel mixed logit model stratified on education level.
Table S4. Results from the panel mixed logit model stratified on diabetes medication.
Table S5. Results from the panel mixed logit model stratified on diabetes duration.
Table S6. Results from the panel mixed logit model stratified on glycaemic control trajectory.
Acknowledgements
This research was supported by a grant from Novo Nordisk B.V. The study sponsor was not involved in the design of the study or the collection, analysis, and interpretation of data; writing the report; or the decision to submit the report for publication.
Diabet. Med. 37, 1807–1815(2020)
References
- 1. Kleefstra N, Landman GW, Van Hateren KJ, Meulepas M, Romeijnders A, Rutten GE et al Dutch diabetes prevalence estimates (DUDE‐1). J Diabetes 2016; 8: 863–865. [DOI] [PubMed] [Google Scholar]
- 2. Hek K, Ursum J, Tol J, Verheij RA. Eerstelijnszorggebruik voor diabetes: een overzicht. Nivel Zorgregistraties eerste lijn, 2016. Available at https://www.nivel.nl/nl/zorgregistraties-eerste-lijn/zorggebruik-de-eerste-lijn Last accessed 25 April 2019.
- 3. Nederlands huisartsen genootschap . NHG‐standaard Diabetes mellitus type 2 (vierde (partitiële) herziening), 2018. Available at https://www.nhg.org/standaarden/volledig/nhg-standaard-diabetes-mellitus-type-2 Last accessed 25 April 2019.
- 4. Bakker K, Bilo HJG. Diabetes care in the Netherlands: now and in the future. Pract Diab Int 2004; 21: 88–91. [Google Scholar]
- 5. Cebolla Garrofé B, Björnberg A, Yung Phang A. Euro Diabetes Index 2014. Marseillan, France: Health Consumer Powerhouse Ltd; 2014. [Google Scholar]
- 6. Netherlands Diabetes Federation . NDF Care Standard. Transparancy and Quality of Diabetes Care for People with Diabetes Type 2 [NDF Zorgstandaard. Transparantie en kwaliteit van diabeteszorg voor mensen met type 2 diabetes] Amersfoort, the Netherlands: Netherlands Diabetes Federation; 2015. [Google Scholar]
- 7. National Institute for Health and Care Excellence (NICE) Managing Blood Glucose in Adults with Type 2 Diabetes. London: NICE, 2018. [Google Scholar]
- 8. Davies MJ, D'Alessio DA, Fradkin J, Kernan WN, Mathieu C, Mingrone G et al Management of hyperglycaemia in type 2 diabetes, 2018. A consensus report by the American Diabetes Association (ADA) and the European Association for the Study of Diabetes (EASD). Diabetologia 2018; 61: 2461–2498. [DOI] [PubMed] [Google Scholar]
- 9. Elissen AM, Duimel‐Peeters IG, Spreeuwenberg C, Spreeuwenberg M, Vrijhoef HJ. Toward tailored disease management for type 2 diabetes. Am J Manag Care 2012; 18: 619–630. [PubMed] [Google Scholar]
- 10. Seuring T, Archangelidi O, Suhrcke M. The economic costs of Type 2 diabetes: a global systematic review. Pharmacoeconomics 2015; 33: 811–831. [DOI] [PMC free article] [PubMed] [Google Scholar]
- 11. Institute of Medicine (U.S.). Committee on Quality of Health Care in America . Crossing the Quality Chasm : A New Health System for the 21st Century. Washington, DC: National Academy Press, 2001. [Google Scholar]
- 12. Inzucchi SE, Bergenstal RM, Buse JB, Diamant M, Ferrannini E, Nauck M et al Management of hyperglycemia in type 2 diabetes: a patient‐centered approach: position statement of the American Diabetes Association (ADA) and the European Association for the Study of Diabetes (EASD). Diabetes Care 2012; 35: 1364–1379. [DOI] [PMC free article] [PubMed] [Google Scholar]
- 13. Street RL Jr, Elwyn G, Epstein RM. Patient preferences and healthcare outcomes: an ecological perspective. Expert Rev Pharmacoecon Outcomes Res 2012; 12: 167–180. [DOI] [PubMed] [Google Scholar]
- 14. Joy SM, Little E, Maruthur NM, Purnell TS, Bridges JF. Patient preferences for the treatment of type 2 diabetes: a scoping review. Pharmacoeconomics 2013; 31: 877–892. [DOI] [PubMed] [Google Scholar]
- 15. Purnell TS, Joy S, Little E, Bridges JF, Maruthur N. Patient preferences for noninsulin diabetes medications: a systematic review. Diabetes Care 2014; 37: 2055–2062. [DOI] [PMC free article] [PubMed] [Google Scholar]
- 16. Say RE, Thomson R. The importance of patient preferences in treatment decisions–challenges for doctors. BMJ 2003; 327: 542–545. [DOI] [PMC free article] [PubMed] [Google Scholar]
- 17. Lancsar E, Louviere J. Conducting discrete choice experiments to inform healthcare decision making: a user's guide. Pharmacoeconomics 2008; 26: 661–677. [DOI] [PubMed] [Google Scholar]
- 18. DeShazo JR, Fermo G. Designing choice sets for stated preference methods: the effects of complexity on choice consistency. J Environ Econ Manag 2002; 44: 123–143. [Google Scholar]
- 19. Hiligsmann M, van Durme C, Geusens P, Dellaert BG, Dirksen CD, van der Weijden T et al Nominal group technique to select attributes for discrete choice experiments: an example for drug treatment choice in osteoporosis. Patient Prefer Adherence 2013; 7: 133–139. [DOI] [PMC free article] [PubMed] [Google Scholar]
- 20. Hertroijs DFL, Elissen AMJ, Brouwers M, Schaper NC, Kohler S, Popa MC et al A risk score including body mass index, glycated haemoglobin and triglycerides predicts future glycaemic control in people with type 2 diabetes. Diabetes Obes Metab 2018; 20: 681–688. [DOI] [PMC free article] [PubMed] [Google Scholar]
- 21. Bernhardsson S, Larsson MEH, Johansson K, Oberg B. ‘In the physio we trust’: a qualitative study on patients’ preferences for physiotherapy. Physiother Theory Pract 2017; 33: 535–549. [DOI] [PubMed] [Google Scholar]
- 22. Brabers AEM, van der Schors W, de Jong JD. Barometer vertrouwen in de gezondheidszorg. Utrecht: NIVEL, 2016. Available at https://www.nivel.nl/nl/consumentenpanel-gezondheidszorg/barometer-vertrouwen-de-gezondheidszorg Last accessed 25 April 2019.
- 23. Boyle E, Saunders R, Drury V. A qualitative study of patient experiences of type 2 diabetes care delivered comparatively by general practice nurses and medical practitioners. J Clin Nurs 2015; 25: 1977–1986. [DOI] [PubMed] [Google Scholar]
- 24. Rutten G, van Vugt HA, de Weerdt I, de Koning E. Implementation of a structured diabetes consultation model to facilitate a person‐centered approach: results from a nationwide Dutch study. Diabetes Care 2018; 41: 688–695. [DOI] [PubMed] [Google Scholar]
- 25. Wermeling PR, Gorter KJ, Stellato RK, de Wit GA, Beulens JW, Rutten GE. Effectiveness and cost‐effectiveness of 3‐monthly versus 6‐monthly monitoring of well‐controlled type 2 diabetes patients: a pragmatic randomised controlled patient‐preference equivalence trial in primary care (EFFIMODI study). Diabetes Obes Metab 2014; 16: 841–849. [DOI] [PubMed] [Google Scholar]
- 26. Nouwen A, Winkley K, Twisk J, Lloyd CE, Peyrot M, Ismail K et al Type 2 diabetes mellitus as a risk factor for the onset of depression: a systematic review and meta‐analysis. Diabetologia 2010; 53: 2480–2486. [DOI] [PMC free article] [PubMed] [Google Scholar]
- 27. Uchendu C, Blake H. Effectiveness of cognitive‐behavioural therapy on glycaemic control and psychological outcomes in adults with diabetes mellitus: a systematic review and meta‐analysis of randomized controlled trials. Diabet Med 2017; 34: 328–339. [DOI] [PubMed] [Google Scholar]
- 28. Henderson C, Noblett J, Parke H, Clement S, Caffrey A, Gale‐Grant O et al Mental health‐related stigma in health care and mental health‐care settings. Lancet Psychiatry 2014; 1: 467–482. [DOI] [PubMed] [Google Scholar]
- 29. Salampessy BH, Veldwijk J, Jantine Schuit A, van den Brekel‐Dijkstra K, Neslo RE, Ardine de Wit G et al The predictive value of discrete choice experiments in public health: an exploratory application. Patient 2015; 8: 521–529. [DOI] [PMC free article] [PubMed] [Google Scholar]
- 30. Veldwijk J, Lambooij MS, van Gils PF, Struijs JN, Smit HA, de Wit GA. Type 2 diabetes patients’ preferences and willingness to pay for lifestyle programs: a discrete choice experiment. BMC Public Health 2013; 13: 1099. [DOI] [PMC free article] [PubMed] [Google Scholar]
- 31. Lawal M, Lawal F. Individual versus group diabetes education: assessing the evidence. Diabetes Nursing 2016; 20: 247–250. [Google Scholar]
- 32. Weiner JP. Doctor–patient communication in the e‐health era. Isr J Health Policy Res 2012; 1: 33. [DOI] [PMC free article] [PubMed] [Google Scholar]
- 33. Fortney JC, Burgess JF Jr, Bosworth HB, Booth BM, Kaboli PJ. A re‐conceptualization of access for 21st century healthcare. J Gen Intern Med 2011; 26(Suppl 2): 639–647. [DOI] [PMC free article] [PubMed] [Google Scholar]
- 34. Ellis K, Mulnier H, Forbes A. Perceptions of insulin use in type 2 diabetes in primary care: a thematic synthesis. BMC Fam Pract 2018; 19: 70. [DOI] [PMC free article] [PubMed] [Google Scholar]
- 35. Volksgezondheidenzorg.info . Prevalentie diabetes naar leeftijd en geslacht, 2017. https://www.volksgezondheidenzorg.info/onderwerp/diabetes-mellitus/cijfers-context/huidige-situatie#node-prevalentie-diabetes-naar-leeftijd-en-geslacht Last accessed 25 April 2019.
- 36. Brinkhues S, Dukers‐Muijrers N, Hoebe C, van der Kallen CJH, Dagnelie PC, Koster A et al Socially isolated individuals are more prone to have newly diagnosed and prevalent type 2 diabetes mellitus – the Maastricht study. BMC Public Health 2017; 17: 955. [DOI] [PMC free article] [PubMed] [Google Scholar]
- 37. Mangham LJ, Hanson K, McPake B. How to do (or not to do) … Designing a discrete choice experiment for application in a low‐income country. Health Policy Plan 2009; 24: 151–158. [DOI] [PubMed] [Google Scholar]
- 38. Watson V, Becker F, de Bekker‐Grob E. Discrete choice experiment response rates: a meta‐analysis. Health Econ 2017; 26: 810–817. [DOI] [PubMed] [Google Scholar]
Associated Data
This section collects any data citations, data availability statements, or supplementary materials included in this article.
Supplementary Materials
Doc. S1. Detailed description analysis.
Table S1. Results from the panel mixed logit model stratified on age.
Table S2. Results from the panel mixed logit model stratified on sex.
Table S3. Results from the panel mixed logit model stratified on education level.
Table S4. Results from the panel mixed logit model stratified on diabetes medication.
Table S5. Results from the panel mixed logit model stratified on diabetes duration.
Table S6. Results from the panel mixed logit model stratified on glycaemic control trajectory.