Abstract
Background and Objectives
Nano‐pulse stimulation (NPS) therapy is the application of ultrafast pulses of high amplitude electrical energy to tissues to influence cell function. Unique characteristics of these pulses enable electric field penetration into the interior of cells and organelles to generate transient nanopores in both organelle and plasma membranes. The purpose of this study is to document the temporal and physical changes in intracellular organelles following NPS therapy using electron microscopy.
Study Design/Materials and Methods
Liver tumors were induced in five buffalo rats by implanting syngeneic McA‐RH7777 hepatocellular carcinoma cells into the surgically exposed livers. Tumors were allowed to grow for 1 week and then the surgically exposed livers were treated in situ with NPS energy delivered at a sufficient level to trigger regulated cell death in the tumor. Samples of NPS‐treated and control tissue were removed and fixed for electron microscopy at 1 minute, 5 minutes, 30 minutes, 2 hours and 4 hours after exposure.
Results
Measurements of cellular organelles indicate strong swelling following NPS therapy exposure compared with untreated controls. The mean diameter of the mitochondria increased by 55% within 1 minute and then by 2.5‐fold by 2 hours post‐NPS therapy. The rough endoplasmic reticulum (RER) cisternae swelled immediately after NPS therapy with reduced swelling by 30 minutes and loss of structural integrity by 2 hours. The Golgi apparatus appears swollen in images collected 1 and 5 minutes after NPS therapy and was no longer detected at 30 minutes and 2 hours post‐NPS therapy. By 4 hours after NPS therapy, a nascent Golgi apparatus was detected in many of the images. The plasma membrane lost its well‐defined morphology and became less linear, exhibiting discontinuities as early as 1 minute post‐NPS energy exposure and the nuclear envelope became subjectively less distinct over time.
Conclusions
NPS therapy at sufficient energy levels causes the rapid swelling of organelles, disintegration of the RER, breaks in the plasma membrane and blurs the borders of the nuclear envelope. These changes in the mitochondria and RER are indicative of a regulated cell death process. These immediate physical changes to vital cell organelles are likely to trigger subsequent regulated cell death mechanisms observed in other studies of NPS therapy. Lasers Surg. Med. © 2020 The Authors. Lasers in Surgery and Medicine published by Wiley Periodicals, Inc.
Keywords: nano‐pulse stimulation, electron microscopy, nanosecond electric pulses, organelle permeability
INTRODUCTION
Nano‐pulse stimulation (NPS) therapy is the application of ultrafast (nanosecond‐domain) pulses of electrical energy to tissues to influence cell function. These nano‐pulses are so short that they have the unique ability to penetrate into cells and organelles before charge rearrangements can respond to neutralize the imposed field. This electric field penetration can “stimulate” many different cellular responses as varied as secretion [1, 2], differentiation [3], and regulated cell death [4] depending on the amount of energy applied and cell type treated.
Recent clinical applications of NPS therapy include the treatment of skin lesions such as seborrheic keratosis [5] and sebaceous hyperplasia [6]. NPS energy affects skin lesions by modifying the cellular components of the epidermis and dermis while leaving the fibrous components of the dermis unaffected [7]. When the appropriate NPS energy is applied, the treated cells undergo regulated cell death, which is confirmed by the appearance of intact cells lacking a visible nucleus. These cells are non‐viable and are gradually cleared, followed by re‐epithelialization of the epidermis. In the example of compromising sebaceous glands, cellular components of the dermis are cleared within the precisely defined treatment zone [7].
The mechanism for this cellular specificity involves the penetration of the pulsed energy into the cytoplasm of treated cells to generate transient nanopores in the exposed cell and organelle membranes. These pores are only 1 nm wide [8] so allow only small molecules such as water and ions to pass through them for up to 10 minutes [9] which has been determined by both patch clamp electrophysiology and fluorescence microscopy using molecules whose fluorescence was either voltage‐dependent [10] or ion concentration‐dependent [11, 12]. NPS‐initiated increases in organelle permeability have been detected in vesicles [13], mitochondria [14], endoplasmic reticulum [11, 12], and nuclei [15]. Surprisingly, no ultrastructural electron microscopy study of the cytoplasmic organelles had been conducted until now. This paper describes the time course of the intracellular structural changes following NPS therapy of rat liver tumors in situ using electron microscopy. Extensive and rapid swelling of the endoplasmic reticulum and mitochondria is evident, which reflects the increase in water permeability through the NPS‐induced nanopores.
Two unique characteristics of NPS energy enable it to penetrate cells and organelles. The first characteristic is the rapid rise time of the applied field that is faster than the redistribution time for the ions in the cytoplasm. These ions within the cell and organelles will respond to the imposed field by moving along the imposed electrochemical gradient until the ions come up against an impermeable membrane where they will charge the membrane capacitance. This capacitance will generate an equal and opposite field to that applied so that the net field inside the cell or organelle approaches zero as the charge builds up. This charging of the capacitance typically takes on the order of 1 microsecond in cells that are closely packed in tissues [16], so if the applied field's rise time is faster than that, it will be able to penetrate into the interior of the exposed cells and organelles. Once the field penetrates the cell membrane, it can increase organelle permeability if the field is large enough as discussed next.
The second important property of NPS energy pulses used in this study is their large amplitude with which the pulses can permeabilize small organelles. A 250 mV difference in potential across a lipid bilayer is sufficient to drive water dipole molecules into the lipid bilayer to generate water‐filled defects or pores in a time‐dependent manner [17]. NPS energy pulses have been shown to generate nanometer‐wide defects that allow ions to cross the organelle membranes, disrupting membrane potential gradients and stressing the organelle. If enough energy is applied by increasing the number of pulses, regulated cell death can be stimulated. This can lead to the release of danger‐associated molecular patterns (DAMPs) [4] which are indicators of immunogenic cell death that attract dendritic cells to phagocytose cells releasing the DAMPs and present antigens from those cells to T cells. Pre‐clinical studies using this tumor model have found this series of events can drive adaptive immune responses which generate tumor‐specific cytotoxic T cells [18].
MATERIALS AND METHODS
Animals and Cell Lines
Two‐month‐old male Buffalo rats (Taconic Biosciences, Rensselaer, NY) and a syngeneic hepatocellular carcinoma cell line, McA‐RH7777 (ATCC, Manassas, VA) were used to avoid immune responses to the injected tumor cells. Animals were housed in the Pulse Biosciences animal facility and received care according to the Guide for the Care and Use of Animals of the National Institutes of Health. All animal studies were approved by the Pulse Biosciences Institutional Animal Care and Use Committee (Assurance No. A4647‐01). All surgical procedures and animal injections were performed under isoflurane inhalation anesthesia. The McA‐RH7777 cell line was cultured in Dulbecco's modified Eagle's medium (containing 4 mM l‐glutamine, 4,500 mg/L glucose, 1 mM sodium pyruvate, and 1,500 mg/L sodium bicarbonate, with 10% fetal bovine serum, and 1% Pen/Strep).
Tumor Cell Injection
One million McA‐RH7777 cells in 15 µl of HBSS were added to 15 µl MatriGel® (Corning Corp., New York, NY) that had been thawed on ice. The solution was mixed to create a homogenous suspension and kept on ice until the time of injection. A sterile insulin syringe in sealed packaging was also kept on ice until the time of injection. In order to expose the liver for injection, a 3–4 cm long midline incision was made in the abdomen while the rat remained under anesthesia. One lobe of the liver was exposed to allow an injection of 30 µl containing 106 cells under the capsule (Fig. 1B). This was followed by a two‐layer closure using absorbable sutures for the abdominal wall followed by wound clips to close the skin.
Figure 1.
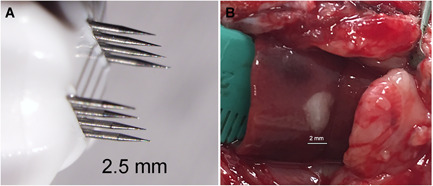
Nano‐pulse stimulation (NPS) therapy of liver tumor in situ. (A) Treatment tip to be placed on liver surrounding tumor; (B) Photo of the liver lobe and tumor surgically exposed to allow NPS therapy in situ.
NPS Therapy in Tumors
One week after injecting the tumor cells into the liver via laparotomy, the liver was surgically accessed again for NPS therapy. To perform treatment an applicator with a base of 2.5 × 2.5 mm having two parallel rows of microneedles 2 mm long was inserted into the liver around the tumor. Treatment consisted of delivering 300 nanosecond‐long pulses totaling 3.5 J using the PulseTx™ (Pulse Biosciences, Hayward, CA) (Fig. 1A). This NPS therapy was found to be sufficient to eliminate the tumor during the subsequent week or two [18]. A level plane of anesthesia was maintained until the tumor sample was collected from the center of the tumor using a 2 mm cylindrical punch and rapidly inserted into the ice‐cold fixation solution. Images for each time point were taken from tumor samples collected from different animals.
Electron Microscopy
Samples were fixed in cold 2% glutaraldehyde, 1% paraformaldehyde in 0.1 M sodium cacodylate buffer at pH 7.4 for 1 day. Post‐fixation was performed with 2% osmium tetroxide in the sodium cacodylate buffer, stained with 2% aqueous uranyl acetate, dehydrated in acetone, infiltrated, and embedded in LX‐112 resin (Ladd Research Industries, Burlington, VT). Ultrathin sections (65 nm) were made on a Reichert Ultracut S ultramicrotome and counter stained with 0.8% lead citrate. Grids were examined on a JEOL JEM‐1230 transmission electron microscope (JEOL USA, Inc., Peabody, MA) and photographed with the Gatan Ultrascan 1000 digital camera (Gatan Inc., Warrendale, PA).
RESULTS
Electron micrographs of the untreated control liver tumors were first generated (Fig. 2). These images illustrate the very close relationship between the rough endoplasmic reticulum (RER) and the mitochondria. Most mitochondria are tightly surrounded by RER over much of their circumference. In addition to the prevalence of mitochondria and endoplasmic reticulum, the Golgi apparatus was often found in these control electron microscopy (EM) images.
Figure 2.
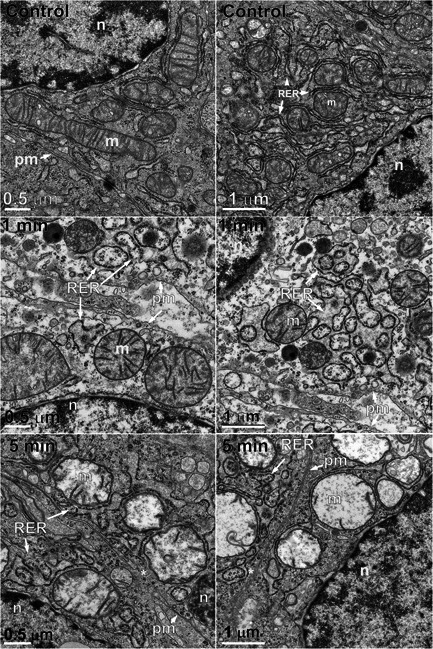
Pairs of electron micrographs at two magnifications taken before and 1 and 5 minutes after nano‐pulse stimulation therapy. Organelles labeled as: m, mitochondrion; n, nucleus; pm, plasma membrane; RER, rough endoplasmic reticulum.
Samples collected 1 minute after NPS therapy appeared distinctly different from the controls (Fig. 2). The images were lighter, indicating reduced electron density and the RER exhibited extremely swollen cisternal spaces, often ballooning out to the extent that some regions of cytoplasm appeared to be surrounded by RER. The Golgi apparatus was present in 21 of the 43 images collected at this time point but exhibited swelling and often had regions of localized disruption in the cisternae membranes (Fig. 3). The mean diameter of the mitochondria had increased by 55%. Instead of a well‐defined “railroad track” appearance, plasma membranes became more curvilinear and often exhibited discontinuities. Swelling organelles are consistent with fluid influx through the nanopores that are known to be generated by NPS therapy. Only 1.5 min elapsed between NPS therapy and the fixing of the tissue for these images.
Figure 3.
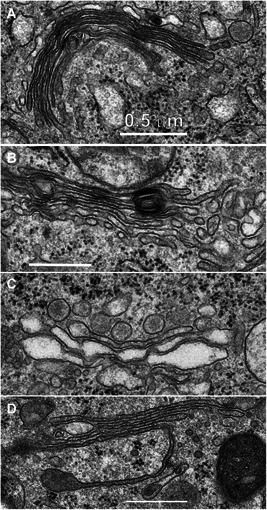
Golgi apparatus captured at various times after nano‐pulse stimulation (NPS) therapy. (A) Untreated control; (B) 1 minute post‐NPS therapy; (C) 5 minutes post‐NPS treatment; (D) 4 hours post‐NPS therapy. All scale bars represent 0.5 μm.
Samples fixed 5 minutes after NPS therapy exhibited many similarities to the 1‐minute images (Fig. 2). The mean mitochondria diameter appeared to increase by 65% over controls in the 35 EM images collected, but the RER cisternal spaces remained swollen and the Golgi apparatus appeared more swollen (Fig. 3C). The plasma membrane exhibited small discontinuities or breaks (marked with an asterisk in Fig. 4).
Figure 4.
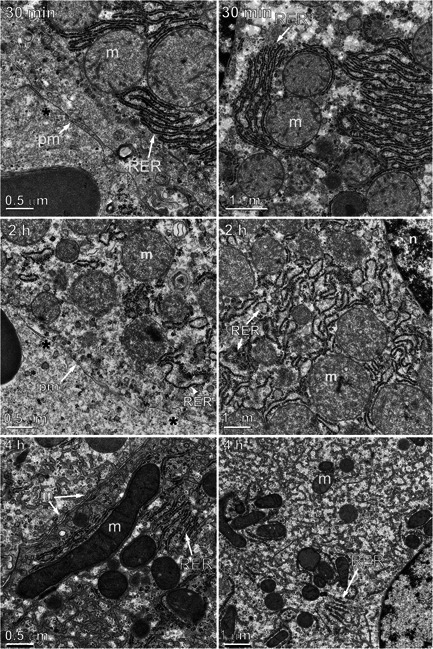
Pairs of electron micrographs at two magnifications taken at 30 minutes, 2 and 4 hours after nano‐pulse stimulation therapy. Black asterisks mark breaks in the plasma membrane. m, mitochondrion; n, nucleus; pm, plasma membrane; RER, rough endoplasmic reticulum.
Samples fixed 30 minutes after NPS therapy appeared more like control sections than the 1‐ and 5‐minute sample images (Fig. 4). The RER was beginning to recover its normal appearance, but the mitochondria had fewer well‐defined cristae and had swelled to a mean diameter of 1.1 μm, 2.2‐fold larger than untreated controls. The diameter of the mitochondria was measured in all EM images taken at each time point (Fig. 5). Swelling of the mitochondria peaked at a 2.5‐fold increase in diameter by 2 hours and began to shrink. Most of the ribosomes were associated with RER membranes. No Golgi apparatus was identified in any of the 67 images generated at the 30 minutes time point. The plasma membranes frequently exhibited regions of discontinuity (marked by asterisks) (Fig. 4). The nuclear envelope became less distinct over time (Figs. 6 and 7).
Figure 5.
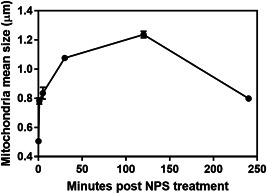
Mean mitochondria diameter versus time following nano‐pulse stimulation (NPS) therapy.
Figure 6.
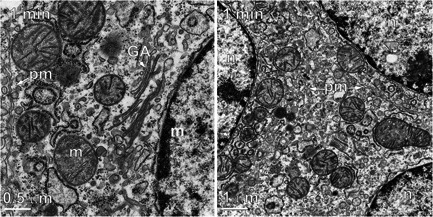
Two electron micrographs taken 1 minute after nano‐pulse stimulation therapy. (A) Plasma membrane (pm) has very wavy appearance. (B) Plasma membrane is evident in two places but is not continuous between the three separate cells indicated by the three nuclei. GA, Golgi apparatus; m, mitochondrion; pm, plasma membrane
Figure 7.
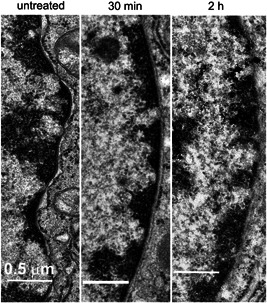
Electron micrographs of nuclear envelope taken before and after nano‐pulse stimulation therapy. All scale bars represent 0.5 μm.
Samples collected 2 hours after NPS therapy exhibited more swelling in the mitochondria with very little evidence of internal cristae membranes (Figs. 4 and 5). Mitochondria frequently exhibited localized spots of heavy staining along with internal vesicles. The RER presented swollen cisternal spaces and some breaks in their membranes. The cytoplasm had a granular appearance with many small membrane‐bound vesicles. No Golgi apparatus was identified in any of the 77 images collected at this time point. The plasma membranes continued to exhibit discontinuities. The nuclear envelope faded further from view.
Samples collected 4 hours after NPS therapy appear to exhibit elements of recovery. The mitochondria were much less swollen than the 2 hours sample and some inner cristae became visible. The RER no longer exhibited swollen cisternal spaces. A nascent Golgi apparatus was observed in several of the 50 images collected at this time point. The cytoplasm was filled with tubular membrane networks in 13 of the 50 images. The plasma membranes appeared to have fewer regions of discontinuity than found in the earlier time points.
DISCUSSION
NPS therapy of liver tumors in situ results in dramatic changes in the intracellular organelles. The mitochondria, RER and Golgi apparatus all swell and vesiculate. The Golgi apparatus was not found in any of the images captured at 30 minutes or 2 hours but could be found in some captured at 4 hours. Tubular membrane networks begin to appear at 30 minutes and become more pronounced at 4 hours.
It is surprising that cells that were clearly dying in the earlier time points could recover by the 4 hours time point. The 4 hours images are distinctly different from control images, so it is not likely that untreated tumor cells were collected. While all of the samples were collected from the center of the treated tumors It may be that the cells sampled at 4 hours had received less energy from the treatment than those captured at the earlier time points and were, therefore, able to recover somewhat. Addressing this question requires further investigation.
Volume Changes in ER and Mitochondria
The images taken at the earliest time points of 1 and 5 minutes following NPS indicate striking organelle volume increases. The RER no longer exhibits narrow cisternal spaces and there are many examples cytoplasm trapped within RER membranes. This swelling of the organelles suggests a rapid influx of fluid had occurred. Patch clamp studies have indicated that the transient NPS‐induced nanopores are present in the plasma membrane for up to 10 minutes [19]. The rapid swelling observed in the first 5 minutes coincides with this time course of nanopore appearance and the reduced mitochondrial swelling rate over the next 25 minutes and partial recovery of the ER by 30 minutes may be related to nanopore closure.
Previous studies of mitochondria and RER permeability changes are consistent with these data. NPS therapy has been shown to reduce mitochondrial membrane potential immediately [10, 14] which is consistent with the rapid swelling observed in our study. Similarly, rapid Ca2+ release from the RER has been reported to follow NPS therapy [11, 12] which is consistent with nanopore formation. Moreover, the breaks in the RER observed at 2 hours may be related to the translocation of calreticulin from the RER to the plasma membrane that occurs at that time [4] as well as the activation of caspase‐3 [7].
Golgi Apparatus
The Golgi apparatus was not detected in the images collected 30 minutes and 2 hours after NPS therapy but it was evident in several images collected 4 hours post‐NPS therapy. The Golgi is thought to depend on a constant flux of new membrane from the ER [20], so the scarcity of the Golgi at these two time points suggests that NPS therapy had disrupted this component of ER function.
ER‐Mitochondria Interactions
Mitochondria form close physical associations with the ER that regulate a number of physiological functions including autophagy [21], calcium homeostasis [22], phospholipid transfer [23], and metabolic signaling [24]. The disruption of the ER‐mitochondrial contact sites triggered by NPS therapy may negatively impact these important cellular functions and may be in part responsible for the breakdown of the inner mitochondria membrane cristae observed by 2 hours after NPS therapy.
Plasma Membrane Appearance
Accurate preservation of the plasma membrane is particularly dependent on adequate fixation and all the untreated images exhibited good fixation and staining with uninterrupted membrane “tracks”. However, most of the images from treated samples exhibited breaks of various sizes in the plasma membrane. It is possible that the presence of nanopores in the treated samples hampered the fixation of the lipid resulting in breaks in the continuity. However, the 1‐minute samples exhibited fewer breaks than the 5 and 30 minutes samples, so it appears unlikely that the noted difference is due to the presence of nanopores.
Nuclear Envelope Changes
The nucleus shrinks following NPS therapy [25] but that is not easily confirmed with EM due to the very thin sections that do not always cut through the middle of the nuclei. However, the nuclear envelope is easily identified and becomes less distinct and fades with time after NPS therapy (Fig. 7).
Other EM Studies
There are three other studies that applied electromagnetic radiation to liver cells followed by electron microscopy. He et al. [26] applied 30–120 500 nanoseconds pulses at 10 kV/cm to human liver cancer cells in vitro. They observed swelling in 20% of the cells and nucleoli disappeared. There were no high‐resolution micrographs of mitochondria or RER with which to compare our results. However, they did report increases in intracellular Ca2+ as expected from the generation of nanopores in the RER and a reduction in the average mitochondrial membrane potential expected from the presence of nanopores in the mitochondria. Holovska et al. [27] applied 2.45 GHz at 2.8 mW/cm2 for 3 hours daily for 3 weeks. This is a very different type of electric field than applied in this study, and they did not see any changes in the mitochondria or RER. The third study applied radiofrequency ablation which generates heat to ablate cells [28]. They reported the destruction of mitochondria, hepatocytes, and fixation of sinusoidal cells.
CONCLUSION
NPS therapy of liver tumors in situ clearly modifies the permeability of mitochondria and RER resulting in rapid swelling. The internal cristae of the mitochondria also are affected and slowly disappear over 2 hours. The RER swells so much that regions appear with cytoplasm trapped within RER membranes. The Golgi apparatus also swells and exhibits cisternae disruption following NPS therapy and is not found in images taken between 30 minutes and 2 hours post‐NPS therapy. Both the plasma membrane and nuclear envelope exhibit changes following NPS therapy. Taken together, these observations support the hypothesis that NPS therapy penetrates into the cell interior to permeabilize internal organelles and are in relatively good agreement with the time course of permeability changes measured with fluorescent probes in both mitochondria and the ER following NPS therapy.
ACKNOWLEDGEMENT
We want to thank Jenny Womg of the Gladstone Institute, UCSF, for taking these electron micrographs of the samples that we provided to her.
REFERENCES
- 1. Zhang J, Blackmore PF, Hargrave BY, Xiao S, Beebe SJ, Schoenbach KH. Nanosecond pulse electric field (nanopulse): A novel non‐ligand agonist for platelet activation. Arch Biochem Biophys 2008;471(2):240–248. [DOI] [PubMed] [Google Scholar]
- 2. Hargrave B, Li F. Nanosecond pulse electric field activation of platelet‐rich plasma reduces myocardial infarct size and improves left ventricular mechanical function in the rabbit heart. J Extra Corpor Technol 2012;44(4):198–204. [PMC free article] [PubMed] [Google Scholar]
- 3. Bai F, Gusbeth C, Frey W, Nick P. Nanosecond pulsed electric fields trigger cell differentiation in Chlamydomonas reinhardtii . Biochim Biophys Acta Biomembr 2017;1859(5):651–661. [DOI] [PubMed] [Google Scholar]
- 4. Nuccitelli R, McDaniel A, Anand S, et al. Nano‐pulse stimulation is a physical modality that can trigger immunogenic tumor cell death. J Immunother Cancer 2017;5:32. [DOI] [PMC free article] [PubMed] [Google Scholar]
- 5. Hruza GJ, Zelickson BD, Selim MM, et al. Safety and efficacy of nanosecond pulsed electric field treatment of seborrheic keratoses. Dermatol Surg 2019. 10.1097/dss.0000000000002278 [DOI] [PubMed] [Google Scholar]
- 6. Munavalli GS, Zelickson BD, Selim MM, et al. Safety and efficacy of nano‐pulse stimulation treatment of sebaceous gland hyperplasia. Dermatol Surg 2019. 10.1097/dss.0000000000002154 [DOI] [PMC free article] [PubMed] [Google Scholar]
- 7. Kaufman D, Martinez M, Jauregui L, et al. A dose‐response study of a novel method of selective tissue modification of cellular structures in the skin with nanosecond pulsed electric fields. Lasers Surg Med 2019. 10.1002/lsm.23145 [DOI] [PMC free article] [PubMed] [Google Scholar]
- 8. Pakhomov AG, Kolb JF, White JA, et al. Long‐lasting plasma membrane permeabilization in mammalian cells by nanosecond pulsed electric field (nsPEF). Bioelectromagnetics 2007;28(8):655–663. [DOI] [PubMed] [Google Scholar]
- 9. Bowman AM, Nesin OM, Pakhomova ON, Pakhomov AG. Analysis of plasma membrane integrity by fluorescent detection of Tl(+) uptake. J Membr Biol 2010;236(1):15–26. [DOI] [PMC free article] [PubMed] [Google Scholar]
- 10. Vernier PT. Mitochondrial membrane permeabilization with nanosecond electric pulses. Conf Proc IEEE Eng Med Biol Soc 2011;2011:743–745. [DOI] [PubMed] [Google Scholar]
- 11. Vernier PT, Sun Y, Marcu L, Salemi S, Craft CM, Gundersen MA. Calcium bursts induced by nanosecond electric pulses. Biochem Biophys Res Commun 2003;310(2):286–295. [DOI] [PubMed] [Google Scholar]
- 12. White JA, Blackmore PF, Schoenbach KH, Beebe SJ. Stimulation of capacitative calcium entry in HL‐60 cells by nanosecond pulsed electric fields. J Biol Chem 2004;279(22):22964–22972. [DOI] [PubMed] [Google Scholar]
- 13. Schoenbach KH, Beebe SJ, Buescher ES. Intracellular effect of ultrashort electrical pulses. Bioelectromagnetics 2001;22(6):440–448. [DOI] [PubMed] [Google Scholar]
- 14. Batista NT, Wu YH, Gundersen MA, Miklavcic D, Vernier PT. Nanosecond electric pulses cause mitochondrial membrane permeabilization in Jurkat cells. Bioelectromagnetics 2012;33(3):257–264. [DOI] [PubMed] [Google Scholar]
- 15. Thompson GL, Roth CC, Kuipers MA, Tolstykh GP, Beier HT, Ibey BL. Permeabilization of the nuclear envelope following nanosecond pulsed electric field exposure. Biochem Biophys Res Commun 2016;470(1):35–40. [DOI] [PubMed] [Google Scholar]
- 16. Schoenbach KH. Bioelectric effect of intense nanosecond pulses In: Pakhomov AG, Miklavcic D, Markov MS, editors. Advanced Electroporation Techniques in Biology and Medicine, Biological Effects of Electromagnetics. Boca Raton, FL: Taylor and Francis Group; 2010. pp 19–50. [Google Scholar]
- 17. Sengel JT, Wallace MI. Imaging the dynamics of individual electropores. Proc Natl Acad Sci U S A 2016;113(19):5281–5286. [DOI] [PMC free article] [PubMed] [Google Scholar]
- 18. Nuccitelli R, Berridge JC, Mallon Z, Kreis M, Athos B, Nuccitelli P. Nanoelectroablation of murine tumors triggers a CD8‐dependent inhibition of secondary tumor growth. PLoS One 2015;10(7):e0134364. [DOI] [PMC free article] [PubMed] [Google Scholar]
- 19. Pakhomov AG, Bowman AM, Ibey BL, Andre FM, Pakhomova ON, Schoenbach KH. Lipid nanopores can form a stable, ion channel‐like conduction pathway in cell membrane. Biochem Biophys Res Commun 2009;385(2):181–186. [DOI] [PMC free article] [PubMed] [Google Scholar]
- 20. Day KJ, Staehelin LA, Glick BS. A three‐stage model of Golgi structure and function. Histochem Cell Biol 2013;140(3):239–249. [DOI] [PMC free article] [PubMed] [Google Scholar]
- 21. Gomez‐Suaga P, Paillusson S, Stoica R, Noble W, Hanger DP, Miller CCJ. The ER‐mitochondria tethering complex VAPB‐PTPIP51 regulates autophagy. Curr Biol 2017;27(3):371–385. [DOI] [PMC free article] [PubMed] [Google Scholar]
- 22. Chernorudskiy AL, Zito E. Regulation of calcium homeostasis by ER redox: A close‐up of the ER/mitochondria connection. J Mol Biol 2017;429(5):620–632. [DOI] [PubMed] [Google Scholar]
- 23. Lahiri S, Chao JT, Tavassoli S, et al. A conserved endoplasmic reticulum membrane protein complex (EMC) facilitates phospholipid transfer from the ER to mitochondria. PLoS Biol 2014;12(10):e1001969. [DOI] [PMC free article] [PubMed] [Google Scholar]
- 24. Tubbs E, Rieusset J. Metabolic signaling functions of ER‐mitochondria contact sites: Role in metabolic diseases. J Mol Endocrinol 2017;58(2):R87–r106. [DOI] [PubMed] [Google Scholar]
- 25. Nuccitelli R, Pliquett U, Chen X, et al. Nanosecond pulsed electric fields cause melanomas to self‐destruct. Biochem Biophys Res Commun 2006;343(2):351–360. [DOI] [PMC free article] [PubMed] [Google Scholar]
- 26. He L, Xiao D, Feng J, Yao C, Tang L. Induction of apoptosis of liver cancer cells by nanosecond pulsed electric fields (nsPEFs). Med Oncol (Northwood, London, England) 2017;34(2):24. [DOI] [PubMed] [Google Scholar]
- 27. Holovska K, Almasiova V, Cigankova V, Benova K, Racekova E, Martoncikova M. Structural and ultrastructural study of rat liver influenced by electromagnetic radiation. J Toxicol Environ Health Part A 2015;78(6):353–356. [DOI] [PubMed] [Google Scholar]
- 28. Kuromatsu R, Tanaka M, Shimauchi Y, et al. Light and electron microscopic analyses of immediate and late tissue damage caused by radiofrequency ablation in porcine liver. Int J Mol Med 2003;11(2):199–204. [PubMed] [Google Scholar]


