Abstract
Skull bone represents a highly acoustical impedance mismatch and a dispersive barrier for the propagation of acoustic waves. Skull distorts the amplitude and phase information of the received waves at different frequencies in a transcranial brain imaging. We study a novel algorithm based on vector space similarity model for the compensation of the skull-induced distortions in transcranial photoacoustic microscopy. The results of the algorithm tested on a simplified numerical skull phantom, demonstrate a fully recovered vasculature with the recovery rate of 91.9%.
1. Introduction
Photoacoustic imaging (PAI) is a promising recent technology, which works based on acoustic detection of optical absorption from tissue chromophores, such as oxy-hemoglobin (HbO2) and deoxy-hemoglobin (Hb) [1–8]. Photoacoustic microscopy (PAM) is one of the implementations of PAI with micrometer spatial resolution. One of the fast-emerging applications for PAM has been to study the brain in rodents [4–6,9–16]. Transcranial photoacoustic microscopy (TsPAM), in particular, is of a great importance for longitudinal studies. Despite the thin skull in rodents (i.e., 0.23 mm to 0.53 mm in mice [16,17] and 0.5 mm to 1 mm in rats [18]), due to the use of high frequency transducers, TsPAM is challenging, and the photoacoustic (PA) pressure waves are usually distorted and experience attenuation, dispersion, and longitudinal to shear mode conversion [16,19–22]. Here, we used distortion and aberration interchangeably.
The findings about the effect of skull on acoustic pressure waves are as follows. Skull bone represents a highly acoustical impedance mismatch and dispersive barrier for the propagation of acoustic waves [23–25], that distorts the amplitude and phase of the received acoustic waves [20,21]; the acoustic attenuation occurs due to the absorption and scattering of the skull tissue and affects the magnitude of the acoustic waves [19,26,27]; the acoustic dispersion is the frequency dependency of the speed of sound in the skull and it distorts the phase of the acoustic wave [26]; the degree of attenuation and dispersion are defined by the density, porosity, and thickness of the skull [28]; frequency-dependent reduction of acoustic wave amplitude contributes to the broadening of the received acoustic signal at the transducer [29]; the significantly higher speed of sound in the bone ( 2900 m/s [16]) as compared to brain’s soft tissue ( 1500 m/s [30]) makes the acoustic waves travel faster through the skull and be detected earlier, leading to a different time shift for individual frequency components, and contributes to broadening of the received acoustic signal at the transducer [9,19–21]; skull-originated reverberations occur due to the reflection of acoustic waves from the skull-tissue interface [9,20,21]; longitudinal to shear wave mode conversion occurs when a wave encounters an interface between materials of different acoustic impedances with the incident angle not being normal to the interface [22].
Several analytical and numerical compensation algorithms have been designed for correcting the skull-induced aberrations in transcranial ultrasound wave propagation. These methods can be broadly classified to ray-based [19,31] and wave-based [31–37]. Ray-based methods calculate the correcting phases through ray tracing and numerical simulation. In the wave-based methods such as time-reversal, the pressure waveform over time is recorded, reversed, and re-emitted to focus on the location of the desired target, providing corrections for both phase and amplitude. A review of phase correction methods can be found in [38]. In addition to the above methods, recently, a deconvolution-based algorithm, was proposed by Estrada et al. for skull-induced distortions correction in transcranial optoacoustic microscopy (OAM) [20].
The skull’s aberration correction methods implemented so far, are either fast but not accurate, time consuming or require an axillary imaging modality to acquire the structural information of the imaging target. On the other hand, among modern computational methods, although used for improved image reconstruction [39–47], there has not yet been any study on machine learning (ML) for skull’s aberration correction. Here, we introduce a novel algorithm based on the vector space similarity (VSS) model, for the first time, in conjunction with a ray-tracing simulation to correct for the skull-induced distortions for the images generated by a TsPAM. VSS has been used, for the first time, in Cornell system for the mechanical analysis and retrieval of text (SMART) in 1960s [48]; it has widely been used in intelligent information retrieval from search engines [49] to big data platforms such as biomedical documents [50]. We employ a modern take on of the VSS model in the context of matching between the extremum information in the distorted skull-induced PA time-frequency domain signal and the reference signals generated by our recently developed ray-tracing-based simulation [21,51–53]. Additional justification for the application of VSS model is based on the successful use of it in PAM post-processing for tissue vasculature classification [54], and quantification of tissue response to cancer treatment [55].
2. Methods
2.1. PA wave propagation model
For the purpose of the simulation of the PA initial pressure wave propagation from a point source, a semi-analytical numerical acoustic solver is used that was recently developed by us [21]. The solver is based on a deterministic ray-tracing approach in the time-frequency domain that considers a homogenized single layer model for the skull, taking into account dispersion, reflection, refraction and mode conversion between the skull surfaces. Attenuation of light due to the skull or depth is ignored and it is assumed that sufficient initial pressure is generated at the imaging target location, and the acoustic attenuation for the initial pressure traveling towards the skull surface has been considered.
The imaging target is assumed to be a combination of many point sources. The impulse rays propagated to the first fluid-solid interface, multiplied by the skull’s transmission coefficient and propagated further. This procedure is repeated until all the rays reach the transducer’s surface. The PA signal is produced by convolving each individual frequency component of the initial pressure with its corresponding impulse response. When the skull is not present, the ray is simply propagated through a free space and travels directly towards the transducer’s surface.
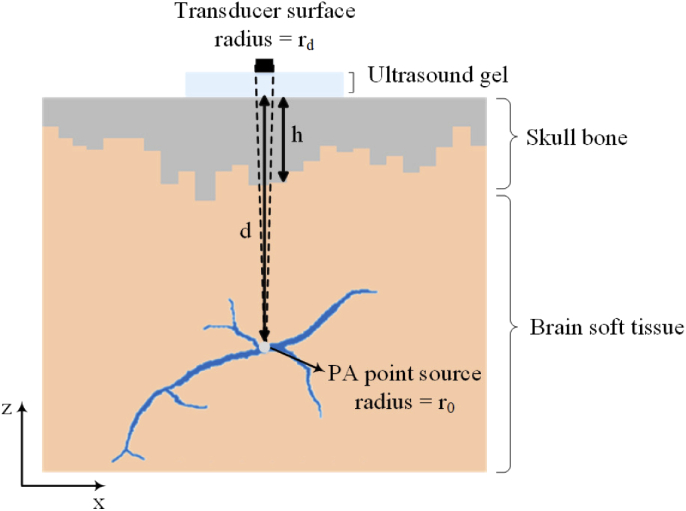
Figure 1 shows the 2-D illustration of the simplified numerical skull phantom that is used in our simulations. The imaging target is a vessel represented by 27007 point sources. The diameter of the vessel varies between 30 m and 150 m, and the entire vessel is located at the averaged depth of 5 mm. In this simulation the axial and lateral resolutions are considered 6 m and 10 m, respectively. We modeled every initial pressure point source as a sphere with the radius of . The spherical point sources generate broadband spherical acoustic waves. A single layer homogenized skull tissue with a thickness variation between 0.5 mm and 2.5 mm is considered. The outer-skull surface considered to be flat but the inner-skull surface is quantized as locally-flat surfaces. This is done to approximately study the effect of varying skull thickness on the resulting image. The space between the skull and the target is modeled with the same acoustic properties as the brain soft tissue [22,30]. A flat ultrasound transducer with an element diameter of 2, 30 MHz center frequency, and 100% bandwidth is used. The transducer is in contact with the outer-skull surface through ultrasound gel. The acoustic properties of the skull, brain soft tissue, and the ultrasound gel that are used in our simulations are listed in Table 1.
Fig. 1.
2-D illustration of a simple model of numerical skull phantom used in our simulations. The initial pressure point source modeled as a sphere with the radius of at a depth of from the outer-skull surface. A single layer homogenized skull tissue with a thickness variation between 0.5 mm and 2.5 mm is considered. The solid acceptance angle of the transducer is indicated by the dashed lines.
Table 1. Acoustic properties of skull, brain soft tissue, and the ultrasound gel used in the simulations. a .
| Symbol (Unit) | Brain soft tissue | Skull | Coupling medium (ultrasound gel) |
|---|---|---|---|
| () | 1000 [22] | 1800 [16] | 1000 [56] |
| () | 1500 [30] | 2900 [16] | 1486 [56] |
| () | — | 1444 [16] | — |
| () | 0.05 [30] | 1.70 [22] | 0.00 [56] |
| 1.18 [30] | 0.93 [22] | — | |
| () | — | 3.41 [22] | — |
| — | 0.93 [22] | — |
—: Data is not available
2.2. Vector space similarity model
Our proposed method is based on VSS model, in which no direct signal amplification or shift will be performed, instead the compensated signal is reconstructed according to the similarity between the skull-affected signal and the signals in the training dataset [49,57]. To describe the VSS model, let’s suppose we have a numeric database, , and the goal is to find the most similar data from the training dataset, i.e., , to the desired query with the defined similarity features. Where, is the data in the training dataset, is the desired query, and and are the feature vectors of and , respectively. The dot product of each query feature vector in all corresponding feature vectors of the training dataset is calculated, then the cosine similarity measure is used to find the minimum angle between query and training dataset as indicated in Eqs. (1) and (2); “.” is the notation of the intersection or dot product and “” is the notation of the norm of vector.
| (1) |
| (2) |
2.3. Aberration correction algorithm
The aberration correction algorithm uses the PA signal extremum information in the time-frequency domain as feature vector. The algorithm is as follow. The input to the algorithm is “with skull” signals. The signals are initially decomposed to their time-frequency components using the short-time Fourier transform (STFT) [58]. For the implementation of the STFT in this study, the signals are discretized at a rate of 250 Megasamples per second and 32 frequencies are modeled. Then for each frequency given, vectors of features, namely and , are extracted as follow.
PA signal vector space (For real and imaginary parts individually)
For each frequency in the signal:
TimeVector:
Temporal delay
Time points at which minimum occurs (,,…,)
Time points at which maximum occurs (,,…,)
AmpVector:
Minimum peak amplitudes (,,…)
Maximum peak amplitudes (,,…,)
Then, the dot product of the obtained feature vectors in each of the corresponding vectors of the training dataset () are calculated and divided by the norms of the vectors to yield the cosine of the angle between them. The similarity is then calculated via the arccos of the obtained value. For each frequency, the overall similarity of each reference signal from the training dataset to the query data () (the skull affected signal) is calculated as the mean of its feature vector similarity (see Eq. (3)). The mean similarity is then calculated between similarities in all frequencies for each two pairs and created a similarity metric vector.
| (3) |
Where, and are the of and , respectively, and and are the of and , respectively.
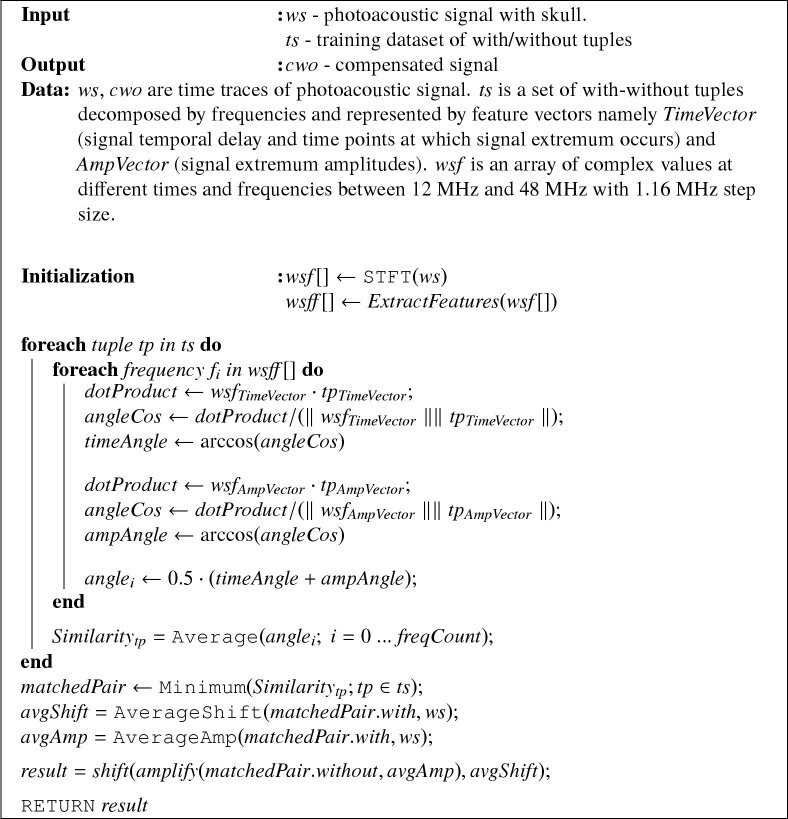
Finally, the minimum of the similarity metric vector is used to select the best matched reference signal. For each frequency, according to the temporal delay and maximum amplitude difference between the input signal and the corresponding matched reference signal, the appropriate amplification coefficients and time shifts are performed on the “without skull” signal (see Algorithm (1)).
Algorithm 1 . Pseudo-code of the skull-induced aberration correction algorithm.
|
2.4. Training dataset
We created a large training dataset of “without skull” and “with skull” signals (with different skull thicknesses (from 0.3 mm to 2.5 mm with 0.1 mm step size), and different imaging depths (from 0.1 mm to 25 mm below the skull surface with 0.5 mm step size)), and then extracted the abovementioned features from the “with skull” signals, creating 1150 training dataset.
3. Results
3.1. Skull-induced aberration compensation: investigation on time traces
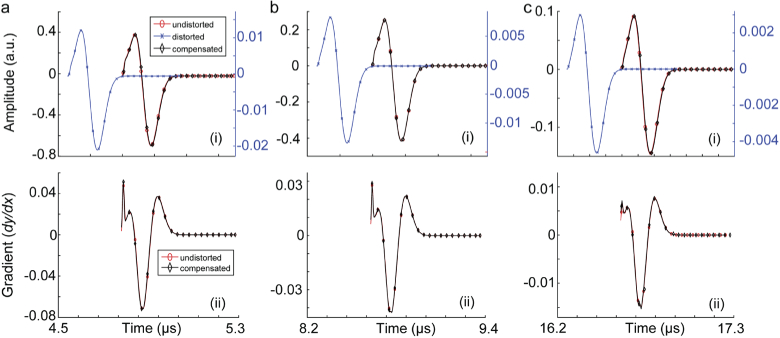
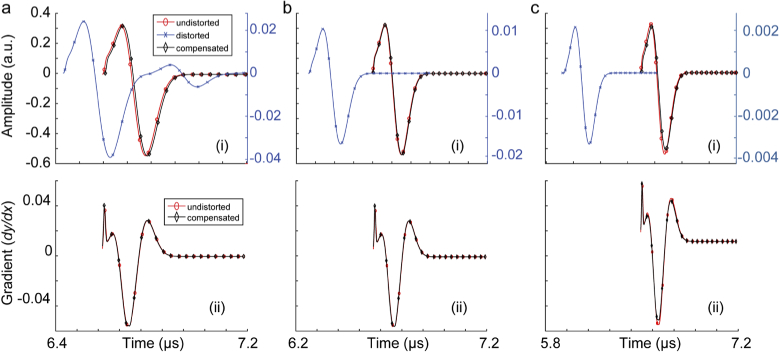
Initially, we evaluated the compensation algorithm in correcting the induced aberration of the PA signal produced from a 0.1 mm absorbing sphere and passes through a skull tissue. The tested scenarios are as follows. (i) Skull thickness of 0.5, 1, and 2 mm, when the absorbing sphere is located at the depth of 5 mm, (ii) skull thickness of 1 mm, when the absorbing sphere is located at the depths of 2, 8, and 20 mm. The unaberrated (i.e., without skull), aberrated (i.e., with skull) and compensated signals are shown in Fig. 2 and Fig. 3.
Fig. 2.
Skull-induced aberration compensation of PA signals produced from a 0.1 mm absorbing sphere passing through a skull tissue with the thickness of 1 mm located at depths (a) 2 mm, (b) 8 mm, and (c) 20 mm. (i) Signal amplitudes and (ii) signal gradients. In this simulation, there is a 5 mm layer of ultrasound gel between the ultrasound transducer and the skull.
Fig. 3.
Skull-induced aberration compensation of PA signals produced from a 0.1 mm absorbing sphere located at the depth of 5 mm passing through a skull tissue with the thicknesses of (a) 0.5 mm, (b) 1 mm, and (c) 2 mm. (i) Signal amplitudes and (ii) signal gradients. In this simulation, there is a 5 mm layer of ultrasound gel between the ultrasound transducer and the skull.
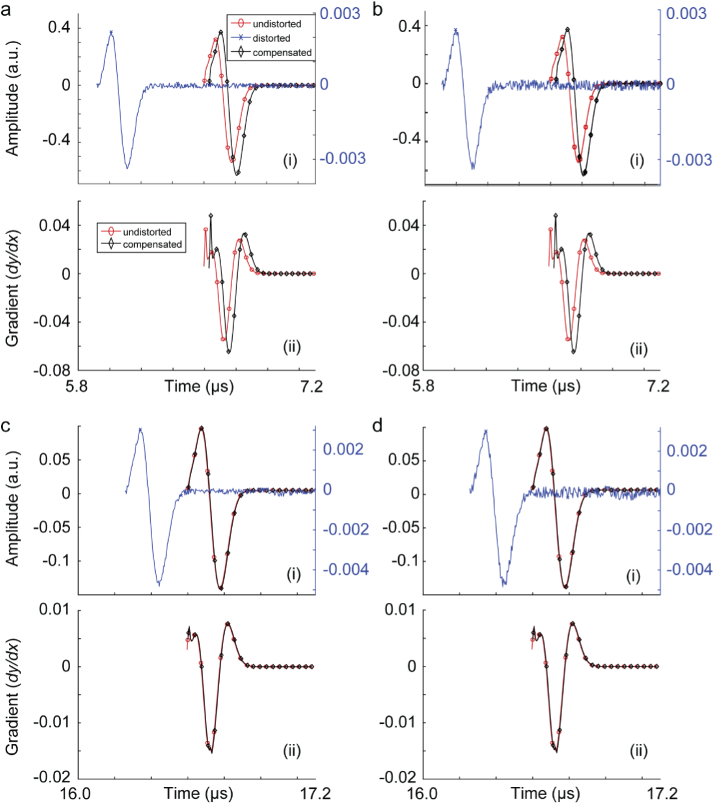
We extracted the PA background noise, comprised of a combination of electronic noise and system thermal noise from an experimental setup, and added that to our simulated signals to evaluate the tolerance of our compensation algorithm to noise. The experimental setup was as follow. An Nd:YAG laser (PhocusMobil, Opotek Inc., CA, USA) with a repetition rate of 10 Hz and a pulse width of 8 ns was used. For light delivery, we used a custom fiber bundle (Newport Corporation, Irvine, CA, USA). For data acquisition, a Verasonics Vantage 128 system was used. For PA signal detection, L22-14v linear array (Verasonics Inc., USA) ultrasound probe with 128-elements and 18.5 MHz central frequency and 65% bandwidth was used. On the imaging end, the transducer was placed and held perpendicularly to the sample. A 2 mm diameter carbon lead phantom in water was imaged at 690 nm. The noise was extracted following the deconvolution algorithm explained in [59]. We used 100 frames of data and modeled the noise distribution. The noise signal was normalized, and two levels of noise were formed: 10% and 20%. The noise signals were then added to some of the distorted signals in Fig. 2 and Fig. 3. The compensation algorithm were applied to the noisy PA signals. The results of this experiment are shown in Fig. 4.
Fig. 4.
Skull-induced aberration compensation of PA signals produced from a 0.1 mm absorbing sphere passing through a skull tissue. (a) Skull thickness is 2 mm and the target is located at 5 mm depth (PA signal is contaminated with 10% background noise), (b) skull thickness is 2 mm and the target is located at 5 mm depth (PA signal is contaminated with 20% background noise), (c) skull thickness is 1 mm and the target is located at 20 mm depth (PA signal is contaminated with 10% background noise), and (d) skull thickness is 1 mm and the target is located at 20 mm depth (PA signal is contaminated with 20% background noise). (i) Signal amplitudes and (ii) signal gradients. In this simulation, there is a 5 mm layer of ultrasound gel between the ultrasound transducer and the skull.
In order to improve the accuracy of the compensation algorithm, we considered a pre-processing step before compensation, where we thresholded low amplitude samples (< 5% of the signal peak) to zero.
The results in Fig. 2 and 3 show that the signal distortion due to both time shift and amplitude distortion have well been recovered. The gradient of the recovered signal and undistorted signals are almost identical which suggest that both the depth of target and skull thickness do not introduce phase distortions to the recovered signal. Figure 4 shows that with a noisy distorted signal, the compensation algorithm still recovers the undistorted signal. The phase information however is not affected unless there is a steep rise or fall in the signal; such distortion is translated in displacement of the components of the imaging target in axial direction and slight speckle-looking artifact in the image. Comparing the results in Figs. 4 a, b, c, and d, one can conclude that the amplitude recovery of our proposed compensation algorithm is more sensitive than time shift recovery.
To quantify the performance of the compensation algorithm, we defined a quantitative measure, we called it: “recovery percentage”, calculated as:
| (4) |
Where, norm is calculated as the square root of the sum of the squared signal sample values. Table 2, shows the recovery percentage for the results showed in Figures (2–4).
Table 2. Recovery percentage calculated for compensated original signal, noisy signal with 10% noise and with 20% noise.
| Recovery percentage (%) | Depth of target | Thickness of the skull | ||||
|---|---|---|---|---|---|---|
| Original Signal | 97.24 | 97.26 | 93.97 | 96.33 | 98.20 | 96.80 |
| Noisy Signal (10% noise) | 97.23 | 95.86 | 83.30 | 95.41 | 97.18 | 96.64 |
| Noisy Signal (20% noise) | 97.14 | 94.58 | 83.22 | 93.91 | 95.47 | 96.76 |
3.2. Skull-induced aberration compensation: investigation on synthetic TsPAM images
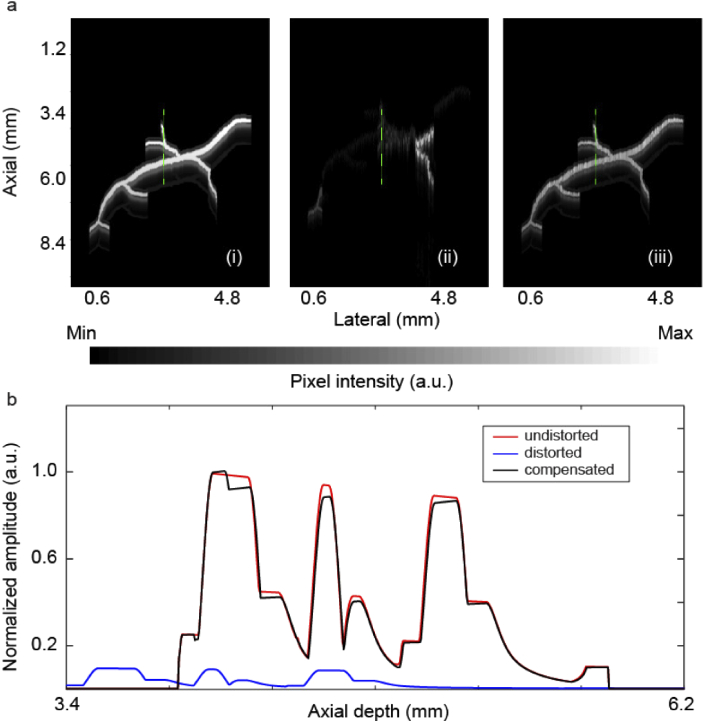
The compensation algorithm was then applied to aberrated signals collected from a synthetic PAM experiment (see the setup and the imaging target in Fig. 1). The results are shown in Fig. 5. A representative depth profile of the unaberrated, aberrated and compensated images (indicated with green dotted lines in the images in Fig. 5(a)) are plotted in Fig. 5(b). As can be seen in Fig. 5(b), the axial profile has been almost perfectly recovered, in terms of both amplitude and phase. The recovery percentage calculated for the compensated image was 91.9%.
Fig. 5.
Aberration correction of TsPAM images. (a) Synthetic TsPAM image acquired from the experimental setup depicted in Fig. 1, (i) unaberrated image, (ii) aberrated image, (iii) compensated image. (b) A representative depth profile, indicated with green dotted lines in images in (a), of the unaberrated, aberrated and compensated images.
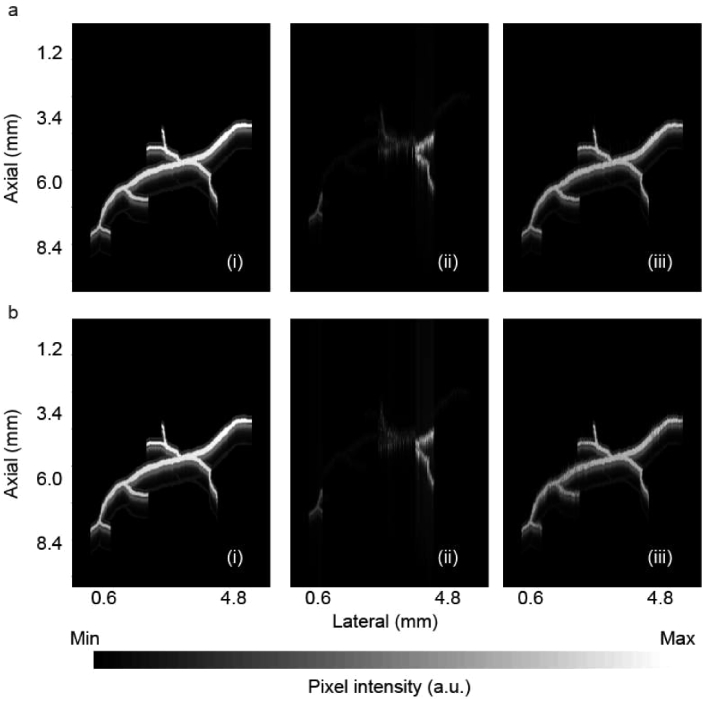
Using the same method explained in the results section (a), we created two noisy aberrated TsPAM images, one with 10% and one with 20% noise (see Fig. 6(ii)). We then compensated the images, the results are shown in Fig. 6(iii). The recovery percentage calculated for these compensated images are 90.60% and 87.95%, respectively.
Fig. 6.
Aberration correction of noisy TsPAM images, reproduced from the TsPAM in Fig. 5, (a) with 10% noise, and (b) with 20% noise. (i) Unaberrated image, (ii) aberrated image, and (iii) compensated image.
3.3. Execution time analysis
Both the signal simulator [21] and the compensation algorithm were implemented in Java openJDK 13. All the signal processing were conducted in MATLAB R2016a. Utilizing a hexa-core Intel Core i7 CPU with 6 cores, 32 GB of RAM, and 3.60 GHz, the compensation algorithm, took 24 2 ms for one task of compensation; with the current code, the compensation is done offline. By implementing the compensation algorithm in graphical processing unit (GPU) or in field programmable gate array (FPGA), hundreds or thousands fold speed-up is achievable, that could make the real-time compensation of the signal in the data acquisition line feasible.
3.4. Non-flat skull aberration compensation: preliminary results
We evaluated our compensation algorithm to correct aberrated PA signal produced from a 0.1 mm spherical absorber and passed through an angled skull tissue when the absorbing sphere was located at the depth of 5 mm from the outer-skull surface. The pressure wave travels a longer path when passes the angled skull; the larger the angle, the longer the travel time. Table 3, shows the preliminary results for skull thickness variation (i.e., h), the percentage of the signal transmitted, and the recovery percentage of the distorted signal after compensation at angles = 5° to 30° relative to the transducer axis. Since the critical angle for the fluid-solid interface is about 31° [22], we reported simulation results for angles up to 30° only.
Table 3. Non-flat skull aberration compensation. Skull thickness variation (h), transmitted signal percentage, and recovery percentage of the distorted signals generated with non-flat skulls with angles from 5° to 30° versus the transducer axis.
| (°) | h (m) | Transmitted signal (%) | Recovery percentage (%) |
|---|---|---|---|
| 5 | 7.64 | 99.13 | 91.99 |
| 10 | 31 | 95.72 | 72.76 |
| 15 | 71 | 88.66 | 89.29 |
| 20 | 128 | 81.73 | 90.94 |
| 25 | 207 | 72.58 | 95.29 |
| 30 | 309 | 58.87 | 94.80 |
4. Discussion
We study a novel algorithm based on VSS model for quasi real-time compensation of the skull-induced distortions in transcranial photoacoustic microscopy. Although VSS is an effective and efficient similarity measurement algorithm, it is not the only similarity algorithm that is explored in the literature. There are other similarity metric such as Pearson Correlation Coefficient (PCC) [60] that works based on similar principle but with a heavier computational complexity. Both VSS and PCC have trouble in distinguishing different importance of features. To deal with this problem, many variations of similarity measurement including weighting approaches, combination measures, and rating normalization methods have been developed [61].
The skull-induced aberration compensation algorithm described here is designed for TsPAM imaging. The proposed compensation method is based on the longitudinal PA waves generated from a single point source which is placed in the axis of the point detector and the effect of other adjacent sources on the PA signal is neglected. Therefore, the transducer receives waves with only small incident angle with almost no shear wave component. The consideration of the point source can be accurately assumed if the lateral resolution of the image is governed by the diffraction-limited size of the focused light beam. The simulated numerical phantom results (Figs. 5 and 6), confirmed the ability of the proposed algorithm to accurately compensate for the four previously explored skull-induced acoustic distortions [20], including the signal amplitude attenuation, time shift, signal broadening, and multiple reflections (Figs. 2 and 3); due to the high attenuating effect of the skull, the multiple reflections cannot be visualized in simulated aberrated signals. In Fig. 3(a), only one peak can be visualized after the main peak which is because of the strength of the first reflection at the skull surface when the thickness of the skull was 0.5 mm. With thicker skulls, the attenuation induced by the skull makes the reflected signals too weak such that they cannot be visualized. The noise tolerance of the compensation algorithm was also tested. It was shown that the recovery rate is only slightly affected with the presence of 10% and 20% noise; the error appears as a mild speckle-looking artifact in the image that can easily be removed by median and mean filters. We also observed that the amplitude recovery of our proposed compensation algorithm is more sensitive than the time shift recovery.
The main feature of the algorithm is its simplicity and fast execution time that are translated in its light computation. Introducing more parallelism to the implementation of the algorithm is possible in various ways. One possible way is to convert the code from currently used CPU-based multi thread execution to GPU accelerated execution. There are two independent anchor points within the compensator code that can be utilized for this purpose: (i) using 32 cores in parallel to calculate similarity of a given signal against the training dataset through evaluation of feature-vector angles in which 32 is the number of frequency channels used, and (ii) employing a GPU/many-core system with each core responsible to check similarity with one or a predefined subset of the dataset. Obviously, use of the first method would decrease the computation time for a single A-line by a factor of 32 while the latter can decrease the entire end-to-end compensation time with a factor equal to the number of cores; this can be up to 7000 for modern GPUs. The fact that our method can easily be segregated amongst parallel threads argues for a FPGA-based hardware implementation to be plausible which can be integrated into the transducers, outputting aberration compensated image in real-time.
The proposed method is independent from the skull anatomy. This is a valuable feature of our proposed algorithm because in a TsPAM experiment, the anatomy of the skull as well as the spatial characteristics of the skull are not available. In this preliminary work, we assumed that the skull is flat and perpendicular to the transducer axis.
Although the compensation algorithm is based on preparing a training set, it is not considered a machine learning algorithm, mainly because it does not have a layered kernel to yield the compensated signal from the input aberrated signal.
The aberration compensation proposed algorithm has several limitations: (i) the skull is considered as a homogenized single layer bone with smooth surfaces and no curvature; (ii) the brain is considered as a homogenized soft tissue with constant acoustic properties; (iii) attenuation of light due to the skull or depth is ignored and it is assumed that sufficient initial pressure is generated at the imaging target location; (iv) PA signal is assumed to be generated from a single point spherical source and the effect of other adjacent sources on the PA signal is neglected; (v) the simulation framework and wave propagation model could be extended to simulate a line-shaped absorbing source to account for a realistic shape of the optical absorption source in the tissue.
In a real-world application after we acquire raw data from a TsPAM system, we will use our proposed algorithm as explained in Section 2.3, with only one change which is, adding more data to the VSS training dataset. So far we have trained the VSS algorithm only with flat skulls. In the future, by using finite-element method the skull surface will be segmented into very small regions (that are comparable to the acoustic wavelength). These small regions can each be approximated as a layer with a flat surface but angled versus the axis that connects the transducer (defined as a point detector) and the absorbing target (defined as a point source). Our simulator [21] will then generate data with different angles of the flat skull (see Table 3 representing preliminary data related to angled skull transmission) to determine how much of the incident signal is diffracted and how much of it received by the transducer; such data will be added to the VSS training dataset.
5. Conclusion
We developed a skull-induced aberration compensation algorithm based on vector space similarity model and ray-tracing-based simulations. The main feature of the algorithm is its simplicity and fast execution time. We demonstrated the effectiveness of the algorithm tested on numerical phantoms with a recovery percentage of 91.9%; i.e., 91.9% of the distorted signal due to the amplitude attenuation, time shift, and signal broadening were retrieved. By adding noise to the aberrated signals, the noise tolerance of the algorithm was evaluated; the recovery percentage was decreased to 90.60% (adding 10% noise) and 87.95% (adding 20% noise). Using GPU and FPGA for parallel implementation of the code, considering more sophisticated skull and tissue models, and taking into account the effect of the fluence, are the future plans of the current study.
Acknowledgments
We thank Dr. Rayyan Manwar from Wayne State University for editing the manuscript. The portion of research performed at the University of Illinois Chicago was supported by the National Institute of Biomedical Imaging and Bioengineering of the National Institutes of Health under Award Numbers R01EB027769-01R01EB028661-01. The content is solely the responsibility of the authors and does not necessarily represent the official views of the National Institutes of Health.
A typographical correction was made to the acknowledgments section.
Funding
National Institutes of Health10.13039/100000002 (R01EB027769-01 R01EB028661-01).
Disclosures
The authors declare no conflicts of interest.
References
- 1.Wang L. V., “Tutorial on photoacoustic microscopy and computed tomography,” IEEE J. Sel. Top. Quantum Electron. 14(1), 171–179 (2008). 10.1109/JSTQE.2007.913398 [DOI] [Google Scholar]
- 2.Li M., Tang Y., Yao J., “Photoacoustic tomography of blood oxygenation: A mini review,” Photoacoustics (2018). [DOI] [PMC free article] [PubMed]
- 3.Mohammadi-Nejad A.-R., Mahmoudzadeh M., Hassanpour M. S., Wallois F., Muzik O., Papadelis C., Hansen A., Soltanian-Zadeh H., Gelovani J., Nasiriavanaki M., “Neonatal brain resting-state functional connectivity imaging modalities,” Photoacoustics 10, 1 (2018). 10.1016/j.pacs.2018.01.003 [DOI] [PMC free article] [PubMed] [Google Scholar]
- 4.Kang J., Boctor E. M., Adams S., Kulikowicz E., Zhang H. K., Koehler R. C., Graham E. M., “Validation of noninvasive photoacoustic measurements of sagittal sinus oxyhemoglobin saturation in hypoxic neonatal piglets,” J. Appl. Physiol. 125(4), 983–989 (2018). 10.1152/japplphysiol.00184.2018 [DOI] [PMC free article] [PubMed] [Google Scholar]
- 5.Nasiriavanaki M., Xia J., Wan H., Bauer A. Q., Culver J. P., Wang L. V., “High-resolution photoacoustic tomography of resting-state functional connectivity in the mouse brain,” Proc. Natl. Acad. Sci. 111(1), 21–26 (2014). 10.1073/pnas.1311868111 [DOI] [PMC free article] [PubMed] [Google Scholar]
- 6.Yang J.-M., Favazza C., Chen R., Yao J., Cai X., Maslov K., Zhou Q., Shung K. K., Wang L. V., “Simultaneous functional photoacoustic and ultrasonic endoscopy of internal organs in vivo,” Nat. Med. 18(8), 1297–1302 (2012). 10.1038/nm.2823 [DOI] [PMC free article] [PubMed] [Google Scholar]
- 7.Mahmoodkalayeh S., Jooya H. Z., Hariri A., Zhou Y., Xu Q., Ansari M. A., Avanaki M. R., “Low temperature-mediated enhancement of photoacoustic imaging depth,” Sci. Rep. 8(1), 4873 (2018). 10.1038/s41598-018-22898-2 [DOI] [PMC free article] [PubMed] [Google Scholar]
- 8.Kratkiewicz K., Manwara R., Zhou Y., Mozaffarzadeh M., Avanaki K., “Technical considerations when using verasonics research ultrasound platform for developing a photoacoustic imaging system,” arXiv preprint arXiv:2008.06086 (2020). [DOI] [PMC free article] [PubMed]
- 9.Wang X., Pang Y., Ku G., Xie X., Stoica G., Wang L. V., “Noninvasive laser-induced photoacoustic tomography for structural and functional in vivo imaging of the brain,” Nat. Biotechnol. 21(7), 803–806 (2003). 10.1038/nbt839 [DOI] [PubMed] [Google Scholar]
- 10.Yao J., Xia J., Maslov K. I., Nasiriavanaki M., Tsytsarev V., Demchenko A. V., Wang L. V., “Noninvasive photoacoustic computed tomography of mouse brain metabolism in vivo,” NeuroImage 64, 257–266 (2013). 10.1016/j.neuroimage.2012.08.054 [DOI] [PMC free article] [PubMed] [Google Scholar]
- 11.Li L., Xia J., Li G., Garcia-Uribe A., Sheng Q., Anastasio M. A., Wang L. V., “Label-free photoacoustic tomography of whole mouse brain structures ex vivo,” Neurophotonics 3(3), 1 (2016). 10.1117/1.NPh.3.3.035001 [DOI] [PMC free article] [PubMed] [Google Scholar]
- 12.Yao J., Wang L., Yang J.-M., Maslov K. I., Wong T. T., Li L., Huang C.-H., Zou J., Wang L. V., “High-speed label-free functional photoacoustic microscopy of mouse brain in action,” Nat. Methods 12(5), 407–410 (2015). 10.1038/nmeth.3336 [DOI] [PMC free article] [PubMed] [Google Scholar]
- 13.Lin L., Xia J., Wong T. T., Li L., Wang L. V., “In vivo deep brain imaging of rats using oral-cavity illuminated photoacoustic computed tomography,” J. Biomed. Opt. 20(1), 016019 (2015). 10.1117/1.JBO.20.1.016019 [DOI] [PMC free article] [PubMed] [Google Scholar]
- 14.Li M.-L., Oh J.-T., Xie X., Ku G., Wang W., Li C., Lungu G., Stoica G., Wang L. V., “Simultaneous molecular and hypoxia imaging of brain tumors in vivo using spectroscopic photoacoustic tomography,” Proc. IEEE 96(3), 481–489 (2008). 10.1109/JPROC.2007.913515 [DOI] [Google Scholar]
- 15.Hu S., Maslov K., Tsytsarev V., Wang L. V., “Functional transcranial brain imaging by optical-resolution photoacoustic microscopy,” J. Biomed. Opt. 14(4), 040503 (2009). 10.1117/1.3194136 [DOI] [PMC free article] [PubMed] [Google Scholar]
- 16.Kneipp M., Turner J., Estrada H., Rebling J., Shoham S., Razansky D., “Effects of the murine skull in optoacoustic brain microscopy,” J. Biophotonics 9(1-2), 117–123 (2016). 10.1002/jbio.201400152 [DOI] [PubMed] [Google Scholar]
- 17.Estrada H., Rebling J., Turner J., Razansky D., “Broadband acoustic properties of a murine skull,” Phys. Med. Biol. 61(5), 1932–1946 (2016). 10.1088/0031-9155/61/5/1932 [DOI] [PubMed] [Google Scholar]
- 18.O’Reilly M. A., Muller A., Hynynen K., “Ultrasound insertion loss of rat parietal bone appears to be proportional to animal mass at submegahertz frequencies,” Ultrasound in medicine & biology 37(11), 1930–1937 (2011). 10.1016/j.ultrasmedbio.2011.08.001 [DOI] [PMC free article] [PubMed] [Google Scholar]
- 19.Jin X., Li C., Wang L. V., “Effects of acoustic heterogeneities on transcranial brain imaging with microwave-induced thermoacoustic tomography,” Med. Phys. 35(7Part1), 3205–3214 (2008). 10.1118/1.2938731 [DOI] [PMC free article] [PubMed] [Google Scholar]
- 20.Estrada H., Huang X., Rebling J., Zwack M., Gottschalk S., Razansky D., “Virtual craniotomy for high-resolution optoacoustic brain microscopy,” Sci. Rep. 8(1), 1459 (2018). 10.1038/s41598-017-18857-y [DOI] [PMC free article] [PubMed] [Google Scholar]
- 21.Mohammadi L., Behnam H., Tavakkoli J., Avanaki M., “Skull’s photoacoustic attenuation and dispersion modeling with deterministic ray-tracing: Towards real-time aberration correction,” Sensors 19(2), 345 (2019). 10.3390/s19020345 [DOI] [PMC free article] [PubMed] [Google Scholar]
- 22.Schoonover R. W., Wang L. V., Anastasio M. A., “Numerical investigation of the effects of shear waves in transcranial photoacoustic tomography with a planar geometry,” J. Biomed. Opt. 17(6), 061215 (2012). 10.1117/1.JBO.17.6.061215 [DOI] [PMC free article] [PubMed] [Google Scholar]
- 23.Fry F., Barger J., “Acoustical properties of the human skull,” J. Acoust. Soc. Am. 63(5), 1576–1590 (1978). 10.1121/1.381852 [DOI] [PubMed] [Google Scholar]
- 24.Xu Q., Volinski B., Hariri A., Fatima A., Nasiriavanaki M., “Effect of small and large animal skull bone on photoacoustic signal,” in Photons Plus Ultrasound: Imaging and Sensing 2017, vol. 10064 (International Society for Optics and Photonics, 2017), p. 100643S. [Google Scholar]
- 25.Volinski B., Hariri A., Fatima A., Xu Q., Nasiriavanaki M., “Photoacoustic investigation of a neonatal skull phantom,” in Photons Plus Ultrasound: Imaging and Sensing 2017, vol. 10064 (International Society for Optics and Photonics, 2017), p. 100643T. [Google Scholar]
- 26.Treeby B. E., Cox B., “Modeling power law absorption and dispersion for acoustic propagation using the fractional laplacian,” J. Acoust. Soc. Am. 127(5), 2741–2748 (2010). 10.1121/1.3377056 [DOI] [PubMed] [Google Scholar]
- 27.Treeby B. E., “Acoustic attenuation compensation in photoacoustic tomography using time-variant filtering,” J. Biomed. Opt. 18(3), 036008 (2013). 10.1117/1.JBO.18.3.036008 [DOI] [PubMed] [Google Scholar]
- 28.Wydra A., “Development of a new forming process to fabricate a wide range of phantoms that highly match the acoustical properties of human bone,” M.Sc. Thesis (2013).
- 29.Deán-Ben X. L., Razansky D., Ntziachristos V., “The effects of acoustic attenuation in optoacoustic signals,” Phys. Med. Biol. 56(18), 6129–6148 (2011). 10.1088/0031-9155/56/18/021 [DOI] [PubMed] [Google Scholar]
- 30.Nam K., Rosado-Mendez I. M., Rubert N. C., Madsen E. L., Zagzebski J. A., Hall T. J., “Ultrasound attenuation measurements using a reference phantom with sound speed mismatch,” Ultrasonic imaging 33(4), 251–263 (2011). 10.1177/016173461103300404 [DOI] [PMC free article] [PubMed] [Google Scholar]
- 31.Yoon K., Lee W., Croce P., Cammalleri A., Yoo S.-S., “Multi-resolution simulation of focused ultrasound propagation through ovine skull from a single-element transducer,” Phys. Med. Biol. 63(10), 105001 (2018). 10.1088/1361-6560/aabe37 [DOI] [PMC free article] [PubMed] [Google Scholar]
- 32.Kyriakou A., Neufeld E., Werner B., Székely G., Kuster N., “Full-wave acoustic and thermal modeling of transcranial ultrasound propagation and investigation of skull-induced aberration correction techniques: a feasibility study,” J. therapeutic ultrasound 3(1), 11 (2015). 10.1186/s40349-015-0032-9 [DOI] [PMC free article] [PubMed] [Google Scholar]
- 33.Huang C., Nie L., Schoonover R. W., Guo Z., Schirra C. O., Anastasio M. A., Wang L. V., “Aberration correction for transcranial photoacoustic tomography of primates employing adjunct image data,” J. Biomed. Opt. 17(6), 066016 (2012). 10.1117/1.JBO.17.6.066016 [DOI] [PMC free article] [PubMed] [Google Scholar]
- 34.Aubry J.-F., Tanter M., Pernot M., Thomas J.-L., Fink M., “Experimental demonstration of noninvasive transskull adaptive focusing based on prior computed tomography scans,” J. Acoust. Soc. Am. 113(1), 84–93 (2003). 10.1121/1.1529663 [DOI] [PubMed] [Google Scholar]
- 35.Marquet F., Pernot M., Aubry J., Montaldo G., Marsac L., Tanter M., Fink M., “Non-invasive transcranial ultrasound therapy based on a 3d ct scan: protocol validation and in vitro results,” Phys. Med. Biol. 54(9), 2597–2613 (2009). 10.1088/0031-9155/54/9/001 [DOI] [PubMed] [Google Scholar]
- 36.Pinton G., Aubry J.-F., Bossy E., Muller M., Pernot M., Tanter M., “Attenuation, scattering, and absorption of ultrasound in the skull bone,” Med. Phys. 39(1), 299–307 (2012). 10.1118/1.3668316 [DOI] [PubMed] [Google Scholar]
- 37.Almquist S., Parker D. L., Christensen D. A., “Rapid full-wave phase aberration correction method for transcranial high-intensity focused ultrasound therapies,” Journal of therapeutic ultrasound 4(1), 30 (2016). 10.1186/s40349-016-0074-7 [DOI] [PMC free article] [PubMed] [Google Scholar]
- 38.Kyriakou A., Neufeld E., Werner B., Paulides M. M., Szekely G., Kuster N., “A review of numerical and experimental compensation techniques for skull-induced phase aberrations in transcranial focused ultrasound,” Int. J. Hyperthermia 30(1), 36–46 (2014). 10.3109/02656736.2013.861519 [DOI] [PubMed] [Google Scholar]
- 39.Antholzer S., Haltmeier M., Nuster R., Schwab J., “Photoacoustic image reconstruction via deep learning,” in Photons Plus Ultrasound: Imaging and Sensing 2018, Vol. 10494 (International Society for Optics and Photonics, 2018), p. 104944U. [Google Scholar]
- 40.Allman D., Reiter A., Bell M. A. L., “A machine learning method to identify and remove reflection artifacts in photoacoustic channel data,” in 2017 IEEE International Ultrasonics Symposium (IUS) (IEEE, 2017), pp. 1–4. [Google Scholar]
- 41.Allman D., Reiter A., Bell M. A. L., “Photoacoustic source detection and reflection artifact removal enabled by deep learning,” IEEE Trans. Med. Imaging 37(6), 1464–1477 (2018). 10.1109/TMI.2018.2829662 [DOI] [PMC free article] [PubMed] [Google Scholar]
- 42.Reiter A., Bell M. A. L., “A machine learning approach to identifying point source locations in photoacoustic data,” in Photons Plus Ultrasound: Imaging and Sensing 2017, Vol. 10064 (International Society for Optics and Photonics, 2017), p. 100643J. [Google Scholar]
- 43.Waibel D., Gröhl J., Isensee F., Kirchner T., Maier-Hein K., Maier-Hein L., “Reconstruction of initial pressure from limited view photoacoustic images using deep learning,” in Photons Plus Ultrasound: Imaging and Sensing 2018, Vol. 10494 (International Society for Optics and Photonics, 2018), p. 104942S. [Google Scholar]
- 44.Antholzer S., Haltmeier M., Schwab J., “Deep learning for photoacoustic tomography from sparse data,” Inverse Probl. Sci. Eng. 27(7), 987–1005 (2019). 10.1080/17415977.2018.1518444 [DOI] [PMC free article] [PubMed] [Google Scholar]
- 45.Mozaffarzadeh M., Mahloojifar A., Orooji M., Adabi S., Nasiriavanaki M., “Double-stage delay multiply and sum beamforming algorithm: Application to linear-array photoacoustic imaging,” IEEE Trans. Biomed. Eng. 65(1), 31–42 (2018). 10.1109/TBME.2017.2690959 [DOI] [PubMed] [Google Scholar]
- 46.Mozaffarzadeh M., Mahloojifar A., Orooji M., Kratkiewicz K., Adabi S., Nasiriavanaki M., “Linear-array photoacoustic imaging using minimum variance-based delay multiply and sum adaptive beamforming algorithm,” J. Biomed. Opt. 23(02), 1 (2018). 10.1117/1.JBO.23.2.026002 [DOI] [PubMed] [Google Scholar]
- 47.Omidi P., Zafar M., Mozaffarzadeh M., Hariri A., Haung X., Orooji M., Nasiriavanaki M., “A novel dictionary-based image reconstruction for photoacoustic computed tomography,” Appl. Sci. 8(9), 1570 (2018). 10.3390/app8091570 [DOI] [Google Scholar]
- 48.Salton G., Buckley C., “Term-weighting approaches in automatic text retrieval,” Inf. Process. Manage. 24(5), 513–523 (1988). 10.1016/0306-4573(88)90021-0 [DOI] [Google Scholar]
- 49.Kwak M., Leroy G., Martinez J. D., Harwell J., “Development and evaluation of a biomedical search engine using a predicate-based vector space model,” J. Biomed. Inf. 46(5), 929–939 (2013). 10.1016/j.jbi.2013.07.006 [DOI] [PubMed] [Google Scholar]
- 50.Cho H.-C., Hadjiiski L., Sahiner B., Chan H.-P., Helvie M., Paramagul C., Nees A. V., “Similarity evaluation in a content-based image retrieval (cbir) cadx system for characterization of breast masses on ultrasound images,” Med. Phys. 38(4), 1820–1831 (2011). 10.1118/1.3560877 [DOI] [PMC free article] [PubMed] [Google Scholar]
- 51.Mohammadi L., Manwar R., Behnam H., Tavakkoli J., Avanaki M. R. N., “Skull’s aberration modeling: towards photoacoustic human brain imaging,” in Photons Plus Ultrasound: Imaging and Sensing 2019, Vol. 10878 (International Society for Optics and Photonics, 2019), p. 108785W. [Google Scholar]
- 52.Mohammadi L., Behnam H., Tavakkoli J., Nasiriavanaki M., “Skull’s acoustic attenuation and dispersion modeling on photoacoustic signal,” in Photons Plus Ultrasound: Imaging and Sensing 2018, Vol. 10494 (International Society for Optics and Photonics, 2018), p. 104946K. [Google Scholar]
- 53.Mohammadi L., Behnam H., Nasiriavanaki M., “Modeling skull’s acoustic attenuation and dispersion on photoacoustic signal,” in Photons Plus Ultrasound: Imaging and Sensing 2017, Vol. 10064 (International Society for Optics and Photonics, 2017), p. 100643U. [Google Scholar]
- 54.Pourebrahimi B., Al-Mahrouki A., Zalev J., Nofiele J., Czarnota G. J., Kolios M. C., “Classifying normal and abnormal vascular tissues using photoacoustic signals,” in Photons Plus Ultrasound: Imaging and Sensing 2013, Vol. 8581 (International Society for Optics and Photonics, 2013), p. 858141. [Google Scholar]
- 55.Pourebrahimi B., Kolios M. C., Czarnota G. J., “Method for classifying tissue response to cancer treatment using photoacoustics signal analysis,” (2014). US Patent App. 14/169,421.
- 56.Clement G., White P., Hynynen K., “Enhanced ultrasound transmission through the human skull using shear mode conversion,” J. Acoust. Soc. Am. 115(3), 1356–1364 (2004). 10.1121/1.1645610 [DOI] [PubMed] [Google Scholar]
- 57.Lee D. L., Chuang H., Seamons K., “Document ranking and the vector-space model,” IEEE Softw. 14(2), 67–75 (1997). 10.1109/52.582976 [DOI] [Google Scholar]
- 58.Boashash B., Time-frequency Signal Analysis and Processing: A Comprehensive Reference (Academic Press, 2015). [Google Scholar]
- 59.Petrovic B., Parolai S., “Joint deconvolution of building and downhole strong-motion recordings: Evidence for the seismic wavefield being radiated back into the shallow geological layers,” Bull. Seismol. Soc. Am. 106(4), 1720–1732 (2016). 10.1785/0120150326 [DOI] [Google Scholar]
- 60.Resnick P., Iacovou N., Suchak M., Bergstrom P., Riedl J., “Grouplens: an open architecture for collaborative filtering of netnews,” in Proceedings of the 1994 ACM conference on Computer supported cooperative work, (1994), pp. 175–186. [Google Scholar]
- 61.Herlocker J., Konstan J. A., Riedl J., “An empirical analysis of design choices in neighborhood-based collaborative filtering algorithms,” Information retrieval 5(4), 287–310 (2002). 10.1023/A:1020443909834 [DOI] [Google Scholar]


