

O2 is a fundamental environmental metabolite that affects all life on earth. While toxic to many microbes and obligately required by others, those that have appropriate physiological responses survive and can even benefit from various levels of O2, particularly in biofilm communities. Although most studies have focused on measuring O2 within biofilms, little is known about O2 gradients surrounding biofilms. Here, we developed electrochemical methodology based on scanning electrochemical microscopy to measure the O2 gradients surrounding biofilms in real time on the micron scale. Our results reveal that P. aeruginosa biofilms produce a hypoxic zone that can extend hundreds of microns from the biofilm surface and that this gradient remains even after the addition of antibiotic concentrations that eradicated 99% of viable cells. Our results provide a high resolution of the O2 gradients produced by P. aeruginosa biofilms and reveal sustained O2 consumption in the presence of antibiotics.
KEYWORDS: biofilm, oxygen, antibiotics, electrochemistry, Pseudomonas aeruginosa, antibiotic resistance
ABSTRACT
Bacteria alter their local chemical environment through both consumption and the production of a variety of molecules, ultimately shaping the local ecology. Molecular oxygen (O2) is a key metabolite that affects the physiology and behavior of virtually all bacteria, and its consumption often results in O2 gradients within sessile bacterial communities (biofilms). O2 plays a critical role in several bacterial phenotypes, including antibiotic tolerance; however, our understanding of O2 levels within and surrounding biofilms has been hampered by the difficulties in measuring O2 levels in real-time for extended durations and at the micron scale. Here, we developed electrochemical methodology based on scanning electrochemical microscopy to quantify the O2 gradients present above a Pseudomonas aeruginosa biofilm. These results reveal that a biofilm produces a hypoxic zone that extends hundreds of microns from the biofilm surface within minutes and that the biofilm consumes O2 at a maximum rate. Treating the biofilm with levels of the antibiotic ciprofloxacin that kill 99% of the bacteria did not affect the O2 gradient, indicating that the biofilm is highly resilient to antimicrobial treatment in regard to O2 consumption.
OBSERVATION
Molecular oxygen (O2) is one of the most important molecules dictating bacterial lifestyle and behavior. For organisms capable of tolerating O2, it can provide a means to remove excess electrons formed during metabolism. While general fundamentals of O2 consumption are well established, the role of O2 is complex in bacterial communities, including those associated with human infection, since O2 levels vary tremendously based on the infection site and the host response (1–3). In addition, bacteria in many infections grow as sessile communities called biofilms (4), and the three-dimensional structure of these communities can affect O2 levels throughout the biofilm.
Previous work has shown that O2 gradients within biofilms affect their biology (5, 6). This has prompted an examination of O2 levels within and surrounding biofilms. In particular, stagnant biofilms rapidly deplete O2 and waste material buildup occurs as a result of mass transport limitation at the surface of biofilms (7). Although it is clear that O2 levels are decreased within the biofilm, the levels immediately adjacent to the biofilm surface have not been thoroughly investigated in static biofilms, in part due to the difficulties in robustly measuring O2 with high spatial precision (5, 8–13). To address this gap in knowledge, we developed a system to spatially measure O2 levels above a microbial biofilm in real time at the micron scale. We chose the facultative anaerobe Pseudomonas aeruginosa strain PA14 for these studies since this opportunistic pathogen preferentially utilizes aerobic respiration (14), and its physiology and behavior are highly influenced by O2 availability (14, 15).
A significant challenge that was overcame is the inherent difficulty with continuously measuring O2 over extended time periods. To address this challenge, we developed a system using electrochemical methods to measure O2 in real-time with micron-scale spatial resolution (Fig. 1A). O2 can be detected electrochemically through a four-electron reduction on a platinum ultramicroelectrode (UME) (Fig. 1A) (16). However, platinum UMEs readily deactivate which leads to long wait times for O2 current stabilization and sub-nA current (see Fig. S1 in the supplemental material). To address this challenge, we optimized a platinization protocol that coats the UME surface with platinum particles that actively reduce O2 while avoiding severe changes in the geometry of the UME surface (see Fig. S2). Importantly, our platinum UMEs had a higher electroactive area and could continuously monitor O2 levels over several hours without loss of sensitivity (Fig. 1B). This is especially important because the current measured in bulk was approximated to be 205 μM; since current measured is directly proportional to O2 concentration, stability ensures accurate O2 measurement despite each platinized UME used only once per experiment and having slightly variable degrees of platinization or size after polishing.
FIG 1.

Experimental system and SECM detection of the O2 gradient surrounding a P. aeruginosa biofilm. (A) Schematic of SECM setup for measurement of O2 gradient surrounding a P. aeruginosa biofilm (left), including a closeup of the SECM cell and O2 reduction reaction at the UME tip (right). (B) The platinized UME continuously monitors bulk O2 levels through measurement of tip current over several hours without loss of sensitivity. The y axis (ordinate) is the ratio of the tip current at each time point divided by the tip current at time zero. Each color represent biological replicates. PCM, polycarbonate membrane; DS, double-sided; UME, ultramicroelectrode.
Unplatinized platinum UME measuring O2. In contrast to a platinized UME, current measured using an unplatinized platinum UME resulted in low current and a slow decrease in current over time due to fouling. Download FIG S1, PDF file, 0.1 MB (90KB, pdf) .
Copyright © 2020 Klementiev et al.
This content is distributed under the terms of the Creative Commons Attribution 4.0 International license.
Electroactive surface area and roughness increases with platinization. (Above) Electroactive area was measured using 0.1 M H2SO4. Geometric surface area was measured using 1 mM FcMeOH. RoughF = Electroactive Surface Area AFTER/Geometric Surface Area AFTER. RoughI = Electroactive Surface Area BEFORE/Geometric Surface Area BEFORE. “BEFORE” and “AFTER” refer to before and after platinization. (Below) Representative cyclic voltammogram of platinum UME in 0.1 M H2SO4 for 100 cycles each; blue corresponding to before platinization and yellow after platinization. Download FIG S2, PDF file, 0.1 MB (74.8KB, pdf) .
Copyright © 2020 Klementiev et al.
This content is distributed under the terms of the Creative Commons Attribution 4.0 International license.
We next sought to measure O2 levels surrounding a P. aeruginosa biofilm using scanning electrochemical microscopy (SECM). The P. aeruginosa strain chosen for this work (fliC9::MrT7) (17) has an inactivated flagellar motor protein, rendering the strain unable to leave the biofilm via swimming motility. Biofilms of the P. aeruginosa fliC mutant were formed on polycarbonate membranes as previously described for electrochemical studies (18). Membrane biofilms were grown for 8 h on Todd Hewitt broth (THB) agar, yielding an ∼3-mm-diameter nascent biofilm containing ∼4 × 10⁷ bacteria (see Fig. S3). These biofilms contain fewer cells than those used in previous studies (5, 8) focused on O2 consumption to better mimic biofilms observed in human infections. After formation, the membrane containing the biofilm was removed from the agar plate and attached to the bottom of a glass vial using double-sided tape and covered with ∼5 ml of morpholinepropanesulfonic acid (MOPS)-glucose minimal medium.
Image of biofilm (arrow) used in these studies. The average biofilm diameter was 2.94 mm ± 0.24 mm (mean ± the standard deviation, n = 48). The vial measures approximately 20 mm (inner diameter) by 25 mm (height) with ∼5 ml of MOPS-glucose minimal media corresponding to a level ∼15 mm above the biofilm surface. Download FIG S3, PDF file, 0.04 MB (43.9KB, pdf) .
Copyright © 2020 Klementiev et al.
This content is distributed under the terms of the Creative Commons Attribution 4.0 International license.
To measure O2 levels above the biofilm, a 10-μm-diameter platinized UME was approached to 40 μm above the biofilm surface using ferrocenyl methyl trimethylammonium (FcMTMA+; the toxicity and stability are assessed in Text S1 in the supplemental material) as the redox mediator (Fig. S4 and S5) using SECM (19). The UME tip was then poised at −0.5 V (O2 reduction potential), with a wait time of 5 min; afterward, the UME was retracted at 6 μm/s while continually measuring O2 until bulk O2 levels were detected, ∼1,400 μm above the biofilm surface (the O2 gradient calculations are detailed in Text S1). The O2 levels above the biofilm resembled a sigmoidal curve with no O2 detectable until ∼200 μm above the biofilm (Fig. 2A; see also Fig. S6). Assuming a 10-pA minimal background current, the detection limit of the UME is ∼1 μM.
FIG 2.
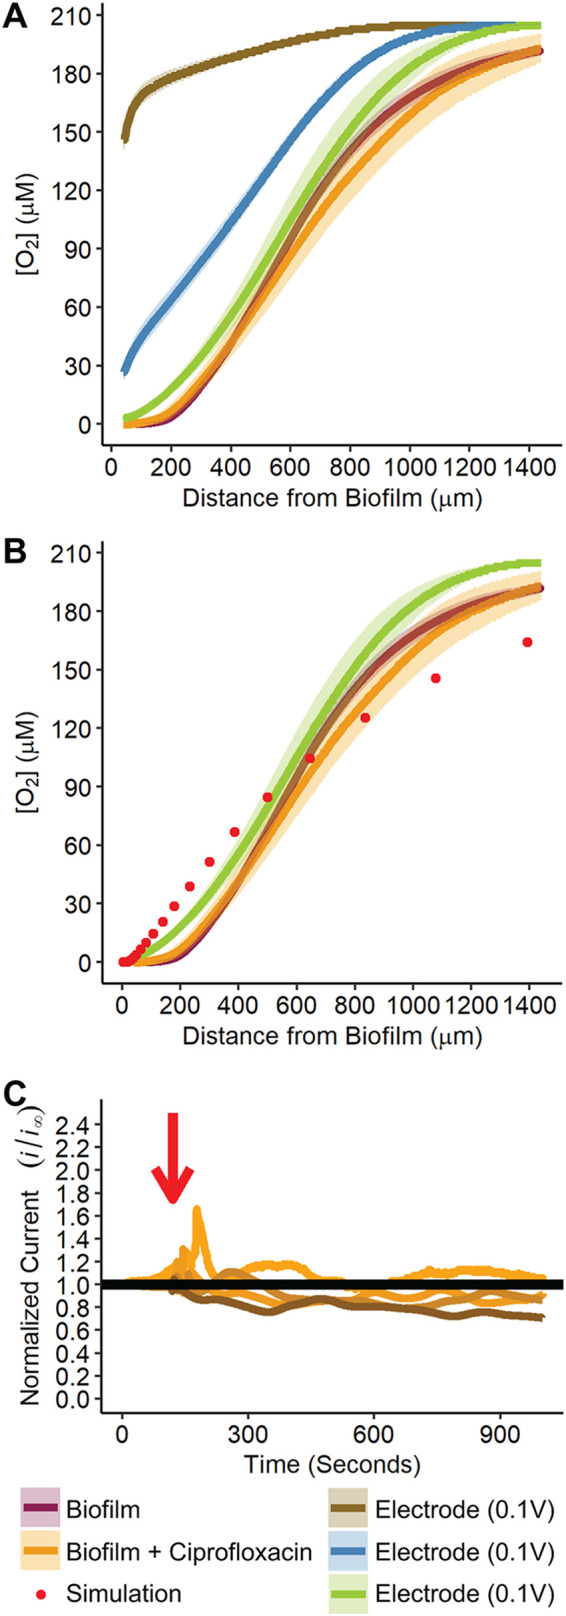
P. aeruginosa rapidly produce O2 gradients that are resilient to antibiotic treatment. (A) O2 gradients above the surface of P. aeruginosa biofilms, P. aeruginosa biofilms treated with ciprofloxacin, and for reference a 3-mm platinum electrode poised at 0, 0.1, and −0.5 V versus Ag/AgCl (different electrode potentials correspond to various O2 consumption rates). n = 4 biological replicates for Electrode 0.1 V, Electrode 0 V, Electrode −0.5 V, and Biofilm + Ciprofloxacin, and n = 16 biological replicates for biofilm. For all O2 gradients, shading represents one standard deviation from the mean (solid line). (B) Digital simulation (red circles) to estimate O2 consumption rates of the biofilm. The model was solved by Comsol Multiphysics (5.3a; COMSOL, Inc., Burlington, MA) using the electrochemical analysis module in two-dimensional axial symmetry using stationary conditions with a parametric sweep of the “d” or distance between UME tip and substrate (Fig. S5, and detailed in Text S1). (C) Changes in O2 concentration 600 μm above a biofilm measured as a response to ciprofloxacin treatment. At 120 s, the first dose of 20 μg/ml ciprofloxacin was added (designated by red arrow). Each line represents a biological replicate. The y axis (ordinate) is the ratio of the tip current at each time point divided by current measured before ciprofloxacin addition (i.e., a value of 1 indicates no change in current after ciprofloxacin addition). There were changes immediately after ciprofloxacin addition (peaks at red arrow), likely a result of the mixing caused by addition of ciprofloxacin to the growth media above the biofilm. Importantly, the current quickly stabilized.
Supplemental methods. Download Text S1, PDF file, 0.2 MB (167.5KB, pdf) .
Copyright © 2020 Klementiev et al.
This content is distributed under the terms of the Creative Commons Attribution 4.0 International license.
FcMTMA+ does not influence the growth rate of P. aeruginosa. (Above) Growth curve of P. aeruginosa PA14 fliC9::MrT7 in MOPS-glucose. Blue points represent growth without FcMTMA+ and orange points represent growth with FcMTMA+. Experiments represent biological triplicates. (Below) Electrochemical measurements done in tandem with growth experiments to observe changes in FcMTMA+ signal. Growth kinetics: data points from 1.5 to 6 h were plotted on a semilog graph and the following equation (X = X0ekt) was used to determine the growth rate constant k (s−1) pA is picoamps, and Pt is platinum. Download FIG S4, PDF file, 0.1 MB (85.2KB, pdf) .
Copyright © 2020 Klementiev et al.
This content is distributed under the terms of the Creative Commons Attribution 4.0 International license.
Approach curve to biofilm surface. (A) To determine the distance the UME tip was from the biofilm surface, the UME was first approached to confirm it was near the surface as represented by the orange line. (The inlaid cyclic voltammogram corresponds to FcMTMA+ oxidation. We selected +0.5 V for approach curves because it was at a limiting current potential.) The UME was then retracted, and a finer approach was done to 95% of the current. Fit to a mathematical expression, a 95% current decrease corresponds to approximately L = d/a = 7.17, where d is the distance between the UME tip and the biofilm surface), and a is the tip radius (9). (B) With a tip radius (a) of 5 μm, this corresponds to a distance (d) of ∼40 μm from the biofilm surface. Download FIG S5, PDF file, 0.3 MB (275.5KB, pdf) .
Copyright © 2020 Klementiev et al.
This content is distributed under the terms of the Creative Commons Attribution 4.0 International license.
Calculating O2 gradients. The y axis (ordinate) is the ratio of the tip current found in bulk (raw current averaged between points at ∼1,400 μm to ∼1,300 μm) divided by current measured at each point. Measured current was converted to gradients by multiplying this ratio (obtained in this graph) by the concentration of O2 in bulk (205 μM) to produce Fig. 2. Three biological replicates of all replicates are shown; gold colors represent O2 gradients before ciprofloxacin, and blue colors represent O2 gradients after ciprofloxacin was added. The red line was added to represent the limit of detection of an unplatinized UME and the limit we generously set for all UMEs. While platinization increased the sensitivity for all UMEs, we observed that this sensitivity limit did not fluctuate drastically. Download FIG S6, PDF file, 0.2 MB (193.6KB, pdf) .
Copyright © 2020 Klementiev et al.
This content is distributed under the terms of the Creative Commons Attribution 4.0 International license.
For comparison, we created an O2 gradient without a biofilm using a platinum electrode the same size as the biofilm as the SECM substrate. The 3-mm platinum electrode was held at three potentials (0.1, 0, and −0.5 V versus Ag/AgCl) for 5 min, and then the O2 gradient was measured as described for the biofilm (detailed in Text S1). The biofilm O2 gradient was similar to the −0.5 V poised electrode gradient, which is the potential at which O2 reduction is mass transport limited at the surface of the electrode. The biofilm O2 gradient was distinct from the other potentials at which O2 was being consumed at a submaximal rate (i.e., limited in part by kinetics and not predominantly by mass transport). Using Comsol Multiphysics to digitally simulate O2 consumption (Fig. 2B; see also Fig. S7), we approximated the flux of O2 at the surface of the biofilm to be 8.2 × 10⁻⁷ mol/cm2/s (detailed in Text S1). Assuming each cell has a dimension of 1.5 μm × 0.8 μm, 9.8 × 10⁻¹⁵ mol/s O2 or 5.9 × 10⁹ molecules of O2 per second were consumed by each bacterium. Collectively, these results reveal that P. aeruginosa biofilms produce a hypoxic zone that can extend hundreds of microns from the biofilm surface within minutes, and the biofilm consumes O2 at a maximum rate.
Schematic diagram of Comsol Multiphysics model depicting key features. Simulation using Comsol to determine the O2 consumption rate. Download FIG S7, PDF file, 0.03 MB (33.3KB, pdf) .
Copyright © 2020 Klementiev et al.
This content is distributed under the terms of the Creative Commons Attribution 4.0 International license.
To assess the effect of antibiotic treatment on biofilm O2 consumption, we treated our biofilms with 400 times the MIC of the antibiotic ciprofloxacin (40 μg/ml) and then measured the O2 gradient above the biofilm. We first confirmed that ciprofloxacin does not interfere with the electrochemical signal for O2 quantification (Fig. S8; see also Text S1). Ciprofloxacin treatment of the biofilm was performed by initially adding 20 μg/ml ciprofloxacin and measuring the O2 response 1.5 h after submersion in MOPS-glucose (Fig. 2C). After we observed no immediate change in signal, we treated the biofilm with another 20 μg/ml. After addition of the second dose of ciprofloxacin, the O2 gradient was measured for 50 min with no observable change in the O2 gradient, a total of 1 h and 35 min after ciprofloxacin was first added. Despite the fact that addition of ciprofloxacin reduced the number of viable bacteria in the biofilm by 100-fold to ∼2.4 × 10⁵ bacteria, there was no change in the O2 gradient or O2 consumption rates (Fig. 2A and B).
Addition of ciprofloxacin to MOPS-glucose does not interfere with O2 measurement. Steady-state voltammograms recorded within the potential window between +0.6 V and −0.5 V in the presence of ambient O2 (red), ambient O2 and 200 μg/ml ciprofloxacin (green), and O2 purged solution containing 200 μg/ml ciprofloxacin (blue). Representative data from triplicate experiments are shown. Download FIG S8, PDF file, 0.2 MB (198.3KB, pdf) .
Copyright © 2020 Klementiev et al.
This content is distributed under the terms of the Creative Commons Attribution 4.0 International license.
While prior work has primarily measured bulk O2 at the biofilm/air interface, we show that, in contrast, at a stagnant biofilm/liquid interface a hypoxic region forms several hundred microns above the biofilm surface. Containing only ∼4 × 10⁷ bacteria, our biofilms consumed O2 at maximum rates and continued to do so despite 99% killing by ciprofloxacin. These data corroborate similar findings that bulk respiratory activity and carbon consumption persists despite antibiotic exposure (20, 21). Given this high O2 consumption rate and the observation that biofilms of this size exist in human implant/catheter infections (22), we propose that biofilms are capable of rapidly depleting local O2 in chronic infections even during antibiotic challenge. Ultimately, the experimental system developed in this work provides a valuable framework for studying biofilm O2 consumption.
MATERIALS AND METHODS
Instrumentation.
Initial electrochemistry experiments were performed using a BioLogic SECM (model M470). Biofilm experiments measuring O2 gradients by scanning distances were done using a CHI model 920D scanning electrochemical microscope (CH Instruments). For all experiments, a three-electrode setup was used. This consisted of a 10-μm-diameter platinum UME (working electrode), Ag|AgCl|Saturated KCl (reference electrode to which all potentials are referred to in all experiments), and platinum wire (counter electrode). An in-depth protocol for UME fabrication may be found elsewhere (19).
Ultramicroelectrode fabrication and SECM cell setup.
An in-depth protocol for UME fabrication may be found elsewhere (19). Briefly, platinum (99.9% purity) wire, 10-μm diameter, temper: hard (Goodfellow Metals, Cambridge, United Kingdom; product PT005107) was used for the preparation of the SECM UME tip. The metal wire was heat sealed with a heating coil under vacuum in a glass capillary. The tip was sharpened to an RG of ∼10, where RG is the ratio of the glass diameter to wire diameter. Prior to electrochemical experiments, UMEs were sonicated in a water bath for 30 s. Platinization significantly alters the surface and UMEs were seldom repolished and replatinized for reuse.
Bacterial strain culture and preparation.
P. aeruginosa (PA14) fliC9::MrT7 mutant was obtained from a PA14 nonredundant transposon insertion mutant set (http://ausubellab.mgh.harvard.edu/cgi-bin/pa14/home.cgi) (17). Biofilms were grown in THB agar for 8 h at 37°C, at which point an ∼3-mm-diameter biofilm formed before transfer to the SECM cell. All SECM experiments were performed using MOPS minimal media (23) containing 20 mM glucose. CFU were enumerated at the end of experimentation by removing media above the biofilm, substantially vortexing the biofilm off the polycarbonate membrane, and plating on THB agar plates overnight at 37°C.
Platinizing UMEs.
Handmade 10 μm platinum UMEs (as described above) were sonicated in water, acetone, and water. A modified protocol for platinizing UMEs was used that may be found elsewhere (24) with an adjusted recipe for the platinization solution containing 0.250 ml of H2PtCl6 and 0.4 mg of Pb(NO3)2 up to a final volume of 7.36 ml in 1× phosphate-buffered saline (pH 7.4). Geometric and electroactive effects on the UME surface resulting from platinization were measured to confirm the stability and reproducibility of platinization. An in-depth review of platinizing electrodes can be found elsewhere (25).
Measuring O2.
PA14 tn::fliC biofilms were grown as described above. After 8 h growth, the polycarbonate membrane was removed and attached to the bottom of a custom glass vial using double sided tape. UMEs were cycled in platinizing solution (same as above) from 0.2 V to −0.3 V versus Ag/AgCl at 100 mV/s until the maximum limiting current increased ∼1.2× for FcMTMA+ oxidation (the synthesis is detailed in Text S1). After platinization and ensuring proper geometric area of the UMEs, 1 mM FcMTMA+ was added to MOPS-glucose media, and approximately 5 ml was added to the vial containing the biofilm. A three-electrode setup using a platinum wire counter, and Ag/AgCl reference electrodes were connected. Platinized UMEs were precisely positioned with micron-scale accuracy using SECM. SECM positions UMEs at defined distances from the biofilm surface using an electroactive mediator while observing tip current changes as a function of distance. For this work, we chose the electroactive mediator FcMTMA+ since it is neither consumed by nor is toxic to P. aeruginosa. UMEs were poised at 0.5 V to oxidize FcMTMA+, approached within ∼40 μm above the surface (within the hindered diffusion region corresponding to a decrease in signal to ∼95% limiting current), and then poised at −0.5 V and retracted at 6 μm/s to measure O2 gradients. For antibiotic chronoamperometry curves, UMEs were positioned first approximately 600 μm for the first addition of ciprofloxacin or control, approximately 1 h and 30 min elapsed after MOPS-glucose was added over the biofilm. Ciprofloxacin was added slowly during this time at ∼7.5 mm above the biofilm, and the stage was attached to the vial containing the biofilm was rotated 10 times in a circular motion immediately after addition. The UME was then approached approximately 300 μm above the biofilm for the second addition of ciprofloxacin, approximately 2 h elapsed after MOPS-glucose was added over the biofilm. Ciprofloxacin or control was then added quickly at ∼7.5 mm above the biofilm. For both additions, a 2-min window was given before antibiotics were added to the media and current was measured for a minimum of 1,000 s in total. O2 concentration gradients were immediately measured in triplicate during each biological replicate after the second addition of antibiotics to determine the O2 consumption rates.
ACKNOWLEDGMENTS
We thank Cynthia Zoski, Allen Bard, Cesar Ortiz, Tianhan Kai, Min Zhou, and the Whiteley lab for valuable discussions. We also thank Bryan W. Davies, UT Austin, for providing lab space.
This study was supported by National Institutes of Health grants R01GM116547 (to M.W.), Cystic Fibrosis Foundation grants WHITEL19P0 and WHITEL16G0 (to M.W.), and 1F31DE029415-01 (to A.D.K.). M.W. is a Burroughs Wellcome Investigator in the Pathogenesis of Infectious Disease.
Footnotes
This article is a direct contribution from Marvin Whiteley, a Fellow of the American Academy of Microbiology, who arranged for and secured reviews by Philip Stewart, Montana State University, and Dipankar Koley, Oregon State University.
Citation Klementiev AD, Jin Z, Whiteley M. 2020. Micron scale spatial measurement of the O2 gradient surrounding a bacterial biofilm in real time. mBio 11:e02536-20. https://doi.org/10.1128/mBio.02536-20.
REFERENCES
- 1.Mettraux G, A Gusberti F, Graf H. 1984. Oxygen tension (pO2) in untreated human periodontal pockets. J Periodontol 55:516–521. doi: 10.1902/jop.1984.55.9.516. [DOI] [PubMed] [Google Scholar]
- 2.Hopf HW, Hunt TK, West JM, Blomquist P, Goodson WH, Jensen JA, Jonsson K, Paty PB, Rabkin JM, Upton RA, von Smitten K, Whitney JD. 1997. Wound tissue oxygen tension predicts the risk of wound infection in surgical patients. Arch Surg 132:997–1004. doi: 10.1001/archsurg.1997.01430330063010. [DOI] [PubMed] [Google Scholar]
- 3.Kalani M, Brismar K, Fagrell B, Ostergren J, Jörneskog G. 1999. Transcutaneous oxygen tension and toe blood pressure as predictors for outcome of diabetic foot ulcers. Diabetes Care 22:147–151. doi: 10.2337/diacare.22.1.147. [DOI] [PubMed] [Google Scholar]
- 4.James GA, Swogger E, Wolcott R, Pulcini E. d, Secor P, Sestrich J, Costerton JW, Stewart PS. 2008. Biofilms in chronic wounds. Wound Repair Regen 16:37–44. doi: 10.1111/j.1524-475X.2007.00321.x. [DOI] [PubMed] [Google Scholar]
- 5.Walters MC III, Roe F, Bugnicourt A, Franklin MJ, Stewart PS. 2003. Contributions of antibiotic penetration, oxygen limitation, and low metabolic activity to tolerance of Pseudomonas aeruginosa biofilms to ciprofloxacin and tobramycin. Antimicrob Agents Chemother 47:317–323. doi: 10.1128/aac.47.1.317-323.2003. [DOI] [PMC free article] [PubMed] [Google Scholar]
- 6.Wessel AK, Arshad TA, Fitzpatrick M, Connell JL, Bonnecaze RT, Shear JB, Whiteley M. 2014. Oxygen limitation within a bacterial aggregate. mBio 5:e00992. doi: 10.1128/mBio.00992-14. [DOI] [PMC free article] [PubMed] [Google Scholar]
- 7.Stewart PS. 2012. Mini-review: convection around biofilms. Biofouling 28:187–198. doi: 10.1080/08927014.2012.662641. [DOI] [PubMed] [Google Scholar]
- 8.Dietrich LEP, Okegbe C, Price-Whelan A, Sakhtah H, Hunter RC, Newman DK. 2013. Bacterial community morphogenesis is intimately linked to the intracellular redox state. J Bacteriol 195:1371–1380. doi: 10.1128/JB.02273-12. [DOI] [PMC free article] [PubMed] [Google Scholar]
- 9.Ahimou F, Semmens MJ, Haugstad G, Novak PJ. 2007. Effect of protein, polysaccharide, and oxygen concentration profiles on biofilm cohesiveness. Appl Environ Microbiol 73:2905–2910. doi: 10.1128/AEM.02420-06. [DOI] [PMC free article] [PubMed] [Google Scholar]
- 10.Kühl M, Jørgensen BB. 1992. Microsensor measurements of sulfate reduction and sulfide oxidation in compact microbial communities of aerobic biofilms. Appl Environ Microbiol 58:1164–1174. doi: 10.1128/AEM.58.4.1164-1174.1992. [DOI] [PMC free article] [PubMed] [Google Scholar]
- 11.de Beer D, Stoodley P, Roe F, Lewandowski Z. 1994. Effects of biofilm structures on oxygen distribution and mass transport. Biotechnol Bioeng 43:1131–1138. doi: 10.1002/bit.260431118. [DOI] [PubMed] [Google Scholar]
- 12.Rasmussen K, Lewandowski Z. 1998. Microelectrode measurements of local mass transport rates in heterogeneous biofilms. Biotechnol Bioeng 59:302–309. doi: 10.1002/(SICI)1097-0290(19980805)59:3<302::AID-BIT6>3.0.CO;2-F. [DOI] [PubMed] [Google Scholar]
- 13.Staal M, Borisov SM, Rickelt LF, Klimant I, Kühl M. 2011. Ultrabright planar optodes for luminescence life-time based microscopic imaging of O2 dynamics in biofilms. J Microbiol Methods 85:67–74. doi: 10.1016/j.mimet.2011.01.021. [DOI] [PubMed] [Google Scholar]
- 14.Alvarez-Ortega C, Harwood CS. 2007. Responses of Pseudomonas aeruginosa to low oxygen indicate that growth in the cystic fibrosis lung is by aerobic respiration. Mol Microbiol 65:153–165. doi: 10.1111/j.1365-2958.2007.05772.x. [DOI] [PMC free article] [PubMed] [Google Scholar]
- 15.Schertzer JW, Brown SA, Whiteley M. 2010. Oxygen levels rapidly modulate Pseudomonas aeruginosa social behaviours via substrate limitation of PqsH. Mol Microbiol 77:1527–1538. doi: 10.1111/j.1365-2958.2010.07303.x. [DOI] [PMC free article] [PubMed] [Google Scholar]
- 16.Sánchez-Sánchez CM, Bard AJ. 2009. Hydrogen peroxide production in the oxygen reduction reaction at different electrocatalysts as quantified by scanning electrochemical microscopy. Anal Chem 81:8094–8100. doi: 10.1021/ac901291v. [DOI] [PubMed] [Google Scholar]
- 17.Liberati NT, Urbach JM, Miyata S, Lee DG, Drenkard E, Wu G, Villanueva J, Wei T, Ausubel FM. 2006. An ordered, nonreundant library of Pseudomonas aeruginosa strain PA14 transposon insertion mutants. Proc Natl Acad Sci U S A 103:2833–2838. doi: 10.1073/pnas.0511100103. [DOI] [PMC free article] [PubMed] [Google Scholar]
- 18.Liu X, Ramsey MM, Chen X, Koley D, Whiteley M, Bard AJ. 2011. Real-time mapping of a hydrogen peroxide concentration profile across a polymicrobial bacterial biofilm using scanning electrochemical microscopy. Proc Natl Acad Sci U S A 108:2668–2673. doi: 10.1073/pnas.1018391108. [DOI] [PMC free article] [PubMed] [Google Scholar]
- 19.Bard AJ, Mirkin MV. 2012. Scanning electrochemical microscopy, 2nd ed Taylor & Francis, Abingdon-on-Thames, UK. [Google Scholar]
- 20.Stewart PS, White B, Boegli L, Hamerly T, Williamson KS, Franklin MJ, Bothner B, James GA, Fisher S, Vital-Lopez FG, Wallqvist A. 2019. Conceptual model of biofilm antibiotic tolerance that integrates phenomena of diffusion, metabolism, gene expression, and physiology. J Bacteriol 201:e00307-19. doi: 10.1128/JB.00307-19. [DOI] [PMC free article] [PubMed] [Google Scholar]
- 21.Simkins JW, Stewart PS, Codd SL, Seymour JD. 2019. Non-invasive imaging of oxygen concentration in a complex in vitro biofilm infection model using (19) F MRI: persistence of an oxygen sink despite prolonged antibiotic therapy. Magn Reson Med 82:2248–2256. doi: 10.1002/mrm.27888. [DOI] [PMC free article] [PubMed] [Google Scholar]
- 22.Bjarnsholt T, Alhede M, Alhede M, Eickhardt-Sørensen SR, Moser C, Kühl M, Jensen PØ, Høiby N. 2013. The in vivo biofilm. Trends Microbiol 21:466–474. doi: 10.1016/j.tim.2013.06.002. [DOI] [PubMed] [Google Scholar]
- 23.Palmer KL, Mashburn LM, Singh PK, Whiteley M. 2005. Cystic fibrosis sputum supports growth and cues key aspects of Pseudomonas aeruginosa physiology. J Bacteriol 187:5267–5277. doi: 10.1128/JB.187.15.5267-5277.2005. [DOI] [PMC free article] [PubMed] [Google Scholar]
- 24.Li Y, Sella C, Lemaître F, Guille Collignon M, Thouin L, Amatore C. 2013. Highly sensitive platinum-black coated platinum electrodes for electrochemical detection of hydrogen peroxide and nitrite in microchannel. Electroanalysis 25:895–902. doi: 10.1002/elan.201200456. [DOI] [Google Scholar]
- 25.Feltham AM, Spiro M. 1971. Platinized platinum electrodes. Chem Rev 71:177–193. doi: 10.1021/cr60270a002. [DOI] [Google Scholar]
Associated Data
This section collects any data citations, data availability statements, or supplementary materials included in this article.
Supplementary Materials
Unplatinized platinum UME measuring O2. In contrast to a platinized UME, current measured using an unplatinized platinum UME resulted in low current and a slow decrease in current over time due to fouling. Download FIG S1, PDF file, 0.1 MB (90KB, pdf) .
Copyright © 2020 Klementiev et al.
This content is distributed under the terms of the Creative Commons Attribution 4.0 International license.
Electroactive surface area and roughness increases with platinization. (Above) Electroactive area was measured using 0.1 M H2SO4. Geometric surface area was measured using 1 mM FcMeOH. RoughF = Electroactive Surface Area AFTER/Geometric Surface Area AFTER. RoughI = Electroactive Surface Area BEFORE/Geometric Surface Area BEFORE. “BEFORE” and “AFTER” refer to before and after platinization. (Below) Representative cyclic voltammogram of platinum UME in 0.1 M H2SO4 for 100 cycles each; blue corresponding to before platinization and yellow after platinization. Download FIG S2, PDF file, 0.1 MB (74.8KB, pdf) .
Copyright © 2020 Klementiev et al.
This content is distributed under the terms of the Creative Commons Attribution 4.0 International license.
Image of biofilm (arrow) used in these studies. The average biofilm diameter was 2.94 mm ± 0.24 mm (mean ± the standard deviation, n = 48). The vial measures approximately 20 mm (inner diameter) by 25 mm (height) with ∼5 ml of MOPS-glucose minimal media corresponding to a level ∼15 mm above the biofilm surface. Download FIG S3, PDF file, 0.04 MB (43.9KB, pdf) .
Copyright © 2020 Klementiev et al.
This content is distributed under the terms of the Creative Commons Attribution 4.0 International license.
Supplemental methods. Download Text S1, PDF file, 0.2 MB (167.5KB, pdf) .
Copyright © 2020 Klementiev et al.
This content is distributed under the terms of the Creative Commons Attribution 4.0 International license.
FcMTMA+ does not influence the growth rate of P. aeruginosa. (Above) Growth curve of P. aeruginosa PA14 fliC9::MrT7 in MOPS-glucose. Blue points represent growth without FcMTMA+ and orange points represent growth with FcMTMA+. Experiments represent biological triplicates. (Below) Electrochemical measurements done in tandem with growth experiments to observe changes in FcMTMA+ signal. Growth kinetics: data points from 1.5 to 6 h were plotted on a semilog graph and the following equation (X = X0ekt) was used to determine the growth rate constant k (s−1) pA is picoamps, and Pt is platinum. Download FIG S4, PDF file, 0.1 MB (85.2KB, pdf) .
Copyright © 2020 Klementiev et al.
This content is distributed under the terms of the Creative Commons Attribution 4.0 International license.
Approach curve to biofilm surface. (A) To determine the distance the UME tip was from the biofilm surface, the UME was first approached to confirm it was near the surface as represented by the orange line. (The inlaid cyclic voltammogram corresponds to FcMTMA+ oxidation. We selected +0.5 V for approach curves because it was at a limiting current potential.) The UME was then retracted, and a finer approach was done to 95% of the current. Fit to a mathematical expression, a 95% current decrease corresponds to approximately L = d/a = 7.17, where d is the distance between the UME tip and the biofilm surface), and a is the tip radius (9). (B) With a tip radius (a) of 5 μm, this corresponds to a distance (d) of ∼40 μm from the biofilm surface. Download FIG S5, PDF file, 0.3 MB (275.5KB, pdf) .
Copyright © 2020 Klementiev et al.
This content is distributed under the terms of the Creative Commons Attribution 4.0 International license.
Calculating O2 gradients. The y axis (ordinate) is the ratio of the tip current found in bulk (raw current averaged between points at ∼1,400 μm to ∼1,300 μm) divided by current measured at each point. Measured current was converted to gradients by multiplying this ratio (obtained in this graph) by the concentration of O2 in bulk (205 μM) to produce Fig. 2. Three biological replicates of all replicates are shown; gold colors represent O2 gradients before ciprofloxacin, and blue colors represent O2 gradients after ciprofloxacin was added. The red line was added to represent the limit of detection of an unplatinized UME and the limit we generously set for all UMEs. While platinization increased the sensitivity for all UMEs, we observed that this sensitivity limit did not fluctuate drastically. Download FIG S6, PDF file, 0.2 MB (193.6KB, pdf) .
Copyright © 2020 Klementiev et al.
This content is distributed under the terms of the Creative Commons Attribution 4.0 International license.
Schematic diagram of Comsol Multiphysics model depicting key features. Simulation using Comsol to determine the O2 consumption rate. Download FIG S7, PDF file, 0.03 MB (33.3KB, pdf) .
Copyright © 2020 Klementiev et al.
This content is distributed under the terms of the Creative Commons Attribution 4.0 International license.
Addition of ciprofloxacin to MOPS-glucose does not interfere with O2 measurement. Steady-state voltammograms recorded within the potential window between +0.6 V and −0.5 V in the presence of ambient O2 (red), ambient O2 and 200 μg/ml ciprofloxacin (green), and O2 purged solution containing 200 μg/ml ciprofloxacin (blue). Representative data from triplicate experiments are shown. Download FIG S8, PDF file, 0.2 MB (198.3KB, pdf) .
Copyright © 2020 Klementiev et al.
This content is distributed under the terms of the Creative Commons Attribution 4.0 International license.