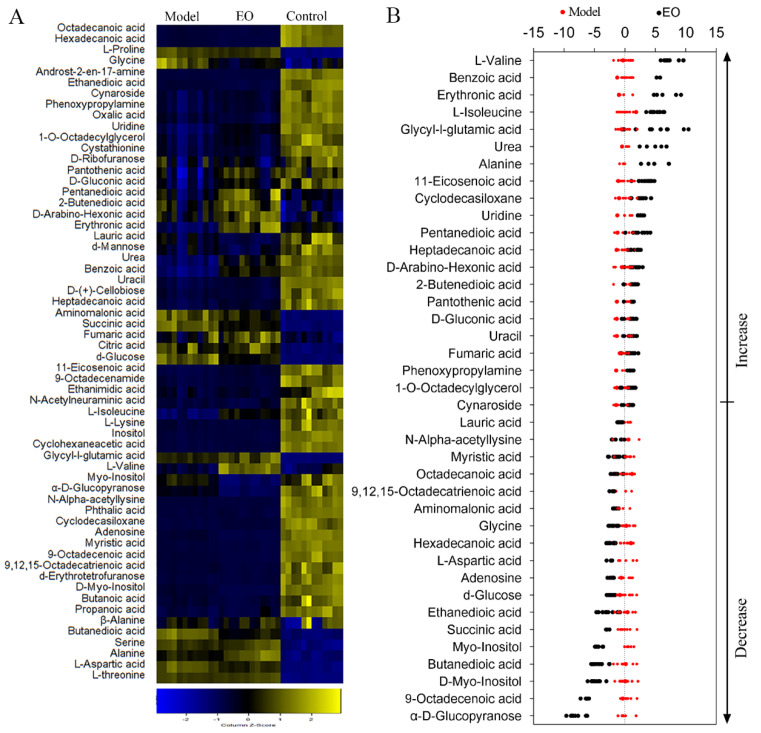
Figure 2.
Metabolic profiles of BV2 microglial cells in response to EO. (A) Heat maps of metabolites (row). Yellow and blue indicate an increase and decrease of the metabolites relative to the mean and standard deviation of the row metabolite level, respectively (see color scale). (B) Z-score scatter diagrams of significant differentially expressed metabolites (p < 0.05) in the presence or absence of EO. Metabolites are showed on the y-axis.

