

Abstract
Dietary energy available to animals is key for formulating feed as it is required for all aspects of the animal's life. In poultry, apparent (AME) and true (TME) metabolizable energy (ME) values have been used for feed formulation with (AMEn or TMEn) or without correction for nitrogen balance. For the past 50 yr, the accuracy of ME has been an ongoing debate, and the comparability of data produced using different bioassay systems is often questionable. Overall, the ingredient matric ME values used in feed formulation are not consistent, and to some extent, confusing. This review was to examine ME data published in the past century to elucidate the accuracy of different bioassay systems and examine the values for accuracy and useability. A variety of flaws are identified in the literature, suggesting a thorough re-thinking of feedstuff ME values currently used in feed formulation and in developing prediction equations. Two protocols, namely multiple linear regression and basal diet substitution methods, are proposed as more accurate bioassays for feedstuff ME values. AME aligns more closely with the actual energy levels of feed ingredients likely available to growing birds, which should be used for poultry feed formulations instead of AMEn. It is suggested that nutritionists need to carefully apply any reported AME values and only use those in formulation practice after careful scrutinizing. Any in vitro, NIR or table values must be calibrated or computed based on the values produced from flawless bioassays so as to apply the derived values accurately. Flaws identified in this literature review can be avoided with care to achieve more accurate AME. However, the assumption that the energy of individual ingredients is additive in a complete diet is still untrue at least under some circumstances. This may require efforts from industry and researchers to investigate relations among the main ingredients in a complete diet so that more accurate formulation can be performed based on the outcomes that may fine-tune the additivity assumption.
Key words: poultry, metabolizable energy, feed formulation, bioassay, feed ingredient
INTRODUCTION
Dietary energy is often the first item to consider for formulating animal feed as it is required for metabolism, physiological functions, maintenance, growth, tissue turnover, and production of heat in the animal body. In poultry, apparent metabolizable energy (AME), expressed as the gross energy (GE) of the feed minus the GE of the excreta, has been used for feed formulation since the 1950s (Hill and Anderson, 1958; Hill et al., 1960). By accounting for the endogenous loss of energy in excreta, true metabolizable energy (TME) was developed later to measure available energy of feed to the animals (Sibbald, 1975). The general practice is to apply sourced (reported or measured) metabolizable energy (ME) values of ingredients as matrix values in poultry feed formulation so as to have an estimated ME value of a complete diet to satisfy the requirement of birds from feed. This practice requires a large database containing AME/TME values of grains, protein meals, fats and oils, and other minor ingredients and even additives, such as enzymes, of varying sources. All these values compiled in the database depend on data attained by individual measurements, reported in the literature, acquired from table values, predicted from values published in previous studies, and, to a certain extent, guesstimated by experienced nutritionists. Metabolizable energy values of grains and other ingredient sources have been reported in the literature using different techniques: bioassays with live birds (Hill et al., 1960; Tyagi et al., 2008; Yegani et al., 2013), table values according to prediction equations (Janssen, 1989; Sauvant et al., 2004; CVB, 2009; Rostagno, 2017), in vitro analyses through artificial digestive systems (Smulikowska, 1992; Farrell, 1999; Gehring et al., 2012; Zhao et al., 2014), and near-infrared reflectance (NIR) analysis (Valdes and Leeson, 1992; Garnsworthy et al., 2000; Black et al., 2009). However, the accuracy of ingredient ME data is still questionable, at least for some of the measurements reported in the literature. This is due to: a) the use of a nutritionally imbalanced diet in the bioassay as the result of replacing part of a balanced diet with test articles; b) variable AME values of supposedly standard ingredients; c) inability of in vitro assays to accurately mimic true metabolism occurring in live animals; and d) wrong computations or mathematic models used in the assays. A recently published review on energy content estimation of diets and ingredients in poultry has thoroughly discussed the various reasons responsible for the discrepancies among AME values from different sources (Mateos et al., 2018). The review focused on problems present in the table values, with prediction equations as well as the AME value discrepancies due to the environmental and physical factors affecting the energy content of diets and ingredients and, to an extent, the differences introduced by different wet chemistry methods used in different labs. Current review will focus on the methods used for measuring AME values of different feed ingredients, and revisit the ingredient values reported in the literature. This will lead to the identification of possible issues on accuracy of the measurements, and suggestion of future directions for such measurements and/or prediction as has been suggested by Mateos et al. (2018). Finally, the standardization of the procedures used in the in vivo trials will be proposed.
ENERGY PARTITION OF FEED IN POULTRY
Feed energy can be partitioned to reflect the functionality and diversion of the energy content in the animal body (Figure 1). The GE of feed is stored as chemical energy, which can be measured as the energy released from the combustion of feed in a bomb calorimeter. This can be measured in a laboratory and predicted accurately based on the chemical composition of the feed (Ewan, 1989). However, it does not provide precise energy values that are available for animals to satisfy their requirement for maintenance and production. Therefore, the concept of ME was developed, and in poultry, AME is widely used as the default value for feed formulation, while TME was also used in the past albeit mainly in North America (NRC, 1994; Farrell, 1999). Metabolizable energy is defined as the feed energy available to the birds for anabolic and catabolic processes (Pesti and Edwards, 1983), and measured as the GE of feed minus the GE of excreta (Armsby, 1903). As ME does not differentiate between the energy required for production/maintenance and heat produced during digestion, metabolism, and excretion, net energy (NE) was proposed to account for the loss of energy as heat for digestion, metabolism, and excretion (defined as heat increment, or HI) (Noblet et al., 2010). As NE is difficult to measure, and studies reported in the literature showed no or variable correlations of NE with the composition of diet in poultry due largely to the lack of accuracy in measurements, it has not been used for formulation of feed in poultry (Noblet et al., 1994; Ferrell and Oltjen, 2008). However, efforts are being made in recent years to develop an NE system for practical feed formulation in poultry (Swick et al., 2013; Carre et al., 2014; Barzegar et al., 2019a; Wu et al., 2019). In the meantime, ME values are still used in poultry feed formulation. Accurate measurement of ME values for ingredient matrix is vital in the current and future formulation systems in poultry.
Figure 1.

Partition of feed energy in poultry showing the energy contents measurable under experimental conditions.
Excreted energy includes those from feces and urine, and gaseous energy produced in poultry is negligible and thus not accounted for. Digestible energy (DE) is not measurable under non-surgical experimental conditions as urine and feces are excreted through a common cloaca to form excreta in poultry. An attempt can be made to measure DE through surgical approach but the digestive behavior of modified birds may not be the same as normal birds; thus, the measured DE value can be questionable.
METABOLIZABLE ENERGY SYSTEMS IN POULTRY
In poultry, several ME energy systems have been proposed and used in the formulation of feed. As a consequence, energy evaluation for feed ingredients has produced ME values using various systems, and hence most values are inconsistent. Among those, AME and TME with or without correction to zero-nitrogen (N) retention were used for decades (Farrell, 1999; Mateos et al., 2018). While AME (or AMEn) has been used widely in the majority of the world, TME (or TMEn) was used in North America at least at some period of time and/or by some nutritionists (Farrell, 1999). Generally speaking, the nomenclatures of ME measured in different ways are confusing even though a more detailed naming system was proposed by Pesti and Edwards (1983). The debate over the past century on which energy system should be used in poultry is yet to be settled. The breeding companies make recommendations for ME and amino acid (AA) levels but do not specify which system to use. Instead, a large volume of ME values for feed ingredients have been produced in the literature without an agreed standard system. The poultry industry worldwide, on the other hand, has been using those values in their feed formulations possibly without paying attention to the type of the values they are using, for example, AME or AMEn measured by which method. This may have resulted in confusion about the differences with age and how additivity works with values measured at one age to formulate feed for different ages (Pesti, personal communications). Therefore, there is an urgent need for poultry nutritionists and researchers to standardize the type of ME system used to generate values for feed formulation. This will require a standardized approach to the bioassay protocol as has been the case in the swine industry where DE is used universally without confusion.
Metabolizable energy defined primarily by Armsby (1903) for animals in general as “potential energy of food minus potential energy of excreta, including under excreta, of course, all the wastes of the body, visible and invisible”. In poultry, Fraps and colleagues assayed metabolizable and productive energy extensively from 1920s to 1940s (Fraps, 1928, 1944; Fraps and Carlyle, 1939; Fraps et al., 1940), and ME was defined as “energy in the feed eaten less that excreted and is the maximum amount of energy that can be utilized by the animals.” Accordingly, ME of feed can then be expressed as:
| (1) |
where MEfd is metabolizable energy per unit feed, GEfd denotes gross energy of feed taken, GEfc indicates fecal energy from the feed taken, GEur represents urinary energy from the feed taken, and GEgs equals to gaseous energy from the feed taken.
For the calculation of ME in poultry, GEfd and GE of excreta (GEex) can be measured directly in the laboratory while the GEgs is usually ignored due to the negligible amount of gases produced by avian species. The above measurement of ME involves the GEex, where the energy is not only of feed origin but includes the energy from endogenous materials lost in the excreta defined as endogenous energy loss (EEL), which is the apparent values of ME thus called AME to distinguish it from true ME. To apply in the poultry situation, the above equation can be modified as:
| (2) |
where AMEfd is apparent metabolizable energy of feed and GEex denotes excreta gross energy.
Harris (1966) proposed a system to measure ME with a correction for EEL so that the resulting ME is basically of direct feed origin, i.e., TME. Later, Sibbald (1976) developed a tube feeding system using adult roosters to measure TME with correction for EEL through the measurement of the excreta voided by fasting birds. TME then can be expressed as:
| (3) |
where TMEfd equals TME of feed and GEel represents GE of EEL.
More than a century ago, Armsby (1903) proposed to correct the ME of protein gained by animals as the metabolism of such gained protein to produce a kinetic form of energy would involve the energy cost of the production of urine to be excreted. Hill and Anderson (1958) later applied the correction of ME to N equilibrium with a value of 8.22 kcal per gram of N and stated it was for comparative purpose. Therefore, AME and TME can be corrected to N equilibrium as AMEn and TMEn, and computed as below:
| (4) |
and
| (5) |
where AMEnfd is the AMEn of feed, TMEnfd represents TMEn of feed, and Nrt equals to N retention by animal.
Other forms of energy, such as productive energy or NE, have been reported. However, these are beyond the scope of this review and thus will not be elaborated.
METABOLIZABLE ENERGY BIOASSAYS AND FACTORS AFFECTING ME
Metabolizable energy can be measured using different bioassays according to how birds are fed and the excreta is collected. Reported feeding techniques are as follows:
-
a.
Ad libitum feeding applied by earlier researchers (Mitchell and Haines, 1927; Carpenter and Clegg, 1956), standardized by Hill and Anderson (1958), and used by different researchers for different feeding periods (1 to 7 D)
-
b.
Tube feeding with an intubation technique to deliver feed directly into the crop of birds at once (Sibbald, 1976)
-
c.
Rapid feeding by training birds to consume their feed allowance within a short span of time (1 h) (Farrell, 1978)
-
d.
Controlled feeding to allow birds to take a proportion of feed during the experiment (Hari and Kriwuscha, 1918; Fraps, 1928; Fraps et al., 1940)
The ME bioassays with ad libitum feeding employed either total collection of the excreta or indigestible indicators such as chromic oxide, titanium dioxide, and acid insoluble ash to calculate the amount of energy excreted and the amount of energy retained relative to the marker—refer to the review of Pesti and Edwards (1983). In addition, for different feeding and excreta collection methods, there have been differences in the lengths of adaptation, the duration of excreta collection, age, sex and breed of the birds used, the number of birds per replicate, and the number of replicates. This review will not describe in detail regarding these methods and variations per se, rather it will focus on the accuracy and applicability of the methods.
Metabolizable energy values of feed are related to the characteristics of feed and the capability of animals to which it is fed. Therefore, the measurement of AME depends not only on the composition of energy yielding components of feed but also on health status, and possibly, age and physiological conditions, of the birds. For example, different chickens responded differently with the metabolism of lower AME wheat so that there is great variability in AME values measured with different individual chickens (Hughes and Choct, 1997). For the ease of text flow, the following sections will briefly touch on factors related to the characteristics of both the bird and feed that affect ME values due to methodological issues (Mateos et al., 2018).
Feed intake (FI) affects AME values in roosters and broilers with controlled feeding regimes or variable FI due to aberrant nutrient balance in that EEL is not proportional to FI (Guillaume and Summers, 1970; Sibbald, 1975; Hätel, 1986; Zelenka, 1997; Yaghobfar and Boldaji, 2002). However, some other studies demonstrated that AME did not differ significantly when the chickens were fed the feed at 30% of ad libitum intake all the way up to ad libitum (Hill and Anderson, 1958; Bourdillon et al., 1990a) presumably due to a low EEL. While earlier studies assumed that TME values are independent of FI due to a constant EEL produced by birds under standard conditions (Guillaume and Summers, 1970; Sibbald, 1975; Sibbald and Morse, 1983), this assumption has been shown to be untrue as EEL varies depending on the feed input and digestion of nutrients by the fasted birds may be abnormal (Hätel, 1986; McNab and Blair, 1988). However, in spite of the discrepancy on the influence of FI on ME, the values of AME, AMEn, TME, or TMEn should be relatively stable at ad libitum feed consumption level provided the bioassay is conducted under standard conditions with the same type of birds and method. Therefore, given ME values are applied in feed formulation normally at ad libitum or at close to ad libitum FI, bioassays of any type of ME should be carried out with birds being fed ad libitum. Hence, caution should be exercised when using ME values of any type that have been corrected for FI.
Metabolizable energy values of feed have been measured in a wide range of birds, namely in different ages, sexes, and breeds. It has been widely accepted that age affects the values of feed AME. For example, the AME value for a feedstuff is higher in adult chickens such as roosters than in growing broilers (Farrell et al., 1983, 1998; Mollah et al., 1983; Sibbald and Wolynetz, 1985; Johnson, 1987; Bourdillon et al., 1990b; Gonzalez-Esquerra and Leeson, 2000). These differences have been found between adult cockerels and broilers at 10 to 14 D (Farrell et al., 1983), 19 to 22 D (Sibbald and Wolynetz, 1985), and 7 wk of age (Mollah et al., 1983) indicating that the AME differences between adult and growing chickens exist in all age groups. Similarly in turkeys, old birds showed higher AME of pea diets than the younger counterparts (Palander et al., 2006). However, the opposite has been reported: broilers showed higher diet AME values than roosters (Lopez and Leeson, 2007); AMEn values, on the other hand, were higher than AME in roosters due to little correction for N balance in roosters, but lower in broilers due to greater correction for N balance. In growing chickens, although it has been recognized in general that the AME values are greater in older than in younger birds, except for some particular ingredients. For instance, a positive linear correlation between age and meat and bone meal AME was observed in broilers from days 0 to 21 (Adeola et al., 2018), while the AMEn values of biodiesel glycerine negatively correlated with the age of broilers up to day 30 (Lima et al., 2013). Interestingly, fat AME values in broilers reached a plateau by the age of 2 wk and no further increase was shown (Tancharoenrat et al., 2013) and in some bioassay, age did not show effect in chickens (Sibbald et al., 1960).
Sex is another variable of concern for bioassays of ME in poultry. Over the past century, ME has been measured mainly in male birds including roosters and male broilers, although in practice feed is formulated for both male and female birds. Comparisons for ME values obtained in male and female chickens have also been performed (Guirguis, 1976; ten Doeschate et al., 1993; Zelenka, 1997; Ravindran et al., 2004). It has been suggested that gender influences the digestive capacity of chickens through EELs, gut structure and function, and metabolic activity of gut microflora (Hughes and Choct, 1999; Nalle et al., 2011b). Thus, AME values measured in different gender can vary, possibly being lower in male than female. For most ingredients, ME values, if differ, tend to be higher in female birds. However, like most studies related to ME values, information regarding the sex effect is not unequivocal. While the ME value of some feedstuff was not affected by sex (Zelenka, 1997), that of oats, fishmeal, and tallow was significantly higher for female than for male chicks (Guirguis, 1975, 1976). It has also been shown that sex effect on AMEn values of feed differs according to the age of the birds; while no sex effect was shown for 3-wk-old broilers, the AMEn values for male broilers were higher than those for the females at 6 wk old (Ravindran et al., 2004).
The ME assayed in different species or breeds of poultry can vary. The animals used include growing chicks (Hill and Anderson, 1958; Waititu et al., 2018), layers (Mitchell and Haines, 1927; Zuber and Rodehutscord, 2017), roosters (Sibbald, 1975; Deng et al., 2016), turkeys (Leeson et al., 1974; Kozlowski et al., 2018), ducks (King et al., 1997; Kong and Adeola, 2010), geese (Wang et al., 2017a), pigeons (Hullar et al., 1999; Sales and Janssens, 2003), and quails (Mandal et al., 2006; Pasquetti et al., 2015). In industry, however, the database ME values invariably rely on broiler, to a lesser extent, adult rooster bioassays, with ME values of many ingredients unavailable for minor species. In fact, little has been done to systematically determine to what extent ME values of ingredients in different types of birds differ, let alone setting any meaning correction factors to adjust the ME values obtained in one species for use in another species. However, sporadic comparisons among the poultry have been reported now and then (Lodhi et al., 1969; Dale and Fuller, 1980; Cilliers et al., 1994; Sell et al., 2001; Collins et al., 2003; Mandal et al., 2006; Kianfar et al., 2013). Higher AME and AMEn values were observed in laying hens than in broilers for rapeseed meal (Lodhi et al., 1969) and conjugated linoleic acid (Sell et al., 2001). TME values of corn, soybean meal, corn gluten meal, fish meal, and poultry by-product meal were similar among roosters, broilers, and poults although broiler values tended to be lower (Dale and Fuller, 1980). Compared between the AMEn values of roosters and ostriches, no difference was apparent for corn while ostriches had twice as much of lucerne AMEn as roosters (8.9 vs. 4.5 MJ/kg) (Cilliers et al., 1994) due to the ability of ostriches to digest fiber. The AMEn values of barley were higher in cockerels than in quails regardless of processing and enzyme supplementation (Kianfar et al., 2013). However, no significant difference in the AMEn values of different sorghum varieties was observed among cockerels, guinea fowls, and quails (Mandal et al., 2006).
The interactions among nutrients in feed also play a big role in the variation of AME values reported in the literature as all the assays or feed formulation have to assume that the energy provided by all the energy-yielding ingredients is additive. However, this may not be the case as dietary energy depends on the interaction between bird and nutrients (Mateos et al., 2018) and the nutrients can be interactive to each other. A typical example is the extra caloric effect of fat: added fat contributes more energy than predicted level of contribution to the diet. The interaction on ME between fat and possibly non-starch polysaccharides (NSP) in grains may be one of the reasons (Mateos and Sell, 1980; Ward and Marquardt, 1983). Ravindran et al. (2016) made an excellent review on the factors such as age, genetics, gender, and health status of birds, characteristics of fat, fat inclusion level, and other diet components that may be responsible for the measured values of energy content of fats. It has been reported that cereal type and fat sources interact in terms of fat digestion. For example, fat digestion can be suppressed by rye-based diets with tallow but less so with soybean oil (Antoniou et al., 1980). Viscosity and microbial growth in the small intestine may be responsible for the depressed digestibility of fat (Ravindran et al., 2016). Accessibility of lipid resulted from feed processing such as steaming cooking and pelleting may enhance fat digestibility in corn-based diet, while not in wheat or sorghum-based diets (Jiménez-Moreno et al., 2009; Abdollahi et al., 2014). In addition, dietary calcium and phosphorous levels and antinutrient factors such as tannins, trypsin inhibitors, and various mycotoxins play significant roles in fat digestibility and thus ME content of the feed (Ravindran et al., 2016).
Other factors such as physicochemical characters of diets and ingredients, heat processing, feed forms and particle size, dietary fiber and fat contents, antinutritional factors, and supplementation of additives such as enzymes, probiotics, prebiotics, and organic acids have been extensively discussed in a recent review (Mateos et al., 2018). These are very important factors to be considered when the ME values are going to be used in feed formulation in feed mills.
TECHNIQUES TO DETERMINE INGREDIENT ME
Several protocols have been developed to determine ingredient ME values to be used for feed formulation by in vivo bioassays. The main consideration is how the test ingredients should be included in the test diet and fed to chickens so that the ME values can be derived. The techniques are summarized as follows:
-
a.
Direct feeding of the test ingredient only (direct feeding) (Mitchell and Haines, 1927; Fraps et al., 1940; Sibbald, 1976);
-
b.
The test ingredient to substitute an ingredient with known ME value in a basal diet to form a test diet. The ME values of basal and test diets are measured simultaneously (standard ingredient substitution) (Hill and Anderson, 1958);
-
c.
The test ingredient is mixed with one or more ingredients with known ME values to make a test diet. No basal diet is required in this case (standard ingredient plus) (Carpenter and Clegg, 1956; Choct et al., 1999);
-
d.
The test ingredient mixed with a basal diet to make a test diet. The ME of basal and test diets are measured simultaneously (basal substitution) (Sibbald et al., 1960; Farrell, 1978);
-
e.
Formulation of multiple test diets with multiple test ingredients at various independent levels (multiple linear regression) (Young et al., 1977; Noblet et al., 1993).
With different designs of experiment to perform bioassay, calculations of the test ingredient ME values can be very different. Even within the same category of the design, the calculation procedure can be different depending on how the basal and test diets are formulated. These can sometimes be very confusing even to the researchers themselves who designed the experiments, and not to mention the readers who wanted to understand it and possibly to emulate it. Therefore, it is necessary to detail all the steps of calculations according to how the bioassays are conducted to measure test ingredient ME values. It is worth to mention that terminologies regarding the techniques are very confusing in the literature. One term can cover many methods, while some other terms refer to the same method. Sometimes, terms for ingredient ME bioassay approaches may have been interchangeably used for diet ME bioassay. In addition, no terms were given for the methods reported in some publications and in fact some authors did not know they were actually using a different method from what they refer to in the paper. Therefore, we will use the terminologies in the present review according to our collection of the methods reported since the earlier 20th century and try to categorize while cover all of the approaches to perform ingredient ME bioassay as complete and distinguishable as possible. The “commonly” used terms may not be used in the current review to minimize confusions due to incomplete definitions of the methods in the past.
Direct Feeding
Direct feeding of the ingredient to birds can be implemented through tube feeding (Sibbald, 1976), controlled feeding (Mitchell and Haines, 1927), or ad libitum feeding (Fraps et al., 1940) of the ingredients to be measured: grains, protein meals, by-products, and oil/fat (tube feeding only). The calculation of the test ingredient ME is straightforward as only the test ingredient is fed to birds:
| (6) |
where MEti represents ME value of test ingredient, and MEfd denotes the ME value measured from the feed fed to birds as shown in Equation 1 or varied to AMEfd (Equation 2) and TMEfd (Equation 3).
Standard Ingredient Substitution
A standard ingredient, of which the ME has been previously determined, is used to prepare a basal diet and a proportion or all of the standard ingredient is replaced by the test ingredient to make a test diet for the bioassay. The standard ingredients often include glucose/dextrose (AMEn, 3,640 kcal/kg) (Hill et al., 1960; Lodhi et al., 1969; Daghir et al., 2003; Applegate et al., 2009; Kerr et al., 2016), sucrose (AMEn, 3,800 kcal/kg) (Lodhi et al., 1969), corn starch (AMEn, 3,989 kcal/kg) (Zuber and Rodehutscord, 2017), and barley (AMEn, 2,980 kcal/kg) (Villamide et al., 1997). The test ingredient ME value can be calculated according to the ME difference between test and basal diets and the substitution rate:
| (7) |
where MEsi denotes the ME of standard ingredients, MEtd represents ME of test diet, MEbd is ME of basal diet, and Pss indicates the proportion of standard ingredients substituted by test ingredient.
Some studies used different levels of inclusion level to calculate the dose response. To determine the dose response, the standard ingredient was substituted at multiple levels by the test ingredient to form several test diets (Sell et al., 2001; Lammers et al., 2008). The MEti can be determined by regressing the diet ME values less ME contributed by the standard ingredients (e.g., glucose) in the diets against the level of substitution (Lammers et al., 2008). The model can be expressed as:
| (8) |
MEσ is calculated by equation
| (9) |
where MEd is the ME values of all diets including MEbd and MEtd; and MEσ represents the difference between diet ME values and ME contributed by the standard ingredients in that diet.
The same result can be obtained using different regression models (Sell et al., 2001).
Standard Ingredient Plus
One or more standard ingredients with known ME values are used to prepare a test diet that includes a test ingredient and a standard ingredient. The standard ingredients traditionally used in this bioassay are different from that described for the standard ingredient substitution method discussed earlier. However, it appears there is no reason why the standard ingredients used in these 2 methods cannot be used interchangeably.
This method has the advantage of using a reasonably balanced diet in the determination of a test ingredient ME value. However, there are a number of issues that diminish the reliability of the data generated using this method. First, the various used “standard ingredients” are not consistent. For instance, there have been vast differences in the casein AME values used in different assays ranging from 3,000 to 4,800 kcal/kg (Carpenter and Clegg, 1956; Annison, 1991; Annison et al., 1994; Ravindran et al., 1999). Although it is understandable that batches of casein produced at different locations or with different methods are expected to differ in their AME values, the problem is that researchers often do not detail the origin, type, residual fat level, salt level, and protein content. Other “standard ingredients” that have been present in the literature are soybean oil with an AME value of 8,795 kcal/kg (Hew et al., 1998); cod liver oil with and AMEn value of 8,600 kcal/kg (Carpenter and Clegg, 1956); and poultry fat with an AME value of 8,126 kcal/kg (McCracken et al., 2008). However, the accuracy of the AME values of these “standards” has not been experimentally validated. Secondly, the assay includes a fixed ingredient mixture with AME/AMEn values determined based on the NRC values (Scott et al., 1998; Seyedi et al., 2013; Yegani et al., 2013), of which the accuracy of standard AME values is questionable.
The test ingredient ME value can be calculated according to the measured ME value of the test diet and proportions of standard and test ingredients in the diet:
| (10) |
where Psi is the proportion of standard ingredient in the test diet and Pti represents the proportion of test ingredient included in the diet.
The accuracy of values used for the standard ingredients is critical to the calculation of the test ingredient ME value. Metabolizable energy values from tables used for the standard ingredients are highly questionable as any table values for ingredients of different sources can be highly variable. The lack of standardization of the so-called known standard ingredients is a major drawback of this bioassay.
Basal Substitution
A basal diet is formulated to be adequate in nutrients and energy, and a proportion of the basal diet is substituted by the test ingredient to produce a test diet (Sibbald et al., 1960). The ME values of the basal and test diets are measured in birds so that the ME value of test ingredient can be derived. The test ingredient ME value can be calculated according to the measured ME values of basal and test diets and the proportion of test ingredient substitution and the proportion of the basal diet (energy-yielding ingredients) in the test diet:
| (11) |
where Pbd is the proportion of the basal diet (energy-yielding ingredients) in the test diet. If Pbd + Pti = 1, then Pbd = 1 − Pti. By replacing Pbd with (1 − Pti) in Equation 11, the equation can be simplified through: MEti = (MEtd − MEbd × (1 − Pti))/Pti = (MEtd − MEbd + MEbd Pti)/Pti = (MEtd − MEbd)/Pti + MEbd Pti/Pti = (MEtd − MEbd)/Pti + MEbd, to:
| (12) |
This is the most common technique to measure ingredient ME values for poultry, and it is also a technique that has many variants accompanied by many different mathematic equations/models to calculate MEti. Not surprisingly, the calculations are replete with errors. The mistakes include the use of calculation Equation 12 assuming Pti + Pbd = 1 in the test diet while the minor ingredients were kept constant between the reference and the test diets (Newkirk et al., 1997), formulation of test diets with different ratios between energy-yielding ingredients to the basal diet (Rodriguez et al., 1998), and missing energy-yielding ingredients in the test diet compared to the basal diet, except for the test ingredient (Barekatain et al., 2015). These flaws will be elaborated in the section “FLAWS IN ME BIOASSAY.”
A list of variations to this approach is summarized below.
Practical Basal Substitution
Considering that a simple replacement of the basal diet with a test ingredient may lead to nutrient imbalance, such as in vitamins and minerals, for the test diet, a variation of the test diet formulation has been frequently used, i.e., to formulate a test diet with the same levels of minor ingredients including vitamins, minerals, and possibly AA so that the test diet is more balanced at least for those micro nutrients. Since a small proportion of the basal diet or test ingredient is replaced by minor ingredients, as compared with the standard substitution technique, Pbd+ Pti no longer equals one. Therefore, Equation 12 does not apply to this modified method. More details on such flaws related to the use of Equation 12 will be elaborated later.
Multiple Level Basal Substitutions
Another variation to this technique is the use of graded levels of the ingredient (i.e., Pti). The inclusion levels vary depending on the nature of the test ingredient, which can be at 30, 40, 50, and 60% for barley (Villamide et al., 1997), 25, 50, or 75% for corn, and 0, 10, 20, and 30% for soybean meal (Lopez and Leeson, 2008). The ME value for the test ingredient (MEti) is determined by regressing the diet ME value on the test ingredient inclusion levels, and extrapolating the regression line to 100% test ingredient inclusion level (Potter et al., 1960; Mateos and Sell, 1980; Villamide et al., 1997; Gonzalez-Esquerra and Leeson, 2000; Applegate, 2005; Borsatti et al., 2018). This calculation is the most widely used method and does not lead to errors in calculation even when Pbd + Pti ≠ 1 (Gonzalez-Esquerra and Leeson, 2000; Applegate, 2005; Lopez and Leeson, 2008):
| (13) |
Variations of design and calculations of the ingredient ME in this method have also been carried out in different ways.
Test Ingredient Associated ME Intake Regression
A model was proposed by Adeola and Ileleji (2009) to regress ME intake associated with the test ingredient (MEIti) against the test ingredient FI (FIti) (Adeola and Ileleji, 2009; Pekel et al., 2015) with Equation 14:
| (14) |
ME intake contributed by the test ingredient (MEIti) can be calculated by:
| (15) |
And, test ingredient intake FIti by:
| (16) |
In equations (15), (16), and (17), FIti is the test ingredient intake; FItd denotes test diet FI measured; and MEIti represents ME intake contributed by test ingredient.
Excreta Energy Regression
Cilliers et al. (1994) developed a different regression method to calculate TMEti by regressing GE intake against GE excretion to produce an estimate of the true proportion of GE intake that is metabolizable. The model is:
| (17) |
GEIbdt and GEIti can be calculated using equations:
| (18) |
| (19) |
where GEIbdt is GE intake contributed by the basal diet proportion of the test diet; GEbd represents GE of the basal diet; GEIti indicates GE intake as the test ingredient in the test diet; GEItd denotes test diet GE intake; bbd equals to the estimate of the proportion of GE for basal diet that appears in the excreta; bti equals to the estimate of the proportion of GE for the test ingredient that appears in the excreta.
TMEbd and TMEti for the basal diet can be calculated using the following equations:
| (20) |
and
| (21) |
where TMEbd is TME for the basal diet; TMEti is TME for the test ingredient; and 1 – bbd and 1 – bti equal, respectively, the energy utilization coefficients of the basal diet and the test ingredient.
The advantage of this is that EEL can be calculated through regression rather than through a total excreta collection in fasted birds. Unfortunately, the calculation of GEIbdt was wrong in the study of Cilliers et al. (1994) as they suggested to calculate GE intake contributed by the basal diet proportion in the test diet with an equation:
| (22) |
GEIbdt was X1 in Cilliers et al. (1994), which equals GE intake (i.e., GEItd here) × proportion of diet as basal (Pbd here). They did not realize Pbd is the weight proportion of basal diet in test diet not the proportion of its energy contribution to the test diet energy. This equation stands only when GEbd = GEti where proportions of energy contributed by basal diet and test ingredient are the same as their weight proportions in the test diet. Therefore, this most likely results in mistaken values in the calculations when GEbd ≠ GEti.
Proportional ad Libitum Feeding
Further variation is to adjust feeding levels to a proportion of ad libitum FI so that the level of basal diet intake in all test diets is identical. This variation was first used in pigs for the bioassay of DE by Adeola (2001) and later was adopted in broiler bioassay (Dozier et al., 2008). According to Adeola (2001), a basal diet was fed to all the pigs at 0.85 kg/d, and then 0, 0.05, 0.10, and 0.15 of test ingredient were added for the pigs in respective groups. Therefore, each of 4 groups of pigs received at 0.85, 0.90, 0.95, and 1.00 kg/d of feed. In this case, the intake of basal diet is exactly the same for all the animals. Simple linear regression of ME intake against FI is used to determine MEti being the slope of regression equation (Adeola, 2001). This method was used in broilers (Dozier et al., 2008). In the study, the basal diet intake was restricted to 0.197 kg, and test diet intakes were as shown in Table 1. The regression model is expressed as:
| (23) |
where MEId is the ME intake with the basal and test diets, Ibd denotes basal diet intake as a constant, and Iti represents the test ingredient intake. It appears that controlling feeding is somewhat redundant in poultry as ad libitum feeding of the test diets with different levels of the test ingredient does not pose a problem for regression analysis. Such an approach may be more feasible in swine (Adeola, 2001) than in poultry (Dozier et al., 2008). The reason is that ad libitum FI for the broilers at experimental age range has to be tested prior to the experiment with different batch of birds; thus, the resulting ad libitum FI may not always the same as the birds under experiment and mistaken restriction levels may be applied. However, this is not an issue for swine due to its different feeding scheme.
Table 1.
Composition of diets used in Noblet et al. (1993) for measurements of ingredient energy values using multiple linear regression analysis.
| Ingredients (%) | 1 | 2 | 3 | 4 | 5 | 6 | 7 | 8 | 9 | 10 | 11 | 12 | 13 | 14 | 15 | 16 | 17 |
|---|---|---|---|---|---|---|---|---|---|---|---|---|---|---|---|---|---|
| Wheat | 23.00 | 12.00 | 25.00 | 12.00 | 27.00 | 25.00 | 17.00 | 29.00 | |||||||||
| Barley | 22.00 | 22.00 | 27.00 | 18.98 | 13.49 | 19.00 | 24.00 | 10.00 | |||||||||
| Maize | 20.00 | 14.00 | 19.00 | 28.00 | 20.47 | 18.00 | 19.00 | 18.00 | 29.50 | 11.00 | |||||||
| Tapioca | 17.00 | 14.00 | 11.00 | 24.00 | 21.50 | 20.00 | 18.50 | 15.00 | 15.00 | ||||||||
| Sweet potato | 17.00 | 14.00 | 10.50 | 35.00 | 7.00 | 4.00 | 11.00 | 18.00 | 13.00 | 5.00 | |||||||
| Soyabean meal | 22.50 | 22.00 | 18.50 | 11.00 | 11.50 | 15.00 | 23.98 | 23.00 | 13.75 | 21.00 | 20.00 | 16.00 | |||||
| Sunflower meal | 7.00 | 15.00 | 6.00 | 15.00 | 4.00 | 11.50 | 13.00 | 15.00 | 8.00 | ||||||||
| Rapeseed meal | 14.50 | 12.00 | 10.00 | 15.00 | 11.00 | 11.50 | 13.00 | 5.00 | 5.00 | 8.00 | |||||||
| Peas | 26.00 | 17.00 | 26.50 | 20.00 | 30.00 | 27.00 | 5.00 | 18.00 | |||||||||
| Maize distillers | 15.00 | 9.00 | 9.38 | 15.00 | 10.00 | 10.00 | 5.00 | ||||||||||
| Maize gluten feed | 10.00 | 10.00 | 10.00 | 11.50 | 10.00 | 10.00 | 5.00 | ||||||||||
| Molasses | 4.10 | 6.00 | 4.30 | 6.00 | 6.99 | 5.04 | 6.00 | 5.46 | |||||||||
| Animal fat | 3.80 | 6.00 | 2.00 | 5.00 | 4.85 | 6.00 | 5.10 | 4.00 | |||||||||
| L-Lysine-HCl | 0.10 | 0.20 | 0.15 | 0.10 | 0.20 | 0.32 | 0.27 | ||||||||||
| DL-Methionine | 0.02 | 0.02 | 0.03 | 0.03 | 0.02 | ||||||||||||
| L-Threonine | 0.12 | 0.10 | |||||||||||||||
| L-Tryptophan | 0.02 | 0.02 | 0.01 | 0.01 | 0.02 | 0.03 | 0.02 | ||||||||||
| M + V mixture b | 4.5 | 4.5 | 4.5 | 4.5 | 4.5 | 4.5 | 4.5 | 4.5 | 4.5 | 4.5 | 4.5 | 4.5 | 4.5 | 4.5 | 4.5 | 4.5 | 4.5 |
| Total | 100 | 100 | 100 | 100 | 100 | 100 | 100 | 100 | 100 | 100 | 100 | 100 | 100 | 100 | 100 | 100 | 100 |
Multiple Linear Regression
Multiple linear regression has been used in pigs (Young et al., 1977; Noblet et al., 1993) but not in poultry, although the calculation was done using multiple linear regression (Barzegar et al., 2019b). This approach measures the ME (or DE in pigs) values of various ingredients by using multiple diets with several test ingredients at different levels. The number of diets must be more than the number of energy-yielding ingredients. The ME values of test ingredients can be calculated using multiple linear regression of the measured ME value of diets against the inclusion levels of each ingredient. In the resulting regression equation, the regression coefficient obtained for an ingredient corresponds to its ME value, namely the ME of a diet is the sum of ME contributed by each of the ingredients included in the diet. The energy values of the feedstuffs can be estimated from the multiple regression model:
| (24) |
where Y is the predicted ME value of the diet; x1 through to xi represent the percentages of individual feedstuffs included in the diet; and b1 through to bi denote the estimated ME values of the feedstuffs as coefficients in the equation.
To make the method clearer, we take the examples from the literature to demonstrate how the regression method was applied, the experiment designed, and calculations conducted.
Young et al. (1977) used barrows between 12 and 60 kg and placed them for an adjustment period of 3 to 5 D followed by a 5-D collection period according to standard total collection method for swine. Altogether, 16 diets that included different levels of soybean meal (4.0 to 24%), corn (0.0 to 92.7%), and barley (0 to 92.7%) were used in the bioassay. The DE or ME values of the ingredients were obtained by multiple regression analysis with inclusion levels of ingredients as the independent variables and DE or ME values of the diets as the dependent variable. The intercept was forced to be zero, and the regression coefficients indicate the change in the DE or ME values of diets for each percentage point change of the ingredient in the diet. Therefore, the coefficient multiplied by 100 equals to the energy values of the ingredients. The method was used to measure the DE and ME of a list of feedstuff with a series of trials. The study included 3 ingredients in the test diets, and thus 3-factor regression equation (Y = b1 x1 + b2 x2 + b3 x3) was used for all the assays.
Noblet et al. (1993) formulated 17 growing pig diets with 13 ingredients at different levels (Table 1) to measure the DE, ME, and NE of each ingredient using multiple linear regression equations. The inclusion levels of the ingredients were formulated to have no significant correlations between each other in the diets (Table 2). The pigs were adapted for 10 to 11 D, and collection was carried out for another 10 to 11 D with last 8 D in respiration chamber for NE measurement. The FI was applied at the same level for all the diets during collection of excreta. The energy values of ingredients were estimated from multiple linear regression between the energy values of diets and the levels of each ingredient in the diet. The multiple linear regression procedure will be described later.
Table 2.
Correlations between the inclusion levels of all ingredients in the diets used in multiple linear regression analysis to measure energy values (Noblet et al., 1993).
| Wheat | Barley | Maize | Tapioca | Sweet potato | Soyabean meal | Sun-flower meal | Rape-seed meal | Peas | Maize distillers | Maize gluten feed | Molasses | ||
|---|---|---|---|---|---|---|---|---|---|---|---|---|---|
| Barley | r | 0.11 | |||||||||||
| P | >0.05 | ||||||||||||
| Maize | r | −0.13 | 0.10 | ||||||||||
| P | >0.05 | >0.05 | |||||||||||
| Tapioca | r | −0.21 | −0.39 | −0.30 | |||||||||
| P | >0.05 | >0.05 | >0.05 | ||||||||||
| Sweet | r | −0.22 | −0.15 | −0.32 | −0.13 | ||||||||
| potato | P | >0.05 | >0.05 | >0.05 | >0.05 | ||||||||
| Soyabean | r | −0.33 | −0.42 | −0.06 | 0.26 | 0.14 | |||||||
| meal | P | >0.05 | >0.05 | >0.05 | >0.05 | >0.05 | |||||||
| Sunflower | r | −0.26 | −0.29 | 0.16 | −0.04 | −0.32 | −0.09 | ||||||
| meal | P | >0.05 | >0.05 | >0.05 | >0.05 | >0.05 | >0.05 | ||||||
| Rapeseed | r | 0.13 | 0.10 | −0.28 | 0.03 | −0.02 | −0.35 | −0.10 | |||||
| meal | P | >0.05 | >0.05 | >0.05 | >0.05 | > 0.05 | >0.05 | >0.05 | |||||
| Peas | r | −0.20 | −0.19 | −0.35 | −0.16 | 0.19 | −0.24 | 0.31 | 0.06 | ||||
| P | >0.05 | >0.05 | >0.05 | >0.05 | >0.05 | >0.05 | >0.05 | >0.05 | |||||
| Maize | r | −0.10 | 0.07 | −0.03 | 0.24 | −0.18 | −0.08 | −0.34 | −0.08 | −0.21 | |||
| distillers | P | >0.05 | >0.05 | >0.05 | >0.05 | >0.05 | >0.05 | >0.05 | >0.05 | >0.05 | |||
| Maize | r | −0.18 | −0.14 | 0.06 | 0.04 | −0.04 | 0.39 | 0.06 | −0.30 | −0.32 | −0.05 | ||
| gluten feed | P | >0.05 | >0.05 | >0.05 | >0.05 | >0.05 | >0.05 | >0.05 | >0.05 | >0.05 | >0.05 | ||
| Molasses | r | 0.13 | −0.14 | 0.14 | 0.07 | −0.27 | −0.05 | 0.16 | −0.14 | −0.27 | 0.21 | 0.08 | |
| P | >0.05 | >0.05 | >0.05 | >0.05 | >0.05 | >0.05 | >0.05 | >0.05 | >0.05 | >0.05 | >0.05 | ||
| Animal fat | r | −0.03 | 0.04 | 0.10 | −0.17 | −0.03 | 0.13 | 0.26 | −0.04 | −0.23 | −0.05 | −0.13 | −0.21 |
| P | >0.05 | >0.05 | >0.05 | >0.05 | >0.05 | >0.05 | >0.05 | >0.05 | >0.05 | >0.05 | >0.05 | >0.05 |
Energy Digestibility
Energy digestibility (ED) together with the ME of nutrients in feedstuffs is quite often used to calculate ME values presented in the nutrient tables (Titus 1955; Janssen, 1989; Rostagno, 2017). In the calculations, ME values of nutrients used are as follows: fat 9,280 (or 9,290) kcal/kg; crude protein 4,310 kcal/kg; and nitrogen-free extract (NFE) 4,140 kcal/kg (Janssen, 1989; Rostagno, 2017). The calculation of test ingredient AME (AMEti) can be achieved through the summation of the respective proportions of nutrient AME values that equal to their respective ED in the ingredient and their ME values described above. The equation in Rostagno (2017) is MEPoultry (kcal/g) = 4.31 CPd + 9.29 EEd + 4.14 NFEd, where CPd is digestible crude protein poultry in g/kg; EEd is digestible ether extract poultry in g/kg; and NFEd is digestible nitrogen-free extract poultry in g/kg; For example, the corn ME was calculated by summation of its crude protein, crude fat, and NFE digestibility coefficients in the European table (Janssen, 1989), where the digestibility coefficients of these 3 nutrients are 0.84, 0.92, and 0.90, respectively. Thus, for a particular batch of corn, the AMEn = 0.84 × 4310 × 11% + 0.92 × 9280 × 5.6% + 0.90 × 4140 × 81.0% = 3894 kcal/kg (DM). Note that ED of the same nutrients in different feedstuff may differ; thus, ED of the nutrients must be measured individually and accurately so that the AME of feedstuffs can be produced accordingly. However, this may not always be possible as it is unlikely to measure all the ED of all the nutrients in all the feedstuffs so as to acquire AME values. Rather, same ED of a nutrient may be used for the same species of feedstuffs in the calculations of AME in the tables or feed formulation database. Therefore, the AME values produced in such way are more or less a guesstimate compared to the measured values through bioassays.
PROS AND CONS OF ME SYSTEMS
Debates have been documented concerning which energy system should be used for poultry, how the ME values should be measured, and what strategy should be taken to analyze ingredient ME values (Pesti and Edwards, 1983; Sibbald and Wolynetz, 1987; Farrell, 1999). The pros and cons have been discussed regarding ME energy systems (AME vs. TME, and/or ME vs. MEn), bioassay protocols (i.e., total collection of excreta or using indigestible markers, force, restricted or ad libitum feeding, fasting birds prior to excreta collection or not), and to less extent, the techniques to measure ingredient ME values. Some of these have been discussed extensively, while others have escaped attention.
The key point of emphasis is that the first item set in feed formulation is the energy value of the feed ingredients. Indeed, in feed formulation, all nutrients are set as ratios to energy. The economic implication of setting a wrong energy value in feed formulation is immense. But there is a lack of clarity about the origin of the ME values in most databases today. The issues relate to the fact that the ME values have been generated in various laboratories using different ME systems, bioassays, and techniques. Therefore, despite numerous reviews, it is still necessary to have another look at the pros and cons of the ME systems so that justifications of a standard ME system for poultry can be made.
AME vs. TME
The earlier measurements of ME used the AME system as EEL was not considered and accounted for in the assays (Mitchell and Haines, 1927; Fraps, 1944; Hill and Anderson, 1958). Harris (1966) stated that EEL should be considered, and hence a TME system was proposed. AME is based on the study performed by Hill and Anderson (1958) with growing chickens fed ad libitum, whereas the TME system was championed by Sibbald (1976). Since the development of these 2 methods, comparative studies have been performed to assess their accuracy, applicability, and usefulness for estimating feedstuff energy content.
AME is currently the default system for energy evaluation in poultry (Farrell, 1999; McNab, 1999; Mateos et al., 2018). Thus, the AME data generated from various sources have been the foundation of many databases used for practical feed formulation. AME can be measured in different types of poultry regardless of species and age. However, AME values of feedstuffs can be variable due to age, species, and sex of birds, different bioassays, and techniques with associated erroneous calculations (to be discussed in later sections). Nevertheless, the AME system is still preferred for the estimate of feedstuff energy content before other systems, such as NE, are implemented in poultry.
Pesti and Edwards (1983) and Farrell (1999) were critical of the TME system. Their view is that the ME values generated using the TME assay may not be applicable in practice because it employs tube feeding of birds, often adult cockerels, with a set amount of feed as well as a long period of fasting; tube feeding of birds with a low amount of feed may have exaggerated the role of EEL in ME calculation compared with that in birds fed ad libitum.
Furthermore, it has been shown that EEL for TME is overestimated by fasting (Sibbald, 1975) or through regression of energy void as excreta on the weight of feed consumed under force feeding (Hätel, 1986; Farrell et al., 1991). Undoubtedly, fasting for an extended period of time alters the physiology of birds compared with ad libitum feeding. The overly empty intestine for an extended time may lead to increased gastric secretion, and slaugh intestine and mucus cells. Thus, the EEL values used in the correction of TME can be higher than when ad libitum feeding is provided to the chickens as shown in the literature (Hätel, 1986). Notwithstanding, the TME system may overestimate ME values by correcting for EEL because at the end all energy gained or lost by the bird comes from the feed it has ingested, i.e., the energy loss through EEL never can be recovered for use. Therefore, the loss of such energy should not be added to the ME value as it is not available to the animal for utilization.
However, from an operational rather than an accuracy point of view, the TME assay has some merits; it is rapid, requires a small amount of feed, does not need feed mixing, and uses the birds repeatedly (Sibbald, 1976). Good agreements between AME and TME values of some ingredients, such as corn (Baidoo et al., 1991), provide the opportunity to make use of TME values generated in past years. Further assays can be performed to measure both AME and TME values of same ingredients in parallel, and a regression equation can be produced so that available TME values for some ingredients may be converted to AME values for feed formulation in the poultry industry.
ME vs. MEn
AMEn, or usually interchangeable with MEn, values are commonly used as the available energy poultry feed (Hill and Anderson, 1958), and as such, they are the default table values for feedstuffs (Janssen, 1989; NRC, 1994; Rostagno, 2017). AMEn is corrected from AME, and the correction is made based on the energy content of N-containing excretory materials that is actually retained in the body. The correction factors of 8.22 kcal (Hill and Anderson, 1958) or 8.73 kcal (Titus et al., 1959) have been used for 1 g of N retained. Hill and Anderson (1958) assumed that uric acid was the sole N excretory product in the chicken, whereas Titus et al. (1959) suggested less uric acids in the excretory products of protein metabolism and thus different values.
Correction for N retention is based on data obtained in non-growing adult roosters, which was then applied to growing chickens as a comparison (Hill and Anderson, 1958; Farrell, 1999). As growing chickens retain more than half of the N consumed, the concept of standard AME (or AMEs) has been proposed where it is suggested that 50% N retention to be applied to AME values (Cozannet et al., 2010). However, such a correction has not been accepted in poultry ME measurement and formulation to date.
Whether the correction to zero N retention should be used for describing available energy for poultry has been an ongoing debate since Hill and Anderson (1958). First of all, researchers realized that such a correction does not change the relative values of ingredients (Baldini, 1961; Proudman et al., 1970) and the correction, in most cases, makes little difference in the ME values in older birds (Shannon and Brown, 1970; Farrell et al., 1991; Lopez and Leeson, 2007). Secondly, N correction under experimental conditions and in certain test diets may introduce errors as N-retention in birds fed an AA imbalanced test diet can be different from those fed a balanced diet. Thus, MEn values obtained with imbalanced test diets may be erroneous. This error may also occur when the measurements are performed after fasting or birds are fed test diets with a high protein level (Farrell et al., 1991). Thirdly, the ME values may be penalized for protein meals and overestimated for the energy grains and fat (Farrell, 1999). Lastly, correcting ME values to zero N balance does not reflect the true requirement of energy in productive birds, such as broilers and layers, where retained energy as protein will never be excreted as uric acid and other N compounds. The argument that MEn should be used to make energy values among different poultry classes more consistent does not stand. It is because this ignores the physiological differences that exist among different types of birds, i.e., broilers, layers, roosters, or breeders. Thus, it is recommended that ME instead of MEn be used and ME values of ingredients be measured in the same type of birds.
FLAWS IN ME BIOASSAY
While a plethora of studies have been performed to estimate the ME values of poultry feedstuffs, the accuracy of the assays is questionable. Therefore, it is necessary to thoroughly review all the studies, carefully assess their design and calculations, and scrutinize the data critically. A summary of identified flaws in many studies is reported here focusing on the protocols and calculations that affected the accuracy of the data.
Wrong Assumption of Pbd+ Pti = 1 in Basal Substitution Method
In the basal substitution method, formulation of the test diet rather than direct substitution of the basal diet with the test ingredient is frequently used to allow for the inclusion of a set level of minor ingredients for both the basal and test diets. Such an exercise is designed to make the test diet balanced at least in micro nutrients, such as trace minerals, vitamins, and essential AAs. As the micro nutrients have taken up extra space in the test diet compared to simple substitution, the sum of the basal diet proportion and the proportion of test ingredient (or inclusion rate) in the test diet does not equal to 100% as already stated in previous section, i.e., Pbd+ Pti ≠ 1.
Herein, a simple example is presented to demonstrate a significant error introduced by this wrong assumption, where Pbd + Pti < 1. As shown in Table 3, the basal diet is formulated to contain energy-yielding ingredients, including wheat (60%), soybean meal (33%), and canola oil (2%) that constitute 95% of the diet, and the minor ingredients make up the rest, i.e., 5% of the diet. When a test diet is formulated to include 30% test ingredient (i.e., sorghum), the level of minor ingredients (5%) remains the same, leaving 65% as the energy-yielding ingredients in the basal diet, i.e., wheat 41.05%, soybean meal 22.58%, and canola oil 1.37%. Accordingly, the Pbd = 65%/95% = 68.42% rather than 70% as if 30% basal diet is replaced by test ingredient. Herein, the ME of limited AA supplementation is not in the calculation for the sake of simplicity to explain. However, this also introduces error as will be discussed in the later section.
Table 3.
AME difference resulted in mistaken calculation with constant minor ingredients between basal and test diets and by ignoring synthetic AA energy contributions.
| Calculation |
||||||
|---|---|---|---|---|---|---|
| Ingredients/energy | Basal diet | Test diet | Test/basal | (AMEtd − AMEbd * Pbd)/Pti | AMEbd − (AMEbd − AMEtd)/Pti | (AMEtd − AMEEAA − AMEbd * Pbd)/Pti2 |
| Wheat (%) | 60.00 | 41.05 | 68.42 | − | − | − |
| Soybean meal (%) | 33.00 | 22.58 | 68.42 | − | − | − |
| Canola oil (%) | 2.00 | 1.37 | 68.42 | − | − | − |
| Mineral, vitamin premix and synthetic AA1 (%) | 5.00 | 5.00 | − | − | − | − |
| Sorghum (%) | 30.00 | − | − | − | − | |
| Total (%) | 100.00 | 100.00 | − | − | − | − |
| Measured AME (kcal/kg) | 3,200 | 3,280 | − | − | − | − |
| Sorghum AME (kcal/kg) | − | − | − | 3,635 | 3,467 | 3,592 |
| Error (kcal/kg) | − | − | − | − | −168 | +43 |
AME, apparent metabolisable energy; AMEbd, AME of basal diet; AMEtd, AME of test diet, AMEEAA, AME due to the contribution of amino acids that are not taken into account in the mistakenly assumed inclusion rate of basal diet; Pbd, proportion of the basal diet (energy-yielding ingredients) in the test diet; Pti, proportion of test ingredient included in the diet.
Synthetic AA composition: 0.3% lysine, 0.4% methionine, and 0.2% threonine.
In consideration of correct inclusion rate of basal in test diet and the synthetic AA contributions to diet AME, this is the accurate equation for basal substitution method.
By giving the measured basal diet AME value of 3,200 kcal/kg (AMEbd), and test diet AME value of 3,280 kcal/kg, the sorghum AME value AMEti = (AMEtd–AMEbd*Pbd)/Pti = (3280–3200 × 68.42%)/30% = 3635 kcal/kg according to Equation 11. However, if Pbd+ Pti = 1 is assumed, i.e., Pbd would be 1–Pti = 1–30% = 70%, and thus AMEti = AMEbd–(AMEbd–AMEtd)/Pti = 3200–(3200 –3280)/30% = 3467 kca/kg according to Equation 12. A significant underestimation of (3635–3467) = 168 kcal/kg is made by the mistaken assumption of Pbd + Pti = 1 that neglects the 1.58% lower inclusion rate of basal energy yielding ingredient in test diet.
Overall, such errors occurred in the bioassays to measure ME values of wheat (Saki et al., 2009), barley (Saki et al., 2009), full fat sunflower seed (Salari et al., 2009), sunflower meal (Moghaddam et al., 2012), Brassica meals (Newkirk et al., 1997), and canola meal (Woyengo et al., 2010; Toghyani et al., 2014). In contrast, some authors realized that basal diet inclusion rate (Pbd) does not equal to 1–Pti and they used appropriate equations with accurate Pbd applied in the calculations as stated (Bartov, 1996; Rodriguez et al., 2005; Mandal et al., 2006; Adeola and Ileleji, 2009; Cozannet et al., 2010).
The underestimation of the AME by this erroneous calculation can be corrected by adding the value calculated by the following equation:
| (25) |
where AMEε represents the error, and Pmi is the minor ingredient inclusion rate which is the same in both basal and test diets.
Nonproportional Basal Energy-Yielding Ingredients in Test Diet
The rationale to have a test diet that has a set proportion of the basal diet replaced by a test ingredient is to be able to deduce the amount of ME attributable to the unknown proportion, i.e., the test ingredient. In this case, the test diet needs to be formulated in such a way that the ratios of inclusion of all the basal energy-yielding ingredients should be identical between the test diet and the basal diet. In the example outlined above, the ratios of corn, soybean meal, and canola oil inclusions in the test diet to basal diet are 68.42%. However, this is not always the case in the ME bioassays reported in the literature. For example, Rodriguez et al. (1998) formulated a test diet containing yellow maize, soybean meal, and sunflower oil at 82.3, 75.1, and 0%, respectively, to those in the basal diet in order to measure the ME value of hulled full-fat sunflower seed. In the study, the calculation of the test ingredient ME would have been either impossible or grossly inaccurate, depending on the extent of differences in the ratios. Such inconsistence occurred in the measurement of canola seed AME by Barekatain et al. (2015). In the study, the basal (or reference) diet was formulated to contain 60.00% corn, 31.47% soybean meal, and 4.05% canola oil as major energy yielding ingredient. However, the test diet was formulated to have 52.81% corn, 27.61% soybean meal, and 0% canola oil, which represent 88.0% of corn, 88.0% soybean meal, and 0% canola oil, respectively, from basal diet. No canola oil inclusion in the test diet was due to the consideration that canola seed already contains 44% fat and additional oil would make pelleting difficult. In the calculation of canola seed AMEn, however, the basal AMEn without deduction of canola oil AMEn was used. This may lead to over-representation of basal diet energy in test diet energy thus potentially underestimate of canola ME in the calculation. Given canola oil AMEn value of approximately 9,000 kcal/kg (Valdes and Leeson, 1994; Sauvant et al., 2004; Rostagno, 2017), a basal AMEn overestimate of 9,000 kcal/kg × 4.05% × 85% (the basal% in test diet used in the study) = 310 kcal/kg may occur in the calculation of canola seed AMEn. This error accounts for 10% of the test diet AMEn value, and thus greater error in the calculation of canola seed AMEn. Given no presentation of measured basal and test diet AMEn values in the publication, a recalculation of cacola seed AMEn should be done with available measured values.
Other studies have also made similar errors. For instance, enormously inconsistent proportions of energy-yielding ingredients were formulated in the test diet relative to the basal diets to measure the AME values of pea and lupin varieties (Nalle et al., 2011a,b, 2012). A pea test diet is described here to show the erroneous formulation of the diets. Pea substitution rate was 20% while the basal diet energy-yielding ingredients inclusion rates were 72.7, 81.4, 100.0, 100.0, and 325.0% for maize, soybean meal, meat and bone meal, tallow and soybean oil, respectively, in the test diet as opposed to the supposed inclusion rate of 80% for all the ingredients in the test diet relative to the basal diet. Such a wide range of inconsistent ingredient ratios rendered the calculation of the pea AME value invalid. There are numerous other examples to quote (Sahraei et al., 2012; Mirghelenj et al., 2013).
Miscalculations in Simple Linear Regression
By simple linear regression of diet ME values against the inclusion rates of the test ingredient in the test diets, the test ingredient ME can be obtained by extrapolating the inclusion of the test ingredient to 100% (Potter et al., 1960). Over the years, a number of variants of this method appeared in the literature. For example, Adeola (2001) proposed to compute DE of test ingredient by regressing energy intake against test ingredient consumed in pigs, and this method was applied in poultry (Dozier et al., 2008; Adeola and Ileleji, 2009; Borsatti et al., 2018). On the other hand, Cilliers et al. (1994) regressed excreted GE against GE intakes independently as GE intake of basal diet portion and GE intake of test ingredient portion in test diet to calculate the basal diet TME and test ingredient TME.
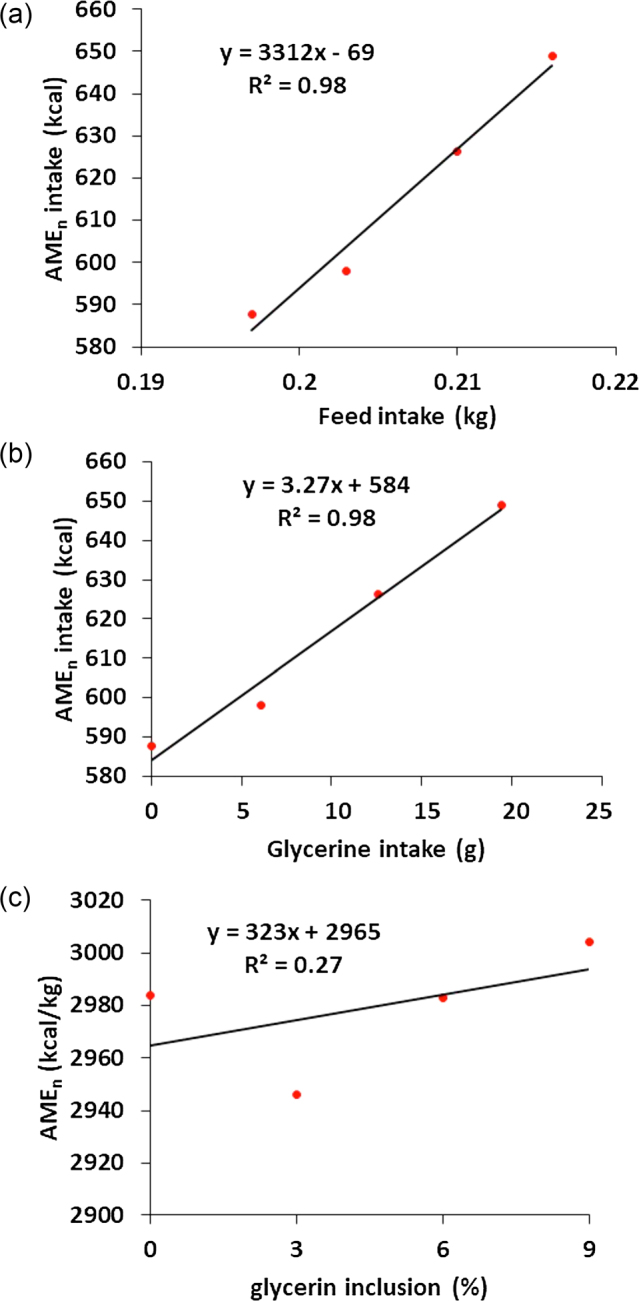
While the rationale of the above regression calculations is logical purely in calculating ME of ingredient, the statistical outcomes on the accuracy of the calculations can be misleading by including, for example, FI rather than ingredient inclusion levels as independent variable. The r2 and possibly P values can look much better statistically than when inclusion levels of ingredient are used. The reason for this is because the FI intake increase is always going to increase the GE intake so the high correlation between these 2 variables does not necessarily indicate the correlation is due to the change of test ingredient. Here is an example for the demonstration of a “flawed” simple linear regression that showed a high coefficient of determination by the regression of AMEn intake against FI (Dozier et al., 2008). In the study, the birds were fed 100, 97, 94, and 91% of ad libitum intake so that differences in AMEn consumption were only attributable to the glycerine inclusions at 0, 3, 6, and 9%. The variables for the regression are shown in Table 4. The flaws are identified as follows. Firstly, the slope of the equation produced by regressing the AMEn intake against FI does not equate to the AME value of glycerine. This is because such regression implies that diet AMEn value is a function of AMEn intake divided by FI (Figure 2 a), which gives the AMEn of feed rather than the test ingredient. The correct approach should have been the AMEn intake regressed against the glycerine intake with the basal AMEn as the intercept and glycerin AMEn as the slope (Figure 2b). From the calculation point of view, this gives the correct value. Secondly, the significance (P ≤ 0.0001) and regression coefficient (r2 = 0.98) were only the reflections of the model that fits the values of test ingredient intake against AMEn intake (Figure 2b). The already expected linear relationship between test ingredient intake and AMEn intake would have masked the poor fitness of the model that only takes account the linear relationship between diet AMEn and glycerine inclusion rate, upon which glycerine AMEn value was determined. Figure 2c, on the other hand, suggests a correct regression model that reflects the true relationship between AMEn of the diet and the glycerine inclusion rate. The glycerine AMEn can then be derived from the regression equation, where the intercept is the basal AMEn value and extrapolation of glycerine inclusion rate to 100% results in glycerine AMEn value. As shown in Figure 2c, the r2 of the model is actually very low (0.27), indicating the lack of robustness in the estimation of glycerine AMEn value. Table 2 further explains this problem. For instance, the test diet AMEn values vary depending on the inclusion level of the test ingredient in the test diet, leading to vastly different AMEn values at 3%, and 6 and 9% inclusions of glycerine. In fact, at 3% inclusion level, the calculated glycerin AMEn value was much lower (1,717 kcal/kg) than the at 6% and 9% glycerine inclusions (2,967 and 3,206 kcal/kg, respectively) indicating poor linear relationship between inclusion rate and AMEn change of test diets or in another word strong interaction between glycerin and other ingredients in the diet (Table 2). Consequently, it can be concluded that a linear model does not fit the data measured by Dozier et al. (2008). A similar regression method was reported in Lima et al. (2013). However, the results reported are not sufficient to allow readers to examine the fitness of the data. Therefore, a direct regression of diet AME values against the test ingredient inclusion levels should be employed so that the statistical power of the analysis can be shown and accuracy of the experimental data can be directly visualized.
Table 4.
Variables used in the Dozier et al. (2008) for the comparison of accuracy with 2 different regressions (reproduced from Dozier et al. 2008) (Table 4).
| Glycerin level (%) | Glycerin intake* (g) | Feed intake (kg) | AMEn intake (kcal) | Diet AMEn (kcal/kg) | Glycerin AMEn (kcal/kg) |
|---|---|---|---|---|---|
| 0.00 | 0.0 | 0.197 | 588 | 2,984 | − |
| 3.00 | 6.1 | 0.203 | 598 | 2,946 | 1,717 |
| 6.00 | 12.6 | 0.210 | 626 | 2,983 | 2,967 |
| 9.00 | 19.4 | 0.216 | 649 | 3,004 | 3,206 |
AMEn, apparent metabolizable energy corrected to zero nitrogen retention.
Figure 2.
Regression of AMEn intake vs. feed intake, glycerine intake and glycerine inclusion rate depicting calculation flaw present in the literature.
Applegate (2005) measured the AMEn of corn and dehulled and degermed corn (DDC) in broilers with 4 diets formulated with different levels of corn and DDC ranged from 0 to 93.38%, and minor ingredients composed of 6.62% of diet (calculated according to the reference). In the study, AMEn of corn and DDC were “determined using the regression procedures of SAS10 and extrapolation of the linear regression to 100% of corn grain or DDC.” Unfortunately, the author ignored the fact that the dependent variable in the regression model is diet AMEn and thus the large intercept produced only represents the AMEn value of diet where the energy-yielding ingredients only compose of 93.38% of diets rather than 100%. Therefore, when the independent variable DDC was extrapolated to 100% to multiply the coefficient, the calculated diet AME does not equal to DDC AMEn (nor AMEn of diet containing 93.38% DDC plus 6.62% minor ingredients). Similarly, when the DDC level was extrapolated to zero, the calculated diet AME does not equal to corn AMEn but the diet AMEn containing 93.38% corn. Thus, the AMEn values of corn and DDC reported in the study are lower than they should be. Essentially, if the author used multiple linear regression which considers both corn and DDC as independent variables, the resulting coefficients multiplied by 100 would more accurately estimate the AMEn of both ingredients.
In summary, simple linear regression can be used for the calculation of ME values. However, care must be taken to ensure the regression model(s) used is completely understood and subsequent calculations are correctly performed so as to achieve accurate energy values.
Test Diet ME Value Is Assumed, Not Determined
Quite often, researchers use literature values for the ingredients included in the test diet, so that the ME value of a test ingredient can be calculated (Scott et al., 1998; Austin et al., 1999; Wiseman, 2000). While certain energy or protein sources, such as glucose or casein, are used (Armsby, 1903; Anderson et al., 1958; Annison et al., 1994), one would expect the ME values are basically accurate. However, this is not always the case, e.g., 4 different casein ME values ranging from 3,000 to 4,804 kcal/kg have been used in the literature as described previously (Carpenter and Clegg, 1956; Annison et al., 1994; Ravindran et al., 1999). The use of casein values differing by 1,804 kcal/kg obviously leads to massive differences in obtaining ME values of test ingredients. Furthermore, by assuming ME values for grains and protein meals using table values, prediction equations, or previously measured values, there is no doubt the resultant ingredient ME values are questionable. A case in point is the wheat AME values for broilers (Scott et al., 1998; Austin et al., 1999; Wiseman, 2000; Seyedi et al., 2013), rye AME values for broilers (Boros and Bedford, 1999), and meat and bone meal AME values for ducks (Adedokun and Adeola, 2005) reported over the past 2 decades. Interestingly, Adedokun and Adeola (2005) stated “the corn and soybean meal used in this study, although from the same batch, were different from those used in the report by Adeola (2003),” but “the AME values of corn and SBM at 3,100 and 2,600 kcal/kg (Adeola, 2003)” were still used as AME values used to calculate the test diet AME value. Therefore, it stresses the importance of full characterization of all the ingredients used in ME bioassays.
When AMEn intake is regressed against feed or glycerin intake, coefficients of determination are very high (R2 = 0.98). However, when AMEn is regressed against glycerin inclusion rate, the coefficients of determination are very poor (R2 = 0.27), which shows the true effect of glycerine inclusion level on measured glycerine AMEn value. (a). AMEn intake vs. FI; (b) AMEn intake vs. glycerin intake; and (c) AMEn vs. glycerin inclusion rate.
Tube Feeding to Measure AME
Tube feeding was a frequently used assay to determine the TME value of feedstuffs, although its use is no longer widespread today (Sibbald, 1976; Sibbald and Wolynetz, 1987; Sell et al., 2001; Wang et al., 2017a). In such assays, many researchers report the AME or AMEn values by subtracting EEL from TME (Lin et al., 2003; Tshovhote et al., 2003; Pirgozliev et al., 2006; Latshaw and Freeland, 2008; Zhao et al., 2008; Farran et al., 2010; Jie et al., 2013; Jahanian and Rasouli, 2014). This calculation does not take into the account that tube feeding assay applies a longer period of excreta collection (36 to 72 h) for a limited FI. Therefore, the tube feeding assay with such a long period of excretion overestimates EEL compared to ad libitum feeding for the same amount of feed. This leads to a significant underestimation of AME or AMEn values. Henceforth, such “AME” or “AMEn” values are not comparable to those measured in ad libitum bioassays such as the studies of Sibbald (1975) and Sibbald (1976) vs. those of Hill et al. (1960) as already indicated by Pesti and Edwards (1983). Unfortunately, the point raised 3 decades ago was disregarded by many researchers. On the other hand, some studies measured TME and AME independently rather than using TME values to estimate AME values which are more appropriate bioassay systems (Dei et al., 2008; MacLeod et al., 2008). For TME bioassay of naked oats, MacLeod et al. (2008) administrated glucose as control for EEL estimation without extended fasting, while the AME bioassay employed TiO2 as a marker without using TME values to derive AME. Similarly, Dei et al. (2008) used dextrose as control for TME bioassay and total excreta collection method to measure the AME of shea nut meal.
Use of Diet Metabolizability to Predict Test Ingredient ME Value
There is no doubt that AME values of the basal and test diets can be obtained by using metabolizability coefficients of basal (Cbd) and test (Ctd) diets together with their GE. However, calculation of AMEti through energy metabolizability coefficients of the test ingredient (Cti) is problematic as it is impossible to derive Cti without knowing AMEti. It is logical to assume that AME of a test diet (AMEtd) is the sum of energy contributions from basal diet (AMEbd × Pbd) and the test ingredient (AMEti × Pti). Such additivity assumption has been used widely in the measurement of feedstuff ME in poultry as described previously. However, similar assumption of additivity does not apply to energy metabolizability coefficient as was suggested by the Adeola group (Olukosi and Adeola, 2009; Adeola et al., 2010, 2018) and others (Olukosi et al., 2017; Dunaway, 2019), i.e., Ctd = (Cbd × Pbd) + (Cti × Pti) and thus Cti = Cbd + (Ctd–Cbd)/Pti. The reason is because the metabolizability coefficient contributions of basal and test ingredients to that of test diet are not proportional to their inclusion rates by weight or energy as will be explained below. These studies calculated test ingredient AME through derived Cti from Cbd and Ctd using the basal substitution method.
We take an example to show why the coefficients are not additive and how such additive assumption leads to mistaken outcome for test ingredient coefficient and thus AME. Table 5 shows an example that the calculations of Cti are conducted in 3 different ways in literature by:
-
1.dividing ingredient AME by ingredient GE;
(26) -
2.deriving from Cbd and Cti with Pbd and Pti as the proportions of the basal diet (in weight) and the test ingredient in the test diet:
(27) -
3.deriving from Cbd and Cti with Peti and (1– Peti) as the energy contribution proportions of basal diet and test ingredient respectively in test diet.
(28)
By definition, Cti calculated with Equation 26 is the direct answer. Equation 27 assumes C is additive when it is proportionated by the inclusion rates in weight. Equation 28 is flawed with the assumption that energy metabolizability coefficients are additive when it is proportionated by the inclusion rates in energy contribution. Based on these equations, Cti of 0.635, 0.674, and 0.624 are produced, respectively. The value of 0.635 produced by Equation 26 is correct by the definition of energy metabolizability coefficient, while Equation 27 overestimated and Equation 28 underestimated the coefficient. Thus, resulted AME values are undoubtedly wrong. Henceforth, we suggest that the AME values reported in many studies calculated with such flawed assumptions need to be recalculated (Adeola et al., 2010, 2018; Bolarinwa and Adeola, 2012; Adebiyi and Olukosi, 2015; Pekel et al., 2015; Olukosi et al., 2017). Furthermore, Wang et al. (2017a,b) calculated AME of dry citrus pulp and mulberry leaf meal by using energy metabolizability coefficient of test diets (Ctd, calculated in their equation as [GEdiet − GEexcreta]/GEdiet) rather than that of test ingredients (Cti). Apparently, dry citrus pulp and mulberry leaf meal have lower metabolizability than the test diets; thus, their energy content can be overestimated significantly. Similar faulty calculations are also present in the calculations of ileal digestibility and DE (Adeola et al., 2010; Toghyani et al., 2017; Adeola et al., 2018) which are beyond the scope of this review and thus not elaborated.
Table 5.
Calculation of test ingredient metabolizable energy coefficient in different way to demonstrate the errors produced by mistaken equations.1
| Items | Basal diet | Test diet | Ratio in test to basal | Test ingredient (calculated Cti) |
|---|---|---|---|---|
| Energy yielding, % | 95.0 | 65.0 | 68.4 | − |
| Minor, % | 5.0 | 5.0 | − | − |
| Test ingredient, % | 0.0 | 30.0 | − | − |
| GE, kcal/kg | 4,200 | 4,100 | − | 4,088 |
| Excreta GE from 1 kg feed | 1,100 | 1,200 | − | − |
| AME, kcal/kg | 3,100 | 2,900 | − | 2,596 |
| P (energy contribution to test diet) | 73.1 | − | − | 26.9 |
| C12 | 0.738 | 0.707 | − | 0.635 |
| C2 | 0.738 | 0.707 | − | 0.674 |
| C3 | 0.738 | 0.707 | − | 0.624 |
Cti, energy metabolizability coefficient of test ingredient; GE, gross energy; P, proportion of basal diet or test ingredient in test diet.
To sum up, the absolute AME contribution of an ingredient to a diet is dependent upon its AME and inclusion rate. However, the metabolizability of the ingredient is only related to the AME contribution to the diet by virtue of the fact that it defines the AME of the ingredient, but the metabolizability of the ingredient is not proportional to its inclusion rates either by weight or by energy. Further, the diet metabolizability cannot be used to calculate individual ingredient metabolizability by virtue of the fact that they are not related or dependent upon one another.
Ignored Synthetic AA Contribution as Energy-Yielding Ingredients
In a practical diet, AA such as lysine, methionine, and threonine are usually added to make the diet balanced in essential AA. In the ME bioassay, if a proportion of basal diet is substituted directly with the test ingredient to form a test diet, whether AA are regarded as energy-yielding ingredient is not an issue as they are included as part of the basal diet proportionally. However, when the minor ingredients are formulated to a constant inclusion level in both the basal and test diets and AA are considered as minor ingredients together with minerals and vitamins, ignoring AA as energy-yielding ingredients will produce a calculation error despite that the error can be relatively small (Salari et al., 2009; Woyengo et al., 2010; Moghaddam et al., 2012; Toghyani et al., 2014).
Here is an example. A basal diet and a test diet are formulated as shown again in Table 3 that include 5% minor ingredients with 0.3% lysine, 0.4% methionine, and 0.2% threonine supplemented in addition to the minerals and vitamins. When AA are not considered, the AME value of sorghum (at an inclusion rate of 30%) is calculated to be 3,635 kcal/kg by using Equation 11. When AA are considered as energy-yielding ingredients, the calculation should be adjusted as the AA inclusion in test diet is not proportional to other energy-yielding ingredients in the basal diet, i.e., instead of 68.42% of the basal AA, it is 100%. Therefore, the extra 100%–68.42% = 31.58% AA contribution is not from the basal diet. The energy supplied by the extra AA should be deducted from ME of the test diet in the calculation of the test ingredient ME, i.e., for sorghum AME. The AME of extra AA (AMEEAA) can be calculated as:
where 3,748 kcal is the GE of lysine-HCl (78.4%), 5,528 kcal the GE of methionine (98%), and 4,029 kcal the GE of threonine (98%). It is assumed that AAs are 100% digestible (Karakas et al., 2001).
The calculation of sorghum AME then becomes to:
Thus, an overestimation of 3635–3592 = 43 kcal/kg sorghum AME was produced by ignoring the AA as energy-yielding ingredients without adjustment.
PROPOSED BIOASSAY SYSTEMS AND DIET DESIGNS FOR INGREDIENT ME VALUES
The bioassay systems, diet designs, and corresponding data analyses for measuring feed ingredient ME values are complex. The aspiration is to use a nutritionally adequate diet with a statistically robust design that is practical and user-friendly to determine feed ingredient ME values used in poultry feed formulation. Data thus obtained will form the basis for all other systems, including in vitro assays and NIR prediction.
The following criteria are proposed for ME bioassays.
-
a.
The age, sex, and breed of animals are representative of industrial applications.
-
b.
Animals are not stressed during the assay so that the physiological status is similar to the animals under normal growth conditions.
-
c.
Birds are fed ad libitum.
-
d.
All the feed ingredients used in the assay should be characterized using wet chemistry with AOAC or similarly approved methods.
-
e.
Diets should be nutritionally balanced according to the nutrient specifications set out for the breed and palatable.
-
f.
The protocol for feed withdrawal periods before and after total collection should be uniform.
-
g.
The method of excreta collection, drying, and grinding should follow standard practice.
-
h.
Purified or semi-purified diets not recommended.
-
i.
Long periods of fasting should be avoided.
-
j.
Calculations and data analysis should be standardized.
According to the above criteria, the total collection bioassay with a balanced basal diet substituted with multiple and varied levels of test ingredients is recommended to measure AME values of multiple ingredients (using multiple linear regression or basal diet substitution at multiple levels of single test ingredient). The detailed protocols are described below.
Multiple Linear Regression Method
-
a.
Formulate 6 or more nutritionally balanced diets to include 4 or more test ingredients in the diets as energy-yielding ingredients that include grains, oils or fats, and protein meals. The principle is that the number of test diets is more than the number of ingredients to be tested. A good example of such diets is shown in Table 1.
-
b.
The inclusion levels of different ingredients should not correlate significantly with each other in the diets allowing an independent measurement of AME contributions from the individual energy-yielding ingredients. Following formulation of the diets, Pearson correlation analysis with ingredient inclusion levels from all the diets should be performed and a correlation matrix is produced. The inclusion levels of highly correlated ingredients should be revised until the correlations are not significant. A good example of correlation matrix is shown in Table 2.
-
c.
Perform 6 or more replications for each diet depending on the inherent variation of the assay system. The number of replications may vary depending on the facility, age and breed of birds, bioassay method used, and management.
-
d.
It is recommended that broilers aged around 30 D are used for the bioassay as the FI of birds at 30 D is equivalent to the average FI of the birds grown from 0 to 40 D. Therefore, ME measured is representative of the average value.
-
e.
Use 4 to 6 birds in each replication in cases of broiler and layer chickens. The number of birds per replicate for other poultry may vary.
-
f.
Employ the total collection method with 4 D of adaptation and 3 D of excreta collection. Note the exact time accurate to the minute should be recorded for the start and end of the balance experiment to reduce errors. Indigestible marker method may be used when the assay is accurate.
-
g.
Feed consumed, excreta collected, ingredients included in the diets, GE of diets, and ingredients should be measured on a dry matter (DM) basis. Therefore, the DM of the feed should always be determined when the feed is weighed out for feeding.
-
h.
Perform multiple linear regression with diet AME or AMEn values (DM basis) against the inclusion levels of ingredients (DM basis) to calculate the AME or AMEn of the ingredients under investigation using Equation 24 as the regression model. Make sure no intercept should be applied in the regression.
-
i.
When AMEn is calculated, the N correction factor should be standardized as 8.22 kcal/g.
In circumstances that the above design is not suitable, the basal diet substitution method should be used.
Basal Diet Substitution
-
a.
Formulate a basal nutritionally balanced diet.
-
b.
Formulate 2 to 4 test diets supplemented with the same levels of minerals, vitamins, and supplemental AA and different levels of the test ingredient, for example, grains at 30% and protein meal at 15%.
-
c.
Perform 6 or more replications for each diet depending on the inherent variation of the assay system.
-
d.
It is recommended that broilers aged around 30 D are used for the bioassay as the FI of birds at 30 D is equivalent to the average FI of the birds grown from 0 to 40 D. Therefore, ME measured is representative of the average value.
-
e.
Use 4 to 6 birds in each replication in cases of broiler and layer chickens. The number of birds per replicate for other poultry may vary.
-
f.
Employ the total collection method with 4 D of adaptation and 3 D of excreta collection. Note the exact time accurate to the minute should be recorded for the start and end of the balance experiment to reduce error.
-
g.
Feed consumed, excreta collected, ingredients included in the diets, GE of diets, and ingredients should be measured on a DM basis. Therefore, the DM of the feed should always be determined when the feed is weighed for feeding.
-
h.
Calculate the AME or AMEn of the ingredient under investigation using Equation 11 with correct Pbd and Pti in DM basis.
-
i.
When AMEn is calculated, the N correction factor should be standardized as 8.22 kcal/g.
CONCLUSIONS
The available AME values of ingredients in the literature vary not only due to variation in their chemical composition which arises as a result of genetics and growing conditions encountered, but also variation in the AME methods used and calculations applied. Therefore, a proper bioassay for determining ME values for poultry feedstuffs is the first step for accurate assessment of feedstuff ME values. The currently available ME values reported in the literature have to be used with care as numerous flaws are present in the data which are difficult to identify. This review has highlighted these flaws as much as possible and any values in the studies where flaws are present should be used with great caution. Most importantly, the aim is to avoid repeating similar mistakes. Inaccurate bioassays, unnecessary adjustments, poor experimental designs, and flawed statistical or mathematical calculations can be avoided. It is important to note that researchers should use simple designs with appropriate calculations in mind before embarking on an animal experiment. Whether the assumption that energy of individual ingredients is additive in a complete diet is still questionable at least under some circumstances. This may require efforts from industry and researchers to investigate relations among the main ingredients in a complete diet so that more accurate formulation can be performed based on the outcomes that may fine-tune the additivity assumption.
ACKNOWLEDGEMENTS
We acknowledge AgriFutures Australia for funding the project (Project No PRJ-010508).
REFERENCES
- Abdollahi M.R., Ravindran V., Svihus B. Influence of feed form on growth performance, ileal nutrient digestibility, and energy utilisation in broiler starters fed a sorghum-based diet. Livest. Sci. 2014;165:80–86. [Google Scholar]
- Adebiyi A.O., Olukosi O.A. Metabolizable energy content of wheat distillers' dried grains with solubles supplemented with or without a mixture of carbohydrases and protease for broilers and turkeys. Poult. Sci. 2015;94:1270–1276. doi: 10.3382/ps/pev089. [DOI] [PubMed] [Google Scholar]
- Adedokun S., Adeola O. Apparent metabolizable energy value of meat and bone meal for white pekin ducks. Poult. Sci. 2005;84:1539–1546. doi: 10.1093/ps/84.10.1539. [DOI] [PubMed] [Google Scholar]
- Adeola O. Digestion and balance techniques in pigs. In: Lewis A., Southern L., editors. Swine Nutrition. CRC Press; Washington, DC, Boca Raton: 2001. pp. 903–916. [Google Scholar]
- Adeola O. Recent advances in duck nutrition. Proc. West. Nutr. Conf., Winnipeg, Manitoba, Canada. 2003;24:191–204. [Google Scholar]
- Adeola O., Anwar M.N., Abdollahi M.R., Ravindran V. Age-related energy values of meat and bone meal for broiler chickens. Poult. Sci. 2018;97:2516–2524. doi: 10.3382/ps/pey100. [DOI] [PubMed] [Google Scholar]
- Adeola O., Ileleji K.E. Comparison of two diet types in the determination of metabolizable energy content of corn distillers dried grains with solubles for broiler chickens by the regression method. Poult. Sci. 2009;88:579–585. doi: 10.3382/ps.2008-00187. [DOI] [PubMed] [Google Scholar]
- Adeola O., Jendza J., Southern L., Powell S., Owusu-Asiedu A. Contribution of exogenous dietary carbohydrases to the metabolizable energy value of corn distillers grains for broiler chickens. Poult. Sci. 2010;89:1947–1954. doi: 10.3382/ps.2010-00706. [DOI] [PubMed] [Google Scholar]
- Anderson D., Hill F., Renner R. Studies of the metabolizable and productive energy of glucose for the growing chick. J. Nutr. 1958;65:561–574. doi: 10.1093/jn/65.4.561. [DOI] [PubMed] [Google Scholar]
- Annison G. Relationship between the levels of soluble nonstarch polysaccharides and the apparent metabolizable energy of wheats assayed in broiler chickens. J. Agric. Food Chem. 1991;39:1252–1256. [Google Scholar]
- Annison G., Choct M., Hughes R. AME determination and its application to lupins. Proc. Proc. Aust. Poult. Sci. Symp. 1994;6:92–96. [Google Scholar]
- Antoniou T., Marquardt R., Misir R. The utilization of rye by growing chicks as influenced by calcium, vitamin D3, and fat type and level. Poult. Sci. 1980;59:758–769. doi: 10.3382/ps.0590758. [DOI] [PubMed] [Google Scholar]
- Applegate T.J. The nutritional value of dehulled-degermed corn for broiler chickens and its impact on nutrient excretion. Poult. Sci. 2005;84:742–747. doi: 10.1093/ps/84.5.742. [DOI] [PubMed] [Google Scholar]
- Applegate T.J., Troche C., Jiang Z., Johnson T. The nutritional value of high-protein corn distillers dried grains for broiler chickens and its effect on nutrient excretion. Poult. Sci. 2009;88:354–359. doi: 10.3382/ps.2008-00346. [DOI] [PubMed] [Google Scholar]
- Armsby H.P. 1st ed. John Wiley & Sons, Chapman & Hall, Limited; New York and London: 1903. Principles of Animal Nutrition. With Special Reference to the Nutrition of Farm Animals. [Google Scholar]
- Austin S.C., Wiseman J., Chesson A. Influence of non-starch polysaccharides structure on the metabolisable energy of UK wheat fed to poultry. J. Cereal Sci. 1999;29:77–88. [Google Scholar]
- Baidoo S.K., Shires A., Robblee A.R. Effect of kernel density on the apparent and true metabolizable energy value of corn for chickens. Poult. Sci. 1991;70:2102–2107. doi: 10.3382/ps.0702102. [DOI] [PubMed] [Google Scholar]
- Baldini J.T. The effect of dietary deficiency on the energy metabolism of the chick. Poult. Sci. 1961;40:1177–1183. [Google Scholar]
- Barekatain M., Wu S., Toghyani M., Swick R. Effects of grinding and pelleting condition on efficiency of full-fat canola seed for replacing supplemental oil in broiler chicken diets. Anim. Feed Sci. Technol. 2015;207:140–149. [Google Scholar]
- Bartov I. Effect of storage duration on the nutritional value of corn kernels for broiler chicks. Poult. Sci. 1996;75:1524–1527. doi: 10.3382/ps.0751524. [DOI] [PubMed] [Google Scholar]
- Barzegar S, Wu S.-B., Noblet J., Choct M., Swick R.A. Energy efficiency and net energy prediction of feed in laying hens. Poult. Sci. 2019 doi: 10.3382/ps/pez362. (In press) [DOI] [PubMed] [Google Scholar]
- Barzegar S, Wu S.-B., Noblet J., Swick R.A. Metabolizable energy of corn, soybean meal and wheat for laying hens. Poult. Sci. 2019 doi: 10.3382/ps/pez333. (In press) [DOI] [PubMed] [Google Scholar]
- Black J.L., Hughes R.J., Nielsen S.G., Tredrea A.M., Flinn P.C. Proc. Aust. Poult. Sci. Symp., Sydney, New South Wales, Australia. 2009. Near infrared reflectance analysis of grains to estimate nutritional value for chickens; pp. 31–34. [Google Scholar]
- Bolarinwa O.A., Adeola O. Energy value of wheat, barley, and wheat dried distillers grains with solubles for broiler chickens determined using the regression method. Poult. Sci. 2012;91:1928–1935. doi: 10.3382/ps.2012-02261. [DOI] [PubMed] [Google Scholar]
- Boros D., Bedford M.R. Influence of water extract viscosity and exogenous enzymes on nutritive value of rye hybrids in broiler diets. J. Anim. Feed Sci. 1999;8:579–588. [Google Scholar]
- Borsatti L., Vieira S.L., Stefanello C., Kindlein L., Oviedo-Rondón E.O., Angel C.R. Apparent metabolizable energy of by-products from the soybean oil industry for broilers: acidulated soapstock, glycerin, lecithin, and their mixture. Poult. Sci. 2018;97:124–130. doi: 10.3382/ps/pex269. [DOI] [PubMed] [Google Scholar]
- Bourdillon A., Carré B., Conan L., Duperray J., Huyghebaert G., Leclercq B., Lessire M., McNab J., Wiseman J. European reference method for the in vivo determination of metabolisable energy with adult cockerels: Reproducibility, effect of food intake and comparison with individual laboratory methods. Br. Poult. Sci. 1990;31:557–565. doi: 10.1080/00071669008417287. [DOI] [PubMed] [Google Scholar]
- Bourdillon A., Carré B., Conan L., Francesch M., Fuentes M., Huyghebaert G., Janssen W., Leclercq B., Lessire M., McNab J. European reference method of in vivo determination of metabolisable energy in poultry: reproducibility, effect of age, comparison with predicted values. Br. Poult. Sci. 1990;31:567–576. doi: 10.1080/00071669008417288. [DOI] [PubMed] [Google Scholar]
- Carpenter K., Clegg K. The metabolizable energy of poultry feeding stuffs in relation to their chemical composition. J. Sci. Food Agric. 1956;7:45–51. [Google Scholar]
- Carre B., Lessire M., Juin H. Prediction of the net energy value of broiler diets. Animal. 2014;8:1395–1401. doi: 10.1017/S175173111400130X. [DOI] [PubMed] [Google Scholar]
- Choct M., Hughes R.J., Annison G. Apparent metabolisable energy and chemical composition of Australian wheat in relation to environmental factors. Aust. J. Agric. Res. 1999;50:447–451. [Google Scholar]
- Cilliers S.C., Hayes J.P., Maritz J.S., Chwalibog A., Dupreez J.J. True and apparent metabolizable energy values of lucerne and yellow maize in adult roosters and mature ostriches (Struthio camelus) Anim. Prod. 1994;59:309–313. [Google Scholar]
- Collins N.E., Moran E.T., Stilborn H.L. Performance of broilers fed normal and waxy corn diets formulated with chick and rooster derived apparent metabolizable energy values for the grains. J. Appl. Poult. Res. 2003;12:196–206. [Google Scholar]
- Cozannet P., Lessire M., Gady C., Metayer J., Primot Y., Skiba F., Noblet J. Energy value of wheat dried distillers grains with solubles in roosters, broilers, layers, and turkeys. Poult. Sci. 2010;89:2230–2241. doi: 10.3382/ps.2010-00833. [DOI] [PubMed] [Google Scholar]
- CVB. 2009. CVB Table Booklet Feeding of Poultry CVB. Zoetermeer, the Netherlands.
- Daghir N.J., Farran M.T., Barbour G.W., Beck M.M. Nutritive value of high-oil corn grown under semi-arid conditions and its impact on broiler performance and carcass composition. Poult. Sci. 2003;82:267–271. doi: 10.1093/ps/82.2.267. [DOI] [PubMed] [Google Scholar]
- Dale N.M., Fuller H.L. Additivity of true metabolizable energy values as measured with roosters, broiler chicks, and poults. Poult. Sci. 1980;59:1941–1942. doi: 10.3382/ps.0591941. [DOI] [PubMed] [Google Scholar]
- Dei H.K., Rose S.P., Mackenzie A.M., Pirgozliev V. Metabolizable energy in different shea nut (Vitellaria paradoxa) meal samples for broiler chickens. Poult. Sci. 2008;87:694–699. doi: 10.3382/ps.2007-00290. [DOI] [PubMed] [Google Scholar]
- Deng P., Utterback P.L., Parsons C.M., Hancock L., Swanson K.S. Chemical composition, true nutrient digestibility, and true metabolizable energy of novel pet food protein sources using the precision-fed cecectomized rooster assay. J. Anim. Sci. 2016;94:3335–3342. doi: 10.2527/jas.2016-0473. [DOI] [PubMed] [Google Scholar]
- Dozier W.A., Kerr B.J., Corzo A., Kidd M.T., Weber T.E., Bregendahl K. Apparent metabolizable energy of glycerin for broiler chickens. Poult. Sci. 2008;87:317–322. doi: 10.3382/ps.2007-00309. [DOI] [PubMed] [Google Scholar]
- Dunaway A.E. University of Kentucky; Lexington, Kentucky: 2019. Metabolizable energy determination in broiler chickens. MSc Theses and Dissertations. [Google Scholar]
- Ewan R.C. Predicting the energy utilization of diets and feed ingredients by pigs. In: van der Honing Y., Close W.H., editors. Energy Metabolism. European Association of Animal Production Bulletin; Pudoc Wageningen, Netherlands: 1989. pp. 271–274. [Google Scholar]
- Farran M.T., Barbour G.W., Usayran N.N., Kayouli C. Metabolizable energy and amino acid digestibility of decorticated extruded safflower meal. Poult. Sci. 2010;89:1962–1966. doi: 10.3382/ps.2009-00559. [DOI] [PubMed] [Google Scholar]
- Farrell D. Rapid determination of metabolisable energy of foods using cockerels. Br. Poult. Sci. 1978;19:303–308. [Google Scholar]
- Farrell D.J. In vivo and in vitro techniques for the assessment of the energy content of feed grains for poultry: a review. Aust. J. Agric. Res. 1999;50:881–888. [Google Scholar]
- Farrell D., Smulders A., Mannion P., Smith M., Priest J. The effective energy of six poultry diets measured in young and adult birds. In: McCracken K., Unsworth E., Wylie A., editors. Energy Metabolism of Farm Animals. CAB International; Wallingford, Oxon: 1998. pp. 371–374. [Google Scholar]
- Farrell D., Thomson E., Choice A., Ashes J., Peck N., Hogan J. Effects of milling and pelleting of maize, barley and wheat on their metabolizable energy value for cockerels and chicks. Anim. Feed Sci. Technol. 1983;9:99–105. [Google Scholar]
- Farrell D.J., Thomson E., Du Preez J.J., Hayes J.P. The estimation of endogenous excreta and the measurement of metabolisable energy in poultry feedstuffs using four feeding systems, four assay methods and four diets. Br. Poult. Sci. 1991;32:483–499. [Google Scholar]
- Ferrell C., Oltjen J. ASAS CENTENNIAL PAPER: net energy systems for beef cattle - concepts, application, and future models. J. Anim. Sci. 2008;86:2779–2794. doi: 10.2527/jas.20080954. [DOI] [PubMed] [Google Scholar]
- Fraps G.S. Digestibility and production coefficients of poultry feeds. Texas Agricult. Exp. Stat. Bull. 1928;372:1–24. [Google Scholar]
- Fraps G.S. Maintenance requirements of chickens and the effect of age of chickens on the productive energy of feeds. Texas Agricult. Exp. Stat. Bull. 1944;665:1–34. [Google Scholar]
- Fraps G., Carlyle E. Utilization of energy of wheat products by chickens. J. Nutr. 1939;18:385–398. [Google Scholar]
- Fraps G.S., Carlyle E.C., Fudge J.F. Metabolizable energy of some chicken feeds. Texas Agricult. Exp. Stat. Bull. 1940;589:23. [Google Scholar]
- Garnsworthy P.C., Wiseman J., Fegeros K. Prediction of chemical, nutritive and agronomic characteristics of wheat by near infrared spectroscopy. J. Agric. Sci. 2000;135:409–417. [Google Scholar]
- Gehring C.K., Bedford M.R., Cowieson A.J., Dozier W.A. Effects of corn source on the relationship between in vitro assays and ileal nutrient digestibility. Poult. Sci. 2012;91:1908–1914. doi: 10.3382/ps.2012-02175. [DOI] [PubMed] [Google Scholar]
- Gonzalez-Esquerra R., Leeson S. Studies on the metabolizable energy content of ground full-fat flaxseed fed in mash, pellet, and crumbled diets assayed with birds of different ages. Poult. Sci. 2000;79:1603–1607. doi: 10.1093/ps/79.11.1603. [DOI] [PubMed] [Google Scholar]
- Guillaume J., Summers J. Maintenance energy requirement of the rooster and influence of plane of nutrition on metabolizable energy. Can. J. Anim. Sci. 1970;50:363–369. [Google Scholar]
- Guirguis N. Evaluating poultry feedstuffs in terms of their metabolizable energy content and chemical composition. Aust. J. Exp. Agric. 1975;15:773–779. [Google Scholar]
- Guirguis N. Metabolizable energy values of fats and protein concentrates for poultry: effect of sex and inclusion level of feedstuffs. Aust. J. Exp. Agric. 1976;16:691–695. [Google Scholar]
- Hari P., Kriwuscha A. Weitere Beiträge zum Stoff-und Energieumsatz der Vögel. Biochem. Ztschr. 1918;88:345–362. [Google Scholar]
- Harris L.E. National Academy of Sciences. National Research Council; Washington, DC: 1966. Biological energy interrelationships and glossary of energy terms. [Google Scholar]
- Hätel H. Influence of food input and procedure of determination on metabolisable energy and digestibility of a diet measured with young and adult birds. Br. Poult. Sci. 1986;27:11–39. doi: 10.1080/00071668608416851. [DOI] [PubMed] [Google Scholar]
- Hew L.I., Ravindran V., Mollah Y., Bryden W.L. Influence of exogenous xylanase supplementation on apparent metabolisable energy and amino acid digestibility in wheat for broiler chickens. Anim. Feed Sci. Technol. 1998;75:83–92. [Google Scholar]
- Hill F., Anderson D. Comparison of metabolizable energy and productive energy determinations with growing chicks. J. Nutr. 1958;64:587–603. doi: 10.1093/jn/64.4.587. [DOI] [PubMed] [Google Scholar]
- Hill F., Anderson D., Renner R., Carew L. Studies of the metabolizable energy of grain and grain products for chickens. Poult. Sci. 1960;39:573–579. [Google Scholar]
- Hughes R., Choct M. Low-ME wheat or low-ME chickens?—Highly variable responses by birds on the same low-ME wheat diet. Proc. Aust. Poult. Sci. Symp., Sydney. 1997;9:138–141. [Google Scholar]
- Hughes R.J., Choct M. Chemical and physical characteristics of grains related to variability in energy and amino acid availability in poultry. Aust. J. Agric. Res. 1999;50:689–701. [Google Scholar]
- Hullar I., Meleg I., Fekete S., Romvari R. Studies on the energy content of pigeon feeds I. Determination of digestibility and metabolizable energy content. Poult. Sci. 1999;78:1757–1762. doi: 10.1093/ps/78.12.1757. [DOI] [PubMed] [Google Scholar]
- Jahanian R., Rasouli E. Chemical composition, amino acid profile and metabolizable energy value of pasta refusals, and its application in broiler diets in response to feed enzyme. Anim. Feed Sci. Technol. 2014;188:111–125. [Google Scholar]
- Janssen W. 3 edn. Spelderholt Centre for Poultry Research and Information Services; Beekbergen, The Netherlands: 1989. European Table of Energy Values for Poultry Feedstuffs. [Google Scholar]
- Jie Y.-Z., Zhang J.-Y., Zhao L.-H., Ma Q.-G., Ji C. The correlationship between the metabolizable energy content, chemical composition and color score in different sources of corn DDGS. J. Anim. Sci. Biotechnol. 2013;4:38. doi: 10.1186/2049-1891-4-38. [DOI] [PMC free article] [PubMed] [Google Scholar]
- Jiménez-Moreno E., González-Alvarado J., Lázaro R., Mateos G. Effects of type of cereal, heat processing of the cereal, and fiber inclusion in the diet on gizzard pH and nutrient utilization in broilers at different ages. Poult. Sci. 2009;88:1925–1933. doi: 10.3382/ps.2009-00193. [DOI] [PubMed] [Google Scholar]
- Johnson R.J. Proc. Recent Adv. Anim. Nutr. Aust., Armdiale, NSW, Australia. 1987. Metabolisable energy: recent research with poultry; pp. 228–243. [Google Scholar]
- Karakas P., Versteegh H.A.J., van der Honing Y., Kogut J., Jongbloed A.W. Nutritive value of the meat and bone meals from cattle or pigs in broiler diets. Poult. Sci. 2001;80:1180–1189. doi: 10.1093/ps/80.8.1180. [DOI] [PubMed] [Google Scholar]
- Kerr B.J., Dozier W.A., Shurson G.C. Lipid digestibility and energy content of distillers' corn oil in swine and poultry. J. Anim. Sci. 2016;94:2900–2908. doi: 10.2527/jas.2016-0440. [DOI] [PubMed] [Google Scholar]
- Kianfar R., Alahyari-Shahrasb M., Moravej H., Kim W.K. Comparative apparent metabolizable energy values of soaking, fermentation with lactobacillus and enzyme treatment of barley in cockerels and quails. J. Food Process. Preserv. 2013;37:1060–1067. [Google Scholar]
- King D., Ragland D., Adeola O. Apparent and true metabolizable energy values of feedstuffs for ducks. Poult. Sci. 1997;76:1418–1423. doi: 10.1093/ps/76.10.1418. [DOI] [PubMed] [Google Scholar]
- Kong C., Adeola O. Apparent ileal digestibility of amino acids in feedstuffs for White Pekin ducks. Poult. Sci. 2010;89:545–550. doi: 10.3382/ps.2009-00485. [DOI] [PubMed] [Google Scholar]
- Kozlowski K., Mikulski D., Rogiewicz A., Zdunczyk Z., Rad-Spice M., Jeroch H., Jankowski J., Slominski B.A. Yellow-seeded B. napus and B. juncea canola. Part 2. Nutritive value of the meal for turkeys. Anim. Feed Sci. Technol. 2018;240:102–116. [Google Scholar]
- Lammers P.J., Kerr B.J., Honeyman M.S., Stalder K., Dozier W.A., Weber T.E., Kidd M.T., Bregendahl K. Nitrogen-corrected apparent metabolizable energy value of crude glycerol for laying hens. Poult. Sci. 2008;87:104–107. doi: 10.3382/ps.2007-00255. [DOI] [PubMed] [Google Scholar]
- Latshaw J., Freeland K. Metabolizable energy values determined with intact and cecectomized roosters. Poult. Sci. 2008;87:101–103. doi: 10.3382/ps.2007-00127. [DOI] [PubMed] [Google Scholar]
- Leeson S., Boorman K., Lewis D., Shrimpton D. Metabolisable energy studies with turkeys: metabolisable energy of dietary ingredients. Br. Poult. Sci. 1974;15:183–189. [Google Scholar]
- Lima E., Rodrigues P., Alvarenga R., Bernardino V., Makiyama L., Lima R., Cantarelli V., Zangerônimo M. The energy value of biodiesel glycerine products fed to broilers at different ages. J. Anim. Physiol. Anim. Nutr. 2013;97:896–903. doi: 10.1111/j.1439-0396.2012.01335.x. [DOI] [PubMed] [Google Scholar]
- Lin M.J., Chiou P.W.S., Chang S.C., Croom J., Fan Y.K. Feeding value of high-oil corn for Taiwan country chicken. Asian-Australas. J. Anim. Sci. 2003;16:1348–1354. [Google Scholar]
- Lodhi G.N., Renner R., Clandinin D.R. Studies on the metabolizable energy of rapeseed meal for growing chickens and laying hens. Poult. Sci. 1969;48:964–970. doi: 10.3382/ps.0480964. [DOI] [PubMed] [Google Scholar]
- Lopez G., Leeson S. Relevance of nitrogen correction for assessment of metabolizable energy with broilers to forty-nine days of age. Poult. Sci. 2007;86:1696–1704. doi: 10.1093/ps/86.8.1696. [DOI] [PubMed] [Google Scholar]
- Lopez G., Leeson S. Assessment of the nitrogen correction factor in evaluating metabolizable energy of corn and soybean meal in diets for broilers. Poult. Sci. 2008;87:298–306. doi: 10.3382/ps.2007-00276. [DOI] [PubMed] [Google Scholar]
- MacLeod M.G., Valentine J., Cowan A., Wade A., McNeill L., Bernard K. Naked oats: metabolisable energy yield from a range of varieties in broilers, cockerels and turkeys. Br. Poult. Sci. 2008;49:368–377. doi: 10.1080/00071660802094164. [DOI] [PubMed] [Google Scholar]
- Mandal A.B., Tyagi P.K., Elangovan A.V., Tyagi P.K., Kaur S., Johri A.K. Comparative apparent metabolisable ener values of high, medium and low tannin varieties of sorghum in cockerel, guinea fowl and quail. Br. Poult. Sci. 2006;47:336–341. doi: 10.1080/00071660600741875. [DOI] [PubMed] [Google Scholar]
- Mateos G.G., Cámara L., Fondevila G., Lázaro R.P. Critical review of the procedures used for estimation of the energy content of diets and ingredients in poultry. J. Appl. Poult. Res. 2018;28:506–525. [Google Scholar]
- Mateos G., Sell J. True and apparent metabolizable energy value of fat for laying hens: influence of level of use. Poult. Sci. 1980;59:369–373. doi: 10.3382/ps.0590369. [DOI] [PubMed] [Google Scholar]
- McCracken K.J., Owens B., Park R., McNab J. Lack of relationship between either specific weight or presence of the 1B1R gene and nutritive value of wheat in broiler diets. Br. Poult. Sci. 2008;49:463–474. doi: 10.1080/00071660802158365. [DOI] [PubMed] [Google Scholar]
- McNab J. Energy supply to poultry. J. Exp. Zool. Part A: Ecol. Genet. Physiol. 1999;283:377–386. [Google Scholar]
- McNab J., Blair J. Modified assay for true and apparent metabolisable energy based on tube feeding. Br. Poult. Sci. 1988;29:697–707. doi: 10.1080/00071668808417098. [DOI] [PubMed] [Google Scholar]
- Mirghelenj S.A., Golian A., Kermanshahi H., Raji A.R. Nutritional value of wet extruded full-fat soybean and its effects on broiler chicken performance. J. Appl. Poult. Res. 2013;22:410–422. [Google Scholar]
- Mitchell H., Haines W. The basal metabolism of mature chickens and the net energy value of corn. J. Agricult. Res. 1927;34:927–943. [Google Scholar]
- Moghaddam H.N., Salari S., Arshami J., Golian A., Maleki M. Evaluation of the nutritional value of sunflower meal and its effect on performance, digestive enzyme activity, organ weight, and histological alterations of the intestinal villi of broiler chickens. J. Appl. Poult. Res. 2012;21:293–304. [Google Scholar]
- Mollah Y., Bryden W., Wallis I., Balnave D., Annison E. Studies on low metabolisable energy wheats for poultry using conventional and rapid assay procedures and the effects of processing. Br. Poult. Sci. 1983;24:81–89. [Google Scholar]
- Nalle C.L., Ravindran V., Ravindran G. Nutritional value of narrow-leafed lupin (Lupinus angustifolius) for broilers. Br. Poult. Sci. 2011;52:775–781. doi: 10.1080/00071668.2011.639343. [DOI] [PubMed] [Google Scholar]
- Nalle C.L., Ravindran V., Ravindran G. Nutritional value of peas (Pisum sativum L.) for broilers: apparent metabolisable energy, apparent ileal amino acid digestibility and production performance. Anim. Prod. Sci. 2011;51:150–155. doi: 10.1017/S1751731111001686. [DOI] [PubMed] [Google Scholar]
- Nalle C.L., Ravindran V., Ravindran G. Nutritional value of white lupins (Lupinus albus) for broilers: apparent metabolisable energy, apparent ileal amino acid digestibility and production performance. Animal. 2012;6:579–585. doi: 10.1017/S1751731111001686. [DOI] [PubMed] [Google Scholar]
- Newkirk R.W., Classen H.L., Tyler R.T. Nutritional evaluation of low glucosinolate mustard meals (Brassica juncea) in broiler diets. Poult. Sci. 1997;76:1272–1277. doi: 10.1093/ps/76.9.1272. [DOI] [PubMed] [Google Scholar]
- Noblet J., Dubois S., Labussiere E., Carre B., Milgen J.V. Metabolic utilization of energy in monogastric animals and its implementation in net energy systems. EAAP Sci. 2010;127:573–582. [Google Scholar]
- Noblet J., Fortune H., Dupire C., Dubois S. Digestible, metabolizable and net energy values of 13 feedstuffs for growing pigs: effect of energy system. Anim. Feed Sci. Technol. 1993;42:131–149. [Google Scholar]
- Noblet J., Fortune H., Shi X., Dubois S. Prediction of net energy value of feeds for growing pigs. J. Anim. Sci. 1994;72:344–354. doi: 10.2527/1994.722344x. [DOI] [PubMed] [Google Scholar]
- NRC . National Academies Press; Washington, D.C.: 1994. Nutrient Requirements of Poultry. [Google Scholar]
- Olukosi O.A., Adeola O. Estimation of the metabolizable energy content of meat and bone meal for swine. J. Anim. Sci. 2009;87:2590–2599. doi: 10.2527/jas.2009-1775. [DOI] [PubMed] [Google Scholar]
- Olukosi O.A., Adedokun S.A., Agboola J.O. Species-dependent response to the influence of adaptation length during assay for metabolisable energy of cereal grains employing the difference method. Anim. Feed Sci. Technol. 2017;231:111–118. [Google Scholar]
- Palander S., Laurinen P., Perttila S., Valaja J., Partanen K. Protein and amino acid digestibility and metabolizable energy value of pea (Pisum sativum), faba bean (Vicia faba) and lupin (Lupinus angustifolius) seeds for turkeys of different age. Anim. Feed Sci. Technol. 2006;127:89–100. [Google Scholar]
- Pasquetti T.J., Pozza P.C., Furlan A.C., Castilha L.D., Diaz-Huepa L.M., Fachinello M.R., Marcato S.M., Tanamati W. Adjustment of equations to predict the metabolizable energy of corn for meat type quails. Semin.-Cienc. Agrar. 2015;36:2861–2870. [Google Scholar]
- Pekel A.Y., Kim J.I., Chapple C., Adeola O. Nutritional characteristics of camelina meal for 3-week-old broiler chickens. Poult. Sci. 2015;94:371–378. doi: 10.3382/ps/peu066. [DOI] [PubMed] [Google Scholar]
- Pesti G., Edwards H., Jr Metabolizable energy nomenclature for poultry feedstuffs. Poult. Sci. 1983;62:1275–1280. [Google Scholar]
- Pirgozliev V.R., Rose S.P., Kettlewell P.S. Effect of ambient storage of wheat samples on their nutritive value for chickens. Br. Poult. Sci. 2006;47:342–349. doi: 10.1080/00071660600741750. [DOI] [PubMed] [Google Scholar]
- Potter L., Matterson L., Arnold A., Pudelkiewicz W., Singsen E. Studies in evaluating energy content of feeds for the chick I. the evaluation of the metabolizable energy and productive energy of alpha cellulose. Poult. Sci. 1960;39:1166–1178. [Google Scholar]
- Proudman J., Mellen W., Anderson D. Utilization of feed in fast-and slow-growing lines of chickens. Poult. Sci. 1970;49:961–972. doi: 10.3382/ps.0541585. [DOI] [PubMed] [Google Scholar]
- Ravindran V., Selle P.H., Bryden W.L. Effects of phytase supplementation, individually and in combination, with glycanase, an the nutritive value of wheat and barley. Poult. Sci. 1999;78:1588–1595. doi: 10.1093/ps/78.11.1588. [DOI] [PubMed] [Google Scholar]
- Ravindran V., Tancharoenrat P., Zaefarian F., Ravindran G. Fats in poultry nutrition: digestive physiology and factors influencing their utilisation. Anim. Feed Sci. Technol. 2016;213:1–21. [Google Scholar]
- Ravindran V., Wu Y.B., Hendriks W.H. Effects of sex and dietary phosphorus level on the apparent metabolizable energy and nutrient digestibility in broiler chickens. Arch. Anim. Nutr. 2004;58:405–411. doi: 10.1080/00039420400008582. [DOI] [PubMed] [Google Scholar]
- Rodriguez M.L., Ortiz L.T., Alzueta C., Rebole A., Trevino J. Nutritive value of high-oleic acid sunflower seed for broiler chickens. Poult. Sci. 2005;84:395–402. doi: 10.1093/ps/84.3.395. [DOI] [PubMed] [Google Scholar]
- Rodriguez M.L., Ortiz L.T., Trevino J., Rebole A., Alzueta C., Centeno C. Studies on the nutritive value of full-fat sunflower seed in broiler chick diets. Anim. Feed Sci. Technol. 1998;71:341–349. [Google Scholar]
- Rostagno H.S. 4 edn. UFV-MG; Brazil: 2017. Brazilian Tables for Poultry and Swine. [Google Scholar]
- Sahraei M., Janmohammadi H., Lashkari S., Torkamani M.D., Gituee A. Evaluation of protein quality in hydrolyzed protein meals by biological assay methods in broiler chickens. Int. J. Agric. Res. Rev. 2012;2:352–356. [Google Scholar]
- Saki A.A., Ranjbari T., Tabatabaei M.M., Ahmadi A., Aflaki F., Rabani M., Abbasinezhad M., Mahmoudi H. Composition of metabolic energy value and amino acid digestibility of wheat, wheat screening and barley between ileum and faces of broiler chicken. J. Poult. Sci. 2009;46:188–192. [Google Scholar]
- Salari S., Moghaddam H.N., Arshami J., Golian A. Nutritional evaluation of full-fat sunflower seed for broiler chickens. Asian-Australas. J. Anim. Sci. 2009;22:557–564. [Google Scholar]
- Sales J., Janssens G.P.J. Methods to determine metabolizable energy and digestibility of feed ingredients in the domestic pigeon (Columba livia domestica) Poult. Sci. 2003;82:1457–1461. doi: 10.1093/ps/82.9.1457. [DOI] [PubMed] [Google Scholar]
- Sauvant D., Perez J., Tran G. Wagening Academic Publishers; Wageningen, the Netherlands: 2004. Tables of Composition and Nutritional Value of Feed Materials: Pig, Poultry, Sheep, Goats, Rabbits, Horses, and Fish. [Google Scholar]
- Scott T.A., Silversides F.G., Classen H.L., Swift M.L., Bedford M.R., Hall J.W. A broiler chick bioassay for measuring the feeding value of wheat and barley in complete diets. Poult. Sci. 1998;77:449–455. doi: 10.1093/ps/77.3.449. [DOI] [PubMed] [Google Scholar]
- Sell J., Jin S., Jeffrey M. Metabolizable energy value of conjugated linoleic acid for broiler chicks and laying hens. Poult. Sci. 2001;80:209–214. doi: 10.1093/ps/80.2.209. [DOI] [PubMed] [Google Scholar]
- Seyedi A.H., Janmohamady H., Hosseinkhani A., Shakouri M.D. Using complete diet and Sibbald methods to determine the metabolizable energy of 5 Iranian wheat varieties. J. Appl. Poult. Res. 2013;22:388–395. [Google Scholar]
- Shannon D., Brown W. A calorimetric estimate of the efficiency of utilisation of dietary energy by the growing cockerel. Br. Poult. Sci. 1970;11:1–6. doi: 10.1080/00071667008415787. [DOI] [PubMed] [Google Scholar]
- Sibbald I. The effect of level of feed intake on metabolizable energy values measured with adult roosters. Poult. Sci. 1975;54:1990–1997. doi: 10.3382/ps.0541990. [DOI] [PubMed] [Google Scholar]
- Sibbald I.R. A bioassay for true metabolizable energy in feedingstuffs. Poult. Sci. 1976;55:303–308. doi: 10.3382/ps.0550303. [DOI] [PubMed] [Google Scholar]
- Sibbald I.R., Morse P.M. Effects of the nitrogen correction and of feed intake on true metabolizable energy values. Poult. Sci. 1983;62:138–142. [Google Scholar]
- Sibbald I., Summers J., Slinger S. Factors affecting the metabolizable energy content of poultry feeds. Poult. Sci. 1960;39:544–556. [Google Scholar]
- Sibbald I., Wolynetz M. Relationships between estimates of bioavailable energy made with adult cockerels and chicks: effects of feed intake and nitrogen retention. Poult. Sci. 1985;64:127–138. [Google Scholar]
- Sibbald I.R., Wolynetz M.S. True and apparent metabolisable energy. Br. Poult. Sci. 1987;28:782–784. doi: 10.1080/00071668708417017. [DOI] [PubMed] [Google Scholar]
- Smulikowska S. A simple in vitro test for evaluation of the usefulness of industrial enzymes as additives to broiler diet based on rye. J. Anim. Feed Sci. 1992;1:65–70. [Google Scholar]
- Swick R.A., Wu S.-B., Zuo J., Rodgers N., Barekatain M.R., Choct M. Implications and development of a net energy system for broilers. Anim. Product. Sci. 2013;53:1231–1237. [Google Scholar]
- Tancharoenrat P., Ravindran V., Zaefarian F., Ravindran G. Influence of age on the apparent metabolisable energy and total tract apparent fat digestibility of different fat sources for broiler chickens. Anim. Feed Sci. Technol. 2013;186:186–192. [Google Scholar]
- ten Doeschate R., Scheele C., Schreurs V., Van Der Klis J. Digestibility studies in broiler chickens: influence of genotype, age, sex and method of determination. Br. Poult. Sci. 1993;34:131–146. [Google Scholar]
- Titus H.W. Energy values of feedstuffs for poultry. In: Titus H.W., editor. The Scientific Feeding of Chickens. The Interstate Printers and Publishers, Inc.; Danville, Ill: 1955. pp. 245–267. [Google Scholar]
- Titus H.W., Mehring A.L., Jr, Johnson D., Jr, Nesbitt L.L., Tomas T. An evaluation of MCF (Micro-Cel-Fat), a new type of fat product. Poult. Sci. 1959;38:1114–1119. [Google Scholar]
- Toghyani M., Rodgers N., Barekatain M.R., Iji P.A., Swick R.A. Apparent metabolizable energy value of expeller-extracted canola meal subjected to different processing conditions for growing broiler chickens. Poult. Sci. 2014;93:2227–2236. doi: 10.3382/ps.2013-03790. [DOI] [PubMed] [Google Scholar]
- Toghyani M., Swick R.A., Barekatain R. Effect of seed source and pelleting temperature during steam pelleting on apparent metabolizable energy value of full-fat canola seed for broiler chickens. Poult. Sci. 2017;96:1325–1333. doi: 10.3382/ps/pew401. [DOI] [PubMed] [Google Scholar]
- Tshovhote N.J., Nesamvuni A.E., Raphulu T., Gous R.M. The chemical composition, energy and amino acid digestibility of cowpeas used in poultry nutrition. South Afr. J. Anim. Sci. 2003;33:65–69. [Google Scholar]
- Tyagi P.K., Shrivastav A.K., Mandal A.B., Tyagi P.K., Elangovan A.V., Deo C. The apparent metabolizable energy and feeding value of quality protein maize for broiler chicken. Indian J. Poult. Sci. 2008;43:169–174. [Google Scholar]
- Valdes E.V., Leeson S. Near-infrared reflectance analysis as a method to measure metabolizable energy in complete poultry feeds. Poult. Sci. 1992;71:1179–1187. doi: 10.3382/ps.0711493. [DOI] [PubMed] [Google Scholar]
- Valdes E., Leeson S. Measurement of metabolizable energy, gross energy, and moisture in feed grade fats by near infrared reflectance spectroscopy. Poult. Sci. 1994;73:163–171. [Google Scholar]
- Villamide M.J., Fuente J.M., deAyala P.P., Flores A. Energy evaluation of eight barley cultivars for poultry: Effect of dietary enzyme addition. Poult. Sci. 1997;76:834–840. doi: 10.1093/ps/76.6.834. [DOI] [PubMed] [Google Scholar]
- Waititu S.M., Kim J.W., Sanjayan N., Leterme P., Nyachoti C.M. Metabolizable energy and standardized ileal digestible amino acid contents of a high protein sunflower meal fed to broiler chicks. Can. J. Anim. Sci. 2018;98:517–524. [Google Scholar]
- Wang C., Gao G.L., Huang J.X., Zhang K.S., Zhong H., Wang H.W., Su J., Xie M., Wang Q.G. Nutritive value of dry citrus pulp and its effect on performance in geese from 35 to 70 days of age. J. Appl. Poult. Res. 2017;26:253–259. [Google Scholar]
- Wang C., Yang F., Wang Q., Zhou X., Xie M., Kang P., Wang Y., Peng X. Nutritive value of mulberry leaf meal and its effect on the performance of 35-70-day-old geese. J. Poult. Sci. 2017;54:41–46. doi: 10.2141/jpsa.0160070. [DOI] [PMC free article] [PubMed] [Google Scholar]
- Ward A.T., Marquardt R.R. The effect of saturation, chain length of pure triglycerides, and age of bird on the utilization of rye diets. Poult. Sci. 1983;62:1054–1062. doi: 10.3382/ps.0621054. [DOI] [PubMed] [Google Scholar]
- Wiseman J. Correlation between physical measurements and dietary energy values of wheat for poultry and pigs. Anim. Feed Sci. Technol. 2000;84:1–11. [Google Scholar]
- Woyengo T.A., Kiarie E., Nyachoti C.M. Metabolizable energy and standardized ileal digestible amino acid contents of expeller-extracted canola meal fed to broiler chicks. Poult. Sci. 2010;89:1182–1189. doi: 10.3382/ps.2009-00595. [DOI] [PubMed] [Google Scholar]
- Wu S.-B., Swick R., Noblet J., Rodgers N., Cadogan D., Choct M. Net energy prediction and energy efficiency of feed for broiler chickens. Poult. Sci. 2019;98:1222–1234. doi: 10.3382/ps/pey442. (In press). [DOI] [PubMed] [Google Scholar]
- Yaghobfar A., Boldaji F. Influence of level of feed input and procedure on metabolisable energy and endogenous energy loss (EEL) with adult cockerels. Br. Poult. Sci. 2002;43:696–704. doi: 10.1080/0007166021000025091. [DOI] [PubMed] [Google Scholar]
- Yegani M., Swift M.L., Zijlstra R.T., Korvera D.R. Prediction of energetic value of wheat and triticale in broiler chicks: A chick bioassay and an in vitro digestibility technique. Anim. Feed Sci. Technol. 2013;183:40–50. [Google Scholar]
- Young L., Ashton G., Smith G. Estimating the energy value of some feeds for pigs using regression equations. J. Anim. Sci. 1977;44:765–771. [Google Scholar]
- Zelenka J. Effects of sex, age and food intake upon metabolisable energy values in broiler chickens. Br. Poult. Sci. 1997;38:281–284. doi: 10.1080/00071669708417987. [DOI] [PubMed] [Google Scholar]
- Zhao F., Ren L.Q., Mi B.M., Tan H.Z., Zhao J.T., Li H., Zhang H.F., Zhang Z.Y. Developing a computer-controlled simulated digestion system to predict the concentration of metabolizable energy of feedstuffs for rooster. J. Anim. Sci. 2014;92:1537–1547. doi: 10.2527/jas.2013-6636. [DOI] [PubMed] [Google Scholar]
- Zhao F., Zhang H.F., Hou S.S., Zhang Z.Y. Predicting metabolizable energy of normal corn from its chemical composition in adult pekin ducks. Poult. Sci. 2008;87:1603–1608. doi: 10.3382/ps.2007-00494. [DOI] [PubMed] [Google Scholar]
- Zuber T., Rodehutscord M. Variability in amino acid digestibility and metabolizable energy of corn studied in cecectomized laying hens. Poult. Sci. 2017;96:1696–1706. doi: 10.3382/ps/pew429. [DOI] [PubMed] [Google Scholar]