

Abstract
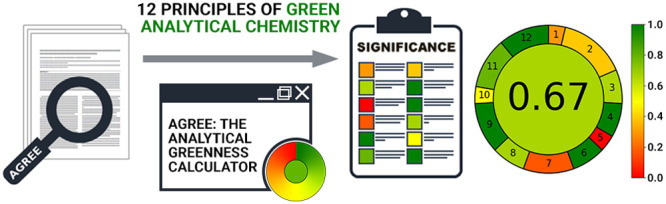
Green analytical chemistry focuses on making analytical procedures more environmentally benign and safer to humans. The amounts and toxicity of reagents, generated waste, energy requirements, the number of procedural steps, miniaturization, and automation are just a few of the multitude of criteria considered when assessing an analytical methodology’s greenness. The use of greenness assessment criteria requires dedicated tools. We propose the Analytical GREEnness calculator, a comprehensive, flexible, and straightforward assessment approach that provides an easily interpretable and informative result. The assessment criteria are taken from the 12 principles of green analytical chemistry (SIGNIFICANCE) and are transformed into a unified 0–1 scale. The final score is calculated based on the SIGNIFICANCE principles. The result is a pictogram indicating the final score, performance of the analytical procedure in each criterion, and weights assigned by the user. Freely available software makes the assessment procedure straightforward. It is open-source and downloadable from https://mostwiedzy.pl/AGREE.
Green analytical chemistry (GAC) is the concept that makes analytical chemists consider the environmental, health, and safety issues during their activities.1 The greenness of analytical procedures is a multivariate, complex parameter that is not easily quantifiable.2 While green chemistry metric systems, mainly applied in chemical synthesis, usually refer to the mass of the product, this is not a viable approach in the case of analytical chemistry, where there is no obvious product with a particular mass.3 Therefore, it is clear that GAC requires dedicated metrics to measure the degree of greenness of analytical methodologies.
Several approaches to GAC metrics have been developed so far. The first reported approach, named the National Environmental Methods Index (NEMI),4 is a metric system based on a simple pictogram, divided into four parts, each of them reflecting a different criterion (generation of waste, reagents that are persistent, bioaccumulative, or toxic, whether reagents are hazardous, whether the conditions are corrosive). These criteria are considered in a binary way: if a value of a criterion is met, the respective part of the pictogram is filled in with green color; otherwise, it remains uncolored. Another metric system, called the Analytical Eco-Scale,5 was subsequently proposed. The Analytical Eco-Scale is based on assigning penalty points to each aspect that decreases the procedure’s greenness. Points for toxic reagents, waste generation, or high energetic demand are subtracted from base 100, and based on the number of remaining points, the user can determine whether the procedure is ideally green, acceptable or not. The use of multicriteria decision analysis (MCDA) allows ranking available analytical procedures according to many assessment criteria at the same time. If these criteria refer to GAC, then MCDA can be considered a GAC metric tool and has been successfully applied for this purpose.6 The Green Analytical Procedures Index has been developed as another metric system7 which, similarly to NEMI, is based on a pictogram. However, it considers more criteria than NEMI and utilizes a three-grade scale, based on a traffic light color scheme. The latest metric system is the RGB additive color model8 that includes not only greenness criteria (green color) but also analytical performance (red color) and productivity (blue color). The result is easy to interpret, as it is the combination of colors that depends on the performance in each category.
Each of above-described metric systems is characterized by their advantages and, probably more importantly, disadvantages. The main disadvantages are the inclusion of only a few assessment criteria and their treatment as noncontinuous functions. In fact, none of the above-mentioned metric systems evaluates analytical procedures considering each of the 12 principles of GAC. The results do not always contain information about the structure of hazards or give too general information about the assessed analytical procedure. Therefore, the aim of this study is to develop a comprehensive, user-friendly, informative, and sensitive metric tool for assessment of analytical procedures from the GAC point of view.
General Requirements of a Metric System
The metric system for the assessment of an analytical procedure’s greenness must be characterized by several features:
Comprehensiveness of Input
As greenness is not easily defined and assessed, the metric system should include numerous aspects. SIGNIFICANCE GAC principles comprehensively describe the analytical procedure’s greenness.9 To fully characterize greenness, input criteria should refer to material requirements (both quality and quantity), waste generation, energy consumption, the safety of the analyst, and the general approach to the analytical procedure, such as the number of pretreatment steps and location of the analytical device in relation to the object of investigation. It is important to note that input variables may be of different nature—binary, discrete, or continuous functions. The prevalence of the use of a particular metric is also an important factor, and it can be more easily achieved if it encompasses a wide range of possible scenarios. This makes it easier to compare vastly different procedures, even if not all of the criteria are relevant to the assessed method.
Flexibility of Input Importance
Not all assessment criteria have to be of equal importance. For some analytical applications, it is crucial to ensure simplicity, whereas, for others, the main focus should be on minimizing the use of reagents and generation of wastes. Therefore, the possibility to assign weights to criteria based on their importance in a given scenario is highly desirable.
Simplicity of Output
The assessment result should be very easily readable, as is the case with NEMI pictograms. It should be noted that the simplicity of output runs counter to the need to include many assessment variables.
Clarity of Output
Apart from output simplicity, it is crucial to allow the user to read the information on the structure of threats or poor/good performance of the procedure in each assessment criterion. The output of the analysis should also reflect all of the assumptions made on the weights applied to differentiate between criteria importance.
To meet the above-described requirements, we propose a novel metric system. The input criteria refer to the 12 SIGNIFICANCE principles and can be assigned different weights that allow for a certain flexibility. Each of the 12 input variables is transformed into a common scale in 0–1 range, as described in the Principles of Green Analytical Chemistry section. The final assessment result is the product of the assessment results for each principle. The output is a clock-like graph, with the overall score and color representation in the middle (see Figure 1). The performance of the procedure in each principle is reflected with the intuitive red-yellow-green color scale, while the weight of each principle is reflected with the width of its corresponding segment. The assessment can be easily performed using user-friendly software, with an automatically generated graph and an assessment report. The software documentation is provided in Supporting Information S1.
Figure 1.
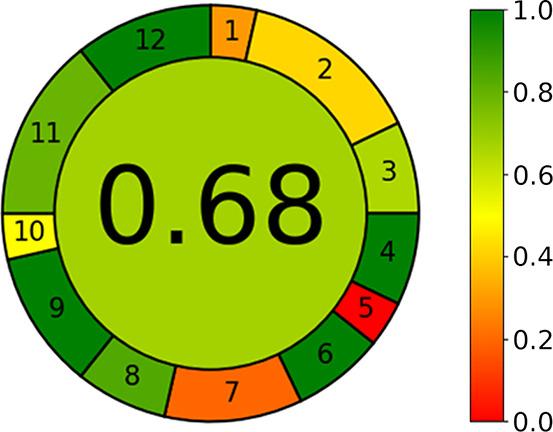
Generic result of assessment (left) and the corresponding color scale for reference (right).
The overall score is shown in the middle of the pictogram with values close to 1 and dark green color indicating that the assessed procedure is greener. The performance of the procedure in each of the assessment criteria is reflected by the color in the segment with the number corresponding to each criterion. In the case of the example shown in Figure 1, the scores corresponding to GAC principles 1, 5, and 7 are quite low, while, in the case of principles 4, 6, 9, and 12, the performance is excellent. Another important piece of information that can be easily read from the pictogram is that the user has set very high weights to criteria 2 and 11, higher weights to criteria 7 and 9, and low weights to criteria 1, 5, and 10.
Other criteria that do not refer to greenness have been deliberately not introduced into the assessment procedure. For an analytical procedure to be applicable, it has to be validated, and so parameters such as the limit of detection, precision, accuracy, and linearity range have to be characterized by acceptable values. In this sense, including metrological parameters seems to be pointless. Economic criteria, such as the cost of reagents or the cost of analytical equipment, are also not explicitly included, even though the analytical throughput, an aspect somewhat related to the economy, is considered in the eighth GAC principle.
Principles of Green Analytical Chemistry
With the aim of comprehensively evaluating the greenness of analytical methodologies, we have converted each of the 12 principles of GAC into scores. In this section, we provide a detailed description of GAC principles and how GAC principles have been converted into scores. A summary of transformations applied to every principle is presented in graphical form in Figure 2.
Figure 2.

Graphical representation of the functions applied to convert the variables to scores in the 0–1 scale.
Principle 1. Direct Analytical Techniques Should Be Applied to Avoid Sample Treatment
The first principle of GAC states that direct analytical techniques should be applied to avoid sample treatment. In fact, avoiding sample treatment and sample preparation steps can drastically reduce the environmental, health, and safety issues associated with a given methodology. Direct analysis is, however, not always possible, since the samples should be in an appropriate state of matter and higher sensitivity and/or selectivity may be required. Different greenness levels can be differentiated according to this principle, as shown in Table 1, from remote sensing without sampling damage (greenest alternative) to multistep methods involving sample pretreatment and batch analysis (least green alternative).10 A scoring system was selected to convert the principle in a numerical value taking into account the wide acceptability of on-line analysis as a green approach. Additionally, in the case of external sample pretreatment, the number of sample preparation steps required prior to analysis was considered to differentiate between procedures on the basis of their complexity.
Table 1. Sample Pretreatment Activities and Their Respective Scores.
| sample pretreatment activities | score |
|---|---|
| remote sensing without sample damage | 1.00 |
| remote sensing with little physical damage | 0.95 |
| noninvasive analysis | 0.90 |
| in-field sampling and direct analysis | 0.85 |
| in-field sampling and on-line analysis | 0.78 |
| on-line analysis | 0.70 |
| at-line analysis | 0.60 |
| off-line analysis | 0.48 |
| external sample pre- and treatment and batch analysis (reduced number of steps) | 0.30 |
| external sample pre- and treatment and batch analysis (large number of steps) | 0.00 |
Principle 2. Minimal Sample Size and Minimal Number of Samples Are Goals
According to the second principle of GAC, a minimal sample size and a minimal number of samples are goals. As stated elsewhere,9 the number of samples to be analyzed can be reduced by using statistics for the selection of sampling sites or noninvasive methods for field screening followed by a more detailed analysis. In a more general and inclusive sense, the use of rapid and low-cost vanguard analytical strategies minimizes the number of samples to be analyzed by a rearguard analytical technique.11 Regarding sample size, the advances in miniaturization of analytical systems have enabled chemical analysis to be carried out with almost negligible sample consumption. It should be highlighted, however, that the reduction of both the number of samples to be analyzed and the sample size needed for analysis must not jeopardize sample representativeness.
In order to convert the second principle into a metric, the above aspects and the classification of (bio)chemical analyses according to initial sample size are considered.12 The equation to transform the mass (in grams) or volume (in milliliters) of sample to score is as follows:
| 1 |
As a result, as is shown in Table 2, ultramicroanalysis, microanalysis, and semimicroanalysis are scored as ideal analyses, while macroanalysis is assessed according to eq 1. A sample amount of 100 mg (or μL) is, in the authors’ opinion, small enough to be assessed as green.
Table 2. Scoring Based on the Sample Size.
Principle 3. In Situ Measurements Should Be Performed
The third principle of GAC aims at the determination of target analytes as direct as possible. From the GAC point of view, it is important to locate the device close to the measurement location, since in such a case the time between two analyses is short and the time delay between sample collection and obtaining relevant analytical information is also short. In this sense, field-portable instruments and miniaturized analytical systems show high promise for greening chemical analyses.13,14 Besides, the possibility of performing in situ measurements brings about a number of additional benefits, including the possibility of performing chemical analysis with little or no sample pretreatment, with increased safety for the operator, while minimizing reagents consumption (e.g., sample preservation is avoided and, therefore, preservation agents are not needed). Therefore, the location of the analytical device with respect to the object of investigation is considered within this principle, as shown in Table 3. Concretely, four possibilities, namely, off-line, at-line, on-line, and in-line, have been considered as input data to assess the third principle of GAC.
Table 3. Transformation of the Location of the Analytical Device toward the Investigated Object to Numerical Scores.
| input data | score |
|---|---|
| in-line | 1.00 |
| on-line | 0.66 |
| at-line | 0.33 |
| off-line | 0.00 |
Principle 4. Integration of Analytical Processes and Operations Saves Energy and Reduces the Use of Reagents
A number of unitary steps are commonly performed during chemical analysis, especially when dealing with the analysis of samples of moderate to high complexity. Decreasing the number of analytical steps to the extent possible results in material, energy, and time savings. Significant efforts have been made toward the integration of analytical steps. Particularly worthy of mention is the integration of analytical processes and operations such as the simultaneous performance of derivatization with extraction or chromatographic determination (as pre- or post-column derivatization), or sampling with preconcentration by the application of passive sampling or sorption tubes. In order to assess the greenness of an analytical method according to the fourth principle of GAC, a score of 1.0 was set for procedures involving three or fewer steps, while, for four, five, six, seven, and eight or more steps, the scores were set at 0.8, 0.6, 0.4, 0.2, and 0, respectively.
Principle 5. Automated and Miniaturized Methods Should Be Selected
Both automation and miniaturization of analytical methods bring beneficial consequences for GAC, as miniaturized methods require less reagents, solvents, and energy. Automation of analytical procedures results in lower occupational exposure, especially toward vapors of solvents, and the risk of accidents is also reduced. The transformation of miniaturization and automation levels into scores is shown in Table 4.
Table 4. Transformation of the Level of Automation and Miniaturization of the Sample Preparation Step into Numerical Values.
| level of automation and miniaturization | score |
|---|---|
| automatic, miniaturized | 1.0 |
| semi-automatic, miniaturized | 0.75 |
| manual, miniaturized | 0.5 |
| automatic, not miniaturized | 0.5 |
| semi-automatic, not miniaturized | 0.25 |
| manual, not miniaturized | 0.0 |
Principle 6. Derivatization Should Be Avoided
The application of derivatization agents is problematic from the GAC point of view, since it implies additional steps and further use of chemicals with subsequent waste generation and it usually negatively affects the sample throughput. The best option is, therefore, avoiding chemical derivatization. However, derivatization is commonly exploited in analytical chemistry, as microreactions can improve the extractability, analytical separation, and/or detection of target analytes.15 Depending on the derivatization agent’s nature, the level of hazard can be highly variable. To differentiate between derivatization agents, a previously developed derivatization agent selection guide is applied.16 Briefly, the sets of derivatization agents were treated with multicriteria decision analysis. As a result, each of the derivatization agents within each group, GC, LC, and chiral derivatization agents, was given a score between 0 and 1 (with 1 assigned to the greenest alternatives). The assessment criteria refer to the safety of application, environmental fate, environmental persistence, and biological effects. If no derivatization is applied, the score equal to 1 is given; otherwise, it is calculated according to the formula
| 2 |
where DAi is the score corresponding to the particular derivatization agent.
The following assumptions are given to assess the sixth GAC principle:
• The subtracted value 0.2 is to clearly differentiate between the situation where no derivatization agent is applied and the greenest of derivatization agents are applied. Otherwise, the greenest of derivatization agents would give the same score as no agent.
• If more than one derivatization agent is used in the analytical procedure, the most problematic (with the lowest score) will have the greatest impact on the overall score. Typically one derivatization agent is used, so situations in which more than one agent is applied are rare.
• If the derivatization agent is present in more than one list, the least favorable score is selected.
• The CAS number of the derivatization agent should be selected in the software. The corresponding score is then automatically included.
• When the calculated score is negative, it is instead set to 0.
Principle 7. Generation of a Large Volume of Analytical Waste Should Be Avoided and Proper Management of Analytical Waste Should Be Provided
Prevention of analytical waste generation would be ideal from an environmental and economic point of view. Unfortunately, analytical waste is produced in the vast majority of cases. While prevention should be the priority goal to comply with the seventh GAC principle, certain strategies have been proposed to minimize the generation of wastes and/or manage the analytical waste properly after analyte detection, including on-line decontamination, reuse or recycling of wastes, among others.17,18
In this work, the mass of waste is recalculated to score with eq 3:
| 3 |
The application of this equation results in a score equal to 1.0 for an amount of waste equal or lower to 0.1 g (mL), for 10 g (mL) the score is 0.4, and for the amount of waste equal to 25 and 100 g (mL) the scores are 0.25 and 0.1, respectively.
Such formulation allows noticing differences in waste generation between different miniaturized techniques, which are recently being widely developed. An important question should be asked: what material should be treated as waste? In this approach, it is suggested to include the mass or volume of
• liquid or solid reagents added to the sample
• solvents, acids, or bases applied
• all consumables and single-use devices, such as sorbents, cartridges, Pasteur pipettes, filters, etc.
• the mass or volume of the sample itself, if it is considered to be problematic—in contact with toxic, corrosive substances or the sample itself is of such nature
• When on-line decontamination, reuse, or recycling of wastes is performed, the amount of waste generated per sample is corrected accordingly.
Principle 8. Multianalyte or Multiparameter Methods Are Preferred versus Methods Using One Analyte at a Time
In this principle, the number of analytes that are determined in 1 h is considered. This is the result of multiplying the number of analytes determined in a single run by the analytical throughput, i.e., the number of consecutive samples that can be analyzed in 1 h. Let us consider two methodologies. The first is an analytical procedure for the determination of a single analyte with an analytical throughput equal to 10 h–1. The second is a procedure for the determination of 10 analytes with an analytical throughput equal to 1 h–1. Both examples give the result of the number of analytes determined in 1 h equal to 10. This number is the input data to eq 4 that is used for recalculation into 0–1 scale:
| 4 |
The transformation results in scores equal to 0.0, 0.5, 0.9, and 1.0 for 1, 10, 50, and 70 analytes determined during 1 h, respectively.
Principle 9. The Use of Energy Should Be Minimized
The evaluation of the energy consumed in sample preparation, analytical separation, and detection steps can be challenging and demanding. The energy consumed in chemical analyses was first considered for greenness assessment by Raynie and Driver19 and has been used with minimal or no modifications until recently. In this approach, a traffic light energy score calculation dependent on the total kWh per sample was proposed. In the present work, we have considered two possibilities for assessing power consumption. Thus, on the one hand, we have adapted and completed this approach for a general assessment of energy consumption per analysis, assigning the following scores to sample preparation techniques, analytical separation systems, and detectors:
• 1.0 score to analytical systems that consume <0.1 kWh per sample: Hot plate solvent evaporation (<10 min), rotary evaporation, needle evaporation, ultrasound-assisted extraction, solid-phase extraction, and microextraction techniques; ultraperformance liquid chromatography; titrations, immunoassays, microbiological assays, UV–vis spectrophotometry, Fourier transform infrared spectroscopy, energy dispersive X-ray fluorescence, potentiometry, and non-instrumental detection (e.g., smartphone-based analysis).
• 0.5 score to analytical systems that consume 0.1–1.5 kWh per sample: Hot plate solvent evaporation (10–150 min), accelerated solvent extraction, supercritical fluid extraction, microwave-assisted extraction, gas chromatography and liquid chromatography (with detectors different than mass spectrometry), flame atomic absorption spectrometry, electrothermal atomic absorption spectrometry, inductively coupled plasma-optical emission spectrometry, and mass spectrometry
• 0.0 score to analytical systems that consume >1.5 kWh per sample: Hot plate solvent evaporation (>150 min), Soxhlet extraction, gas chromatography–mass spectrometry, liquid chromatography–mass spectrometry; X-ray diffraction, and nuclear magnetic resonance.
The score values given to different analytical systems depend on the total power consumption per sample. Even though the actual power output of analytical instruments was estimated to be about 40% of the maximum listed by the manufacturers,20 the scores remain valid for comparative purposes.
It should be emphasized, however, that the advances in analytical instrumentation can have an important effect on the total power consumption, as was wisely mentioned in a recent contribution.20 Thus, whenever possible, energy consumption can be calculated more precisely by considering the power consumption mentioned in the technical specifications of analytical systems involved, the time required for a given analytical step (e.g., extraction time in solid-phase extraction, run time in liquid chromatography, etc.), and the number of samples processed. In this case, the score linearly increases between 0 and 1 by decreasing the power consumption per sample from 1.5 to 0.1 kWh. Although this approach can be more laborious, it would provide a more representative result, allowing differentiating, for example, the greenness profile of two different analytical methods involving the same analytical system as the overall energy consumption could vary significantly.
Principle 10. Reagents Obtained from Renewable Source Should Be Preferred
The use of chemicals derived from renewable resources is a highly promising and desirable approach not only in analytical chemistry but in all branches of chemistry. Regarding analytical methodologies, certain efforts have been made, mainly for isolation and detection of target compounds, and further advances are expected.21−23
The 10th GAC principle is treated in a straightforward way. If no reagents are applied or all are from bio-based sources, the score is 1. If some of them are derived from bio-based sources, while others are not, the score is 0.5. In case none of the reagents originates from bio-based sources, the score equals 0.
Principle 11. Toxic Reagents Should Be Eliminated or Replaced
The 11th GAC principle aims at the removal or replacement of toxic reagents by greener alternatives whenever possible. Apart from the type of chemicals used, the amount of toxic reagents or solvents used is also a critical issue. The first step to assess a given analytical methodology according to the 11th GAC principle is to indicate whether the assessed analytical procedure involves the application of any toxic reagents. If no toxic reagents are used, the score is equal to 1. Otherwise, the mass or volume of the reagent is transformed into the score according to eq 5.
| 5 |
It is suggested to consider any material as toxic if it is defined as toxic via inhalation, ingestion, dermal contact, or toxicity to aquatic life.
Principle 12. The Safety of the Operator Should Be Increased
To include the safety of the operator and environmental hazards, the number of threats that are not avoided is considered. The threats are related to the application of reagents, in which case material safety data sheets provide a clear indication, or to processes where expert knowledge can be used to assess the potential for hazardous exposure. The threats that are not avoided should be selected from the following list:
• toxic to aquatic life
• bioaccumulative
• persistent
• highly flammable
• highly oxidizable
• explosive
• corrosive
If no threats are selected, the score equals 1. If one, two, three, or four threats are present, the score is 0.8, 0.6, 0.4, and 0.2, respectively. If five or more threats are identified, then the score is equal to zero.
Case Studies
Finally, three case studies were conducted using AGREE to demonstrate its applicability and convenience. By default, equal weights have been set for all 12 principles evaluated, thus assuming that all assessment criteria are equally important. For comparison, three procedures for the determination of polybrominated diphenyl ethers (PBDEs) in soil samples are assessed with AGREE. The overall results of the analysis are presented in Figure 3.
Figure 3.
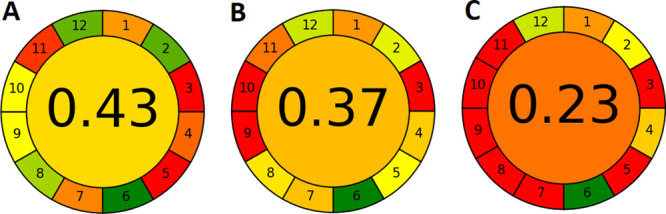
Results of AGREE analysis for SBSE-UAE-HPLC-UV (A),24 SE-HS-SPME-GC-MS/MS (B),25 and Soxhlet extraction with GC-MS (C).26
The first procedure is based on stir-bar sorptive extraction (SBSE) followed by ultrasound-assisted extraction (UAE) and high performance liquid chromatographic separation of analytes with UV detection.24 The procedure involves external sample treatment with reduced number of steps (principle 1), and 0.3 g of soil sample is needed (p 2). The measurement is off-line (p 3), and the procedure involves seven distinct steps (p 4). The procedure is neither automated nor miniaturized (p 5). No derivatization agents are involved in the analysis (p 6). Analytical wastes include the sample itself (0.3 g), 2 mL of acetone and 2 mL of NaCl solution, 0.5 g of NaCl added during the SBSE stage, and 2.05 mL of EtOH as well as 18 mL of the LC mobile phase (p 7). Eight analytes are determined in a single run and the sample throughput is ∼2.5 samples h–1, based on the SBSE desorption time of 20 min (p 8). LC is the most energy-demanding analytical technique (p 9), and some of the reagents (alcohols) can be from bio-based sources (p 10). The procedure requires 21.55 mL of toxic solvents (p 11), and MeOH is considered highly flammable (p 12).
The second procedure is based on solvent extraction (SE) followed by headspace solid-phase microextraction (HS-SPME) with GC-MS/MS determination.25 The procedure involves sample preparation with a reduced number of steps (p 1), the mass of the soil sample is 2 g (p 2), and the analytical device is positioned in off-line mode (p 3). The number of distinctive analytical steps is six (p 4). The procedure is not automated but involves a miniaturized sample preparation technique (p 5). No derivatization agents are applied (p 6), the total amount of waste is 10.5 (g and mL combined), consisting of the sample itself, mixture of solvents used during solvent extraction step, syringe filter, and drying agent (p 7). The number of analytes determined is eight, and the analytical throughput is single sample h–1 as SPME extraction takes 60 min (p 8). The most energy demanding technique is GC-MS (p 9). None of the reagents is from bio-based sources (p 10), the volume of toxic reagents is 8 mL (p 11), and hexane is highly flammable and toxic to aquatic life (p 12).
The third procedure is based on Soxhlet extraction and gas chromatography coupled with high resolution mass spectrometry.26 The sample pretreatment is external with reduced number of steps (p 1). The mass of soil sample required for analysis is 3 g (p 2), and the measurement is performed in off-line mode (p 3). The procedure consists of six steps (p 4), and it is neither automated nor miniaturized (p 5). Again, no derivatization agents are applied (p 6), the amount of waste generated is 219 mL or g of solvents, salts, and sorbents (p 7). The number of analytes determined is 13, and the analytical throughput is 0.042 samples h–1, as Soxhlet extraction takes 24 h (p 8), which is also the most energy demanding device (p 9). No reagents are from bio-based sources (p 10), while 200 mL of toxic solvents is needed (p 11). High flammability is not avoided (p 12).
As the determination of PBDEs in soil matrices is not a simple analytical task, significant energy and material inputs are required to isolate, separate, and quantify these compounds. This is reflected in generally low scores of AGREE analysis. The Soxhlet extraction-based procedure is characterized by an explicitly worse score, while the remaining two procedures have similar scores. However, the distribution of weak and strong points differs in both cases.
For comparison, the scores for each procedure obtained with Eco-Scale assessment5 are 65 for SBSE-UAE-HPLC-UV, 71 for SE-HS-SPME-GC-MS/MS, and 49 Soxhlet extraction with GC-MS. Again, the Soxhlet extraction-based procedure is considerably worse than other procedures and the remaining two have similar scores. The SBSE-based procedure has a lower Eco-Scale score than the SPME-based procedure, which is contradictory to the AGREE assessment result. These results can be attributed to a more ambitious assessment of aspects from the point of view of green chemistry and to the fact that AGREE considers aspects that are overlooked or not considered in the Eco-Scale assessment. Here, lower sample size, higher analytical throughput, possibility to apply bio-based solvents, and lack of other hazards (no hexane is applied, which is toxic to aquatic life) are advantages of the SBSE-based procedure.
Concluding Remarks
Analytical GREEnness is a metric system for the assessment of greenness of analytical procedures based on the SIGNIFICANCE principles. It is comprehensive (by incorporation of each of the 12 principles), flexible (by the possibility to assign weights), easy to interpret (the output is a colored pictogram, showing the structure of weak and strong points), and easy to perform (with a user-friendly GUI software). The freely downloadable software makes the analysis very fast and straightforward. The analysis can be performed in a few minutes. The case studies present full applicability of AGREE to various analytical methodologies. The compiled version of the software is downloadable from mostwiedzy.pl/AGREE, and the code is available at git.pg.edu.pl/p174235/AGREE.
Supporting Information Available
The Supporting Information is available free of charge at https://pubs.acs.org/doi/10.1021/acs.analchem.0c01887.
Software documentation for the Analytical Greenness Calculator (PDF)
The authors declare no competing financial interest.
Supplementary Material
References
- Armenta S.; Garrigues S.; de la Guardia M. Green Analytical Chemistry. TrAC, Trends Anal. Chem. 2008, 27, 497–511. 10.1016/j.trac.2008.05.003. [DOI] [Google Scholar]
- Tobiszewski M.; Marc M.; Gałuszka A.; Namiesnik J. Green Chemistry Metrics with Special Reference to Green Analytical Chemistry. Molecules 2015, 20, 10928–10946. 10.3390/molecules200610928. [DOI] [PMC free article] [PubMed] [Google Scholar]
- Tobiszewski M. Metrics for Green Analytical Chemistry. Anal. Methods 2016, 8, 2993–2999. 10.1039/C6AY00478D. [DOI] [Google Scholar]
- Keith L. H.; Gron L. U.; Young J. L. Green Analytical Methodologies. Chem. Rev. 2007, 107, 2695–2708. 10.1021/cr068359e. [DOI] [PubMed] [Google Scholar]
- Gałuszka A.; Migaszewski Z. M.; Konieczka P.; Namieśnik J. Analytical Eco-Scale for Assessing the Greenness of Analytical Procedures. TrAC, Trends Anal. Chem. 2012, 37, 61–72. 10.1016/j.trac.2012.03.013. [DOI] [Google Scholar]
- Tobiszewski M.; Orłowski A. Multicriteria Decision Analysis in Ranking of Analytical Procedures for Aldrin Determination in Water. J. Chromatogr. A 2015, 1387, 116–122. 10.1016/j.chroma.2015.02.009. [DOI] [PubMed] [Google Scholar]
- Płotka-Wasylka J. A New Tool for the Evaluation of the Analytical Procedure: Green Analytical Procedure Index. Talanta 2018, 181, 204–209. 10.1016/j.talanta.2018.01.013. [DOI] [PubMed] [Google Scholar]
- Nowak P. M.; Kościelniak P. What Color Is Your Method? Adaptation of the Rgb Additive Color Model to Analytical Method Evaluation. Anal. Chem. 2019, 91, 10343–10352. 10.1021/acs.analchem.9b01872. [DOI] [PubMed] [Google Scholar]
- Gałuszka A.; Migaszewski Z.; Namieśnik J. The 12 Principles of Green Analytical Chemistry and the SIGNIFICANCE Mnemonic of Green Analytical Practices. TrAC, Trends Anal. Chem. 2013, 50, 78–84. 10.1016/j.trac.2013.04.010. [DOI] [Google Scholar]
- de la Guardia M.; Garrigues S.. Direct Determination Methods without Sample Preparation. In Challenges in Green Analytical Chemistry; de la Guardia M., Garrigues S., Eds.; RSC Publishing: Cambridge, U.K., 2011; pp 13–43. [Google Scholar]
- Valcárcel M.; Cárdenas S. Vanguard-Rearguard Analytical Strategies. TrAC, Trends Anal. Chem. 2005, 24, 67–74. 10.1016/j.trac.2004.07.016. [DOI] [Google Scholar]
- Valcárcel M.Principles of Analytical Chemistry: A Textbook; Springer-Verlag: Berlin, 2000. [Google Scholar]
- Gałuszka A.; Migaszewski Z. M.; Namieśnik J. Moving Your Laboratories to the Field - Advantages and Limitations of the Use of Field Portable Instruments in Environmental Sample Analysis. Environ. Res. 2015, 140, 593–603. 10.1016/j.envres.2015.05.017. [DOI] [PubMed] [Google Scholar]
- Pena-Pereira F.From Conventional to Miniaturized Analytical Systems. In Miniaturization in Sample Preparation; Pena-Pereira F., Ed.; De Gruyter Open: Berlin, 2014; pp 1–28. [Google Scholar]
- Poole C. F. Microreactions in Separation Science: Reagents and Techniques. Foreword. J. Chromatogr. A 2013, 1296, 1. 10.1016/j.chroma.2013.05.025. [DOI] [PubMed] [Google Scholar]
- Tobiszewski M.; Namieśnik J.; Pena-Pereira F. A Derivatisation Agent Selection Guide. Green Chem. 2017, 19, 5911–5922. 10.1039/C7GC03108D. [DOI] [Google Scholar]
- Garrigues S.; Esteve-Turrillas F. A.; de la Guardia M. Greening the Wastes. Curr. Opin. Green Sustain. Chem. 2019, 19, 24–29. 10.1016/j.cogsc.2019.04.002. [DOI] [Google Scholar]
- Garrigues S.; Armenta S.; Guardia M. D. La. Green Strategies for Decontamination of Analytical Wastes. TrAC, Trends Anal. Chem. 2010, 29, 592–601. 10.1016/j.trac.2010.03.009. [DOI] [Google Scholar]
- Raynie D.; Driver J. L.. Green Assessment of Chemical Methods. In 13th Annual Green Chemistry and Engineering Conference; College Park, MD, 2009.
- Hicks M. B.; Farrell W.; Aurigemma C.; Lehmann L.; Weisel L.; Nadeau K.; Lee H.; Moraff C.; Wong M.; Huang Y.; et al. Making the Move towards Modernized Greener Separations: Introduction of the Analytical Method Greenness Score (AMGS) Calculator. Green Chem. 2019, 21, 1816–1826. 10.1039/C8GC03875A. [DOI] [Google Scholar]
- Pena-Pereira F.; Kloskowski A.; Namieśnik J. Perspectives on the Replacement of Harmful Organic Solvents in Analytical Methodologies: A Framework toward the Implementation of a Generation of Eco-Friendly Alternatives. Green Chem. 2015, 17, 3687–3705. 10.1039/C5GC00611B. [DOI] [Google Scholar]
- Gu Y.; Jérôme F. Bio-Based Solvents: An Emerging Generation of Fluids for the Design of Eco-Efficient Processes in Catalysis and Organic Chemistry. Chem. Soc. Rev. 2013, 42, 9550–9570. 10.1039/c3cs60241a. [DOI] [PubMed] [Google Scholar]
- Lavilla I.; Romero V.; Costas I.; Bendicho C. Greener Derivatization in Analytical Chemistry. TrAC, Trends Anal. Chem. 2014, 61, 1–10. 10.1016/j.trac.2014.05.007. [DOI] [Google Scholar]
- Yu C.; Hu B. Novel Combined Stir Bar Sorptive Extraction Coupled with Ultrasonic Assisted Extraction for the Determination of Brominated Flame Retardants in Environmental Samples Using High Performance Liquid Chromatography. J. Chromatogr. A 2007, 1160, 71–80. 10.1016/j.chroma.2007.05.042. [DOI] [PubMed] [Google Scholar]
- Salgado-Petinal C.; Llompart M.; García-Jares C.; García-Chao M.; Cela R. Simple Approach for the Determination of Brominated Flame Retardants in Environmental Solid Samples Based on Solvent Extraction and Solid-Phase Microextraction Followed by Gas Chromatography–Tandem Mass Spectrometry. J. Chromatogr. A 2006, 1124, 139–147. 10.1016/j.chroma.2006.06.017. [DOI] [PubMed] [Google Scholar]
- Wang P.; Zhang Q.; Wang Y.; Wang T.; Li X.; Ding L.; Jiang G. Evaluation of Soxhlet Extraction, Accelerated Solvent Extraction and Microwave-Assisted Extraction for the Determination of Polychlorinated Biphenyls and Polybrominated Diphenyl Ethers in Soil and Fish Samples. Anal. Chim. Acta 2010, 663, 43–48. 10.1016/j.aca.2010.01.035. [DOI] [PubMed] [Google Scholar]
Associated Data
This section collects any data citations, data availability statements, or supplementary materials included in this article.