Abstract
Objective:
This study aimed to explore PLEK2 expression profile, its prognostic value, and the potential genomic alterations associated with its dysregulation in lung adenocarcinoma (LUAD) and lung squamous cell carcinoma (LUSC).
Materials and methods:
Data from The Cancer Genome Atlas (TCGA), The Genotype-Tissue Expression (GTEx), and Kaplan-Meier plotter were used in combination for bioinformatic analysis.
Results:
PLEK2 mRNA was significantly upregulated in both LUAD and LUSC compared with their respective normal controls. PLEK2 upregulation showed independent prognostic value in progression-free survival (PFS) (HR: 1.169, 95%CI: 1.033 -1.322, p = 0.014). PLEK2 mRNA expression was positively correlated with invasion, cell cycle, DNA damage, and DNA repair of LUAD cells at the single-cell level. Genomic analysis showed that gene-level amplification might not directly lead to increased PLEK2 expression. Methylation profile analysis found 4 CpG sites (cg12199376, cg14437634, cg17641252, and cg06724236) had at least a weakly negative correlation with PLEK2 expression, among which cg12199376, cg14437634 and cg17641252 locate around the first exon of the gene.
Conclusions:
Increased PLEK2 expression might be a specific prognostic biomarker of poor PFS in LUAD patients. Its expression had significant positive correlations with invasion, cell cycle, DNA damage, and DNA repair of LUAD cells at the single-cell level. Promoter hypomethylation might be a potential mechanism leading to its upregulation.
Keywords: PLEK2, prognosis, lung adenocarcinoma, copy number alteration, methylation
Introduction
Pleckstrin-2 (PLEK2) is a 353 amino acid protein that is encoded by PLEK2 gene in the human genome and has a wide expression in various tissues.1 Its overexpression contributes to the formation of large lamellipodia and peripheral ruffle of cells, thereby facilitating cell spreading.1 It also interacts with membrane-associated phosphatidylinositols generated phosphatidylinositol 3-kinase (PI3 K) and thus participates in actin cytoskeletal actin rearrangement.2,3 Some recent studies suggest that its dysregulation is involved in cancer biology. Its expression is associated with disseminated tumor cells of breast cancer.4 It shows exclusive expression in the CD45- subset of melanoma and is considered as the strongest gene marker to distinguish CD45− melanoma patients from healthy people.5 In gallbladder cancer (GBC), PLEK2 overexpression enhances the epithelial-mesenchymal transition (EMT) process of GBC cells and leads to a subsequent higher rate of cell migration, invasion, and liver metastasis.6 Mechanistically, PLEK2 interact with EGFR and reduce E3 ubiquitin-protein ligase mediated EGFR ubiquitination, resulting in prolonged activation of EGFR signaling.6
One recent study found that PLEK2 upregulation is involved in TGF-β induced epithelial-to-mesenchymal transition (EMT) in gefitinib-resistant CXCR4-positive non-small cell cancer (NSCLC) cells.7 These findings suggest that this gene has a profound effect on the malignant behavior of NSCLC. However, NSCLC constitutes of three histological subtypes, including lung adenocarcinoma (LUAD), lung squamous cell carcinoma (LUSC) and large cell carcinoma, among which the LUAD and LUSC are the two dominant subtypes. These subtypes have distinct molecular signatures8,9 and also different prognosis.10 Therefore, it would be interesting to examine the specific prognostic value of PLEK2 expression in these histological subtypes.
In this study, using data from The Genotype-Tissue Expression (GTEx), The Cancer Genome Atlas (TCGA), and Kaplan-Meier plotter in combination, we compared PLEK2 expression profile between LUAD and LUSC, its prognostic value and the potential genomic alterations associated with its dysregulation.
Materials and Methods
This study was approved by the ethical committee of the Beijing Chao-Yang Hospital, Capital Medical University, Beijing, China.
Data Retrieving From GTEx and TCGA Using the UCSC Browser
The UCSC Browser (https://xenabrowser.net/heatmap/) was used to download data.11 GTEx is a project to determine tissue-specific gene expression in normal human tissues.12,13 RNA-seq data from normal lung in GTEx was acquired via loading the TCGA-TARGET-GTEx dataset. RNA-seq data from LUAD, LUSC, and the corresponding adjacent normal (adj. N) tissues were obtained by loading the TCGA pan-cancer dataset.
RNA-seq data were transformed and calculated by the log2Transcript per Million (TPM) method.
The following clinicopathological data were extracted, including age at initial diagnosis, gender, smoking history, pathological stage, pathological Tumor (N), Node (N) and Metastasis (M) status, and residual tumors. Survival data based on four commonly used clinical outcome endpoints: Overall Survival (OS), Progression-Free Survival (PFS), Disease-Free Survival (DFS), and Disease-Specific Survival (DSS) were extracted for survival analysis. Briefly, OS is defined as the date of diagnosis until the time of death from any cause. PFS is the period from the date of diagnosis to the date of the first occurrence of a new tumor event. DFS refers to the period from the date of diagnosis until the time of the first new tumor progression event subsequent to the determination of a patient’s disease-free status after their initial diagnosis and treatment. DSS indicates death from the diagnosed cancer type.14
The genomic data, including RNA-seq of gene expression, gene-level copy number, and DNA methylation were also collected. Gene level copy number was pre-treated in the dataset by deleting germline copy number variation (CNV). DNA methylation was measured by using Infinium Human Methylation 450 Bead Chip and was presented by calculating the β value of each CpG site.
Data Mining in the Kaplan-Meier Plotter
Kaplan-Meier plotter (http://kmplot.com/analysis/index.php?p=service&cancer=lung)15 is an online tool that supports pooled survival analysis by integrating multiple datasets collected from cancer Biomedical Informatics Grid (caBIG), Gene Expression Omnibus (GEO) and TCGA repositories. Kaplan-Meier analysis of OS and PFS were conducted in LUAD and LUSC patients, respectively.
Assessment of the Activity of LUAD Cells at the Single-Cell Transcriptional Level
The correlation between PLEK2 expression and the activity of LUAD cells at the single-cell level was examined using CancerSEA, which is an online platform for analyzing available RNA-seq datasets in GEO dataset.16 This platform generated a scoring system to assess the correlation between gene expression and 14 functional states of cancer cells, including angiogenesis, apoptosis, cell cycle, differentiation, DNA damage, DNA repair, epithelial-to-mesenchymal transition (EMT), hypoxia, inflammation, invasion, metastasis, proliferation, quiescence and stemness.16 The models for these functional states were constructed using the signatures from Gene Ontology, MSigDB, Cyclebase, HCMDB and StemMapper. The state scores were calculated using the Gene Set Variation Analysis (GSVA).16
Two single-cell RNA-seq datasets, GSE6940517 and GSE8553418 were used for estimation in the current study. The former set has 126 cells, while the latter contains 42 cells from LUAD patient-derived xenograft (PDX) tumors.
Statistical Analysis
Data analysis was performed using both SPSS 25.0 software package (SPSS Inc., Chicago, IL, USA) and GraphPad Prism 8.04 (GraphPad Inc., La Jolla, CA, USA). Welch’s t-test was conducted to compare the statistical difference between two groups. Kaplan-Meier (K-M) survival curves were generated to compare the survival difference between patients with high and low PLEK2 mRNA expression (median separation). The log-rank test was conducted to check the statistical difference between the survival curves. Two-sided Fisher’s exact test was performed by analyzing the difference in clinicopathological parameters and PFS between patients with high and low PLEK2 expression. The independent prognostic value of PLEK2 was assessed by univariate and multivariate Cox regression models, in which PLEK2 expression was treated as a continuous variable. Regression analysis was performed by calculating the Pearson’s correlation coefficient. p < 0.05 was considered statistically significant.
Results
PLEK2 Was Significantly Upregulated in Both LUAD and LUSC Tissues Than in Corresponding Normal Tissues
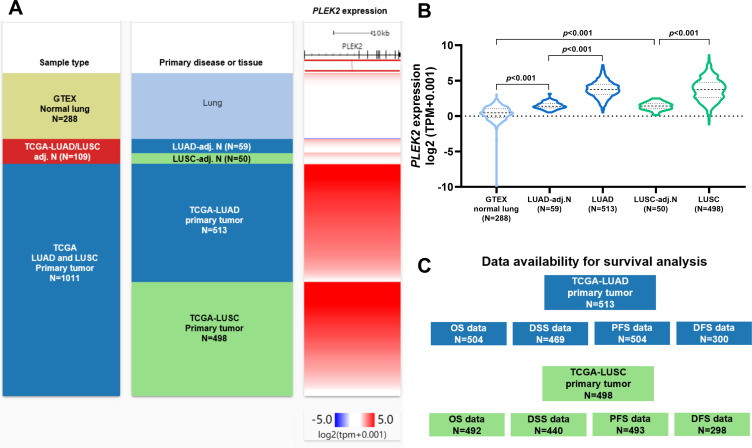
Using RNA-seq data from both GTEx and TCGA, we compared the expression of PLEK2 in LUAD/LUSC, their corresponding adj. N tissues and normal lung tissues (Figure 1A and B). The lowest PLEK2 expression was observed in normal lung tissues (Figure 1A and B). It gradually increased in adj. N tissues to tumor tissues (Figure 1A and B). No significant expression difference was observed between LUAD and LUSC groups (Figure 1B). Then, we extracted survival data from LUAD and LUSC cases, respectively. The availability of clinical outcome endpoint data was shown in Figure 1C.
Figure 1.
PLEK2 was significantly upregulated in both LUAD and LUSC tissues than in corresponding normal tissues. A-B. A heatmap (A) and a violin plot chart showing the expression of PLEK2 in normal lung (N = 288, from GTEx), LUAD (N = 513, from TCGA pan-cancer), LUSC (N=498, from TCGA pan-cancer) and corresponding adj. N tissues (from TCGA pan-cancer). C. A diagram showing survival data availability in LUAD and LUSC patients from TCGA pan-cancer.
High PLEK2 Expression Was Associated With Unfavorable Survival in NSCLC
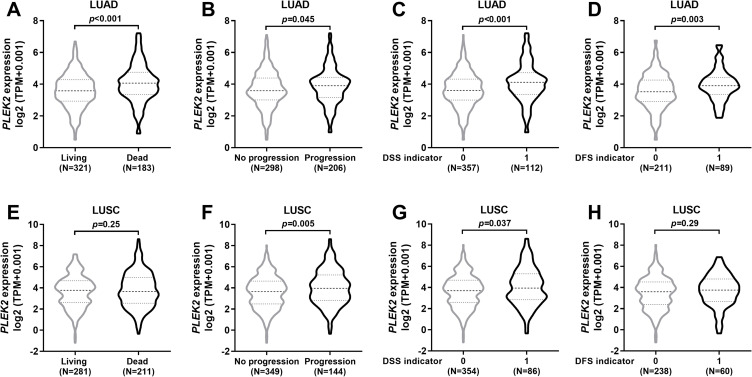
By grouping LUAD and LUSC patients according to clinical outcome endpoints, we compared PLEK2 expression between the groups with different survival outcomes. Results showed that in patients with LUAD, the group with unfavorable clinical outcome endpoints all had significantly higher PLEK2 expression compared to the group with favorable outcome endpoints (Figure 2A-D). In LUSC patients, the group with progression and the group with disease-specific death had higher PLEK2 expression compared to their respective counterparts (Figure 2B and C). In comparison, no significant difference was observed between groups with different OS or DFS indicators (Figure 2A and D).
Figure 2.
Comparison of PLEK2 expression in LUAD and LUSC patients with different survival outcomes. A-H. Comparison of PLEK2 expression in LUAD (A-D) and LUSC (E-H) patients grouped according to their OS status (A and E), PFS status (B and F), DSS status (C and G) and DFS status (D and H).
Survival Analysis Identified PLEK2 Expression Was an Independent Prognostic Biomarker in LUAD Patients
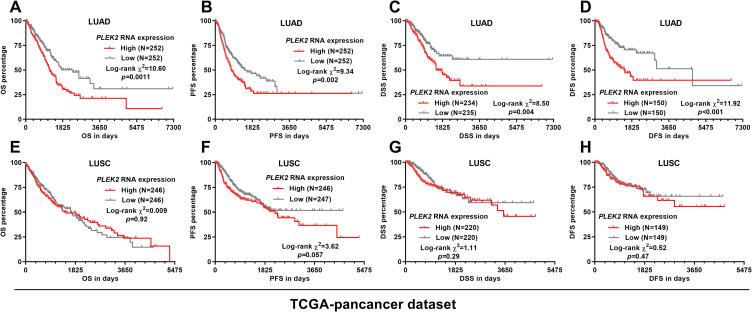
By setting median PLEK2 expression as the cutoff, we compared the survival difference between patients with high and low PLEK2 expression. Log-rank test showed that in LUAD patients, the high PLEK2 expression group had a significantly shorter OS, PFS, DSS and DFS compared with the low expression group (p < 0.05, Figure 3A-D). In LUSC patients, K-M survival analysis failed to identify a significant difference between the high and low expression groups regarding OS, OS, PFS, DSS or DFS (Figure 3D-H).
Figure 3.
K-M survival analysis in LUAD and LUSC patients in TCGA respectively. A-C. Kaplan-Meier curves of OS (A and E), PFS (B and F), DSS (C and G), and DFS (D and H) in LUAD (A-D) and LUSC (E-H) patients. Patients were separated into two groups according to the median expression of PLEK2. Survival data were from TCGA pan-cancer.
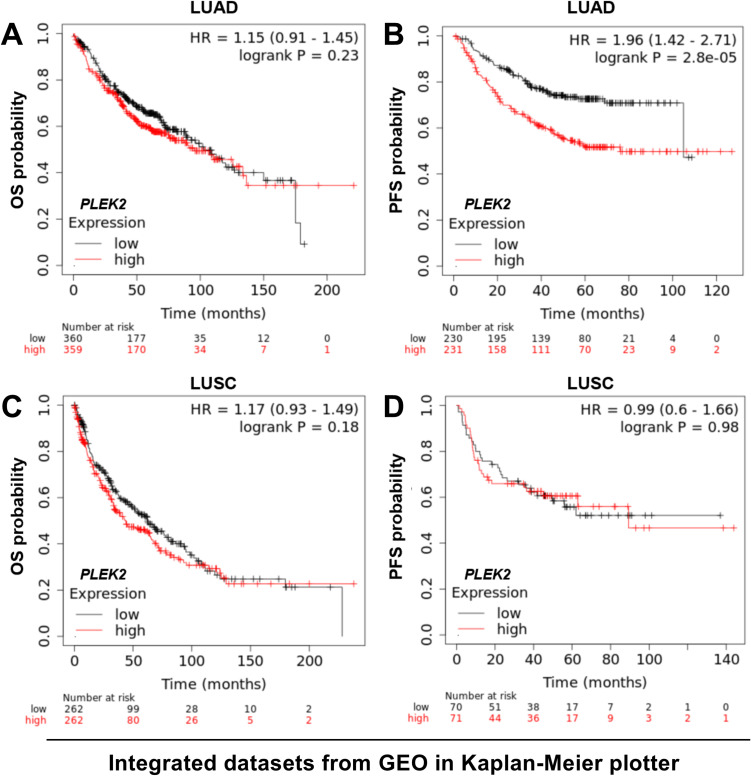
Then, we tried to validate the K-M survival findings using the Kaplan-Meier plotter, which collected and integrated over 10 NSCLC datasets from the GEO database. Using the same cutoff in Figure 3, we confirmed that LUAD patients with high PLEK2 expression had significantly worse PFS (Figure 4B). However, the OS difference was not validated (Figure 4A). In LUSC patients, no significant difference was observed in OS or PFS, by median PLEK2 separation (Figure 4C-D).
Figure 4.
K-M analysis of OS and PFS in LUAD and LUSC patients using the Kaplan-Meier plotter. A-D. Kaplan-Meier curves of OS (A and C) and PFS (B and D) in LUAD (A-B) and LUSC (C-D) patients. Patients were separated into two groups according to the median expression of PLEK2. Survival data were from the Kaplan-Meier plotter.
Then, we performed univariate and multivariate analysis to explore whether PLEK2 mRNA expression serves as an independent prognostic biomarker in LUAD patients. The clinicopathological parameters between LUAD patients with high and low PLEK2 expression were compared in Table 1. Two-sided Fisher’s exact test suggested that the high PLEK2 expression group had a significantly higher proportion of patients with nodal positive tumors (104/248 vs. 64/243, p < 0.001). This group also had a higher ratio of death (109/252 vs. 74/252, p = 0.002), disease progression (116/252 vs. 90/252, p = 0.023), disease-specific death (69/234 vs. 43/235, p = 0.005) and disease-progression after disease-free status (52/144 vs.37/156, p = 0.023) (Table 1). The clinicopathological parameters and survival data used for analysis were provided in Supplementary Table 1. Results of univariate analysis showed that advanced pathological stages, larger tumor size (pathological T status), nodal invasion, with residual tumor, and increased PLEK2 expression were risk factors of shorter PFS. PLEK2 expression showed independent prognostic value (HR: 1.169, 95%CI: 1.033 -1.322, p = 0.014) in PFS after adjustment of the other three factors (Table 2). Besides, we also noticed that increased PLEK2 expression might have independent prognostic value in terms of DSS (HR: 1.355, 95%CI: 1.131 -1.623, p = 0.001) (Supplementary Table 2) and DFS (HR: 1.364, 95%CI: 1.129 -1.649, p = 0.001) (Supplementary Table 3) after adjustment of the other risk factors.
Table 1.
Comparison of Clinicopathological Parameters and Survival Outcome Indicators between LUAD Patients with High and Low PLEK2 Expression.
| Parameters | PLEK2 expression | p value | ||
|---|---|---|---|---|
| High (N = 252) | Low (N = 252) | |||
| Age (Mean ± SD) | 65.56 ± 10.63 | 65.00 ± 9.40 | 0.54 | |
| Gender | Female | 136 | 134 | 0.93 |
| Male | 116 | 118 | ||
| Smoking History | 2/3/4/5 | 41 | 31 | 0.20 |
| 1 | 202 | 215 | ||
| no data | 9 | 6 | ||
| Pathological Stage | I/II | 186 | 204 | 0.06 |
| IIIV | 62 | 44 | ||
| Discrepancy/no data | 4 | 4 | ||
| Pathological T status | T1/T2 | 215 | 222 | 0.28 |
| T3/T4 | 36 | 27 | ||
| TX/no data | 1 | 3 | ||
| Pathological N status | N0 | 144 | 179 | <0.001 |
| N1/2/3 | 104 | 64 | ||
| NX/no data | 4 | 9 | ||
| Pathological M status | M0 | 160 | 175 | 0.69 |
| M1 | 13 | 12 | ||
| MX/no data | 79 | 65 | ||
| Residual tumors | R0 | 171 | 163 | 0.075 |
| R1/R2 | 12 | 4 | ||
| RX/no data | 69 | 85 | ||
| OS status | Living | 143 | 178 | 0.002 |
| Dead | 109 | 74 | ||
| PFS status | No progression | 136 | 162 | 0.023 |
| Progression | 116 | 90 | ||
| DSS status | Living | 165 | 192 | 0.005 |
| Disease-specific death | 69 | 43 | ||
| no data | 18 | 17 | ||
| DFS status | Disease-free | 92 | 119 | 0.023 |
| Progression | 52 | 37 | ||
| no data | 108 | 96 | ||
Smoking history: 1: lifelong non-smoker; 2: current smoker; 3. Current reformed smoker (for >15 yrs); 4. Current reformed smoker (for ≤15 yrs); 5. Current reformed smoker (duration not specified); TX: Primary tumor cannot be assessed; NX: Regional lymph nodes cannot be assessed; MX: Presence of distant metastasis cannot be assessed; RX: The presence of residual tumor cannot be assessed. Bold: p < 0.05
Table 2.
Univariate and Multivariate Analysis of PFS in LUAD Patients.
| Parameters | Univariate analysis | Multivariate analysis | ||||||
|---|---|---|---|---|---|---|---|---|
| p | HR | 95% CI (lower/upper) | p | HR | 95% CI (lower/upper) | |||
| Age (Continuous) | 0.948 | 1.000 | 0.986 | 1.014 | ||||
| Gender | ||||||||
| Male (N = 234) | 1.000 | |||||||
| Female (N = 270) | 0.574 | 0.924 | 0.702 | 1.216 | ||||
| Smoking history | ||||||||
| 2/3/4/5 (N = 417) | 1.000 | |||||||
| 1 (N = 72) | 0.907 | 1.024 | 0.690 | 1.520 | ||||
| Pathological stages | ||||||||
| III/IV (N = 106) | 1.000 | |||||||
| I/II (N = 390) | 0.003 | 0.618 | 0.450 | 0.850 | 0.680 | 1.092 | 0.718 | 1.662 |
| Pathological T status | ||||||||
| T3/T4 (N = 63) | 1.000 | |||||||
| T1/T2 (N = 437) | 0.001 | 0.531 | 0.362 | 0.781 | 0.032 | 0.624 | 0.407 | 0.959 |
| Pathological N status | ||||||||
| N1/N2/N3 (N = 165) | 1.000 | |||||||
| N0 (N = 323) | 0.001 | 0.612 | 0.463 | 0.810 | 0.015 | 0.664 | 0.478 | 0.922 |
| Pathological M status | ||||||||
| M1 (N = 25) | 1.000 | |||||||
| M0 (N = 335) | 0.096 | 0.615 | 0.347 | 1.091 | ||||
| Residual tumors | ||||||||
| Yes (N = 16) | 1.000 | |||||||
| No (N = 334) | <0.001 | 0.304 | 0.163 | 0.565 | 0.003 | 0.382 | 0.200 | 0.728 |
| PLEK2 expression (Continuous) | 0.001 | 1.225 | 1.086 | 1.382 | 0.014 | 1.169 | 1.033 | 1.322 |
Smoking history: 1: lifelong non-smoker; 2: current smoker; 3. Current reformed smoker (for >15 yrs); 4. Current reformed smoker (for ≤15 yrs); 5. Current reformed smoker (duration not specified); NX: Regional lymph nodes cannot be assessed; RX: The presence of residual tumor cannot be assessed. Bold indicates p < 0.05.
PLEK2 Expression Was Positively Correlated With Invasion, Cell Cycle, DNA Damage and DNA Repair of LUAD Cells
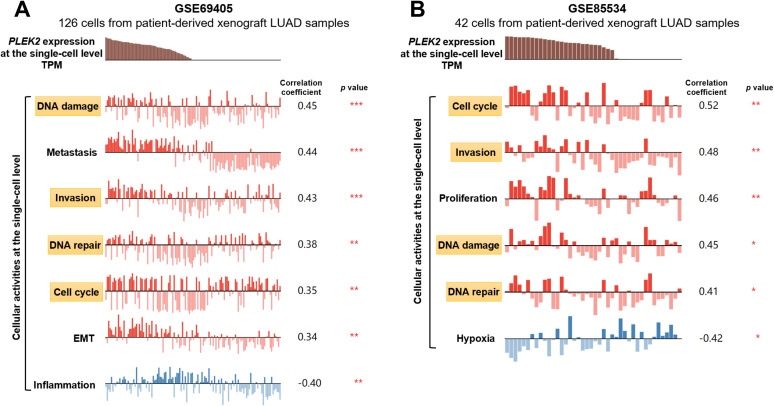
To explore the underlying mechanisms of the association between PLEK2 expression and unfavorable survival of LUAD, we assessed the correlation of PLEK2 expression and cellular activities of LUAD cells at the single-cell level. Among the 14 functional states assessed, PLEK2 expression showed significant positive correlations with invasion, cell cycle, DNA damage and DNA repair of LUAD cells in both GSE69405 and GSE85534 (Figure 5A and B).
Figure 5.
PLEK2 expression was positively correlated with invasion, cell cycle, DNA damage and DNA repair of LUAD cells. A-B. Analysis of the correlation between PLEK2 expression and the activity of LUAD cells at the single-cell level was examined using CancerSEA. Correlation analysis was performed in GSE69405 (A) and GSE85534 (B), respectively. Only the states with significant correlations (|correlation r|≥0.3 and p < 0.05) were listed. The significant states shared in the two datasets were marked in yellow boxes.
Gene-Level Copy Number and DNA Methylation Profile of PLEK2 in LUAD Patients
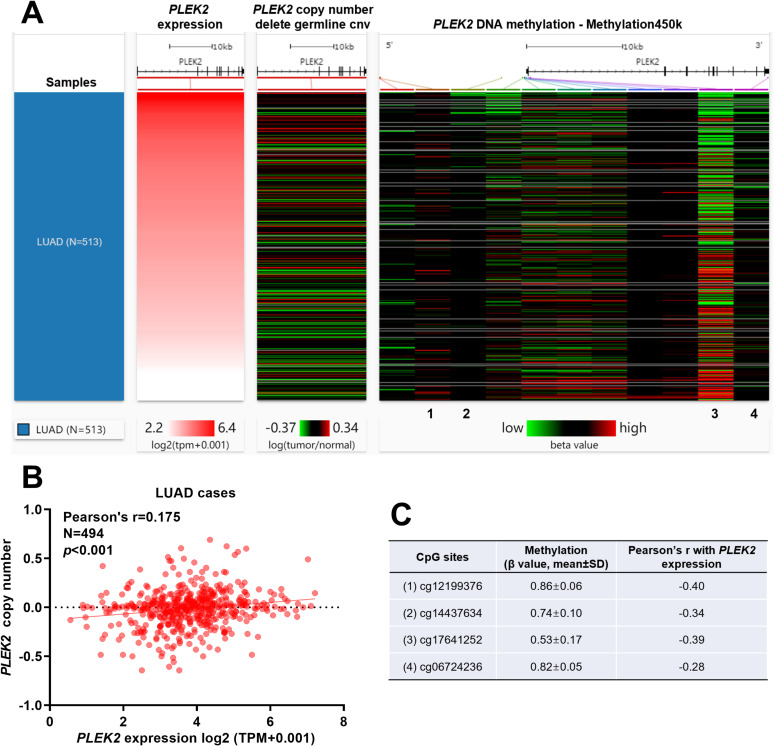
Using Gene-level copy number and DNA methylation data, we tried to identify the potential mechanisms associated with PLEK2 dysregulation in LUAD. Among 494 out of 513 LUAD cases had gene-level copy number data (germline copy number variation deleted), the correlation between PLEK2 expression and its copy number was weak (Pearson’s r = 0.175) (Figure 6A and B). 450 LUAD cases had DNA methylation data available. The methylation level of 11 CpG sites was measured in the bead chip (Figure 6A). Regression analysis found 4 CpG sites (cg12199376, cg14437634, cg17641252 and cg06724236) had at least a weakly negative correlation with PLEK2 expression (Figure 6A and C). cg12199376, cg14437634 and cg17641252 locate around the first exon (Figure 6A).
Figure 6.
Gene-level copy number and DNA methylation profile of PLEK2 in LUAD patients. A. A heat map showing the correlation between PLEK2 expression, gene-level copy number, and DNA methylation in LUAD patients (N = 513). B. A plot chart showing the correlation between PLEK2 expression and its gene-level copy number. C. The methylation level (β value) and Pearson’s r value of 4 CpG sites with at least a weakly negative correlation with PLEK2 expression. Their positions were as indicated in figure A.
Discussion
In this study, using data from TCGA and GTEx, we found that PLEK2 was significantly upregulated in both LUAD and LUSC compared with their respective normal controls.
Survival analysis based on data from TCGA and validation using Kaplan-Meier plotter suggested that its high expression was associated with significantly shorter PFS. Univariate and multivariate analysis revealed that PLEK2 expression might be an independent prognostic marker in terms of PFS (HR: 1.169, 95%CI: 1.033 -1.322, p = 0.014) in LUAD patients.
Previous studies suggest that PLEK2 has multifaced regulatory effects by interacting with different molecules in multiple signaling pathways. It exerts strong regulatory effects on actin cytoskeletal actin rearrangement and subsequent formation of large lamellipodia and the peripheral ruffle of cells.1-3 It interacts with EGFR in GBC cells and promotes cell invasion and metastasis via the EGFR/CCL2 pathway.6 PLEK2 acts as a downstream effector of the JAK2/STAT5 pathway in erythroid and myeloid cells.19 Therefore, PLEK2 upregulation might directly lead to enhanced invasive capability of cancer cells. In NSCLC cells, PLEK2 upregulation was associated with acquired stem cell properties and TGF-β induced EMT.7 EMT is also an important mechanism endowing enhanced invasive and metastatic features to lung cancer cells.20 In this study, we confirmed that the nodal positive LUAD patients had significantly higher PLEK2 expression compared to nodal negative counterparts. Besides, we assessed the cellular activity of LUAD cells using previous RNA-seq datasets and confirmed a positive correlation between PLEK2 expression and invasive capability of LUAD cells at the single-cell level. In combination with previous findings, we infer that PLEK2 expression might be an important mechanism contributing to the nodal invasion of LUAD. We also noticed that PLEK2 expression was positively correlated cell cycle progression, suggesting that it might enhance tumor cell proliferation. Furthermore, PLEK2 expression was associated with increased DNA repair of LUAD cells, which is an important mechanism of drug resistance.21,22 These findings could partly explain the association between PLEK2 expression and unfavorable PFS of LUAD patients. Therefore, it is necessary to explore the exact molecular regulatory mechanisms of PLEK2 on these cellular activities, for a full understanding of the functional role of PLEK2 and the development of targeted therapy.
Although we characterized the potential prognostic value of PLEK2 expression in LUAD, the underlying mechanisms of its dysregulation are not clear. One previous study reported PLEK2 amplification and associated enhanced gene expression in SW613-S cells, a human colon carcinoma cell line,23 suggesting that gene amplification might contribute to its upregulation in cancer cells. In this study, we examined PLEK2 expression and copy number data in LUAD cases. Although the non-zero test suggested that there might be a significant correlation, the correlation coefficient was quite small (<0.2). Therefore, we infer that gene-level amplification might have limited influence on the intensity of PLEK2 transcription. Methylation mediated epigenetic regulation is common in LUAD.24 A series of genes related to the pathological development of LUAD showed aberrant methylation in situ, such as EYA4, HOXA1, HOXA11, NEUROD1, NEUROD2, TMEFF2 and LGALS4. 24,25 Therefore, we also checked the methylation profile of PLEK2 in LUAD cases. Data from methylation 450 k bead chip indicated that the methylation level of 4 CpG sites was negatively correlated with PLEK2 expression, among which three sites locate around the first exon. These findings suggest that promoter hypomethylation might be an important mechanism resulting in upregulated PLEK2 expression in LUAD.
This study also has some limitations. Firstly, although we tried to validate the findings from TCGA pan-cancer using other datasets, only OS and PFS were outcome indicators in common. We failed to verify DSS and DFS using other datasets. Secondly, the potential influence of gene-level CNA and methylation on PLEK2 expression is inferred by in-silico analysis. Molecular studies should be conducted in the future for validation.
Conclusion
Increased PLEK2 expression might be a specific prognostic biomarker of poor PFS in LUAD patients. Its expression had significant positive correlations with invasion, cell cycle, DNA damage, and DNA repair of LUAD cells at the single-cell level. Promoter hypomethylation might be a potential mechanism leading to its upregulation.
Supplemental Material
Supplementary_Table_1 for PLEK2 Gene Upregulation Might Independently Predict Shorter Progression-Free Survival in Lung Adenocarcinoma by Wenqian Zhang, Tong Li, Bin Hu and Hui Li in Technology in Cancer Research & Treatment
Supplementary_Table_2_3 for PLEK2 Gene Upregulation Might Independently Predict Shorter Progression-Free Survival in Lung Adenocarcinoma by Wenqian Zhang, Tong Li, Bin Hu and Hui Li in Technology in Cancer Research & Treatment
Supplementary_Table_3_1 for PLEK2 Gene Upregulation Might Independently Predict Shorter Progression-Free Survival in Lung Adenocarcinoma by Wenqian Zhang, Tong Li, Bin Hu and Hui Li in Technology in Cancer Research & Treatment
Footnotes
Authors’ Note: This study was a secondary analysis based on online databases. No primary data were collected by any author of this study. No ethical approval is required.
Declaration of Conflicting Interests: The author(s) declared no potential conflicts of interest with respect to the research, authorship, and/or publication of this article.
Funding: The author(s) received no financial support for the research, authorship, and/or publication of this article.
ORCID iD: Wenqian Zhang  https://orcid.org/0000-0003-3391-2965
Supplemental Material: Supplemental material for this article is available online.
References
- 1. Hu MH, Bauman EM, Roll RL, Yeilding N, Abrams CS. Pleckstrin 2, a widely expressed paralog of pleckstrin involved in actin rearrangement. J Biol Chem. 1999;274(31):21515–21518. [DOI] [PubMed] [Google Scholar]
- 2. Bach TL, Kerr WT, Wang Y, et al. PI3 K regulates pleckstrin-2 in T-cell cytoskeletal reorganization. Blood. 2007;109(3):1147–1155. [DOI] [PMC free article] [PubMed] [Google Scholar]
- 3. Hamaguchi N, Ihara S, Ohdaira T, et al. Pleckstrin-2 selectively interacts with phosphatidylinositol 3-kinase lipid products and regulates actin organization and cell spreading. Biochem Biophys Res Commun. 2007;361(2):270–275. [DOI] [PubMed] [Google Scholar]
- 4. Naume B, Zhao X, Synnestvedt M, et al. Presence of bone marrow micrometastasis is associated with different recurrence risk within molecular subtypes of breast cancer. Mol Oncol. 2007;1(2):160–171. [DOI] [PMC free article] [PubMed] [Google Scholar]
- 5. Luo Y, Robinson S, Fujita J, et al. Transcriptome profiling of whole blood cells identifies PLEK2 and C1QB in human melanoma. PLoS One. 2011;6(6): e20971. [DOI] [PMC free article] [PubMed] [Google Scholar]
- 6. Shen H, He M, Lin R, et al. PLEK2 promotes gallbladder cancer invasion and metastasis through EGFR/CCL2 pathway. J Exp Clin Cancer Res. 2019;38(1):247. [DOI] [PMC free article] [PubMed] [Google Scholar]
- 7. Yin H, Wang Y, Chen W, Zhong S, Liu Z, Zhao J. Drug-resistant CXCR4-positive cells have the molecular characteristics of EMT in NSCLC. Gene. 2016;594(1):23–29. [DOI] [PubMed] [Google Scholar]
- 8. Daraselia N, Wang Y, Budoff A, et al. Molecular signature and pathway analysis of human primary squamous and adenocarcinoma lung cancers. Am J Cancer Res. 2012;2(1):93–103. [PMC free article] [PubMed] [Google Scholar]
- 9. Lockwood WW, Wilson IM, Coe BP, et al. Divergent genomic and epigenomic landscapes of lung cancer subtypes underscore the selection of different oncogenic pathways during tumor development. PLoS One. 2012;7(5): e37775. [DOI] [PMC free article] [PubMed] [Google Scholar]
- 10. Siegfried JM, Lin Y, Diergaarde B, et al. Expression of PAM50 genes in lung cancer: evidence that interactions between hormone receptors and HER2/HER3 contribute to poor outcome. Neoplasia. 2015;17(11):817–825. [DOI] [PMC free article] [PubMed] [Google Scholar]
- 11. Goldman MJ, Craft B, Hastie M, et al. Visualizing and interpreting cancer genomics data via the Xena platform. Nat Biotechnol. 2020;38(6):675–678. [DOI] [PMC free article] [PubMed] [Google Scholar]
- 12. GTEx Consortium. Human genomics. The genotype-tissue expression (GTEx) pilot analysis: multitissue gene regulation in humans. Science. 2015;348(6235):648–660. [DOI] [PMC free article] [PubMed] [Google Scholar]
- 13. GTEx Consortium. The genotype-tissue expression (GTEx) project. Nat Genet. 2013;45(6):580–585. [DOI] [PMC free article] [PubMed] [Google Scholar]
- 14. Liu J, Lichtenberg T, Hoadley KA, et al. An integrated TCGA pan-cancer clinical data resource to drive high-quality survival outcome analytics. Cell. 2018;173(2):400–416 e411. [DOI] [PMC free article] [PubMed] [Google Scholar]
- 15. Gyorffy B, Surowiak P, Budczies J, Lanczky A. Online survival analysis software to assess the prognostic value of biomarkers using transcriptomic data in non-small-cell lung cancer. PLoS One. 2013;8(12): e82241. [DOI] [PMC free article] [PubMed] [Google Scholar]
- 16. Yuan H, Yan M, Zhang G, et al. CancerSEA: a cancer single-cell state atlas. Nucleic Acids Res. 2019;47(D1): D900–D908. [DOI] [PMC free article] [PubMed] [Google Scholar]
- 17. Kim KT, Lee HW, Lee HO, et al. Single-cell mRNA sequencing identifies subclonal heterogeneity in anti-cancer drug responses of lung adenocarcinoma cells. Genome Biol. 2015;16(1):127. [DOI] [PMC free article] [PubMed] [Google Scholar]
- 18. Guillaumet-Adkins A, Rodriguez-Esteban G, Mereu E, et al. Single-cell transcriptome conservation in cryopreserved cells and tissues. Genome Biol. 2017;18(1):45. [DOI] [PMC free article] [PubMed] [Google Scholar]
- 19. Zhao B, Mei Y, Cao L, et al. Loss of pleckstrin-2 reverts lethality and vascular occlusions in JAK2V617F-positive myeloproliferative neoplasms. J Clin Invest. 2018;128(1):125–140. [DOI] [PMC free article] [PubMed] [Google Scholar]
- 20. Giarnieri E, Bellipanni G, Macaluso M, et al. Review: cell dynamics in malignant pleural effusions. J Cell Physiol. 2015;230(2):272–277. [DOI] [PubMed] [Google Scholar]
- 21. Tanaka T, Munshi A, Brooks C, Liu J, Hobbs ML, Meyn RE. Gefitinib radiosensitizes non-small cell lung cancer cells by suppressing cellular DNA repair capacity. Clin Cancer Res. 2008;14(4):1266–1273. [DOI] [PMC free article] [PubMed] [Google Scholar]
- 22. Rosell R, Lord RV, Taron M, Reguart N. DNA repair and cisplatin resistance in non-small-cell lung cancer. Lung Cancer. 2002;38(3):217–227. [DOI] [PubMed] [Google Scholar]
- 23. Guillaud-Bataille M, Brison O, Danglot G, et al. Two populations of double minute chromosomes harbor distinct amplicons, the MYC locus at 8q24.2 and a 0.43-Mb region at 14q24.1, in the SW613-S human carcinoma cell line. Cytogenet Genome Res. 2009;124(1):1–11. [DOI] [PubMed] [Google Scholar]
- 24. Selamat SA, Chung BS, Girard L, et al. Genome-scale analysis of DNA methylation in lung adenocarcinoma and integration with mRNA expression. Genome Res. 2012;22(7):1197–1211. [DOI] [PMC free article] [PubMed] [Google Scholar]
- 25. Selamat SA, Galler JS, Joshi AD, et al. DNA methylation changes in atypical adenomatous hyperplasia, adenocarcinoma in situ, and lung adenocarcinoma. PLoS One. 2011;6(6): e21443. [DOI] [PMC free article] [PubMed] [Google Scholar]
Associated Data
This section collects any data citations, data availability statements, or supplementary materials included in this article.
Supplementary Materials
Supplementary_Table_1 for PLEK2 Gene Upregulation Might Independently Predict Shorter Progression-Free Survival in Lung Adenocarcinoma by Wenqian Zhang, Tong Li, Bin Hu and Hui Li in Technology in Cancer Research & Treatment
Supplementary_Table_2_3 for PLEK2 Gene Upregulation Might Independently Predict Shorter Progression-Free Survival in Lung Adenocarcinoma by Wenqian Zhang, Tong Li, Bin Hu and Hui Li in Technology in Cancer Research & Treatment
Supplementary_Table_3_1 for PLEK2 Gene Upregulation Might Independently Predict Shorter Progression-Free Survival in Lung Adenocarcinoma by Wenqian Zhang, Tong Li, Bin Hu and Hui Li in Technology in Cancer Research & Treatment


