

Abstract
This cohort study assesses the association of the COVID-19 pandemic with the incidence of 5 medical emergencies (acute myocardial infarction, ischemic stroke, nontraumatic subarachnoid hemorrhage, ectopic pregnancy, and appendicitis) in 2 US academic medical centers.
Amid the coronavirus disease 2019 (COVID-19) pandemic, there have been anecdotal reports of a reduction in non–COVID-19 emergent diseases, including ischemic stroke1 and myocardial infarction (MI),2,3 and a general drop in emergency department volumes.4 The concern is that patients, wary of contact with individuals with COVID-19, are reluctant to seek care, even in the face of acute, life-threatening conditions. Using data from 2 academic medical centers, we assessed the association of the COVID-19 pandemic with the incidence of 5 medical emergencies: acute MI, ischemic stroke, nontraumatic subarachnoid hemorrhage (ntSAH), ectopic pregnancy, and appendicitis.
Methods
The online databases of Stanford University Medical Center and NewYork-Presbyterian/Weill Cornell Medical Center (NYP) were queried using International Statistical Classification of Diseases and Related Health Problems, Tenth Revision (ICD-10) codes to determine the number of patients with each diagnosis per month. Diagnoses of acute MI were extracted with ICD-10 code I21, ischemic stroke with I63, ntSAH with I60, ectopic pregnancy with O00, and appendicitis with K35. The monthly diagnosis total was divided by the number of days in each month to arrive at an average daily count. For acute MI, ischemic stroke, and ntSAH, patients younger than 18 years were excluded. Diagnoses were tallied between March 1, 2018, and May 22, 2020.
Interrupted time-series single-group analysis was performed to assess if pre–COVID-19 trends in case volumes differed significantly from post–COVID-19 trends. Segmented Poisson regression models were constructed to analyze trends in both periods and approximate an effect size, while accounting for the gradient of the underlying time trend.5 The start date of the COVID-19 era was selected to be March 1, 2020, corresponding to the first observed case in New York City. Data analysis was conducted using R, version 3.5.3 (The R Foundation) and Stata, version 14.2 (StataCorp). The significance level for all statistical tests was set at .05, and all tests were 2-sided. This study was deemed exempt by the institutional review boards of Stanford University School of Medicine and Weill Cornell Medicine because no identifiable patient data were used.
Results
The average numbers of cases per day before and after the start of the COVID-19 pandemic as well as adjusted relative risks (RRs) are detailed in the Table. After accounting for underlying trends, we estimated a 39% reduction in the daily volume of acute MI cases at NYP (RR, 0.61; 95% CI, 0.52-0.72; P < .001) and a 26% reduction at Stanford (RR, 0.74; 95% CI, 0.68-0.80; P < .001) (Figure, A). There was a 49% reduction in the daily volume of ischemic stroke cases at NYP (RR, 0.51; 95% CI, 0.45-0.56; P < .001) and a 16% reduction at Stanford (RR, 0.84; 95% CI, 0.79-0.89; P < .001) (Figure, B). The daily volume of ntSAH cases decreased by 33% at NYP (RR, 0.67; 95% CI, 0.47-0.93; P = .03) and by 21% at Stanford (RR, 0.79; 95% CI, 0.64-0.98; P = .03) (Figure, C). There was a 42% reduction in the daily volume of appendicitis cases at NYP (RR, 0.58; 95% CI, 0.46-0.74; P < .001) but no significant difference at Stanford (Figure, D). No difference in the daily volume of ectopic pregnancy cases was noted at either institution.
Table. Trends in Hospital Volume of 5 Emergency Medical Conditions Before and After the Start of the COVID-19 Pandemic.
| Institution | Condition | Mean daily count | Time series analysis | ||
|---|---|---|---|---|---|
| Pre–COVID-19 | Post–COVID-19 | Relative risk (95% CI) | P value | ||
| Stanford | Acute MI | 10.95 | 9.25 | 0.74 (0.68-0.80) | <.001 |
| Stanford | Ischemic stroke | 22.19 | 19.93 | 0.84 (0.79-0.89) | <.001 |
| Stanford | ntSAH | 2.10 | 1.50 | 0.79 (0.64-0.98) | .03 |
| Stanford | Appendicitis | 2.53 | 2.26 | 0.85 (0.71-1.01) | .07 |
| Stanford | Ectopic pregnancy | 0.58 | 0.52 | 0.76 (0.53-1.09) | .14 |
| NYP | Acute MI | 3.64 | 2.29 | 0.61 (0.52-0.72) | <.001 |
| NYP | Ischemic stroke | 9.09 | 4.93 | 0.51 (0.45-0.56) | <.001 |
| NYP | ntSAH | 0.92 | 0.61 | 0.67 (0.47-0.93) | .03 |
| NYP | Appendicitis | 2.04 | 1.06 | 0.58 (0.46-0.74) | <.001 |
| NYP | Ectopic pregnancy | 0.68 | 0.52 | 0.84 (0.59-1.20) | .33 |
Abbreviations: COVID-19, coronavirus disease 2019; MI, myocardial infarction; ntSAH, nontraumatic subarachnoid hemorrhage; NYP, NewYork-Presbyterian.
Figure. Association of the COVID-19 Pandemic With the Daily Caseload of 4 Medical Emergencies.
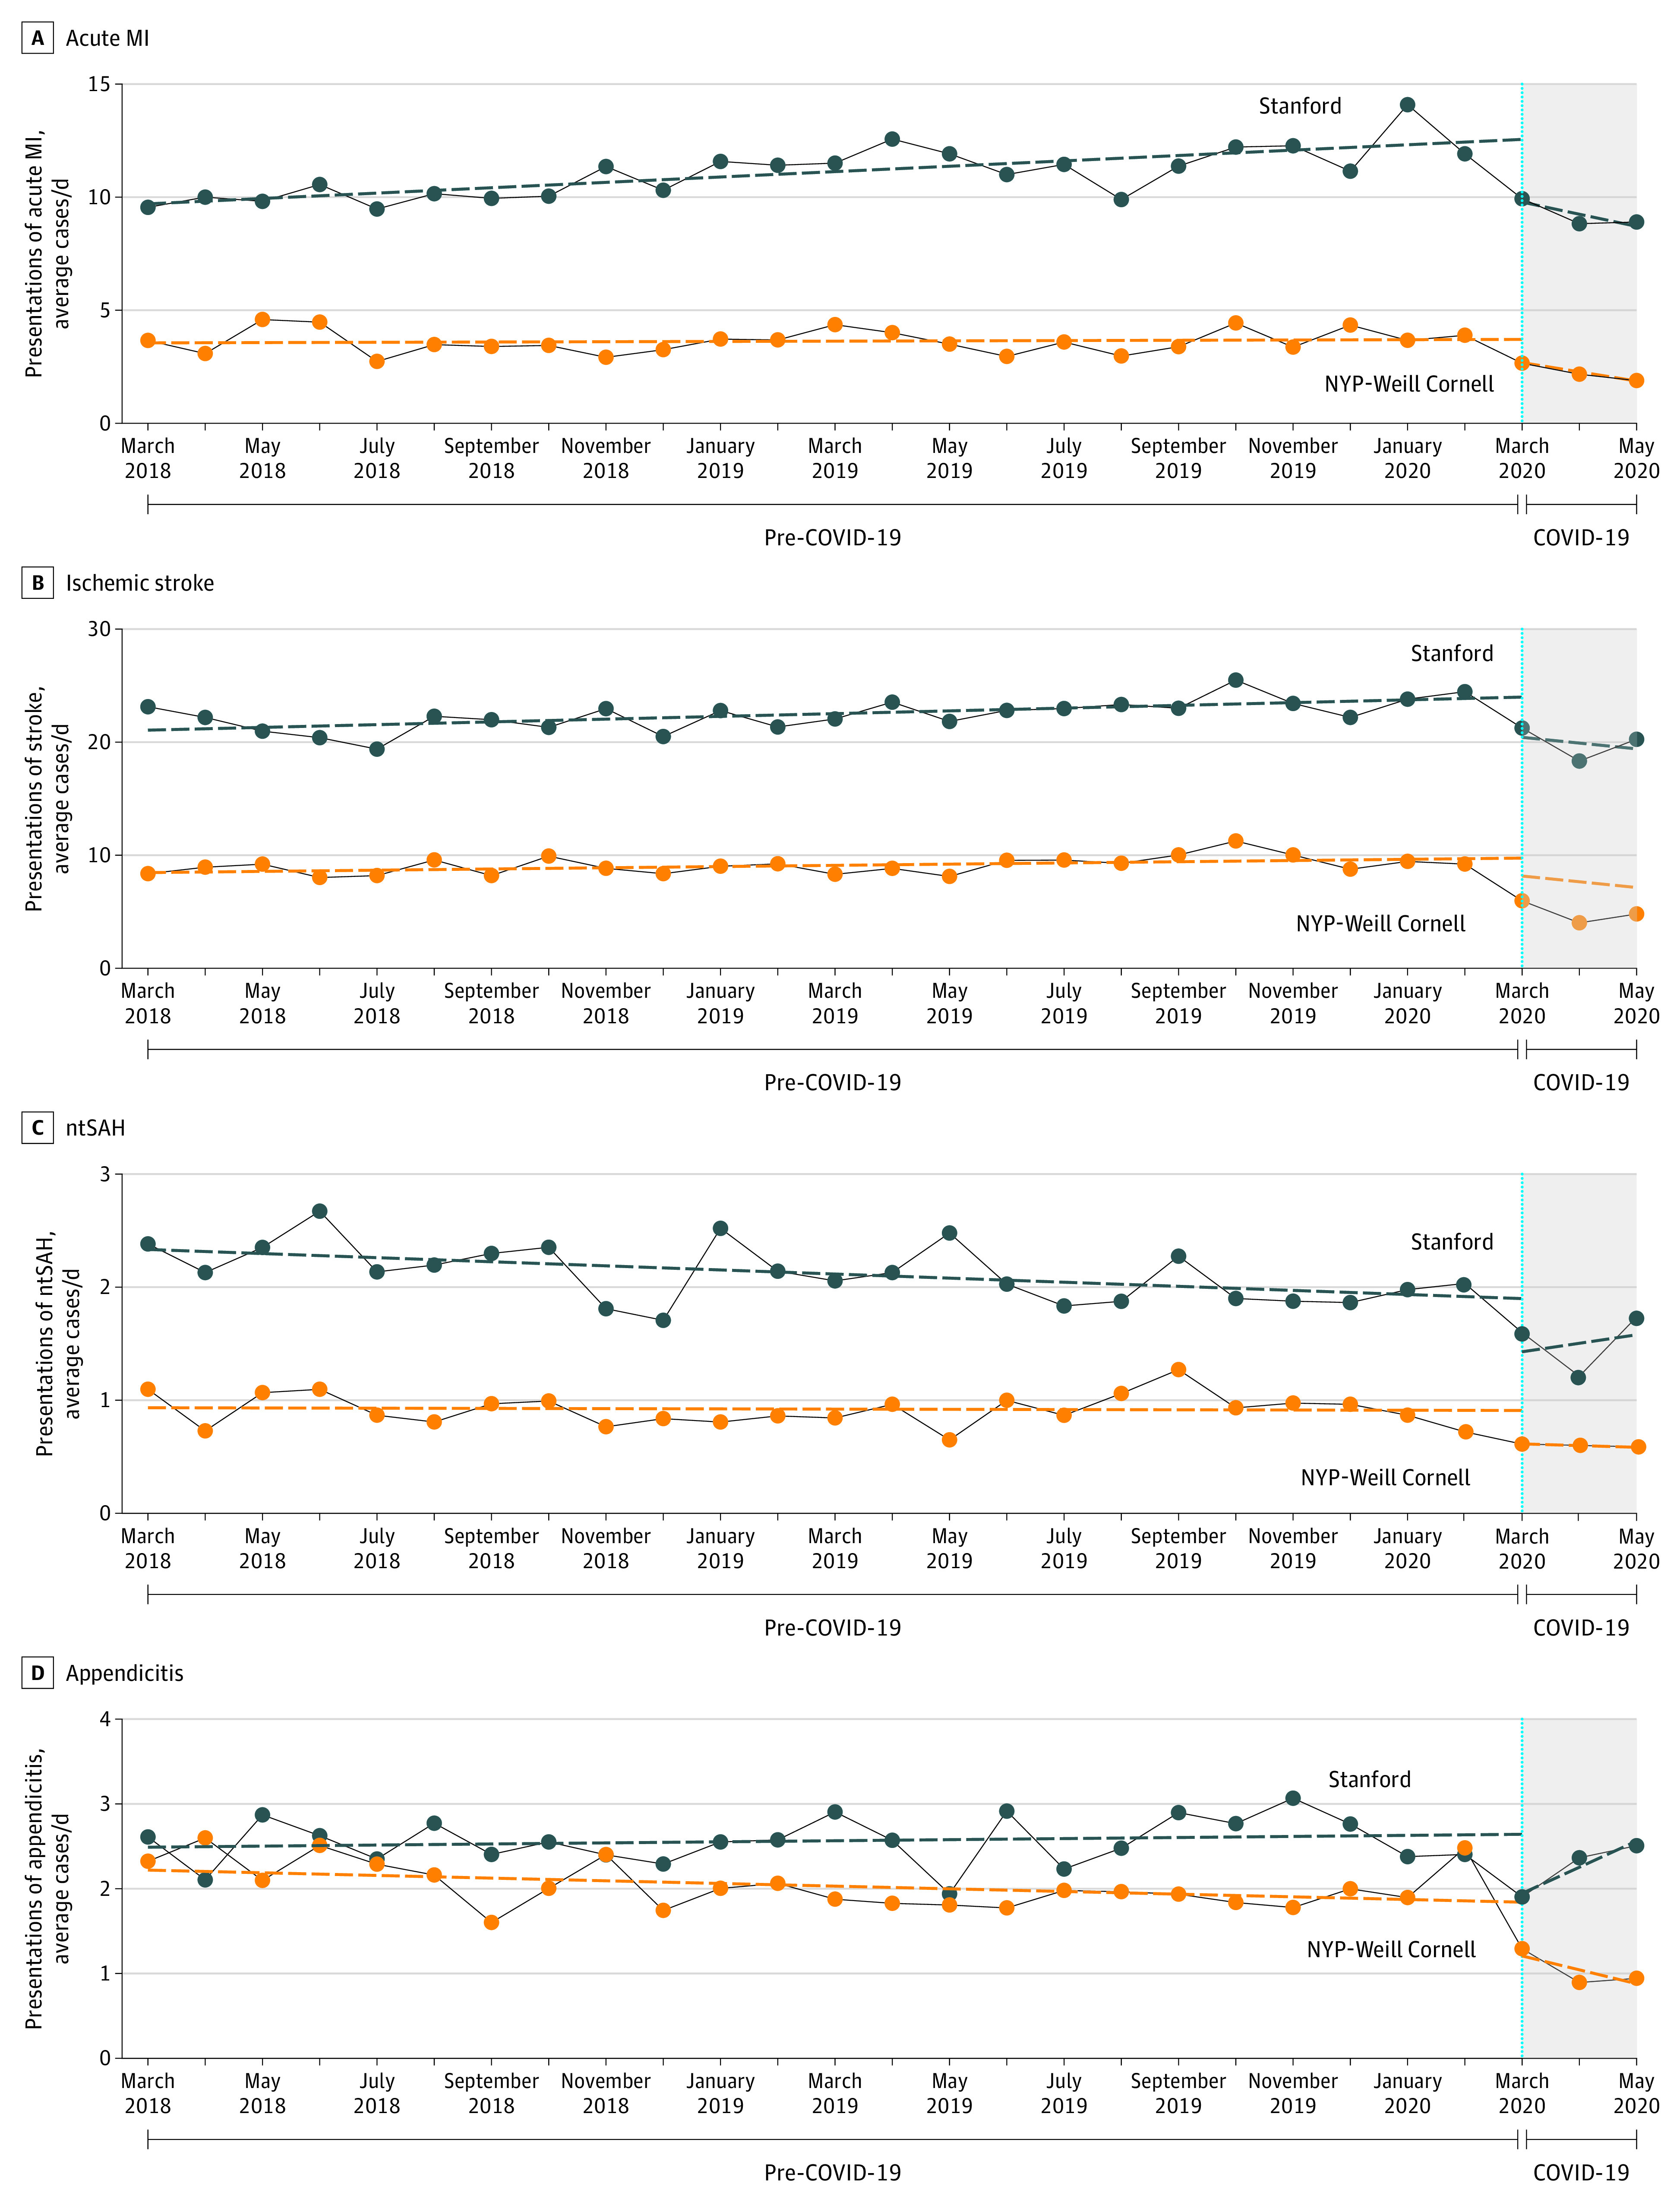
Trends in diagnoses of acute MI (A), ischemic stroke (B), ntSAH (C), and appendicitis (D). COVID-19 indicates coronavirus disease 2019; MI, myocardial infarction; ntSAH, nontraumatic subarachnoid hemorrhage; NYP, NewYork-Presbyterian.
Discussion
We identified significant drops in the daily caseload of 4 common medical emergencies following the onset of the COVID-19 pandemic. The association was more prominent at NYP than at Stanford, likely reflecting the increased severity of the pandemic in New York City. Study limitations include potentially limited generalizability, given the setting of 2 tertiary care centers, and reliance on the accuracy of ICD-10 codes.
Recent data suggest that deaths resulting from COVID-19 account for only half of the excess number of at-home deaths during the pandemic.6 The combination of fewer patients presenting with medical emergencies and an increased number of non–COVID-19–related at-home deaths is concerning. Fear of exposure to patients with COVID-19 may lead individuals to defer care for acute conditions.
References
- 1.Morelli N, Rota E, Terracciano C, et al. The baffling case of ischemic stroke disappearance from the casualty department in the COVID-19 era. Eur Neurol. 2020;83(2):213-215. doi: 10.1159/000507666 [DOI] [PMC free article] [PubMed] [Google Scholar]
- 2.Krumholz H Where have all the heart attacks gone? New York Times April 6, 2020. Accessed September 17, 2020. https://www.nytimes.com/2020/04/06/well/live/coronavirus-doctors-hospitals-emergency-care-heart-attack-stroke.html
- 3.Solomon MD, McNulty EJ, Rana JS, et al. The Covid-19 pandemic and the incidence of acute myocardial infarction. N Engl J Med. 2020;383:691-693. doi: 10.1056/NEJMc2015630 [DOI] [PubMed] [Google Scholar]
- 4.Wong LE, Hawkins JE, Langness S, Murrell KL, Iris P, Sammann A. Where are all the patients? addressing Covid-19 fear to encourage sick patients to seek emergency care. NEJM Catalyst. Published online May 14, 2020. doi: 10.1056/CAT.20.0193 [DOI] [Google Scholar]
- 5.Bernal JL, Cummins S, Gasparrini A. Interrupted time series regression for the evaluation of public health interventions: a tutorial. Int J Epidemiol. 2017;46(1):348-355. doi: 10.1093/ije/dyw098 [DOI] [PMC free article] [PubMed] [Google Scholar]
- 6.Griffin S Covid-19: “huge rise” in deaths at home is not fully explained by virus, say experts. BMJ. 2020;369:m2115. doi: 10.1136/bmj.m2115 [DOI] [PubMed] [Google Scholar]