

Abstract
This study examines the frequency of hospitalization for all non–COVID-19-related conditions in a health system at the epicenter of the COVID-19 pandemic.
Concurrent with surges in hospitalizations for coronavirus disease 2019 (COVID-19), there has been evidence of decreased presentation for acute conditions, including myocardial infarction and stroke.1,2,3 We examined the frequency of hospitalization for all non–COVID-19-related conditions in a health system at an epicenter of the COVID-19 pandemic.4
Methods
We performed a retrospective study of admissions to 4 hospitals in the NYU Langone Health system between March 1 and May 9 in years 2018, 2019, and 2020. We excluded hospitalizations for COVID-19 using discharge diagnosis codes and hospitalizations with a discharge date after May 24 in each year. Weekly admission rates were examined for 4 time periods defined by the volume of COVID-19 hospitalizations: pre–COVID-19 (March 1 to May 9, 2018, and March 1 to May 9, 2019), early COVID-19 (March 1 to March 21, 2020), peak COVID-19 (March 22 to April 11, 2020), and late COVID-19 (April 12 to May 9, 2020). We categorized each hospitalization into both system-level (eg, digestive diseases) and diagnosis-level (eg, appendicitis) classifications using principal discharge diagnoses and software from the Agency for Healthcare Research and Quality.5 We examined weekly hospitalization rates for each time period for each system-level category and for the 20 most frequent diagnoses during the pre–COVID-19 period. We used incidence rate ratios to test for differences in hospitalization rates between periods and considered significance at P = .001, using the Šidák correction for multiple comparisons. Analyses were performed using R, version 4.0.1 (The R Foundation). The study was approved by the NYU Grossman School of Medicine Institutional Review Board, which approved a waiver of consent based on federal regulation 45 CFR §46.
Results
Between March 1 and May 9, 2020, there were 3657 non–COVID-19 hospitalizations, compared with 5368 and 6411 hospitalizations during the same period in 2018 and 2019, respectively. Hospitalization rates in the early COVID-19 period were similar to baseline (604.3 vs 584.5 per week; P = .19), decreased during the peak COVID-19 period (247.0 per week; P < .001), and slightly increased in the late COVID-19 period (309.3 per week; P < .001 vs peak COVID-19). Hospitalization rates decreased across all system categories during the peak COVID-19 period (Table). Similarly, we found a significant decline (all P < .001) in hospitalizations during the peak COVID-19 period for the following common diagnoses: septicemia (25.3 vs 51.1 per week), heart failure (9.0 vs 25.6), myocardial infarction (4.0 vs 16.3), cerebral infarction (7.0 vs 14.7), biliary tract disease (3.0 vs 11.7), epilepsy (3.7 vs 11.5), skin infections (2.7 vs 11.5), complications of care (3.7 vs 10.7), cardiac dysrhythmias (2.3 vs 10.6), appendicitis (2.7 vs 8.6), and chronic obstructive pulmonary disease (COPD; 2.3 vs 8.6) (Figure). In the late COVID-19 period, hospitalizations for myocardial infarction, biliary tract disease, and appendicitis began to recover—though not at a level of significance when accounting for multiple comparisons—while hospitalizations for septicemia, diabetes, and COPD did not (Figure).
Table. Weekly Hospitalization Rates Over Time Categorized by AHRQ Clinical Classifications Software Refined (CCSR) Tool.
| CCSR system category | Mean hospitalizations/wk | ||||||
|---|---|---|---|---|---|---|---|
| Baseline | Early COVID-19 | P valuea | Peak COVID-19 | P valueb | Late COVID-19 | P valuec | |
| Diseases of circulatory system | 104.3 | 106.3 | .75 | 39.7 | <.001 | 61.0 | <.001 |
| Digestive diseases | 88.6 | 75.3 | .02 | 29.7 | <.001 | 46.0 | .001 |
| Injury, poisoning, other external causes | 61.4 | 58.3 | .53 | 29.0 | <.001 | 40.3 | .01 |
| Infectious diseases | 55.2 | 58.7 | .45 | 26.7 | <.001 | 27.8 | .79 |
| Respiratory diseases | 50.4 | 69.0 | <.001 | 29.3 | <.001 | 15.0 | <.001 |
| Mental, behavioral, and neurodevelopmental disorders | 37.5 | 42.3 | .21 | 14.7 | <.001 | 23.5 | .009 |
| Genitourinary diseases | 30.9 | 29.3 | .65 | 15.0 | <.001 | 14.5 | .86 |
| Disease of the nervous system | 27.1 | 24.0 | .34 | 5.7 | <.001 | 10.0 | .05 |
| Endocrine, nutritional, and metabolic diseases | 26.2 | 31.7 | .09 | 15.7 | .001 | 16.3 | .85 |
| Pregnancy, childbirth, and the puerperium | 22.1 | 12.7 | .001 | 8.7 | <.001 | 10.0 | .57 |
| Neoplasms | 20.6 | 19.7 | .74 | 8.7 | <.001 | 12.5 | .13 |
| Musculoskeletal and connective tissue diseases | 17.1 | 17.3 | .93 | 2.3 | <.001 | 7.0 | .006 |
| Diseases of the skin and subcutaneous tissue | 14.0 | 15.3 | .55 | 3.3 | <.001 | 5.8 | .15 |
| Other diseases or conditions | 29.4 | 44.3 | <.001 | 18.7 | .001 | 19.8 | .75 |
Abbreviations: AHRQ, Agency for Healthcare Research and Quality; COVID-19, coronavirus disease 2019.
Comparison of early COVID-19 hospitalization rate to baseline hospitalization rate.
Comparison of peak COVID-19 hospitalization rate to baseline hospitalization rate.
Comparison of late COVID-19 hospitalization rate to peak COVID-19 hospitalization rate.
Figure. Weekly Hospitalization Rates for 20 Most Common Diagnosis Groups in the Baseline Time Period.
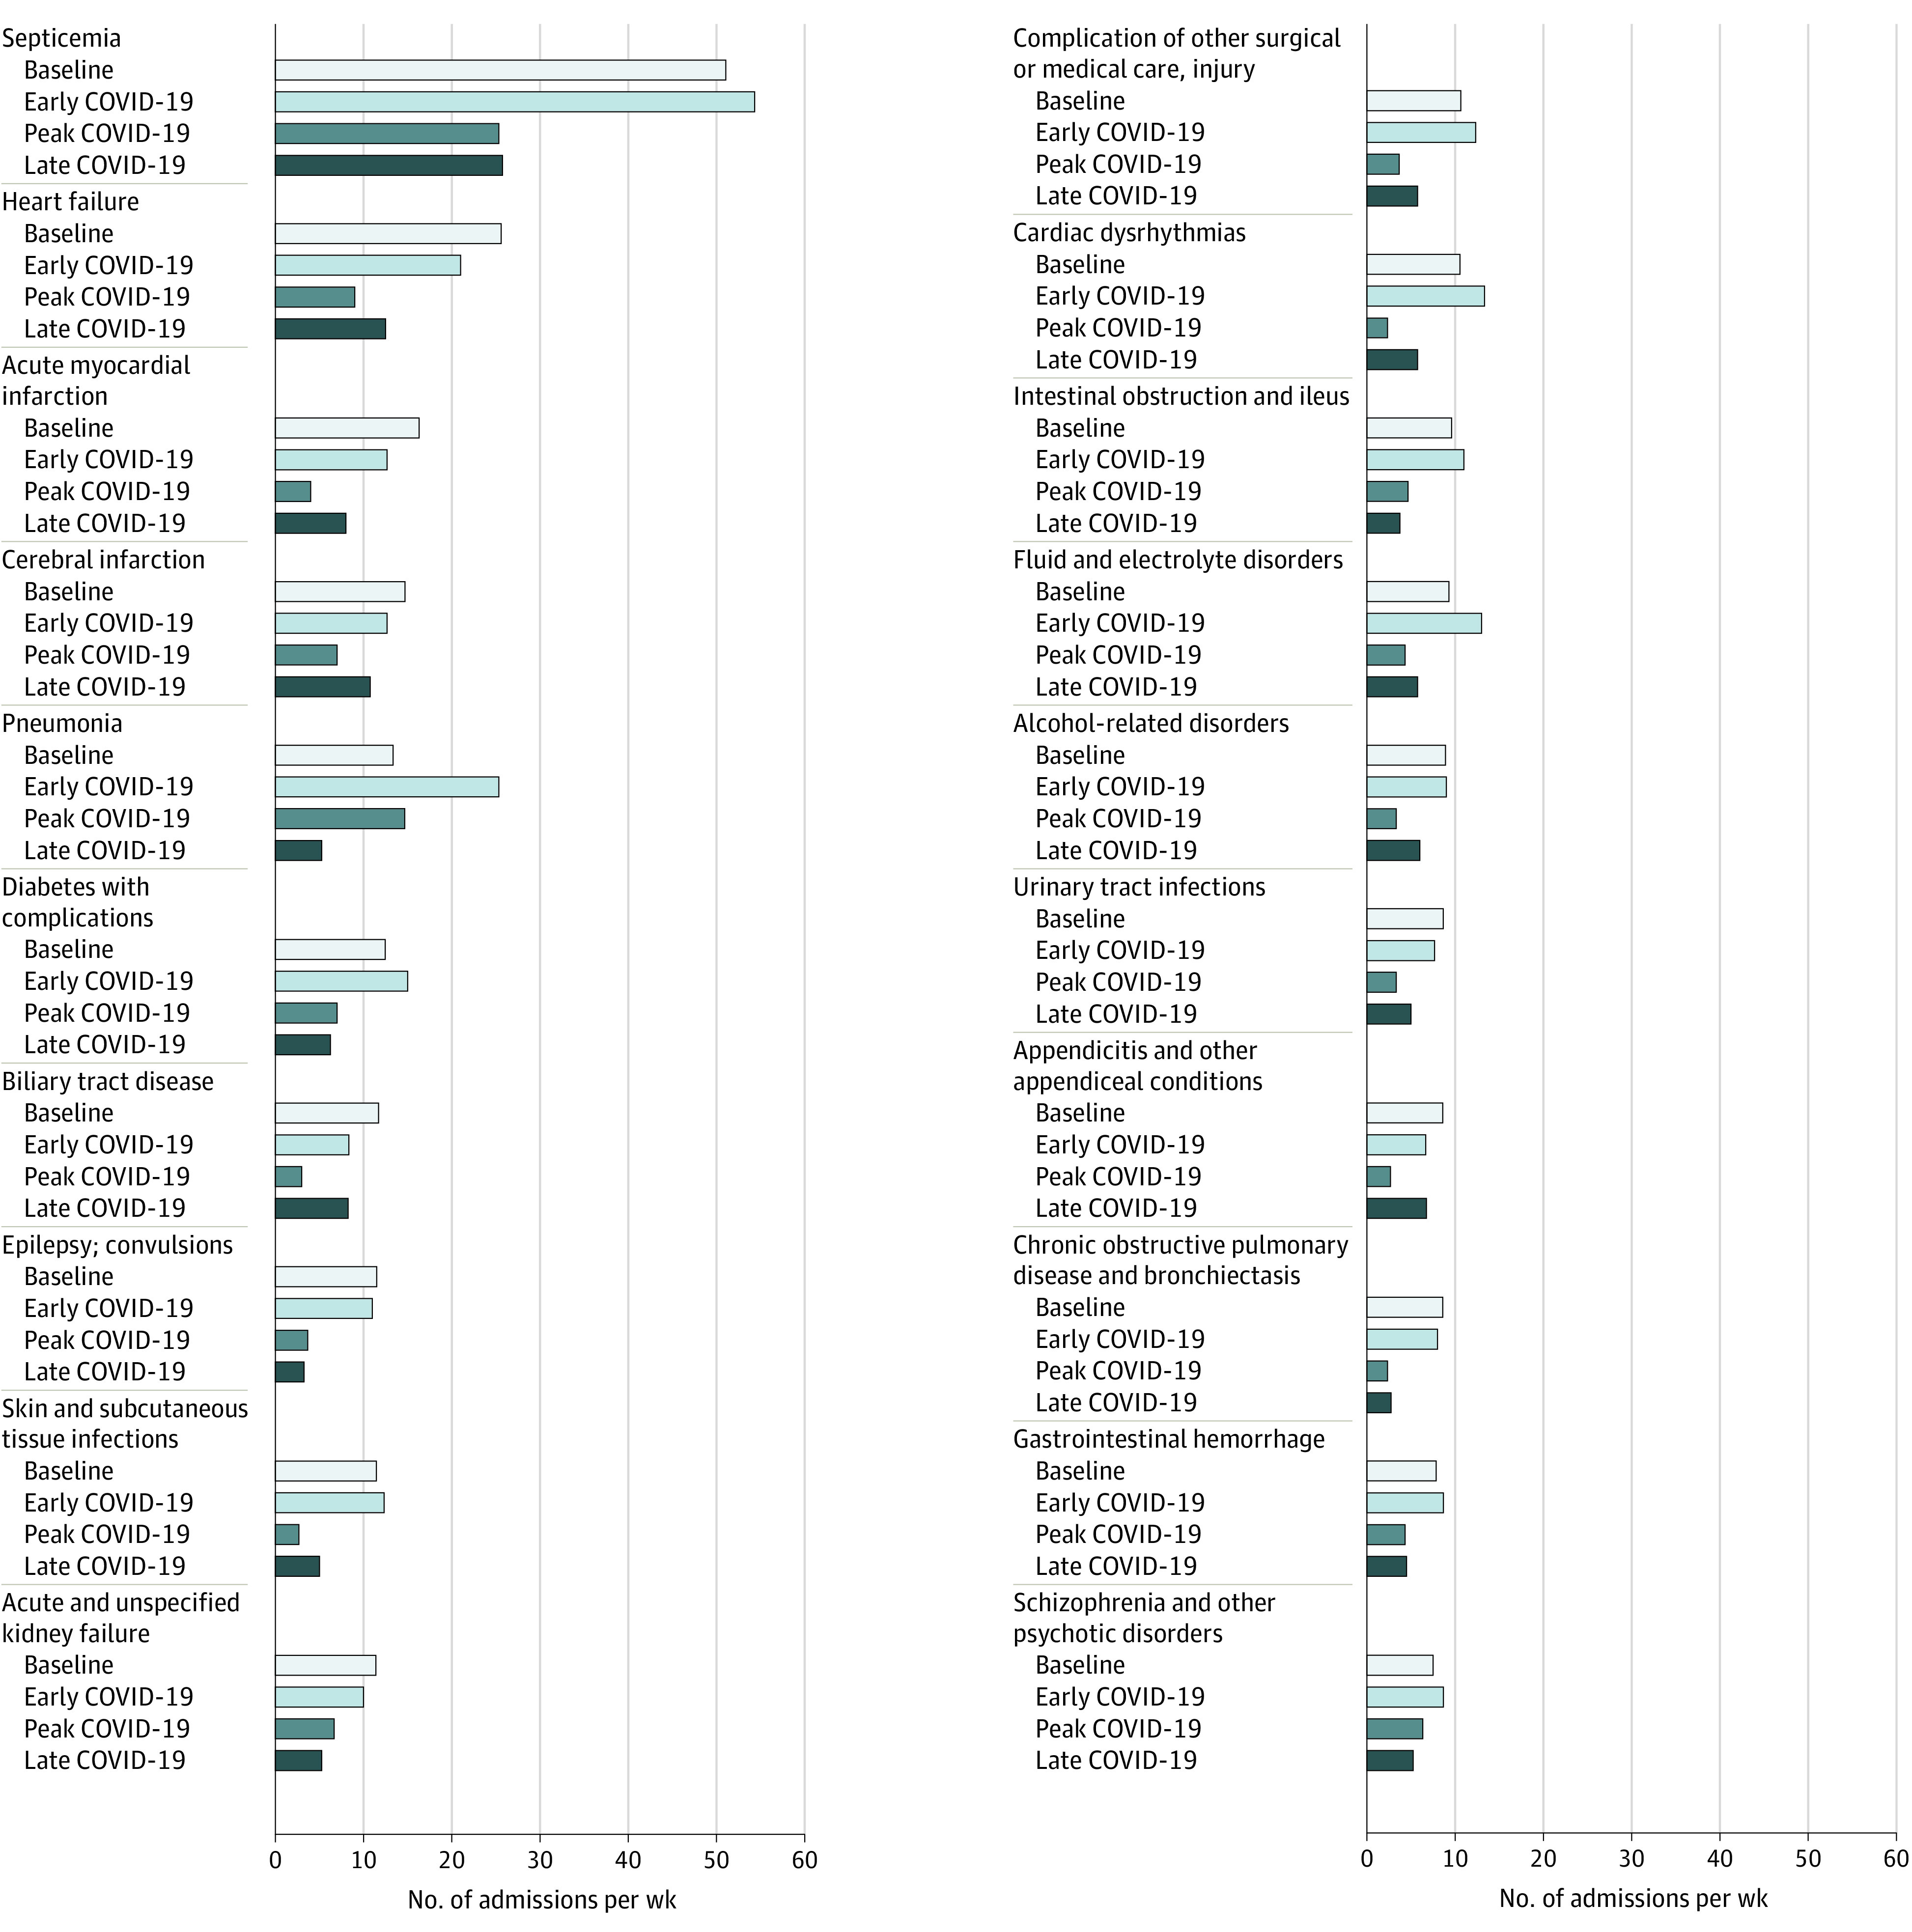
COVID-19 indicates coronavirus disease 2019.
Discussion
We found a substantial decrease in the number of non–COVID-19 hospitalizations across a range of diagnoses during the peak COVID-19 period. The decrease was observed for exacerbations of chronic conditions (heart failure, COPD), acute medical events that typically require inpatient management (myocardial infarction, appendicitis), and injuries. Given the breadth of these diagnoses, the causes for the decrease are likely multifactorial and include patient avoidance of emergency care for fear of COVID-192 or because of lost health insurance,6 increased threshold for hospitalization by clinicians, and changes in patient lifestyle and self-management in the context of social distancing. Notably, while hospitalizations for acute events began recovering in the late COVID-19 period, many of those related to chronic diseases generally did not. The implications of the decreases in hospitalizations for chronic disease are concerning for the possibility that sick patients are not obtaining necessary hospital care; alternatively, this trend could suggest prior overuse of hospitalization or improved self-management.
Study limitations include use of a single health system and reliance on diagnostic codes, which have imperfect capture of both COVID-19 and other diagnoses. However, we used a standard approach for classifying diagnoses.5
In an epicenter of COVID-19, we found that the pandemic was associated with substantial changes in hospitalization patterns for non–COVID-19 conditions. The long-term effects of hospitalization reductions on both patient outcomes and the health care system remain to be seen.
References
- 1.Kansagra AP, Goyal MS, Hamilton S, Albers GW. Collateral effect of Covid-19 on stroke evaluation in the United States. N Engl J Med. 2020;383(4):400-401. doi: 10.1056/NEJMc2014816 [DOI] [PMC free article] [PubMed] [Google Scholar]
- 2.Garcia S, Albaghdadi MS, Meraj PM, et al. Reduction in ST-segment elevation cardiac catheterization laboratory activations in the United States during COVID-19 pandemic. J Am Coll Cardiol. 2020;75(22):2871-2872. doi: 10.1016/j.jacc.2020.04.011 [DOI] [PMC free article] [PubMed] [Google Scholar]
- 3.Baum A, Schwartz MD. Admissions to Veterans Affairs hospitals for emergency conditions during the COVID-19 pandemic. JAMA. 2020;324(1):96-99. doi: 10.1001/jama.2020.9972 [DOI] [PMC free article] [PubMed] [Google Scholar]
- 4.Petrilli CM, Jones SA, Yang J, et al. Factors associated with hospital admission and critical illness among 5279 people with coronavirus disease 2019 in New York City: prospective cohort study. BMJ. 2020;369:m1966. doi: 10.1136/bmj.m1966 [DOI] [PMC free article] [PubMed] [Google Scholar]
- 5.Healthcare Cost and Utilization Project Clinical Classifications Software Refined (CCSR) for ICD-10-CM diagnoses. Accessed May 26, 2020. https://www.hcup-us.ahrq.gov/toolssoftware/ccsr/ccs_refined.jsp
- 6.Woolhandler S, Himmelstein DU. Intersecting US epidemics: COVID-19 and lack of health insurance. Ann Intern Med. 2020;173(1):63-64. doi: 10.7326/M20-1491 [DOI] [PMC free article] [PubMed] [Google Scholar]