

Abstract
Background and Aims
Intrahepatic cholangiocarcinoma (ICC) is a severe malignant tumor in which the standard therapies are mostly ineffective. The biological significance of the desmoplastic tumor microenvironment (TME) of ICC has been stressed but was insufficiently taken into account in the search for classifications of ICC adapted to clinical trial design. We investigated the heterogeneous tumor stroma composition and built a TME‐based classification of ICC tumors that detects potentially targetable ICC subtypes.
Approach and Results
We established the bulk gene expression profiles of 78 ICCs. Epithelial and stromal compartments of 23 ICCs were laser microdissected. We quantified 14 gene expression signatures of the TME and those of 3 functional indicators (liver activity, inflammation, immune resistance). The cell population abundances were quantified using the microenvironment cell population‐counter package and compared with immunohistochemistry. We performed an unsupervised TME‐based classification of 198 ICCs (training set) and 368 ICCs (validation set). We determined immune response and signaling features of the different immune subtypes by functional annotations. We showed that a set of 198 ICCs could be classified into 4 TME‐based subtypes related to distinct immune escape mechanisms and patient outcomes. The validity of these immune subtypes was confirmed over an independent set of 368 ICCs and by immunohistochemical analysis of 64 ICC tissue samples. About 45% of ICCs displayed an immune desert phenotype. The other subtypes differed in nature (lymphoid, myeloid, mesenchymal) and abundance of tumor‐infiltrating cells. The inflamed subtype (11%) presented a massive T lymphocyte infiltration, an activation of inflammatory and immune checkpoint pathways, and was associated with the longest patient survival.
Conclusion
We showed the existence of an inflamed ICC subtype, which is potentially treatable with checkpoint blockade immunotherapy.
Abbreviations
- αSMA
alpha smooth muscle actin
- Ca19‐9
carbohydrate antigen 19‐9
- CAF
cancer‐associated fibroblasts
- CIT
Tumor Identity Cards
- CMS
consensus molecular subtype
- HBC
Hepatobiliary Centre
- HpSC
hematopoietic stem cell
- IDH
isocitrate dehydrogenase
- FGFR
fibroblast growth factor receptor
- HCV
hepatitis C virus
- HSC
hepatic stellate cells
- ICC
intrahepatic cholangiocarcinoma
- MCP
microenvironment cell population
- PD‐L1
programmed death ligand 1
- TME
tumor microenvironment
Cholangiocarcinoma is the second most common primary liver malignant tumor. It is classified as intrahepatic, perihilar, and distal carcinomas according to the anatomical location of the tumor in the biliary tree. These types present clear differences in epidemiology, genetics, pathogenesis, and prognosis, but each of them is highly heterogeneous from a genetic and phenotypic point of view, particularly intrahepatic cholangiocarcinoma (ICC). ICC, which is the most extensively studied type of cholangiocarcinoma, develops in small intrahepatic bile ducts and accounts for about 20% of primary hepatic cancers.1 The diagnosis and staging of ICC are currently made by clinical examination, biochemical analysis, and imaging of abdomen to delineate the biliary anatomy.2 Usually, the disease already exhibits advanced nonspecific symptoms with large tumors at the time of diagnosis. Local invasion, regional extension, and distant metastases preclude resection in the majority of patients, and neither radiation nor standard‐of‐care chemotherapy regimen (gemcitabine and cisplatin) significantly improves survival.3 Patients with unresectable ICC generally have a survival shorter than 12 months after diagnosis. Recurrence is common after liver resection, and less than 40% of patients operated on survive more than 5 years.
ICC usually exhibits an abundant desmoplastic stroma containing a mixture of many nonimmune and immune cell types, such as cancer‐associated fibroblasts (CAFs) and tumor‐associated macrophages, which are negative prognostic factors.4, 5 It is known that a tumor‐reactive stroma provides an environment that favors tumor growth, metastasis, chemoresistance, and tumor‐specific immune tolerance. A definition of patients with ICC subgroups according to stromal signals and clinical features would permit a more effective disease management. Moreover, the therapeutic relevance of targeting stromal cell components to treat cancers is now well established. Immune checkpoint inhibitors, which can break tumor‐specific immune tolerance and thus allow tumor destruction, were used against advanced solid cancers with remarkable success in terms of the rate of responder patients and long‐lasting tumor responses in some patients and cancer types.6, 7, 8 Immune checkpoint inhibitors also showed promising results in some patients with advanced hepatocellular carcinoma,9 but their possible effects against ICC have not yet been studied. Limited observations of high frequencies of tumor‐infiltrating lymphocytes and programmed death ligand 1 (PD‐L1) expression in patients with ICC suggest that a programmed death‐1 (PD‐1)/PD‐L1–based immunotherapy might benefit some patients with ICC.10
Extensive molecular studies using omics‐based bulk‐tumor tests led to the definition of ICC subtypes, which corresponded to specific genetic alterations and oncogenic pathways and correlated with patient outcome.11, 12, 13, 14, 15, 16, 17, 18, 19, 20 These approaches were well suited to identifying drug‐specific deregulated pathways, such as the erythroblastic leukemia viral oncogene homolog 2 or fibroblast growth factor signaling16, 21 but provided little information on the tumor microenvironment (TME). Such information could help in understanding the mechanisms of disease progression and discovering prognostic and treatment predictive biomarkers.
Characterizing TMEs and then classifying tumors according to TME composition requires particular technical and computational approaches. For this purpose, the usefulness of mass/flow cytometry22 or single‐cell23 sequencing is limited by a number of factors, among which are the large amounts of fresh tumors needed, the scarcity of phenotypic markers, and a long implementation time. Several computational methods have recently been developed to characterize the immune and nonimmune stromal cell composition of bulk tumors from their whole transcriptomes.24, 25, 26 All the available software tools, e.g., CIBERSORT and DeconRNA Seq, provide the relative proportions of different cell types within the TM, independently of the abundance of the TME relative to cancer load.24, 25 The microenvironment cell population (MCP)‐counter, which relies on robust cell type–specific transcriptomic markers, provides, in addition, the actual amount (in arbitrary units) of each TME cell type within the sample, which allows the abundances of each cell type to be compared between samples.26
During this study, we used the extensively validated MCP‐counter tool to characterize the heterogeneous stromal landscape of ICCs from their bulk‐tumor transcriptomes in a cohort of 78 patients treated at the Paul‐Brousse University Hospital and in 488 ICC samples from 6 publicly available transcriptomic data sets. We found that the ICC tumors could be categorized into four subtypes based on the cellular composition of the TME. These immune subtypes were corroborated by immunohistochemistry in the Paul‐Brousse cohort and significantly correlated with patient outcomes in a cohort of 121 patients. The substantial differences in immune landscape, and thus immune evasion mechanisms, between the different ICC TME‐based subtypes suggest that each ICC subtype should require a specific therapeutic strategy. Notably, we identified an immune‐inflammatory subtype that is potentially treatable with checkpoint blockade immunotherapy and represents about 10% of patients with ICC.
Materials and Methods
Patient Cohort
We surveyed 116 samples and files from patients with cholangiocarcinoma who underwent partial hepatectomy (n = 108) or liver transplantation (n = 8) at the Hepatobiliary Centre (HBC) of the Paul‐Brousse University Hospital (Villejuif, France) with approval of the institutional review board of the INSERM (Institutional Review Board Number 11‐047). The clinical and pathological records of the patients were carefully reviewed to eliminate perihilar, distal, and combined hepato‐cholangiocarcinoma. Finally, 78 ICC specimens were kept for implementation of the study. The tissue biobank of the Hospital Group of South of Paris (AP‐HP) and the University of Paris‐Sud (Paris 11) provided the liver specimens.
Sample Selection, DNA Methylation, and RNA Gene Expression
Each frozen tumor block was cut at 5 μm, stained with hematein‐eosin‐saffron at two opposite ends, and analyzed by an expert in liver pathology (C.G.) to evaluate the proportion of cancer cells, degree of fibrosis/necrosis, and percent cellularity. Seventy‐eight ICC samples were subjected to bulk‐tumor RNA gene expression profiling, DNA‐methylome analysis, and immunohistochemistry for CAF and immune cell markers. Distant nontumor tissues were analyzed for 31 ICC samples. Epithelial and stromal compartments were microdissected by laser capture in 23 ICC samples. The transcriptome and methylome profilings were performed with the Affymetrix Human Transcriptome Array 2.0 and Illumina HumanMethylation450 Array, respectively. Array data are available at ArrayExpress (accession number E‐MTAB‐6389).
Quantification of Tumor‐Infiltrating Immune Cells
Tumor‐infiltrating immune and nonimmune cells were quantitatively determined from the bulk‐tumor gene expression data using the MCP‐counter package based on cell type–specific transcriptomic markers. To this aim, we used a set of 14 gene signatures comprising 11 signatures from TME cell populations (activated fibroblasts, innate and adaptative immune cells) and 3 functional signatures (complement, inflammation, immune checkpoints). We also analyzed 6 public data sets (GSE26566, GSE32958, GSE89749, EGA00001000950, GSE33327, TCGA), including 488 ICC samples and 66 paired nontumor liver samples.
Statistical Methods
The analyses were performed using R software. A hierarchical clustering was applied to classify ICC tumors into unsupervised clusters using the expression data of the 14 TME signatures. Consensus immune subtypes were obtained across data sets by hierarchical clustering of centroid correlations. Associations between immune subtypes, transcriptomic subtypes, and clinicopathological covariates were analyzed with chi‐square or Fisher’s exact tests. The enrichment analyses of 20,929 signaling pathways were analyzed by hypergeometric tests. Overall survival curves were calculated by the Kaplan–Meier method, and differences between curves were assessed using logrank tests. P values < 0.05 were deemed statistically significant.
Full details of the methods used are provided in the Supplementary Materials and Methods.
Results
Current Transcriptome‐Based Classifications Fail to Recognize TME Diversity in ICC
Three different molecular classifications of ICCs into two prognostic subgroups based on whole‐transcriptome analysis have been reported.11, 12, 13 The poor‐prognosis subgroup was associated with stem cell–like (hepatic stem cell [HpSC]) features in the classification proposed by Oishi et al.12 and with an activation of proliferative signaling (Cluster 2) in those proposed by Andersen et al.11 and Sia et al.13 We performed bulk‐tumor gene expression and histopathological analyses of 78 well‐characterized ICC samples from patients who underwent partial hepatectomy or liver transplantation at the HBC between 2001 and 2014. Clinical and pathological characteristics of the cohort are summarized in Table 1. We assigned each ICC sample to the appropriate subtypes according to the three reported ICC classifiers and evaluated the correlation between the resulting classifications using Andersen et al.’s classifier as a reference (Fig. 1A). Oishi et al.’s classifier appeared to be highly (P < 0.001), and Sia et al.’s moderately (P < 0.05), concordant with Andersen et al.’s classifier. This difference is perhaps because Andersen et al. and Oishi et al. used frozen and Sia et al. used formalin‐fixed, paraffin‐embedded samples. We also classified our ICC samples using the Tumor Identity Card (CIT) unsupervised classifier developed by the French charity Ligue Nationale Contre le Cancer. This yielded four transcriptomic classes named icc1 to icc4, which were found to be highly concordant with the reported classifications (Fig. 1A). We confirmed the presence of the four classes of the CIT classification in the GSE26566 (66 ICC and 59 paired nontumor liver samples), GSE32958 (16 ICC, 7 paired nontumor liver samples), and GSE32225 (149 ICC samples) public data sets (Supporting Fig. S1A). The icc4 subclass, which had the poorest overall survival in the Paul‐Brousse cohort, corresponds to the published Cluster 2 and stem cell–like poor‐prognosis subclasses (Supporting Fig. S1B). Thus, all the existing transcriptomic classifications seem to agree on the existence of a poor‐prognosis subclass, which roughly corresponds to Andersen et al.’s Cluster 2 subclass. The good‐prognosis subclass (Cluster 1) seems to be less robust, being subdivided into several subsets, especially when the CIT classifier is used. We next carried out a thorough examination of the histopathological features (cancer cell aspect, abundance and cellularity of tumor stroma) of all 78 ICC tumors from the HBC. We found that the histological aspects of tumor tissues were spatially homogeneous in each sample but were highly variable (especially as regards the stromal cell compartment) from sample to sample inside any molecular subclass. No obvious systematic difference was observed between samples belonging to different subclasses (Fig. 1B). This highlights the fact that previously used methods yielded average signals from multicellular tissues and were insensitive to the phenotypic complexity of the ICC tumors. We therefore used the MCP‐counter method, which yields distinct signals for distinct TME cells.
Table 1.
Clinical and Pathological Features of the Paul‐Brousse Patient Cohort
| Variables | n = 78 |
|---|---|
| Sex, male (%) | 38 (48.7) |
| Median age (IQR) | 62 (52‐69) |
| Obesity, BMI ≥ 30 | 13 (17.1) |
| Risk factor (%) | |
| Primary sclerosing cholangitis | 6 (7.7) |
| Alcohol abuse | 9 (13) |
| Hemochromatosis | 2 (2.8) |
| Diabetes | 7 (9.1) |
| Metabolic syndrome | 2 (2.5) |
| Hepatitis C | 2 (3.1) |
| Hepatitis B | 3 (4.6) |
| Underlying liver (%) | |
| Healthy | 20 (27) |
| Cirrhosis | 12 (5.4) |
| Fibrosis | 28 (16.2) |
| Steatosis | 38 (27) |
| Cholestasis | 5 (4.1) |
| Tumor differentiation (%) | |
| Well | 22 (29.7) |
| Moderate | 37 (50) |
| Poor | 15 (20.3) |
| Multiple nodules (%) | |
| Absent | 46 (59) |
| Present | 32 (41) |
| Tumor size, cm (%) | |
| <5 | 16 (20.5) |
| >5 and <10 | 40 (51.3) |
| >10 | 22 (28.2) |
| Vascular invasion (%) | |
| Absent | 27 (34.6) |
| Present | 51 (65.4) |
| Perineural invasion | |
| Absent | 56 (71.8) |
| Present | 22 (28.2) |
| Necrosis (%) | |
| Absent | 50 (65.8) |
| Present | 26 (34.2) |
| IDH1 mutation (%) | |
| Absent | 70 (89.8) |
| Present | 8 (10.2) |
| IDH2 mutation (%) | |
| Absent | 74 (94.9) |
| Present | 4 (5.1) |
| Median Ca19‐9 value (U∙m) | 73 (18‐527) |
| Preoperative chemotherapy (%) | |
| Absent | 53 (67.9) |
| Present | 25 (32.1) |
| Events | |
| Recurrence | 54 (69.2) |
| Death | 51 (67.1) |
Abbreviations: BMI, body mass index; IQR, interquartile range.
Figure 1.
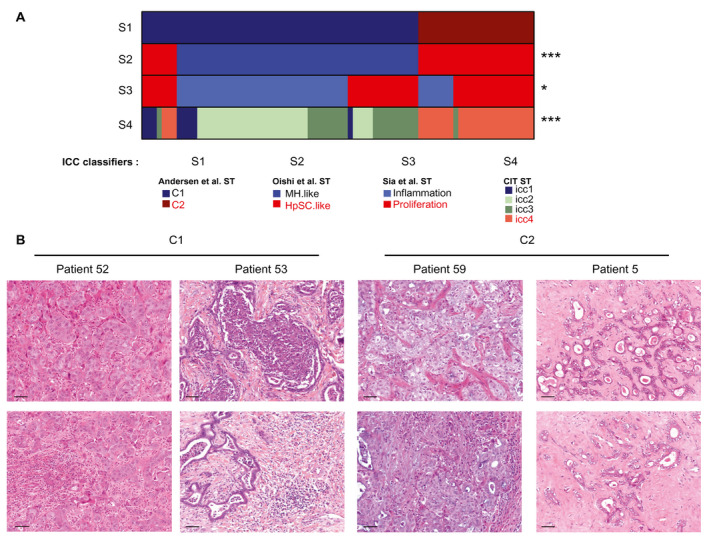
The existing molecular subtypes of ICC display highly variable TME patterns. (A) Visualization of the contingency tables of four ICC classifiers (S1‐S4) applied to the 78 ICC transcriptomes of this study. S1: Andersen et al.’s classification.11 S2: Oishi et al.’s classification.12 S3: Sia et al.’s classification.13 S4: this study. S1 was used as reference. The order of ICC tumors along the horizontal axis is the same for all the classifications. ST, subtypes. *P < 0.05, ***P < 0.001. P: Chi‐square‐test P value. (B) Histological analysis of tumors assigned to the C1 and C2 molecular subtypes of Andersen et al.’s classification. Representative tumor cells (top) and TMEs (bottom) for a given ICC patient. Scale bar: 50 µm. HpSC.like, hepatic stem cell; MH.like, Mature hepatocyte; ST, subtype.
TME‐Based Classification Stratifies ICCs into Four Immune Subtypes
To build a TME‐based classification of ICC tumors, we quantified several immune and nonimmune cell populations in the ICC samples using MCP‐counter, a computational method based on the use of specific cell type transcriptomic signatures. We used a set of 14 gene signatures standing for the main infiltrated cell populations of the microenvironment of ICC tumors and some essential components of tumor stroma interaction. We included the signatures of 8 TME cell populations labeled Fibroblasts, NK_or_T, Cytotoxic, B_derived, Myeloid, Lymphoid, T_adaptive, and Monocyte_derived (MCP‐counter package v0.1)26 (Supporting Table S1). The Fibroblasts signature includes gene expression data of a diversity of primary and activated fibroblasts. Knowing the important role played by hepatic stellate cells (HSC) transdifferentiated into matrix‐producing myofibroblasts in liver fibrogenesis,27, 28 we added 3 signatures corresponding to quiescent, activated, and fully transdifferentiated HSCs.29 Finally, we added three functional signatures, namely, a signature of the complement system reflecting liver activity, a signature of genes involved in inflammatory pathways and cancer development,30 and a signature of a set of immune checkpoint molecules known for their therapeutic interest.31 We defined a training data set (n = 198) consisting of the CIT and GSE89749 20 sets, and a validation data set (n = 368) composed of the GSE26566,11 GSE33327,13 EGA00001000950,32 TCGA, and GSE32958 12 sets. The correlations between the different gene signatures in the training data set revealed that the 11 TME cell population signatures aggregated in 3 distinct clusters corresponding to, firstly, activated fibroblasts (activated HSCs, fibroblasts, myofibroblasts), secondly, innate immune (monocyte_derived, myeloid) cells grouped with quiescent HSC, and thirdly, adaptive immune (NK_or_T, B_derived, cytotoxic, lymphoid) cells (Fig. 2A). The first (fibroblast) cluster showed a very low correlation with the other two clusters, indicating an unrelated regulation of immune cell activation and fibrogenesis. Hierarchical clustering using all 14 gene signatures showed various immune protosubtypes of ICC with different immune patterns in the CIT and GSE89749 data sets (Fig. 2B), but only four immune subtypes emerged from the centroid‐based correlation of the training data set (Fig. 2C,D). These immune subtypes named I1 to I4 contained 48%, 9%, 13%, and 28% of the ICCs, respectively. The same approach applied to the validation data sets yielded the same 4 immune subtypes containing 46%, 13%, 19%, and 22% of the ICCs, respectively (Supporting Fig. S2). Subtype I1 displayed an immune desert pattern characterized by very weak expressions of all the molecular and functional TME signatures (Fig. 2D and Supporting Fig. S2C). Subtype I2 showed a reactive immunogenic pattern characterized by high amounts of recruited innate and adaptive immune cells, a strong activation of inflammatory and immune checkpoint pathways, and a significant amount of activated fibroblasts and quiescent HSCs. Subtype I3, called myeloid‐rich for short, was characterized by a moderate‐to‐strong expression of monocyte‐derived, myeloid and, to a lesser extent, fibroblast signatures as well as low expression of lymphoid signatures. Subtype I4 had mesenchymal features with a strong expression of the three signatures of activated fibroblasts. We tested the strength of the association between this immune and the four existing whole‐transcriptome classifications (Fig. 3A). We found that immune subtype I4 largely coclustered with the poor‐prognosis (C2, HpSC‐like, proliferation, icc4) whole‐transcriptome subtypes, whereas immune subtype I1 coclustered with the better‐prognosis subtypes (C1, MH‐like, Inflammation, icc2). Immune subtypes I2 and I3 coclustered with both better‐prognosis (C1) and poor‐prognosis (HpSC‐like, proliferation, and icc4) whole‐transcriptome subtypes, highlighting the two‐fold (immune active and mesenchymal) nature of the TME in subtypes I2 and I3 (Fig. 3A). We quantified tumor cell infiltration in the different molecular subtypes using a score obtained by summing up the RNA expression levels of the specific gene markers of the 11 TME cell types (irrespective of their nature) tumor by tumor (Supporting Fig. S3). The immune subtypes ranked in ascending order of infiltration score are I1, I3, I4, and I2, in agreement with their TME gene profiles. Although, for a given classification system, the different whole‐transcriptome subtypes could be split into strongly or weakly infiltrated tumors, they all contain tumors belonging to all four immune subtypes, confirming the better reliability of the immune subtype classification. This is further illustrated by the fact that most of the tumors belonging to Sia et al.’s so‐called “inflammation” class were found to be immunologically silent (subtype I1), whereas those of the “proliferation” class mostly belonged to non‐I1 subtypes, in particular, immune active I2 or mesenchymal I4 subtypes (Fig. 3A).
Figure 2.
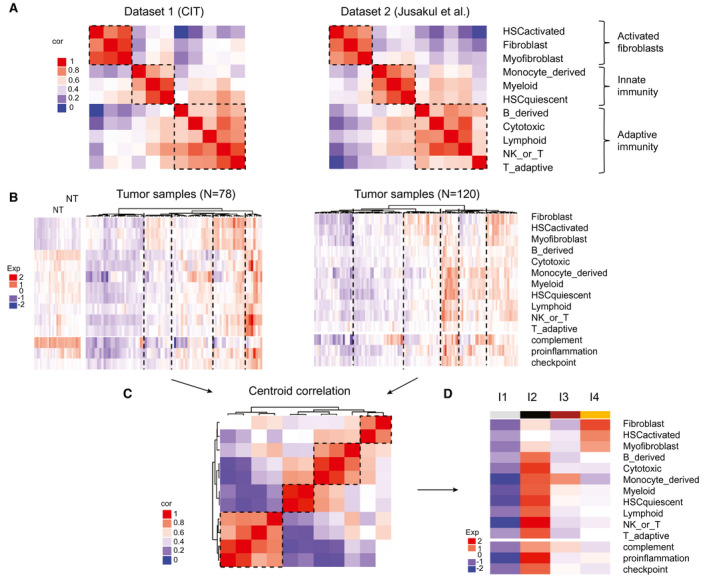
A TME‐based classification stratifies ICCs into four immune subtypes. (A) Correlation matrices of 11 signatures of immune and stromal cell populations in two data sets. Dataset1 (CIT): this study; Dataset2 (Jusakul et al.): GSE89749.20 Color scale: Pearson correlation coefficient from 0 (blue) to 1 (red). (B) Hierarchical clustering of the ICCs of the 2 data sets using expression levels of 14 stromal and immune signatures. The number of TME‐based clusters for each data set was determined by the silhouette metric. Color scale: expression level from −2 (blue) to +2 (red). (C) Centroid correlation of the clusters identified in (B) highlighting the existence of four TME‐based subtypes. Color scale: Pearson correlation coefficient from 0 (blue) to 1 (red). (D) Heatmap of the centroids of the four TME‐based subtypes labeled from I1 to I4. Color scale: expression level from low (blue) to high (red). Cor, correlation; exp, expression; NK, natural killer; NT, nucleotide.
Figure 3.
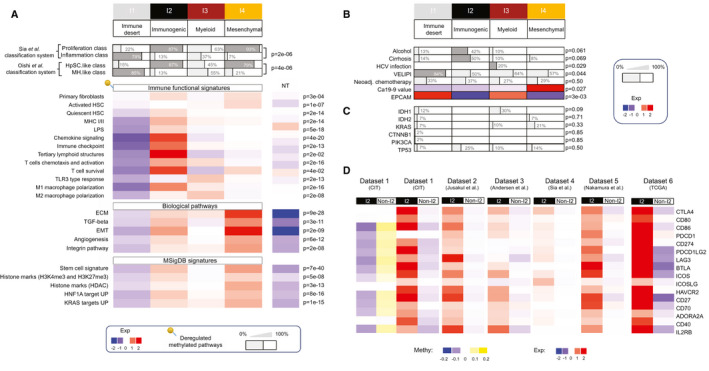
Functional orientation of the different ICC immune subtypes. (A‐C) Clinico‐molecular covariates attributed to the different immune subtypes with their phenotypic denominations. (A) Top: proportion of samples belonging to the reported ICC molecular classification. Bottom: heatmap of the mean expression levels of gene sets involved in the indicated pathways and Molecular Signatures Database signatures. Color scale: from low (blue) to high (red). P values: hypergeometric test. Pins: deregulated methylated pathways. (B) Proportion of samples harboring the indicated clinical covariate in a given immune subtype. VELIPI; vascular emboli, lymphatic invasion, and perineural invasion histological criteria. Ca19‐9 value: serum concentration of the tumor marker carbohydrate antigen 19‐9. Neoadj: neoadjuvant. Color scale: expression level from −2 (blue) to +2 (red). (C) Proportion of samples harboring the indicated mutated genes. (D) Mean expression levels of a set of immune checkpoint molecules in the I2 compared with the non‐I2 subtypes in all six ICC data sets. Color scale: expression level (Exp) from −2 (blue) to +2 (red). DNA methylation levels of the immune checkpoints in the data set from this study (CIT). Color scale: beta value (methylation [Methy]) from −0.2 (blue) to +0.2 (yellow). ADORA2A, adenosine A2A receptor; BTLA, B and T lymphocyte attenuator; EMT, epithelial‐mesenchymal transition; EPCAM, epithelial cell adhesion molecule; Exp, expression; HAVCR2, hepatitis A virus cellular receptor 2; HDAC, histone deacetylase; ICOS, inducible T cell costimulatory; ICOSLG, inducible T cell costimulatory ligand; IL2RB, interleukin 2 receptor subunit beta; LAG3, lymphocyte activation gene 3; PDCD, programmed cell‐death; PDCD1LG2, Programmed Cell Death 1 Ligand 2; PIK3CA, phosphatidylinositol‐4,5‐bisphosphate 3‐kinase catalytic subunit alpha; TP53, tumor protein 53.
Immune Classification of ICCs Is Supported by Immunophenotypic Analysis
We performed immunostaining and quantified staining intensities in liver tumor sections from 64 of the 78 ICCs of known immune subtypes using several markers for immune and nonimmune cells, namely, T lymphocytes (CD4, CD8), memory T cells (CD45RO), B‐lymphocytes (CD20), macrophages (CD68), fibroblastic cells (alpha smooth muscle actin [αSMA]), and mesenchymal cells (vimentin). The distribution of the markers was remarkably reproducible from tumor to tumor in a given immune subtype and varied markedly from subtype to subtype (Fig. 4). αSMA and vimentin are strongly expressed in the desmoplastic stroma in most immune subtypes, in agreement with reports (Supporting Fig. S4).33, 34 No significant difference in αSMA and vimentin expressions was found between immune subtypes. In subtype I1, however, stromal fibroblasts express αSMA and vimentin only weakly, or not at all, whereas tumor cells strongly express vimentin. Overall stromal cellularity is low in subtype I1, high in subtype I4, and intermediate in subtypes I2 and I3 (Supporting Fig. S4). Subtype I2 displays a massive peritumor and intratumor infiltration of CD4+, CD8+, and CD45RO+ lymphocytes (Fig. 4). B‐lymphocyte clusters and scattered innate immune cells (macrophages) are also observed in the stroma of Subtype I2. By contrast, Subtype I1 shows no immune cells of any type inside the tumors, but only a weak occasional infiltration of T cells in the tumor margin. Subtype I3 contains a high density of macrophages and a strong peritumor CD45RO+ T cell infiltration, which slightly penetrates into tumors. Subtype I4 has few immune cells inside the tumors and a low density of CD4+ T cells and macrophages in the tumor margin. Thus, the phenotypic features of the ICC tumors are in good agreement with the immune classification of ICCs based on gene expression profiles of tumor MCPs. We also compared the present immune subtype classification with the histological classifications proposed by Nakanuma and Kakuda35 and Sigel et al.36 We found that no immune subtype displays a specific histological pattern. About 90% of our ICC samples belonged to Sigel et al.’s small duct class in all the immune subtypes.
Figure 4.
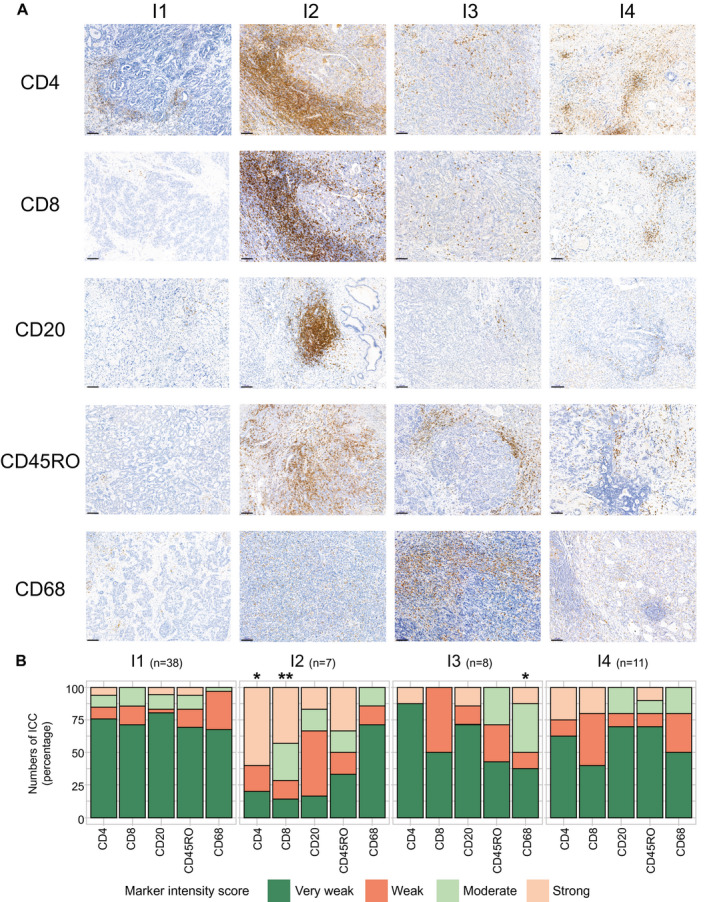
Tissue immunostaining supports the existence of distinct ICC immune subtypes. (A) Representative immunohistochemical images of formalin‐fixed paraffin‐embedded ICC samples belonging to the indicated TME‐based subtypes and stained with the indicated specific antibodies. Visualization of different areas of the same tumor sample belonging to the indicated subtypes. Scale bar: 100 µm. (B) Quantification of staining intensities for the indicated immune markers performed in 64 ICC samples grouped into immune subtypes labeled from I1 to I4. *P < 0.05, **P < 0.01 (analysis of variance test).
Functional Characterization of the Immune Subtypes
To cast light on the stroma‐cancer interaction in the different immune subtypes, we performed a functional enrichment analysis of the differentially expressed genes and a correlation study between molecular traits and clinical data in 520 ICCs (CIT, GSE26566, GSE33327, GSE89749, and EGA00001000950 data sets). To refine immune characterization, we used an additional set of functional immune signatures, including homemade signatures (Supporting Table S2) and CIBERSORT (Supporting Table S3). This revealed great differences in immune response and signaling between the different subtypes (Fig. 3A). The I1 immune desert subtype displays a strong attenuation of tumor and stromal immune signaling, supporting its characterization as immune desert, with most of the down‐regulated immune pathways being also hypermethylated (Fig. 3A). I2 immunogenic subtype displays a strong lymphoid and myeloid immune response in an inflammatory microenvironment, including an overexpression of major histocompatibility complex (MHC) class I and class II molecules, tertiary lymphoid structures, immune checkpoint molecules (including CD86, cytotoxic T lymphocyte antigen 4 [CTLA4], PD‐L1, PD‐L2) as well as regulators of macrophage polarization and nuclear factor kappa B pathway activation on lipopolysaccharide stimulation (Fig. 3A,D). The overexpression of immune checkpoints is associated with a hypomethylation of the corresponding genes in I2 compared with non‐I2 subtypes, suggesting an epigenetic regulation of immune checkpoints (Fig. 3D). The most salient feature of the I3 myeloid subtype is a relatively strong expression of M2‐polarized macrophage signature (Fig. 3A). Pathways and functional enrichment analyses showed that three important signaling pathways (T cell chemotaxis and activation, T cell survival, toll‐like receptor 3 [TLR3] type response) were differentially expressed according to immune subtype. The I3 myeloid subtype was significantly enriched for TLR3 type response and T cell chemotaxis/activation (the latter comprising the CD27–CD70 costimulatory pathway, which promotes T cell priming and memory) but not for T cell survival (unlike I2 immunogenic subtype, in which both T cell chemotaxis/activation and survival are activated). These observations may explain that, in I3 myeloid subtype, infiltrating T cells are not capable of forming an efficient immune adaptive response against ICC. CIBERSORT analysis showed that 8 out of the 22 subsets of tumor‐infiltrating immune cells used in this method were differentially represented in the different immune subtypes, with an enrichment of M2 macrophages in I3 and CD8+ T cells in I2, supporting the myeloid and lymphoid nature of these subtypes, respectively (Supporting Table S3). The I4 subtype, called mesenchymal for short, displays a high abundance of activated HSC and an abundance of primary fibroblasts similar to that of I2 immunogenic subtype. It displays a set of enhanced tumorigenic factors involved in transforming growth factor beta (TGF‐β) and integrin signaling, extracellular matrix remodeling, epithelial‐mesenchymal transition, and angiogenesis (Fig. 3A). Moreover, it overexpresses a stem cell signature and several targets of v‐Ki‐ras2 Kirsten rat sarcoma viral oncogene homolog 2 (KRAS) and hepatocyte nuclear factor 1A compared with the other immune subtypes. We sought correlations between the available clinico‐biological features of the Paul‐Brousse cohort and the different immune subtypes. The covariates that were found to be significant are displayed in Fig. 3B,C and those that were not significant in Supporting Table S4. We found no significant concentration of patients given neoadjuvant chemotherapy in a particular immune subtype. In other words, we did not detect any impact of neoadjuvant chemotherapy on the ICC subtype. We also found that necrosis was evenly distributed among subtypes, and not preferentially accumulated in the I3 myeloid subtype. Globally, correlation studies revealed some significant clinicopathological differences between the immune subtypes. The I1 immune desert subtype has a higher proportion of tumors with vascular emboli, lymphatic invasion, and perineural invasion than the other subtypes. The I2 immunogenic subtype has an important proportion of alcohol drinking and patients with cirrhosis, suggesting a link between the immune active response of this subtype and cirrhosis pathogenesis (immune dysfunction, systemic inflammation).37 The I3 myeloid subtype includes all the hepatitis C virus (HCV)‐infected tumors, consistent with the mostly myeloid nature of this subtype and the ability of dying cells and HCV to trigger strong innate immune responses. Regarding prognosis markers, levels of carbohydrate antigen 19‐9 (Ca19‐9) culminated in I4 mesenchymal and those of epithelial cell adhesion molecule in I1 immune desert subtypes. Knowing the possible impact of somatic alterations on the immune response to cancer, we studied correlations between immune subtypes and gene mutations. We found no significant association between immune subtypes and isocitrate dehydrogenase (IDH) 1, IDH2, KRAS, CTNNB1, phosphatidylinositol‐4,5‐bisphosphate 3‐kinase catalytic subunit alpha, or tumor protein 53 mutations (Fig. 3C) but found a positive correlation between the ICCs classified as “hypermutated” by Nakamura et al. using whole‐exome sequencing32 and I2 immunogenic subtype (P = 6e‐04). We did not find any activation of β‐catenin signaling. We laser microdissected 23 ICCs, most (14) of which were I1 immune desert samples. The stromal or epithelial nature of the different microdissected specimens was confirmed by transcriptomic analysis (Fig. 5A and Supporting Fig. S5). Laser microdissection data essentially confirmed the existence of a depleted immune TME in I1 compared with non‐I1 subtypes, (P < 1e‐4) validating the MCP‐counter method we used in bulk tumors. They also revealed, in microdissected tumor cells of I1 subtype, deregulated signaling pathways that had not been detected in bulk‐tumor transcriptomes (Fig. 5B). The TME depletion was associated with a hypermethylation of the corresponding genes, as was also observed in bulk ICC samples. The main up‐regulated pathways found in microdissected I1 tumor cells were pathways involved in xenobiotic metabolism, cell growth, and development through PPAR, fibroblast growth factor receptor (FGFR) and WNT signaling, respectively (P < 1e‐4; Fig. 5C). We note that an activation of these signaling pathways in non‐T cell‐inflamed subtypes has been reported in several other solid cancers.38, 39 We found an anticorrelation between gene expression level and methylation level for some deregulated pathways, particularly immune and FGFR pathways, suggesting that they are epigenetically regulated (Fig. 5C).
Figure 5.
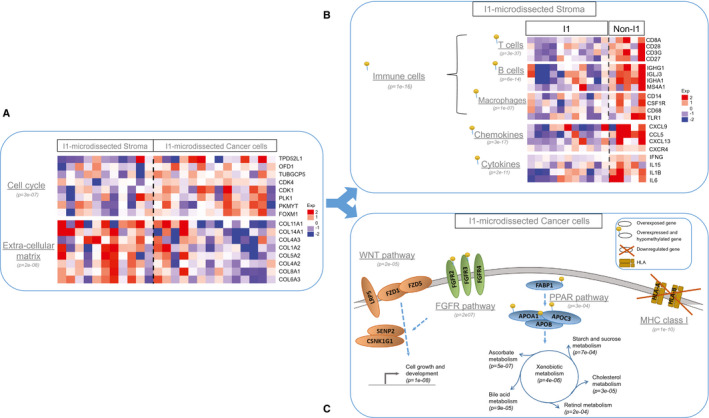
Functional features of laser microdissected stromal and tumor cells of immunologically silent ICCs. (A) Mean expression levels of genes involved in cell cycle regulation or extracellular matrix remodeling in I1 ICC samples enriched in stromal or cancer cells. (B) Mean expression levels of the immune response genes most differentially expressed in I1 and non‐I1 ICCs in microdissected stromal cells. (C) Sketch of the genes and pathways most differentially expressed in I1 and non‐I1 microdissected cancer cells. Gray stripe: plasma membrane. (A‐C) P values: hypergeometric test. Color scale: expression level (Exp) from −2 (blue) to +2 (red). Pins: deregulated methylated pathways. APO, apolipoprotein; CDK, cyclin‐dependent kinase; COL11A1, collagen type XI alpha 1 chain; COL14A1, collagen type XIV alpha 1 chain; CSNK1G1, casein kinase 1 gamma 1; FABP1, fatty acid–binding protein 1; FOXM1, forkhead box M1; FZD1, frizzled homolog 1; HLA, human leukocyte antigen; LRP5, low‐density lipoprotein receptor‐related protein 5; OFD1, oral‐facial‐digital syndrome type 1; PKMYT, protein kinase, membrane associated tyrosine/threonine 1; PLK1, polo‐like kinase 1; PPAR, peroxisome proliferator‐activated receptor; SENP2, sentrin‐specific protease 2; TPD52L1, tumor protein D52 like 1; TUBGCP5, tubulin gamma complex associated protein 5.
Stromal and Immune Classification Correlates With Patient Outcome
We investigated how patient outcome correlated with TME cell composition and immune subtype for the Paul‐Brousse cohort (n = 78) and for those patients of the GSE89749 data set for whom survival data were available (n = 45). Activated fibroblast signatures were found to be associated with poor prognosis by univariate analysis, consistent with the well‐known detrimental role played by CAFs in cancer progression and metastasis4 (Fig. 6A and Supporting Fig. S6A). The bivariate analysis reveals a better prognosis associated with immune cells, which remained hidden by the detrimental effect of CAFs in the univariate analysis, highlighting the prognosis value of sets of (as opposed to individual) TME cell types and suggesting that some immune cells partly counteract the negative effect of CAFs (Fig. 6B and Supporting Fig. S6B). Significant differences in overall survival were found to exist between the different immune subtypes, suggesting that they might be clinically relevant subgroups (Fig. 6C and Supporting Fig. S6C). The 5 and 10‐year average survivals of 78 patients of the Paul‐Brousse cohort were 38% and 12%, respectively. The median survival time was 42 months for I1 immune desert subtype, 73 months for I2 immunogenic subtype, 25 months for I3 myeloid subtype, and 19 months for I4 mesenchymal subtype. The highest survival scores (60% at 5 years, 40% at 10 years) were those of I2 and the lowest (10% at 5 years, 0% at 10 years) those of I4 (Fig. 6C). A survival advantage of I1 and I2 with respect to I3 and I4 was also found in the pooled (Paul‐Brousse and GSE89749) data set (Supporting Fig. S6C). The survival plot according to immune subtype for the Paul‐Brousse patients who were not given neoadjuvant chemotherapy (n = 51) was not qualitatively different from that of the whole Paul‐Brousse cohort, indicating that neoadjuvant chemotherapy did not have potentiator effects on any subtype (Fig. 6D). Univariate and multivariate Cox analyses showed that only the presence of satellite nodules was significantly associated with a poor overall survival (Supporting Tables S5 and S6).
Figure 6.
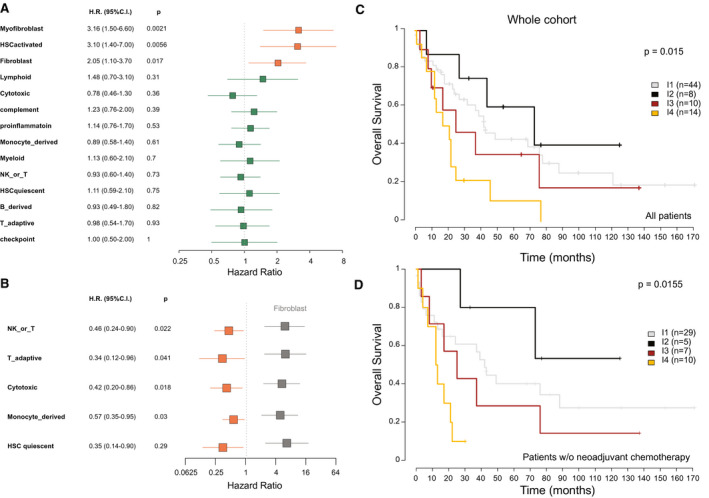
Correlation between ICC immune subtype and patient overall survival. Relationship between immune and stromal signatures and patient overall survival in the Paul‐Brousse patient cohort as revealed by Cox analysis. H.R., hazard ratio. Blue squares: P ≥ 0.05. Orange squares: P < 0.05. (A) Univariate Cox analysis. P: logrank‐test P values. (B) Bivariate Cox analysis. P: Wald‐test P values. Gray squares: fibroblast hazard ratios. Orange squares: hazard ratios of the indicated stromal and immune signatures (P < 0.05). (C,D) Kaplan–Meier curves of overall patient survival for the indicated ICC immune subtypes. P: logrank‐test P value. (C) Whole cohort: Paul‐Brousse cohort (n = 78). (D) Paul‐Brousse patients who were not given neoadjuvant chemotherapy (n = 51). C.I., confidence interval; NK, natural killer; w/o, without.
Discussion
Tumor stroma interaction is an essential component of cancer initiation, growth, and progression, about which we had incomplete knowledge in the case of ICC. In this study, we provided a comprehensive molecular analysis of the TME of 566 ICCs using robust cell type and functionality transcriptomic markers. We showed that the TMEs of ICCs display a large range of immunologic orientations and can be classified into four TME‐based subtypes corresponding to different natures (lymphoid, myeloid, mesenchymal) and abundances of tumor‐infiltrating cells. This result was obtained using a consensus clustering approach that extracts robust (i.e., present in all the data sets we analyzed) core subtypes from the high TME complexity of ICC. Each core subtype is defined differentially, not by a single, but by a spectrum of immune signatures covering lymphoid, monocyte/myeloid, and fibroblastic cells. A similar approach was used in colorectal and bladder cancers.40, 41 Such an approach allows one to attenuate the impact of limitations inherent in genomic meta‐analysis, such as bias related to sample size and technology, and provide a comprehensible view of the heterogenous immune landscape of ICC. The proposed immune classification was confirmed by tissue immunostaining as regards cell types and abundances in the parenchyma and the stroma of the tumors, which incidentally provides a validation of MCP‐counter as a reliable tool for quantifying the diverse cell populations of the TME from bulk‐tumor samples. These ICC immune subtypes bear similarities to reported cancer molecular subtypes.42 For instance, in colorectal cancer, an immune desert phenotype is associated with the consensus molecular subtype (CMS) 3 and, interestingly, this poorly infiltrated subtype also exhibits an up‐regulation of metabolic pathways, like ICC I1 immune desert subtype.40 Colorectal CMS4 shares several features (mesenchymal phenotype, matrix remodeling, angiogenesis, poor overall survival) with ICC I4 mesenchymal subtype. Colorectal microsatellite instability (MSI)‐enriched CMS1 displays features of immunologically hot tumors (tumor infiltration, immune activation, elevated immune checkpoint expression), like ICC I2 immunogenic subtype, suggesting that the latter have high MSI.
The different functional orientations of the ICC immune subtypes correspond to different immune escape mechanisms and, presumably, to different therapeutic options (Fig. 7). I1 immune desert subtype displays elements of immunologic ignorance (depletion in MHC class I, loss of β2‐microglobulin) and a lack of T cells priming (absence of CD8‐carrying T cells, lack of myeloid cells, noninflamed TME), consistent with the current description of the cancer immune desert phenotype (Fig. 6A). However, the molecular mechanisms involved in this immunologically silent tumor phenotype are not known. I2 immunogenic subtype has an inflammatory phenotype that includes many types of immune cells (effector and memory T cells, B cells, macrophages) sitting close to tumor cells in an inflammatory TME enriched in both immunostimulating and immunosuppressive factors. This ambivalent immune profile suggests an effective antitumor immune response counteracted by negative immune regulators, such as immune checkpoints (CTLA4, CD274, programmed cell death 1 ligand 2) and TGF‐β signaling. I3 myeloid subtype tumors are infiltrated with M2 macrophages and CD4+ (and a few CD8+) T lymphocytes. The anti‐inflammatory and immunosuppressive features of M2 macrophages could explain the lack of activated adaptive immunity observed in this subtype. I3 myeloid subtype includes the few patients who presented with an HCV infection, which is known to trigger monocyte differentiation into polarized M2 macrophages.43 I4 mesenchymal subtype displays high levels of vascular factors, chemokines, and other paracrine factors produced by activated fibroblasts, which, presumably, enhance protumorigenic pathways and restrain immune cell recruitment into the tumor tissue. It might correspond to the reported immune‐excluded cancer category, in which an abundant fibrous stroma acts as a barrier, preventing immune cells from accessing tumors.44
Figure 7.
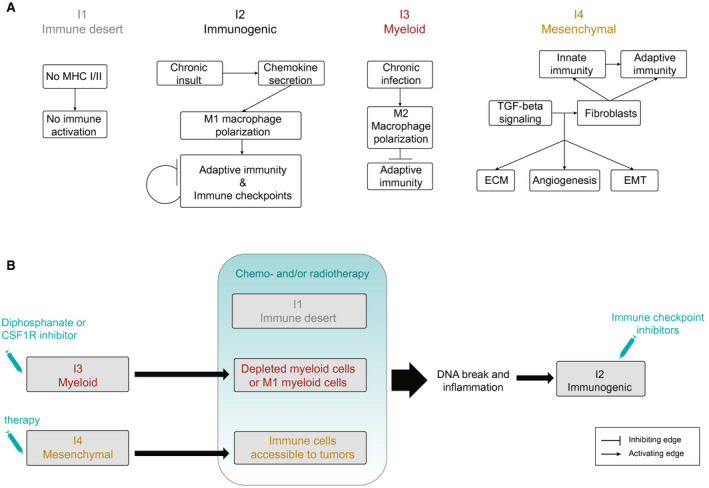
Outline of (A) the mechanisms to evade tumor immune elimination and (B) the possible therapeutic strategies for the different ICC immune subtypes. CSF1R, colony‐stimulating factor 1 receptor; ECM, extracellular matrix; EMT, epithelial‐mesenchymal transition.
From the therapeutic viewpoint, this study is an attempt to characterize ICC immune subtypes amenable to specific targeted therapies. It suggests that inflamed I2 immunogenic subtype, which overexpresses immune checkpoints, is treatable with checkpoint blockade immunotherapy. It should be noted that the whole‐transcriptome classifications of ICC fail to recognize the existence of such an immune active ICC subtype and assign the corresponding ICCs to either a good or a poor‐prognosis subclass in a classifier‐dependent manner (Fig. 3A). Thus the TME‐based classification of ICC might represent substantial progress in the identification of subtypes eligible for innovative therapies and precision cancer treatment (Fig. 7B). Regarding noninflamed I1 immune desert subtype, the strategies against cold tumors currently under clinical evaluation, which consist of converting them to inflamed tumors sensitive to cancer immunotherapy using various cytotoxic and modulating agents, might be appropriate.45 The immunosuppressive TME of I3 myeloid subtype might be targeted by drugs such as biphosphonate and the colony‐stimulating factor 1 receptor inhibitor, which induce depletion or reprogramming of M2 macrophages and thereby improve host’s antitumor immune response and sensitivity to cancer immunotherapy.46 The fibrotic barrier observed in I4 mesenchymal subtype might be altered by antifibrotic therapy, allowing immune cells to access tumor cells.
In conclusion, this study mines transcriptomes to finely characterize the heterogeneity of the ICC TME. It identifies four different TME‐based subtypes with distinct mechanisms of immune dysfunction associated with different patient outcomes. This immune classification might serve as a basis for the design of clinical trials aiming to test biology‐guided immunotherapy options in ICC.
Author Contributions
Sylvie Job and Delphine Rapoud share co‐first authorship. Sylvie Job, Delphine Rapoud, Catherine Guettier, Aurélien de Reyniès, and Jamila Faivre designed and implemented the study. Sylvie Job, Delphine Rapoud, Alexandre Dos Santos, Patrick Gonzalez, Christophe Desterke, Agnès Marchio, Pascal Pineau, Catherine Guettier, and Jamila Faivre contributed to data acquisition. Nabila Elarouci and Mira Ayadi provided technical support. Gérard Pascal, René Adam, Daniel Azoulay, Denis Castaing, Eric Vibert, Daniel Cherqui, Didier Samuel, Antonio Sa Cuhna, and Aurélien de Reyniès provided material support and significant insights. Sylvie Job and Christophe Desterke performed statistical and computational analysis. All the authors contributed to the analysis and interpretation of data and the revision of the manuscript. Sylvie Job and Jamila Faivre drafted the manuscript. Jamila Faivre supervised the study.
Supporting information
Acknowledgment
We are grateful to Dr. M. A. Buendia and Dr. F. Ghiringelli for fruitful discussions. We also thank N. Lablack (laser microdissection), O. Trassard (slide scanning), and the Institut de Génétique et de Biologie Moléculaire et Cellulaire Platform (microarray) for assistance with this study. We thank the Tissue Biobank Group of the AP‐HP (Centre de Ressources Biologiques Paris‐Sud) for providing human tissue specimens.
This work was supported by grants from the French National League Against Cancer under the Tumor Identity Cards (CIT) Program dedicated to cancer genomics. J.F. was supported by the Seventh Framework Programme of the European Union under grant agreement No. 259743 (Modelling Hepatocellular Carcinoma consortium), the OSEO‐Banque Publique d'Investissement Programme d’Investissements d’Avenir (Innovative Models Initiative and Hepatocellular Carcinoma Multi‐technological consortiums: R14035LB and R15065LH, respectively).
Potential conflict of interest: Nothing to report.
References
Author names in bold designate shared co‐first authorship.
- 1. Poultsides GA, Zhu AX, Choti MA, Pawlik TM. Intrahepatic cholangiocarcinoma. Surg Clin North Am 2010;90:817‐837. [DOI] [PubMed] [Google Scholar]
- 2. Rizvi S, Khan SA, Hallemeier CL, Kelley RK, Gores GJ. Cholangiocarcinoma—evolving concepts and therapeutic strategies. Nat Rev Clin Oncol 2018;15:95‐111. [DOI] [PMC free article] [PubMed] [Google Scholar]
- 3. Valle J, Wasan H, Palmer DH, Cunningham D, Anthoney A, Maraveyas A, et al. Cisplatin plus gemcitabine versus gemcitabine for biliary tract cancer. N Engl J Med 2010;362:1273‐1281. [DOI] [PubMed] [Google Scholar]
- 4. Sirica AE. The role of cancer‐associated myofibroblasts in intrahepatic cholangiocarcinoma. Nat Rev Gastroenterol Hepatol 2011;9:44‐54. [DOI] [PubMed] [Google Scholar]
- 5. Sirica AE, Gores GJ. Desmoplastic stroma and cholangiocarcinoma: clinical implications and therapeutic targeting. Hepatol Baltim Md 2014;59:2397‐2402. [DOI] [PMC free article] [PubMed] [Google Scholar]
- 6. Wolchok JD, Rollin L, Larkin J. Nivolumab and Ipilimumab in Advanced Melanoma. N Engl J Med 2017;377:2503‐2504. [DOI] [PubMed] [Google Scholar]
- 7. Brahmer J, Reckamp KL, Baas P, Crinò L, Eberhardt WE, Poddubskaya E, et al. Nivolumab versus docetaxel in advanced squamous‐cell non‐small‐cell lung cancer. N Engl J Med 2015;373:123‐135. [DOI] [PMC free article] [PubMed] [Google Scholar]
- 8. Robert C, Schachter J, Long GV, Arance A, Grob JJ, Mortier L, Daud A, et al. Pembrolizumab versus ipilimumab in advanced melanoma. N Engl J Med 2015;372:2521‐2532. [DOI] [PubMed] [Google Scholar]
- 9. El‐Khoueiry AB, Sangro B, Yau T, Crocenzi TS, Kudo M, Hsu C, et al. Nivolumab in patients with advanced hepatocellular carcinoma (CheckMate 040): an open‐label, non‐comparative, phase 1/2 dose escalation and expansion trial. Lancet Lond Engl 2017;389:2492‐2502. [DOI] [PMC free article] [PubMed] [Google Scholar]
- 10. Sabbatino F, Villani V, Yearley JH, Deshpande V, Cai L, Konstantinidis IT, et al. PD‐L1 and HLA class I antigen expression and clinical course of the disease in intrahepatic cholangiocarcinoma. Clin Cancer Res 2016;22:470‐478. [DOI] [PMC free article] [PubMed] [Google Scholar]
- 11. Andersen JB, Spee B, Blechacz BR, Avital I, Komuta M, Barbour A, et al. Genomic and genetic characterization of cholangiocarcinoma identifies therapeutic targets for tyrosine kinase inhibitors. Gastroenterology 2012;142:1021‐1031.e15. [DOI] [PMC free article] [PubMed] [Google Scholar]
- 12. Oishi N, Kumar MR, Roessler S, Ji J, Forgues M, Budhu A, et al. Transcriptomic profiling reveals hepatic stem‐like gene signatures and interplay of miR‐200c and epithelial‐mesenchymal transition in intrahepatic cholangiocarcinoma. Hepatol Baltim Md 2012;56:1792‐1803. [DOI] [PMC free article] [PubMed] [Google Scholar]
- 13. Sia D, Hoshida Y, Villanueva A, Roayaie S, Ferrer J, Tabak B, et al. Integrative molecular analysis of intrahepatic cholangiocarcinoma reveals 2 classes that have different outcomes. Gastroenterology 2013;144:829‐840. [DOI] [PMC free article] [PubMed] [Google Scholar]
- 14. Chan‐On W, Nairismägi M‐L, Ong CK, Lim WK, Dima S, Pairojkul C, et al. Exome sequencing identifies distinct mutational patterns in liver fluke‐related and non‐infection‐related bile duct cancers. Nat Genet 2013;45:1474‐1478. [DOI] [PubMed] [Google Scholar]
- 15. Gao Q, Zhao Y‐J, Wang X‐Y, Guo W‐J, Gao S, Wei L, et al. Activating mutations in PTPN3 promote cholangiocarcinoma cell proliferation and migration and are associated with tumor recurrence in patients. Gastroenterology 2014;146:1397‐1407. [DOI] [PubMed] [Google Scholar]
- 16. Borad MJ, Champion MD, Egan JB, Liang WS, Fonseca R, Bryce AH, et al. Integrated genomic characterization reveals novel, therapeutically relevant drug targets in FGFR and EGFR pathways in sporadic intrahepatic cholangiocarcinoma. PLoS Genet 2014;10:e1004135. [DOI] [PMC free article] [PubMed] [Google Scholar]
- 17. Zou S, Li J, Zhou H, Frech C, Jiang X, Chu JS, et al. Mutational landscape of intrahepatic cholangiocarcinoma. Nat Commun 2014;5:5696. [DOI] [PubMed] [Google Scholar]
- 18. Razumilava N, Gores GJ. Cholangiocarcinoma. Lancet Lond Engl 2014;383:2168‐2179. [DOI] [PMC free article] [PubMed] [Google Scholar]
- 19. Farshidfar F, Zheng S, Gingras MC, Newton Y, Shih J, Robertson AG, et al. Integrative genomic analysis of cholangiocarcinoma identifies distinct IDH‐mutant molecular profiles. Cell Rep 2017;19:2878‐2880. [DOI] [PMC free article] [PubMed] [Google Scholar]
- 20. Jusakul A, Cutcutache I, Yong CH, Lim JQ, Huang MN, Padmanabhan N, et al. Whole‐genome and epigenomic landscapes of etiologically distinct subtypes of cholangiocarcinoma. Cancer Discov 2017;7:1116‐1135. [DOI] [PMC free article] [PubMed] [Google Scholar]
- 21. Arai Y, Totoki Y, Hosoda F, Shirota T, Hama N, Nakamura H, et al. Fibroblast growth factor receptor 2 tyrosine kinase fusions define a unique molecular subtype of cholangiocarcinoma. Hepatol Baltim Md 2014;59:1427‐1434. [DOI] [PubMed] [Google Scholar]
- 22. Chevrier S, Levine JH, Zanotelli VRT, Silina K, Schulz D, Bacac M, et al. An immune atlas of clear cell renal cell carcinoma. Cell 2017;169:736‐749.e18. [DOI] [PMC free article] [PubMed] [Google Scholar]
- 23. Tirosh I, Izar B, Prakadan SM, Wadsworth MH, Treacy D, Trombetta JJ, et al. Dissecting the multicellular ecosystem of metastatic melanoma by single‐cell RNA‐seq. Science 2016;352:189‐196. [DOI] [PMC free article] [PubMed] [Google Scholar]
- 24. Newman AM, Liu CL, Green MR, Gentles AJ, Feng W, Xu Y, et al. Robust enumeration of cell subsets from tissue expression profiles. Nat Methods 2015;12:453‐457. [DOI] [PMC free article] [PubMed] [Google Scholar]
- 25. Gong T, Szustakowski JD. DeconRNASeq: a statistical framework for deconvolution of heterogeneous tissue samples based on mRNA‐Seq data. Bioinforma Oxf Engl 2013;29:1083‐1085. [DOI] [PubMed] [Google Scholar]
- 26. Becht E, Giraldo NA, Lacroix L, Buttard B, Elarouci N, Petitprez F, et al. Estimating the population abundance of tissue‐infiltrating immune and stromal cell populations using gene expression. Genome Biol 2016;17:218. [DOI] [PMC free article] [PubMed] [Google Scholar]
- 27. Friedman SL. Hepatic stellate cells: protean, multifunctional, and enigmatic cells of the liver. Physiol Rev 2008;88:125‐172. [DOI] [PMC free article] [PubMed] [Google Scholar]
- 28. Kang N, Gores GJ, Shah VH. Hepatic stellate cells: partners in crime for liver metastases? Hepatol Baltim Md 2011;54:707‐713. [DOI] [PMC free article] [PubMed] [Google Scholar]
- 29. Boers W, Aarrass S, Linthorst C, Pinzani M, Elferink RO, Bosma P. Transcriptional profiling reveals novel markers of liver fibrogenesis: gremlin and insulin‐like growth factor‐binding proteins. J Biol Chem 2006;281:16289‐16295. [DOI] [PubMed] [Google Scholar]
- 30. Darnaud M, Dos Santos A, Gonzalez P, Augui S, Lacoste C, Desterke C, et al. Enteric delivery of regenerating family member 3 alpha alters the intestinal microbiota and controls inflammation in mice with colitis. Gastroenterology 2018;154:1009‐1023.e14. [DOI] [PubMed] [Google Scholar]
- 31. Taube JM, Klein A, Brahmer JR, Xu H, Pan X, Kim JH, et al. Association of PD‐1, PD‐1 ligands, and other features of the tumor immune microenvironment with response to anti‐PD‐1 therapy. Clin Cancer Res 2014;20:5064‐5074. [DOI] [PMC free article] [PubMed] [Google Scholar]
- 32. Nakamura H, Arai Y, Totoki Y, Shirota T, Elzawahry A, Kato M, et al. Genomic spectra of biliary tract cancer. Nat Genet 2015;47:1003‐1010. [DOI] [PubMed] [Google Scholar]
- 33. Dos Santos A, Court M, Thiers V, Sar S, Guettier C, Samuel D, et al. Identification of cellular targets in human intrahepatic cholangiocarcinoma using laser microdissection and accurate mass and time tag proteomics. Mol Cell Proteomics MCP 2010;9:1991‐2004. [DOI] [PMC free article] [PubMed] [Google Scholar]
- 34. Vaquero J, Guedj N, Clapéron A, Ho‐Bouldoires TH, Paradis V, Fouassier L. Epithelial‐mesenchymal transition in cholangiocarcinoma: from clinical evidence to regulatory networks. J Hepatol 2017;66:424‐441. [DOI] [PubMed] [Google Scholar]
- 35. Nakanuma Y, Kakuda Y. Pathologic classification of cholangiocarcinoma: new concepts. Best Pract Res Clin Gastroenterol 2015;29:277‐293. [DOI] [PubMed] [Google Scholar]
- 36. Sigel CS, Drill E, Zhou Y, Basturk O, Askan G, Pak LM, et al. Intrahepatic cholangiocarcinomas have histologically and immunophenotypically distinct small and large duct patterns. Am J Surg Pathol 2018;42:1334‐1345. [DOI] [PMC free article] [PubMed] [Google Scholar]
- 37. Albillos A, Lario M, Álvarez‐Mon M. Cirrhosis‐associated immune dysfunction: distinctive features and clinical relevance. J Hepatol 2014;61:1385‐1396. [DOI] [PubMed] [Google Scholar]
- 38. Sweis RF, Spranger S, Bao R, Paner GP, Stadler WM, Steinberg G, et al. Molecular drivers of the non‐T‐cell‐inflamed tumor microenvironment in urothelial bladder cancer. Cancer Immunol Res 2016;4:563‐568. [DOI] [PMC free article] [PubMed] [Google Scholar]
- 39. Luke JJ, Bao R, Sweis RF, Spranger S, Gajewski TF. WNT/β‐catenin Pathway activation correlates with immune exclusion across human cancers. Clin Cancer Res 2019;25:3074‐3083. [DOI] [PMC free article] [PubMed] [Google Scholar]
- 40. Guinney J, Dienstmann R, Wang X, de Reyniès A, Schlicker A, Soneson C, et al. The consensus molecular subtypes of colorectal cancer. Nat Med 2015;21:1350‐1356. [DOI] [PMC free article] [PubMed] [Google Scholar]
- 41. Kamoun A, de Reyniès A, Allory Y, Sjödahl G, Robertson AG, Seiler R, et al. A consensus molecular classification of muscle‐invasive bladder cancer. Eur Urol 2019. Sep 26. pii: S0302‐2838(19)30695‐5. 10.1016/j.eururo.2019.09.006. [Epub ahead of print] [DOI] [PMC free article] [PubMed] [Google Scholar]
- 42. Becht E, de Reyniès A, Giraldo NA, Pilati C, Buttard B, Lacroix L, et al. Immune and stromal classification of colorectal cancer is associated with molecular subtypes and relevant for precision immunotherapy. Clin Cancer Res 2016;22:4057‐4066. 10.1158/1078-0432.CCR-15-2879. [DOI] [PubMed] [Google Scholar]
- 43. Saha B, Kodys K, Szabo G. Hepatitis C virus‐induced monocyte differentiation into polarized M2 macrophages promotes stellate cell activation via TGF‐β. Cell Mol Gastroenterol Hepatol 2016;2:302‐316.e8. [DOI] [PMC free article] [PubMed] [Google Scholar]
- 44. Chen DS, Mellman I. Elements of cancer immunity and the cancer‐immune set point. Nature 2017;541:321‐330. [DOI] [PubMed] [Google Scholar]
- 45. Galon J, Bruni D. Approaches to treat immune hot, altered and cold tumours with combination immunotherapies. Nat Rev Drug Discov 2019;18:197‐218. 10.1038/s41573-018-0007-y. [DOI] [PubMed] [Google Scholar]
- 46. Zhu Y, Knolhoff BL, Meyer MA, Nywening TM, West BL, Luo J, et al. CSF1/CSF1R blockade reprograms tumor‐infiltrating macrophages and improves response to T‐cell checkpoint immunotherapy in pancreatic cancer models. Cancer Res 2014;74:5057‐5069. [DOI] [PMC free article] [PubMed] [Google Scholar]
Associated Data
This section collects any data citations, data availability statements, or supplementary materials included in this article.
Supplementary Materials