

Summary
Primary somatosensory neurons are specialized to transmit specific types of sensory information through differences in cell size, myelination, and the expression of distinct receptors and ion channels, which together define their transcriptional and functional identity. By profiling sensory ganglia at single-cell resolution, we find that the all somatosensory neuronal subtypes undergo a similar transcriptional response to peripheral nerve injury that both promotes axonal regeneration and suppresses cell identity. This transcriptional reprogramming, which is not observed in non-neuronal cells, resolves over a similar time course as target reinnervation and is associated with the restoration of original cell identity. Injury-induced transcriptional reprogramming requires ATF3, a transcription factor which is induced rapidly after injury and necessary for axonal regeneration and functional recovery. Our findings suggest that transcription factors induced early after peripheral nerve injury likely confer the cellular plasticity required for sensory neurons to transform into a regenerative state.
Keywords: Nerve injury, regeneration, sensory neuron, single-cell RNA-seq, gene expression, dorsal root ganglion, reprogramming, cell identity, axon growth, ATF3
eTOC
Dorsal root ganglion neurons transduce somatosensory and painful stimuli in the peripheral nervous system. In this issue of Neuron, Renthal et al. (2020), characterize a transcriptional program induced across neuronal subtypes after peripheral nerve injury that is necessary for nerve regeneration.
Introduction
Peripheral axotomy of dorsal root ganglion (DRG) somatosensory neurons leads to the induction of cell-intrinsic transcriptional programs critical both for initiating axon growth and driving the pathological neuronal hyperexcitability that underlies neuropathic pain (Chandran et al., 2016; Costigan et al., 2002; He and Jin, 2016; Mahar and Cavalli, 2018; Scheib and Höke, 2013; Serra et al., 2012; Tuszynski and Steward, 2012). Regeneration of DRG neurons involves both the regrowth of injured axons and the correct reinnervation of their targets, but this process is often incomplete and can lead both to a loss of sensation and disabling chronic painful neuropathies, such as phantom limb pain, diabetic neuropathy or chemotherapy-induced neuropathy (Chapman and Vierck, 2017; Collins et al., 2018; Xie et al., 2017). Better understanding of the mechanisms by which neuronal hyperexcitability develops after axonal injury may reveal new targets for analgesic development for neuropathic pain. The molecular changes provoked by axonal injury in the DRG have also been the focus of intense study (Chandran et al., 2016; Costigan et al., 2002; He and Jin, 2016; Mahar and Cavalli, 2018; Scheib and Höke, 2013; Serra et al., 2012; Tuszynski and Steward, 2012) because these mechanisms might be translatable to injured central nervous system neurons, which lack an intrinsic regeneration capacity (He and Jin, 2016; Mahar and Cavalli, 2018; Tuszynski and Steward, 2012).
Previous molecular studies using bulk DRG tissue have identified transcriptional networks regulated in the DRG in response to injury (Abe and Cavalli, 2008; Chandran et al., 2016; Costigan et al., 2002; LaCroix-Fralish et al., 2011; Michaelevski et al., 2010; Perkins et al., 2014; Xiao et al., 2002). However, the extensive cellular heterogeneity of the DRG (Sharma et al., 2020; Usoskin et al., 2015; Zeisel et al., 2018; Zheng et al., 2019) has made it difficult to establish in which cell types these changes occur and whether these changes are similar or distinct across different neuronal subtypes. This challenge is underscored by the fact that non-neuronal cells are collectively more abundant than neurons in the DRG. Moreover, DRG neurons themselves vary dramatically in size, conduction velocity, gene expression patterns and the sensory transduction receptors present on nerve terminals (Gatto et al., 2019; Le Pichon and Chesler, 2014; Usoskin et al., 2015; Zeisel et al., 2018; Zheng et al., 2019). In addition to the cellular heterogeneity within the DRG, in most nerve injury models, only a fraction of DRG neurons are axotomized, and bulk analyses cannot differentiate between changes in injured or uninjured neurons (Berta et al., 2017; Gosselin et al., 2010; Jessen and Mirsky, 2016; Laedermann et al., 2014; Rigaud et al., 2008).
Single-nucleus RNA sequencing (snRNAseq) enables the characterization of axonal injury response programs within distinct cell types of the DRG, without use of cell dissociation procedures that themselves induce injury-like/immediate early gene responses (Chiu et al., 2014; Frey et al., 2015; Lindwall et al., 2004; Nguyen et al., 2019). Using snRNAseq, we mapped the transcriptomes of 141,093 individual mouse DRG cells across several nerve injury models. We find that axonal injury induces a common transcriptional program across different neuronal subtypes that represses the expression of their subtype-specific genes. Non-neuronal cells exhibit a distinct transcriptional response to injury. We further demonstrate that ATF3, a transcription factor (TF) induced rapidly after axonal injury (Hunt et al., 2012; Parsadanian et al., 2006; Tsujino et al., 2000) and also implicated in cellular reprogramming (Duan et al., 2019; Ronquist et al., 2017), is necessary for axotomy-induced transcriptional reprogramming, axonal regeneration and sensory recovery after injury. Finally, we present a web-based resource for exploring injury-induced changes in gene expression across DRG cell types (www.painseq.com) to aid studies of sensory neuron biology and development of novel therapeutics for pain and regeneration.
Results
snRNA-seq of naive and injured DRGs
We performed snRNAseq on lumbar DRGs from adult naive mice and compared their transcriptional profiles to DRGs from mice after spinal nerve transection (SpNT), sciatic nerve transection+ligation (ScNT) or sciatic nerve crush (Crush), over multiple time points, ranging from hours to months after injury (Figure 1A). Full axonal regeneration with target reinnervation and functional recovery is only observed in the Crush model (Navarro et al., 1994). To determine whether the nerve injury response is distinct from other pain-producing insults, we also characterized gene expression changes in lumbar DRGs from two models that do not involve physical axotomy: paclitaxel-induced allodynia (Toma et al., 2017) and Complete Freund’s Adjuvant (CFA) induced inflammation (Jaggi et al., 2011).
Figure 1. Single-nucleus RNA sequencing of DRG neurons in mouse models of peripheral axotomy.
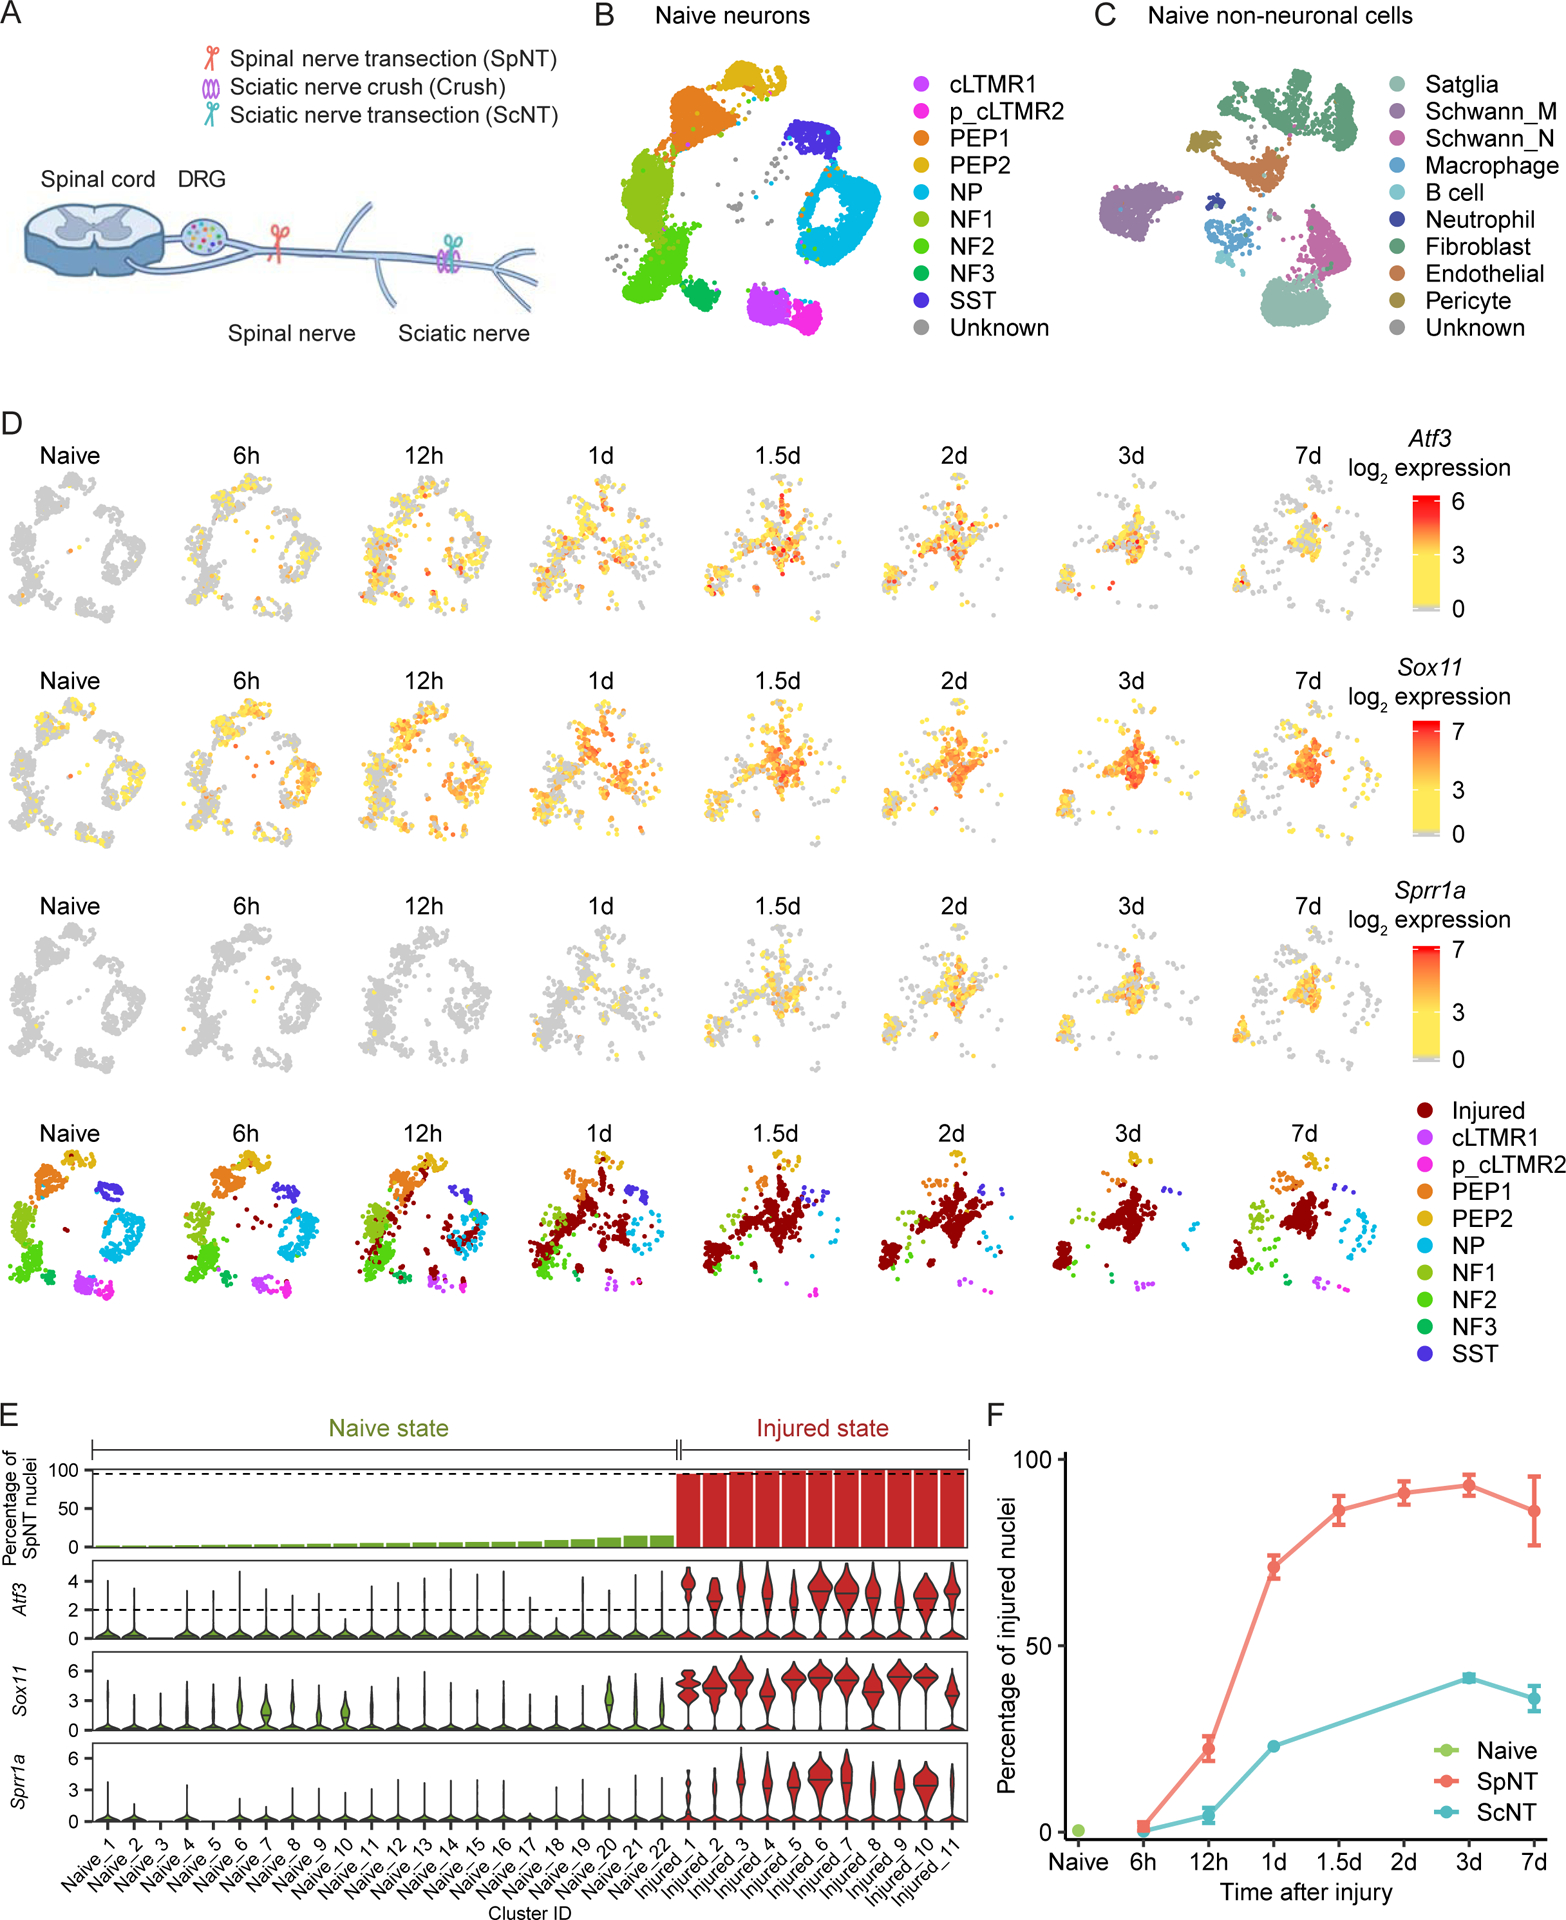
(A) Diagram of mouse axotomy models.
(B-C) UMAP plots of 11,191 neuronal (B) and 5,668 non-neuronal (C) DRG nuclei from naive mice.
(D) UMAP plots of Atf3, Sox11, or Sprr1a expression in DRG neurons after SpNT. Each time point is down-sampled to display 900 nuclei. Color denotes log2 expression of each gene. UMAP plots in last row display DRG neurons colored by neuronal subtype; injured state neurons (see Figure 1E, methods) are labeled “Injured.”
(E) Bar plot showing the percent of SpNT nuclei within each neuronal cluster (top row) and violin plots showing log2 expression of injury-induced genes in each cluster (rows 2–4). Fractions were calculated out of 11,191 naive neuronal nuclei and 6,532 SpNT neuronal nuclei (> 1d after injury). Cluster ID corresponds to cluster number assignment from Seurat (Figure S2G). Injured state clusters (red) contain >95% nuclei from SpNT mice and have a median normalized Atf3 log2 expression >2, while all other clusters are naive state (green).
(F) Percentage of naive, SpNT, and ScNT neuronal nuclei classified as injured state at each time point after the respective injury (see Figure 1E, methods). Data are mean±SD.
Using a method that enriches for neuronal nuclei (Mo et al., 2015), we profiled 141,093 DRG nuclei that passed quality control. Sequenced nuclei had an average of 2,447 transcripts per nucleus representing 1,284 unique genes per nucleus (Figure S1A, Table S1) at an average sequencing depth of 14,569 reads/nucleus. To classify cell types, DRG nuclei from naive and all experimental injury conditions were initially clustered together based on their gene expression patterns. Dimensionality reduction (uniform manifold approximation and projection [UMAP]) revealed distinct clusters of cells; with neuronal clusters expressing Rbfox3, and non-neuronal clusters expressing Sparc (Figures S1B–C). We re-clustered neuronal and non-neuronal nuclei separately and used this visualization in subsequent analyses (Figures 1B–C). Cells from each biological sample are present in these final annotated clusters, suggesting minimal batch-to-batch variation (Figure S1D).
We observed 9 naive DRG neuron subtypes: Tac1+/Gpx3+ peptidergic nociceptors (PEP1), Tac1+/Hpca+ peptidergic nociceptors (PEP2), Mrgprd+ non-peptidergic nociceptors (NP), Sst+ pruriceptors (SST), Nefh+ A fibers including Aβ low-threshold mechanoreceptors (Aβ-LTMRs) and Pvalb+ proprioceptors (NF1, NF2), Cadps2+ Aδ-LTMRs (NF3), Fam19a4+/Th+ C-fiber LTMRs (cLTMR1) (Figures 1B, S1C), and a putative cLTMR2 (p_cLTMR2) cluster that expresses Fam19a4, but very low levels of Th. A subset of the cell-type-selective marker genes (Figures S1E–G), including those of p_cLTMR2 (Figure S1H), were studied by fluorescence in situ hybridization (FISH) and found to label distinct, non-overlapping cell populations. We also observed 9 non-neuronal cell types, including Apoe+ satellite glia, Mpz+ myelinating Schwann cells, Mpz−/Scn7a+ nonmyelinating (Remak) Schwann cells, endothelial cells, pericytes, immune cells, and a heterogenous group of fibroblasts (Figures 1C, S1C). The DRG cell types identified here express unique patterns of ion channels, G-protein coupled receptors (GPCRs), neuropeptides, and TFs (Figure S2A, Table S2), that are consistent with previous studies (Sharma et al., 2020; Usoskin et al., 2015; Zeisel et al., 2018; Zheng et al., 2019).
Axonal injury induces a new transcriptional state in DRG neurons.
To characterize the transcriptional programs activated in response to axonal injury, we first compared DRG nuclei from naive mice with those from mice 6 hours (h), 12h, 1 day (d), 1.5d, 2d, 3d and 7d after L3–4 SpNT, which results in axotomy of >90% of L3–4 DRG neurons (Shortland et al., 2006; Tsujino et al., 2000). Strikingly, we observed that a neuronal transcriptional state emerges by 1d after SpNT, which is essentially absent in naive mice. These “injured state” neuronal clusters contain neurons that express high levels of known injury-induced genes such as Atf3 and Sprr1a (Figure 1D) (Bonilla et al., 2002; Hunt et al., 2012; Parsadanian et al., 2006; Tsujino et al., 2000). By 3d after SpNT, few nuclei from the affected DRGs cluster with naive neurons, consistent with an axotomy of most of the DRG neurons analyzed. We also observed new clusters of repair Schwann cells and repair fibroblasts, as well as an increase in macrophages in the DRG after injury (Figures S2B–F). Repair Schwann cells were predominantly found at the proximal end of the transected spinal nerve after SpNT and were likely sequenced together with the DRG due to its proximity (Figure S2F).
To quantify the extent of injury across all neurons after SpNT, we defined the new neuronal clusters that emerge after injury as being in an “injured state” if the cluster consisted of >95% SpNT nuclei (≤5% naive nuclei) and had a median expression of Atf3 >2 (Figures 1E, S2G). All other clusters were classified as being in a “naive state,” and were comprised primarily of nuclei from naive mice (~91% of nuclei in these clusters were from naive mice) with a median Atf3 expression of 0. Injured state neurons express higher levels of canonical DRG axonal injury-induced genes such as Atf3, Sox11, Sprr1a, Flrt3 (Chandran et al., 2016; Costigan et al., 2002; LaCroix-Fralish et al., 2011; Perkins et al., 2014; Xiao et al., 2002) than naive state neurons (Figure 1E, two-tailed Student’s t-test, P<0.001) and overlap with injury gene modules previously identified from gene expression studies of bulk DRG tissue (Chandran et al., 2016) (Figure S2H). It is notable that we still observe a small number of naive state neurons in mice who underwent SpNT (Figure 1D), consistent with the 5–10% of neurons that are not axotomized in this model.
To test the accuracy of this injury classification, we compared the percentage of injured state neurons in the proximal SpNT model where >90% of DRG neurons are axotomized to that of the more distal ScNT model where only ~50% of DRG neurons are axotomized (Laedermann et al., 2014; Rigaud et al., 2008). Three days after axotomy, the injury classification identified 92.6% of neurons sequenced as in the injured state after SpNT and only 41.4% after ScNT (Figures 1F, S2I–J). Therefore, there is good agreement between the detection of axotomized neurons from the snRNAseq analyses and those measured by in vivo anatomical labeling/tracing (Rigaud et al., 2008; Shortland et al., 2006). Interestingly, a few DRG neuronal nuclei from naive mice (mean 0.4%) were classified as being in an injured state, which may be explained by occult fight wound injuries that occur in group-housed mice, and is consistent with the rare detection of Atf3+ neurons in naive mice (Figure 1D, Figure 2).
Figure 2. Loss of neuronal marker gene expression after peripheral nerve injury.
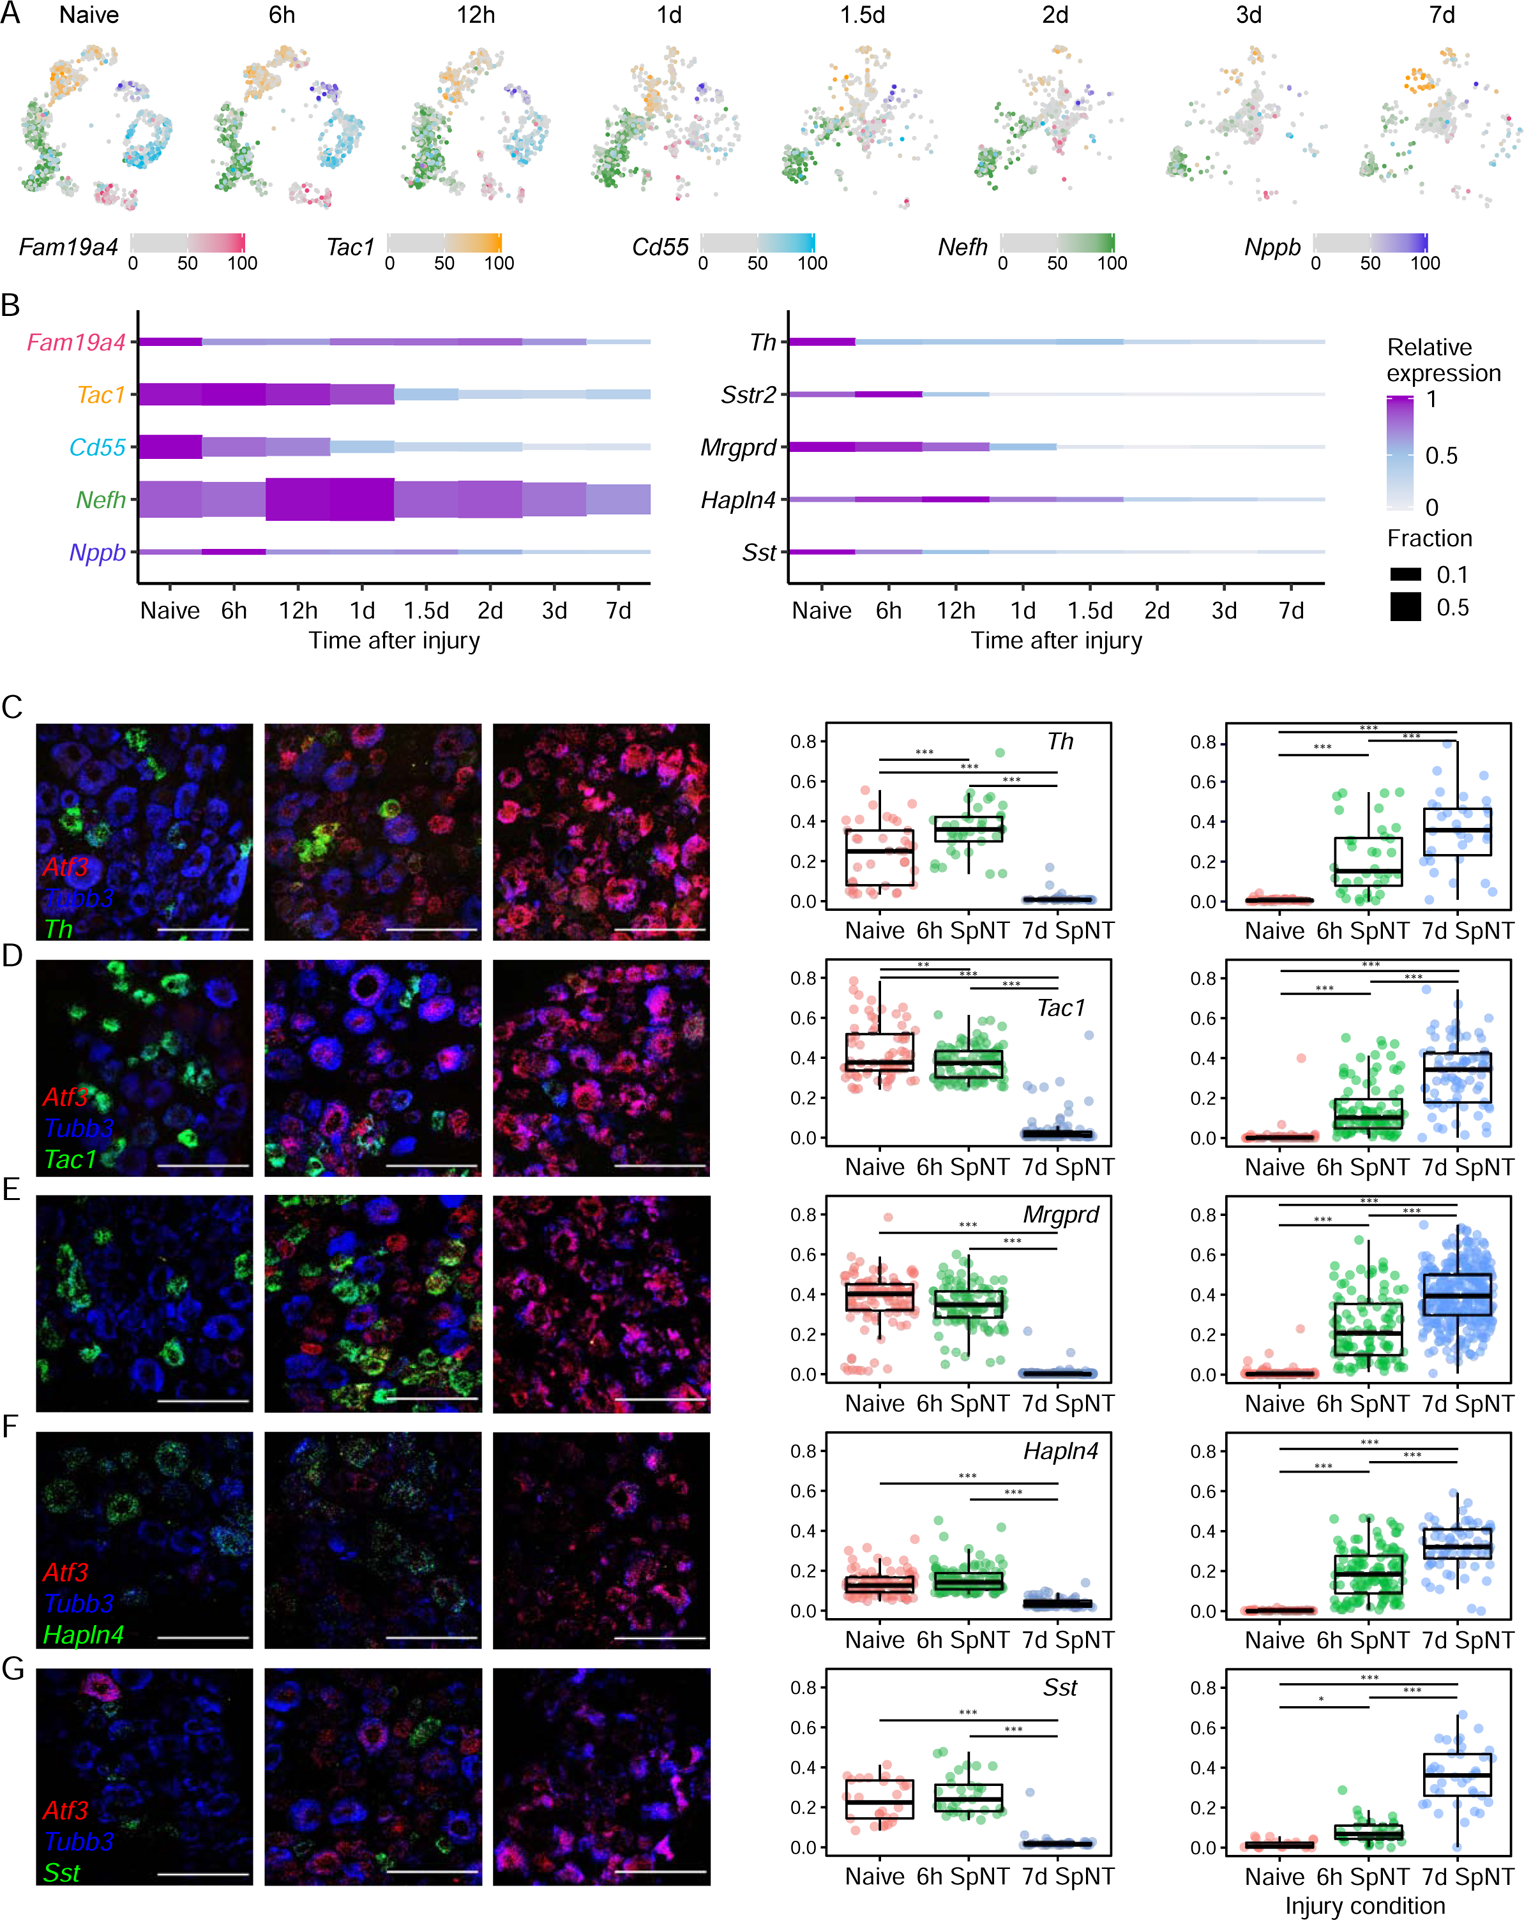
(A) UMAP plots of DRG neuronal subtype marker gene expression after SpNT. Colors are percentile of gene expression across naive and SpNT neuronal nuclei with counts > 0. Nuclei with marker gene expression <50th percentile for all 5 marker genes are gray; nuclei with expression ≥ 50th percentile for multiple markers have their colors overlaid (4.6%). 900 randomly sampled neuronal nuclei are displayed at each time point. Marker genes: Fam19a4 (cLTMR), Tac1 (PEP), Cd55 (NP), Nefh (Nefh+ A-LTMRs), Nppb (Sst+ pruriceptors).
(B) Plot shows expression of neuronal subtype marker genes across naive and SpNT neuronal nuclei at time point after SpNT. Height of each block is the fraction of neuronal nuclei that express (>0 counts) a marker gene at each time point. Relative expression is row-normalized mean expression.
(C-G) FISH images of L4 mouse DRGs stained with probes against an injury marker, Atf3 (red), a neuronal marker, Tubb3 (blue), and cell type markers: Th (C, green), Tac1 (D, green), Mrgprd (E, green), Hapln4 (F, green) and Sst (G, green). Representative sections from naive DRGs (left), DRGs 6h (middle) and 7d (right) after SpNT are shown. Scale bar=100μm.
(H) Quantification of Atf3 and neuronal subtype marker gene expression from naive, 6h and 7d after SpNT measured by FISH (n = 3–6 L4 DRGs). Dots on the boxplot are gene expression (number of puncta/μm2) within a cell, boxes indicate quartiles and whiskers are 1.5-times the interquartile range (Q1-Q3). Median expression is a black line inside box. (1-way ANOVA, ***P<0.001, **P<0.01, *P<0.05, see methods for ANOVA parameters).
Classification of neuronal subtypes after axotomy
We next looked at whether the intrinsic axonal injury transcriptional program differs between distinct DRG neuronal subtypes. However, efforts to address this question were complicated by the injury-induced downregulation of neuronal subtype-specific marker genes that classify neuronal subtypes (Figure 2A). 3–7d after injury, the expression of neuronal subtype marker genes was reduced by 33–95% compared to their levels in naive DRGs, with a more pronounced downregulation of small diameter neuron marker genes (e.g. Tac1, Mrgprd) than those in large diameter neurons (e.g. Nefh, Hapln4) (Figure 2B). FISH for several neuronal subtype marker genes, including Th, Tac1, Mrgprd, Hapln4, Sst (Figures 2C–H) confirmed the reduced marker gene expression. While the loss of marker gene expression and the profound changes in cluster identity after injury made it difficult to classify injured neuronal subtypes, even when injury-induced genes were omitted from the clustering variables (Figure S3A), we were able to use multiple consecutive timepoints after SpNT to capture residual transcriptional signatures during the transition between naive and injured states for each neuronal subtype (Figures 3A–B, S3B). As a complementary informatic approach for classifying injured neuronal subtypes, we used a vector of injury-induced genes as a measure of injury progression and regressed out the variation in each gene that could be explained by the injury signal prior to clustering. Cell type assignments from the two approaches had 98% concordance for naive cell types and 92% for injured cell types (Figure S3C). To test the accuracy of the bioinformatic classification of neuronal subtypes before and after injury we performed cell-type tracing of Mrgprd+ NP neurons after injury using Mrgprd-CreERT2;Gcamp6f reporter mice. The bioinformatic classification matched the reporter-based cell type identification in 89.2% of neurons from injured and naive reporter mice (Figure S3D–F). The ability to classify neuronal subtypes at each time point after axonal injury (Figures 3B, S3B) provided an opportunity to characterize cell-type-specific (CTS) molecular adaptions to axonal injury.
Figure 3. Classification of DRG neuronal subtypes after peripheral nerve injury.
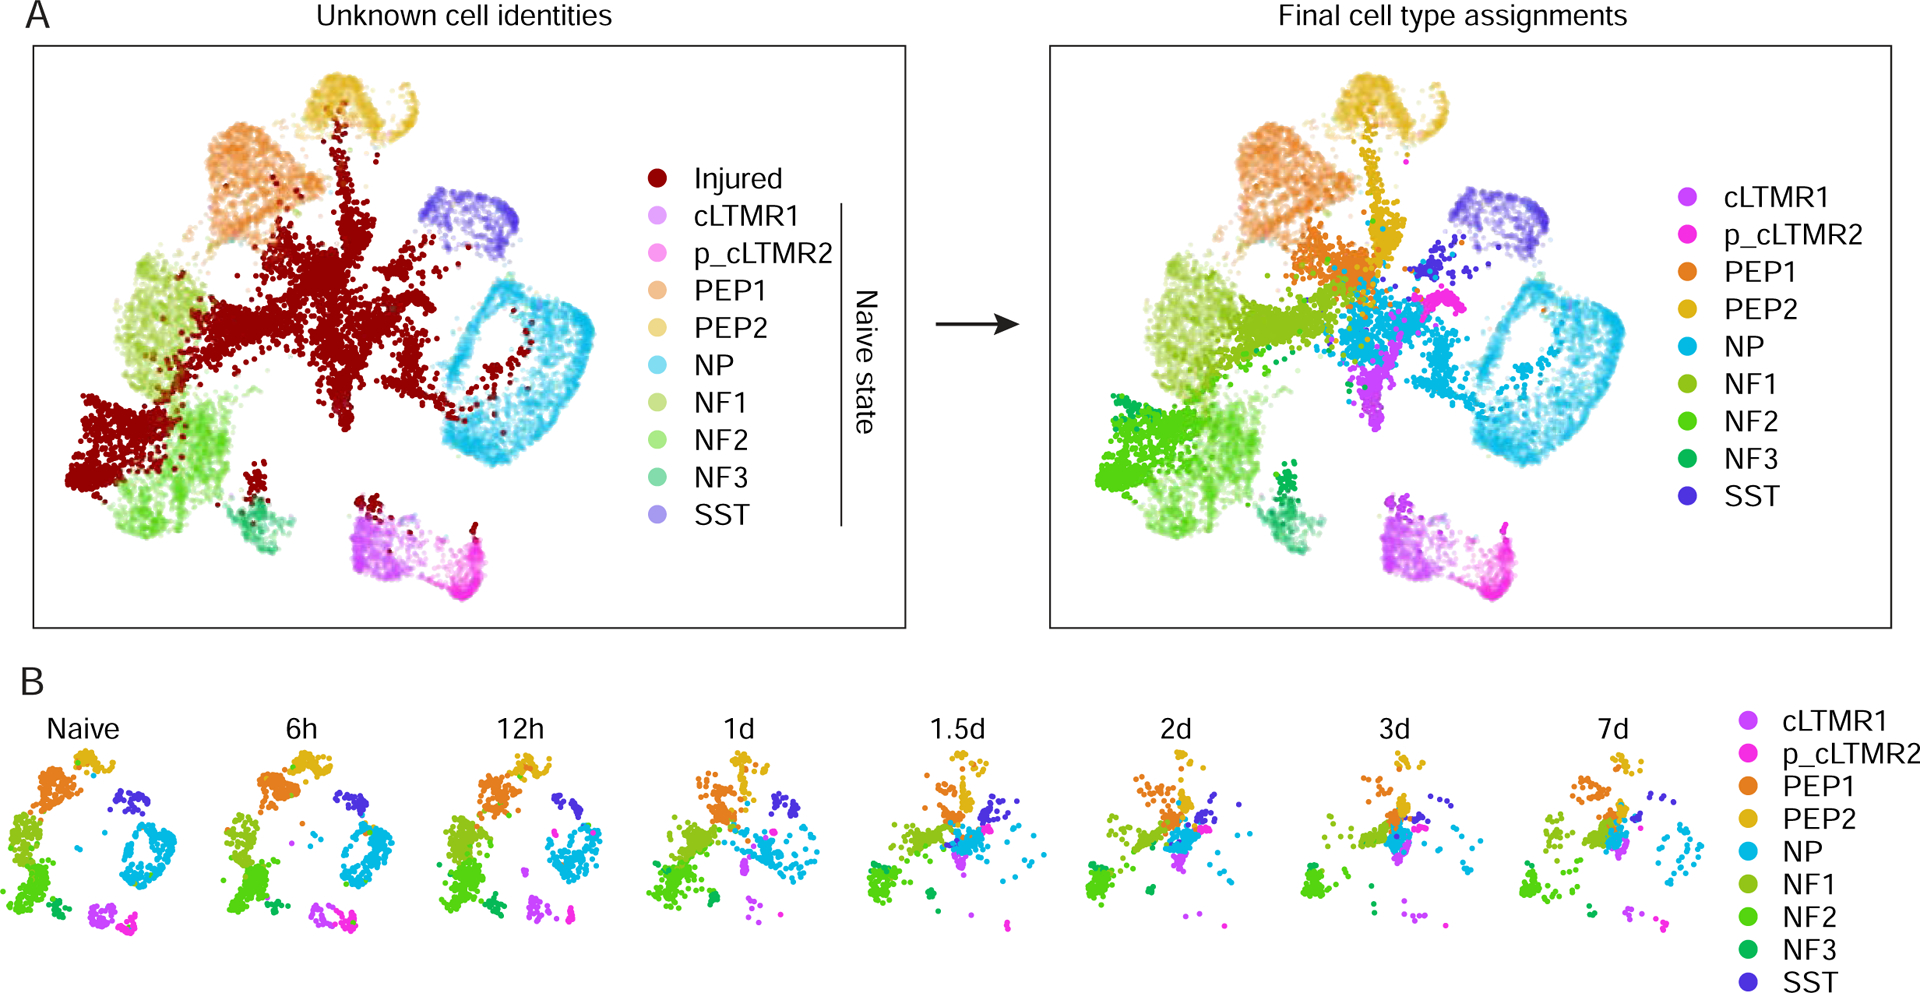
(A) Classification of injured neuronal subtypes after SpNT. UMAP plots show 7,000 naive and 7,000 SpNT neurons randomly sampled. Nuclei in naive state are faint, injured state are bold.
(B) UMAP plots of naive and SpNT DRG neuronal subtypes after pair-wise projection and clustering. Naive neurons at SpNT time points are shown (900 randomly-sampled neuronal nuclei per time point) and colored by neuronal subtype.
Characterization of CTS transcriptional responses to injury reveals a common program
After classifying the neuronal subtypes of axotomized neurons following SpNT (Figure S3G), we performed differential gene expression analyses to identify high-confidence changes after injury (FDR<0.01 and log2 fold change[FC]>|1|) for each cell type and time point compared to their respective naive cell types (see Table S3 for differentially expressed genes and sample sizes). For all DRG cell types, the total number of genes significantly regulated after axotomy generally increases over time until 3–7d after injury (Figure 4A), an effect that is observed even when controlling for number of nuclei or unique molecular identifiers (UMI)/nucleus at each time point (Figure S4A). However, the rate of gene induction after injury varied across different cell types. Small diameter neurons (e.g. NP and PEP) induced more genes at earlier time points after injury than large diameter neurons (e.g. Nefh+ A-LTMRs), whereas non-neuronal cells induced comparatively few genes after injury (Figures 4A, Table S3). The genes upregulated in each neuronal subtype after injury significantly overlap with those induced by injury in other neuronal subtypes, indicating a largely common neuronal response to injury (Figure 4B). Indeed, between 68–97% of genes induced in neuronal subtypes after injury are induced across multiple neuronal subtypes (Figure 4C).
Figure 4. Characterization of CTS transcriptional responses to peripheral axotomy.
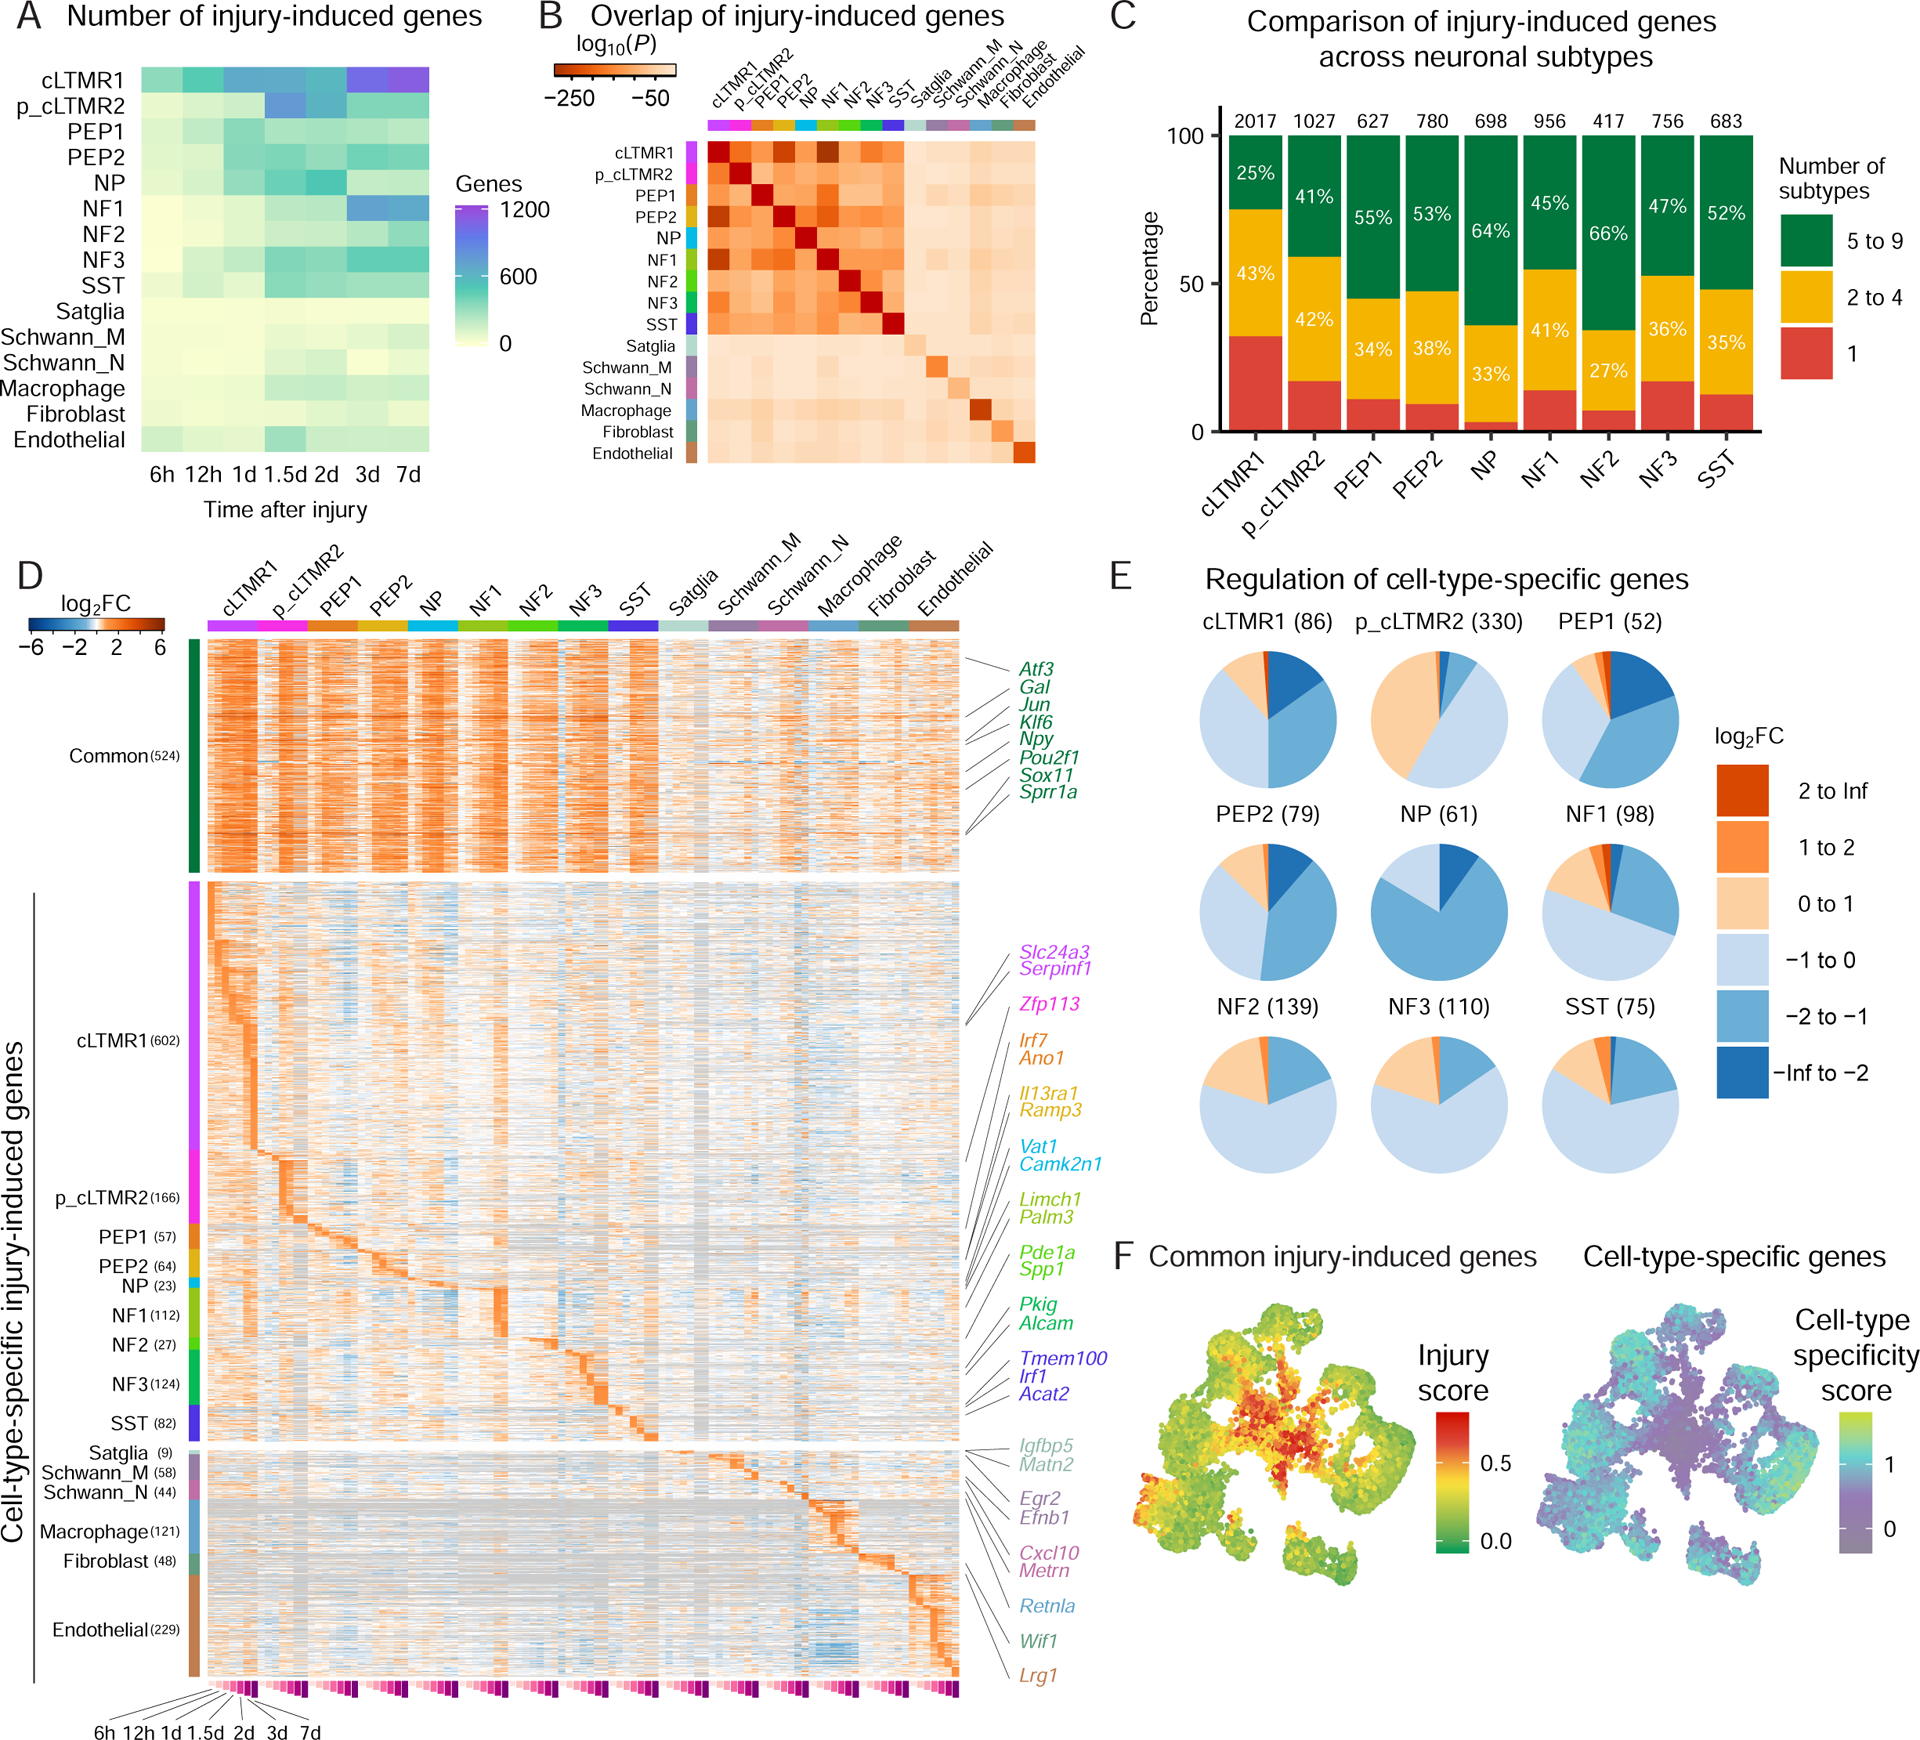
(A) Heatmap of the number of significantly induced genes in each cell type and time point after SpNT compared with respective naive cell types (FDR<0.01, log2FC>1).
(B) Comparison of the overlap between injury-induced genes (FDR<0.01, log2FC>1; 3–7d after SpNT vs. naive) for each cell type. Squares colored by P-value of overlap between each pair-wise comparison (hypergeometric test). Comparisons between the same gene list have 100% overlap but different P-values depending on list size.
(C) SpNT-induced gene expression changes within neuronal subtypes. Significantly upregulated genes after SpNT (FDR<0.01, log2FC>1 SpNT vs. naive) in each neuronal subtype were aggregated across time points and compared to other neuronal subtypes to determine the number of injury-induced genes that are CTS (red), shared between 2–4 neuronal subtypes (yellow), or shared between multiple ≥ 5 neuronal subtypes (green). The total number of significantly-induced genes by SpNT for each subtype is shown on each bar. See Tables S4 for gene lists.
(D) Heatmap of genes induced by SpNT for each cell type over time. Rows are common genes (significantly upregulated by SpNT vs. naive in ≥ 5 neuronal subtypes) and CTS genes (significantly upregulated by SpNT vs. naive in only 1 cell type). Columns are cell types. Log2FC (SpNT vs. naive) of a gene at each time point and cell type is displayed. Genes in gray are not detected.
(E) Regulation of CTS genes by SpNT for each cell type. CTS genes are expressed significantly higher in one naive cell type vs. all other naive cell types (see methods, Table S2). For each cell type, their CTS genes are grouped by log2FC after injury (SpNT at 3–7d vs. naive within each subtype). Pie charts show fraction of CTS genes within each neuronal subtype regulated by SpNT. Total numbers of CTS genes for each subtype are shown in headers.
(F) UMAP plots of randomly sampled 7,000 naive and 7,000 SpNT neurons, colored by an injury score calculated from expression of 524 commonly induced genes after SpNT (left, Table S4) or a CTS score (right) calculated for each neuronal type based on their CTS genes (see 4E, Table S2). Higher scores indicate greater injury-induced or CTS gene expression.
The common gene program induced after neuronal injury is enriched for genes involved in axon guidance, axonogenesis and regulation of cell migration (Figure S4B), and significantly overlaps (43.2% overlap, p=9×10⁻²⁹, hypergeometric test) with the injury-induced magenta gene module identified from a gene co-expression network analysis of bulk DRG microarray data (Chandran et al., 2016). This common neuronal transcriptional program includes genes previously identified as “regeneration-associated genes” (RAGs) in studies of axonal injury from bulk DRG tissue, such as Atf3, Gal, Jun, Npy, Sox11 and Sprr1a (Figure 4D, Table S4) (Chandran et al., 2016; Costigan et al., 2002; LaCroix-Fralish et al., 2011; Perkins et al., 2014; Xiao et al., 2002). In addition to RAGs, SpNT also drove gene expression changes that impact neuronal excitability across neuronal subtypes, including downregulation of multiple potassium channels and upregulation of the calcium channel Cacna2d1 and the purinergic receptor P2rx3 (Figure S4C). These ion channel gene expression changes as well as changes in several neuropeptides (Figure S4D) may contribute to the ectopic activity observed in injured neurons after axotomy (Hokfelt et al., 1994; Liu et al., 2000b; Patel et al., 2018; Serra et al., 2012; Tsantoulas and McMahon, 2014).
snRNAseq provided an opportunity to quantify the fraction of neurons within a DRG that induce the common transcriptional response to injury. We found that 3–7d after SpNT, 80–93% of neuronal nuclei induce the common injury gene program (Figure S4E), closely approximating the fraction of neurons physically axotomized in this model.
We also identified genes that are significantly induced by injury in specific neuronal subtypes (Figures 4C–D, Table S4). Genes selectively induced in nociceptors after injury are of particular therapeutic interest and are listed in Table S4. Pathway analysis identified enrichment of ERK signaling in PEP1/2, triglyceride mobilization in NP, and cholesterol metabolism in NF (Table S4). Thus, in addition to the common transcriptional response to injury across neuronal subtypes, distinct neuronal cell types also possess unique responses to injury that may contribute to differences in their capacity for axonal regeneration and their role in pain associated with nerve injury. Greater sequencing depth would likely reveal additional CTS and smaller magnitude gene expression changes after injury.
Axonal regeneration and neuropathic pain involve the participation of non-neuronal cells, such as the satellite glia that surround the somata of DRG neurons, and the myelinating and nonmyelinating Schwann cells found around DRG axons (Gosselin et al., 2010; Jessen and Mirsky, 2016; Ji et al., 2016; Wolbert et al., 2020). We found that satellite glia, myelinating and nonmyelinating Schwann cells induced gene expression changes after axotomy distinct from those in DRG neurons (Figures 4A, 4D). After injury, satellite glia selectively induce Matn2, which promotes inflammation and neurite outgrowth (Korpos et al., 2015), and Igfbp5, a target gene in the PPARα pathway implicated in axonal regeneration (Avraham et al., 2020). Consistent with previous reports, satellite glia also downregulate Kcnj10 after axonal injury, a potassium channel contributing to neuropathic pain (Vit et al., 2008), as well as Msmo1 and Lss, genes involved in cholesterol biosynthesis (Jager et al., 2020). After injury, myelinating Schwann cells induce Efnb1, an axon guidance molecule (Luxey et al., 2013), and nonmyelinating Schwann cells induce Metrn, which promotes neurite outgrowth (Nishino et al., 2004). Fibroblasts induce Wif1 after SpNT, consistent with transcriptional changes observed previously (Carr et al., 2019). These and the other injury-induced transcriptional changes selectively induced in non-neuronal cells (Table S3 includes a differential expression analysis for all cell types in Figure 4A) may play roles in axonal regeneration and pain (Avraham et al., 2020). To characterize injury-induced gene expression changes in B-cells, neutrophils and pericytes additional DRG cells would need to be sequenced.
Profound transcriptional reprogramming after axotomy
In addition to the induction of a common set of genes across neuronal subtypes after axotomy, there is also a concomitant downregulation of those genes that define the identity and functional specialization of each subtype (Figure 4E, Table S2). CTS genes within each neuronal subtype were identified by comparing gene expression in each naive cell type to that of all other DRG neuronal subtypes (FDR<0.01, log2FC>1). Over the same time frame as the induction of the common injury genes, between 58% and 100% of these CTS genes are downregulated after axotomy (Figure 4E). The inverse relationship between the upregulation of common injury response genes and the downregulation of CTS genes was quantified for each neuron using scores defined by mean expression of common injury genes (injury score) or CTS genes (CTS score) (Figures 4F, S4F–G).
To determine whether the downregulation of CTS genes in injured DRG neurons was specific to these genes or more broadly observed across the transcriptome, we compared the expression of CTS genes after injury to a set of randomly selected, expression-matched genes. CTS genes were significantly more downregulated after injury than randomly selected expression-matched genes in most neuronal subtypes (Figure S4G), indicating preferential downregulation of CTS genes in DRG neurons after injury rather than a global redirection of transcriptional activators from all genes to injury-response genes, or an artifact of normalization.
Time course of injury-induced transcriptional reprogramming
To investigate the kinetics of injury-induced transcriptional reprogramming from the initial injury through complete axonal regeneration, we turned to the Crush model (~50% DRG neurons axotomized) in which full axonal regeneration, target reinnervation, and functional recovery occur weeks to months after injury (Navarro et al., 1994; Vogelaar et al., 2004).
Similar to SpNT and ScNT, DRG nuclei from mice that underwent Crush began to adopt an “injured” transcriptional profile within 1d, with injured nuclei displaying maximal injury scores and minimal CTS scores 3–7d after injury (Figures 5A). Similar cell type distributions and injury-induced transcriptional changes were observed in male and female DRG neurons (Figures S3G, S5A, Table S5) (Lopes et al., 2017). Between 2w and 3mo following Crush, the injured clusters of neurons gradually disappear (Figures 5A–B) in parallel with functional recovery (Figure S5B).
Figure 5. Transcriptional reprogramming of DRG neurons after peripheral nerve injury.
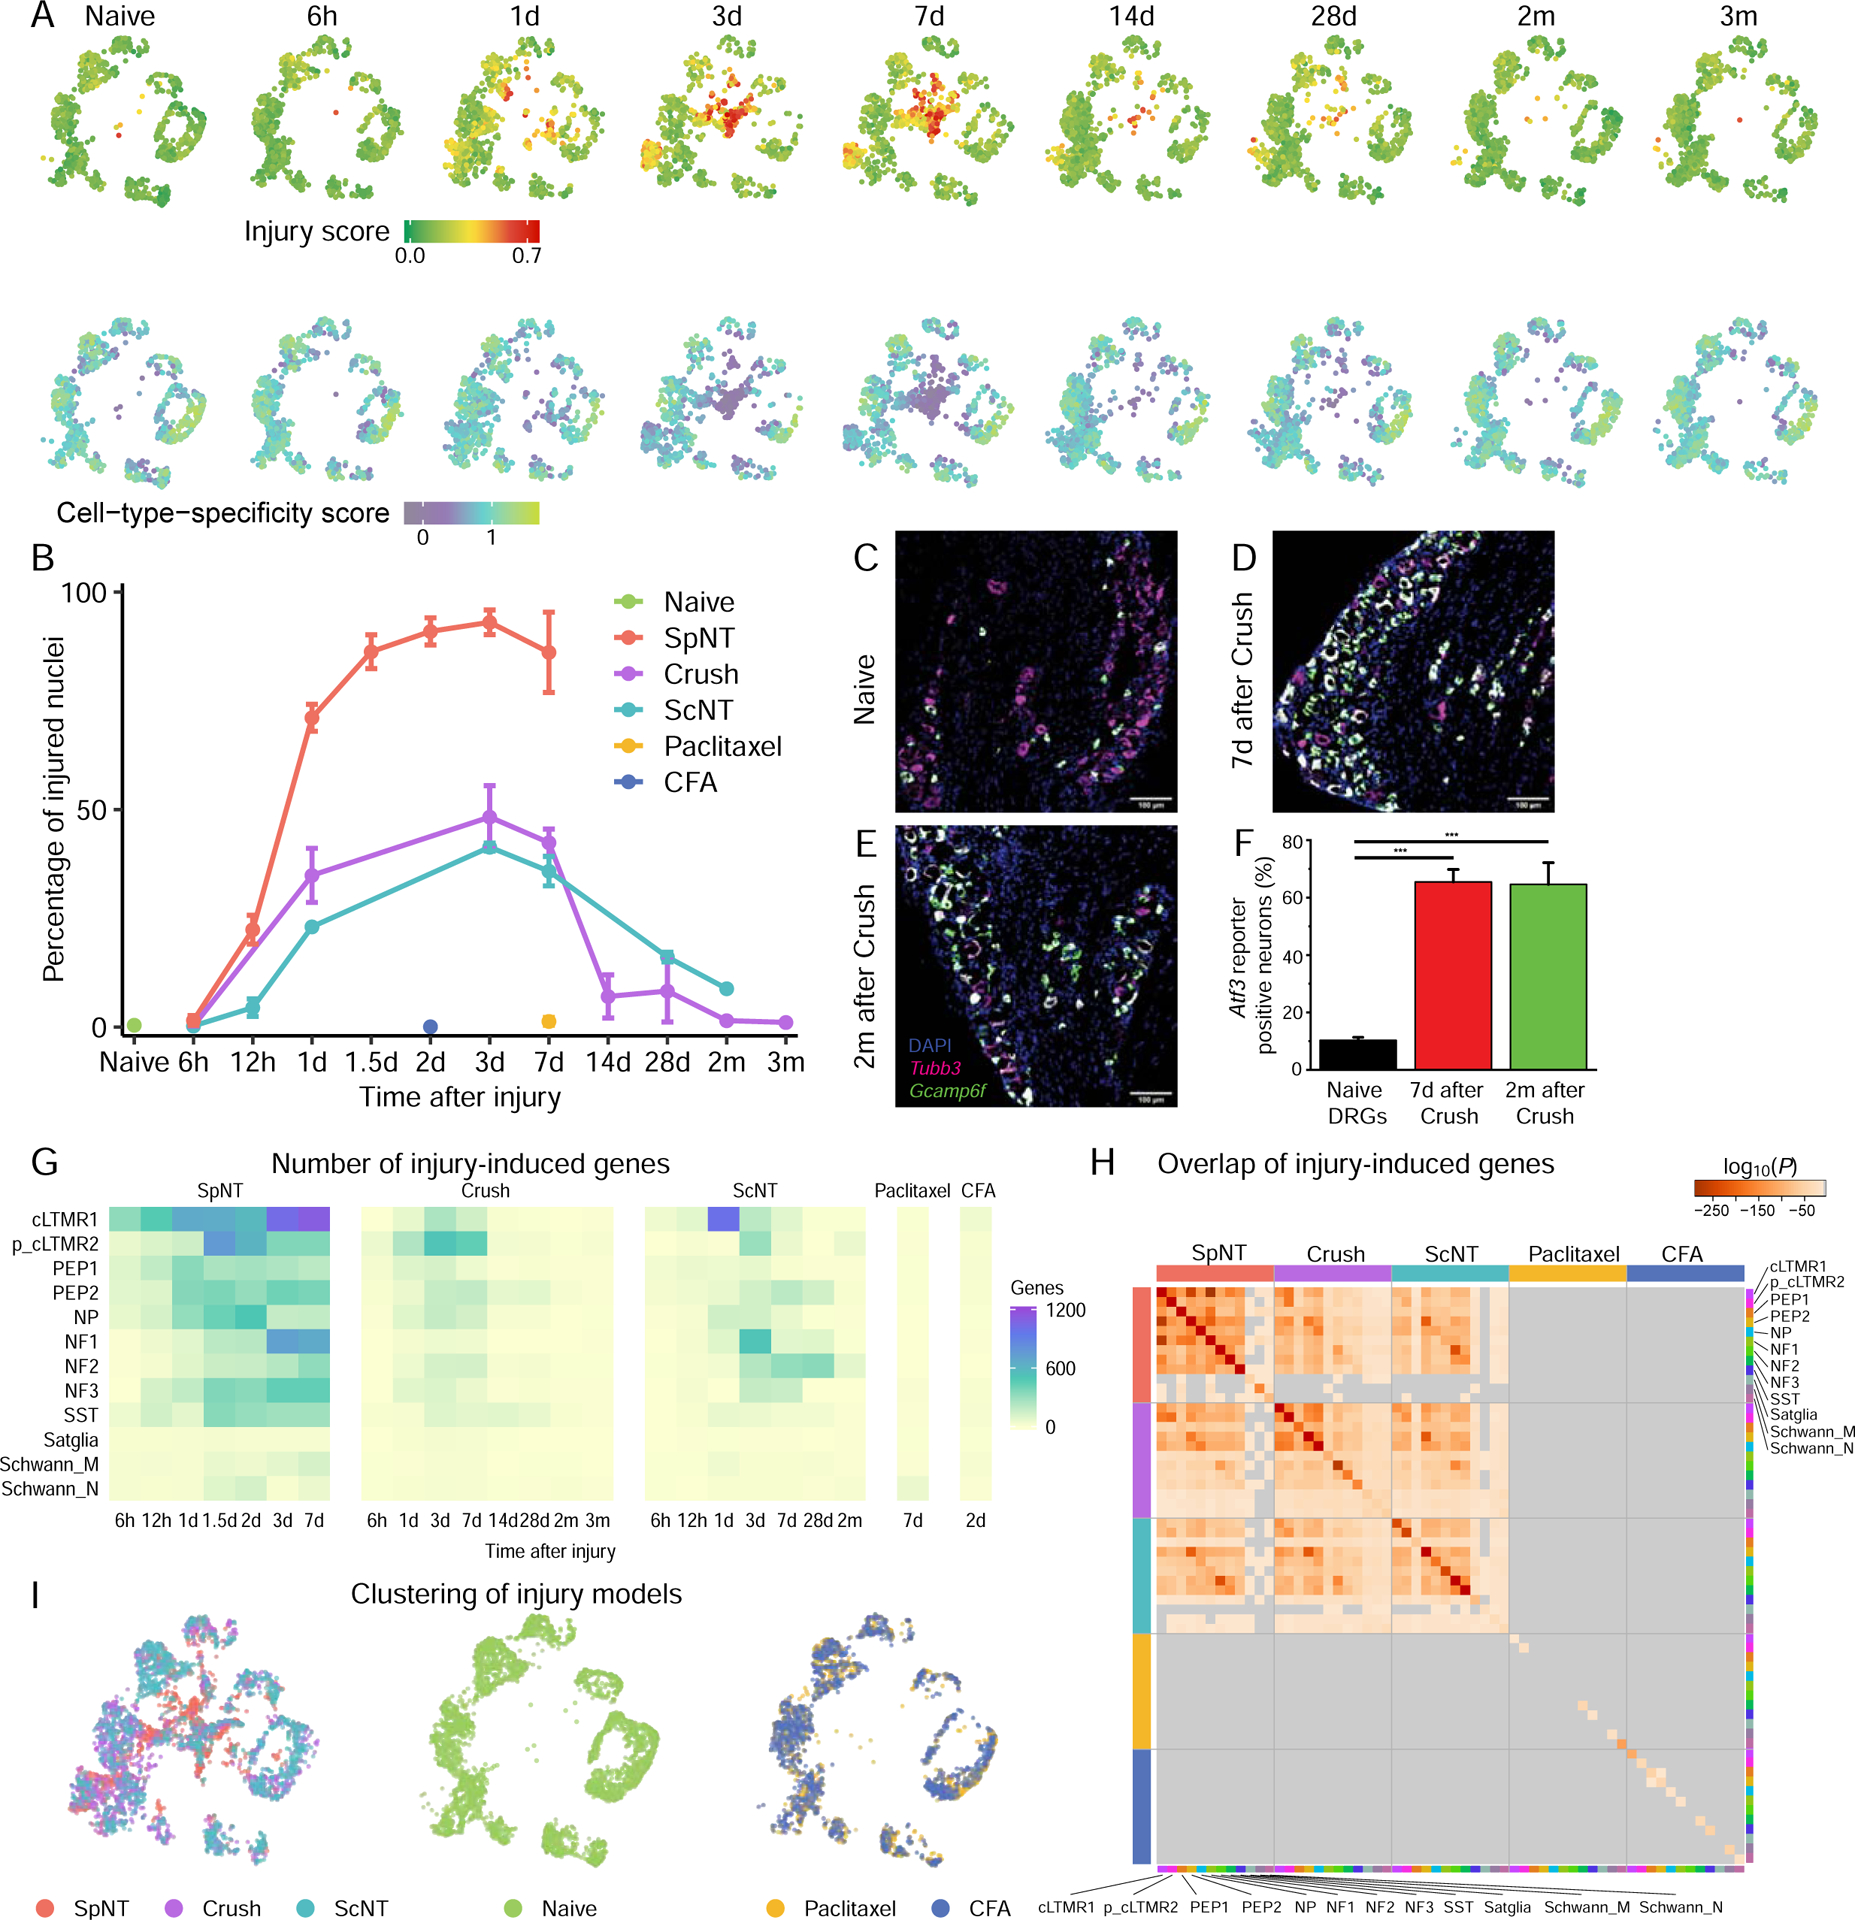
(A) UMAP plots of naive L3–5 DRG neurons or neurons at different times after Crush. Each time point is randomly down-sampled to 1000 neuronal nuclei. Nuclei are colored by injury score (top) or CTS score (bottom), as in Figure 4F. Higher scores indicate greater injury-induced or CTS gene expression.
(B) Percentage of neuronal nuclei classified as injured state at each time point after the respective injury, colored by injury model. SpNT and 6h-7d time points of ScNT are represented from Figure 1E for comparison.
(C-E) FISH images of ipsilateral L4 Atf3-CreERT2;Gcamp6f DRG sections from a naive mouse (C), 7d after Crush (D) and 2mo after Crush (E), stained for Tubb3 (magenta), DAPI (blue) and Gcamp6f (green). The Atf3-driven Gcamp6f reporter is upregulated after Crush and persists for months after injury. Scale bar = 100μm.
(F) Quantification of Gcamp6f reporter gene expression by FISH in L4 Atf3-CreERT2;Gcamp6f naive DRGs or DRGs from mice 7d or 2mo after Crush. N = 3–4 DRG sections from different mice per group, one-way ANOVA, F(2, 8) = 37.4, P = 8.7×10⁻⁵. Crush injury causes an increase in Gcamp6f reporter positive neurons 1w after Crush (Bonferroni post-hoc, P=2.9 × 10⁻⁴), which persists for 2mo after Crush injury (Bonferroni post-hoc, P=1.9 × 10⁻⁴).
(G) Heatmap of the number of significant injury-induced genes for each cell type and time point after SpNT, Crush, ScNT, paclitaxel, or CFA compared to respective cell types in naive mice (FDR<0.01, log2FC>1). The smaller number of gene expression changes in Crush and ScNT compared to SpNT is primarily a consequence of the smaller fraction of axotomized neurons in the distal injury models than SpNT (see Figures S6C–D).
(H) Pair-wise comparison of overlap between injury-induced genes in each cell type 3–7d after SpNT, Crush, ScNT, or paclitaxel or 2d after CFA (FDR<0.01, log2FC>1, compared to naive nuclei of respective cell type). Each square is colored by the P-value for the overlap between each comparison (hypergeometric test); P-values ≥0.05 are gray.
(I) UMAP plots of DRG neuronal nuclei after each injury model, colored by injury model. Left, 3,000 nuclei randomly sampled equally from SpNT, Crush, and ScNT; middle, 3000 nuclei randomly sampled from naive; right, 2,000 nuclei randomly sampled equally from paclitaxel and CFA).
The progressive reduction in the fraction of injured state neurons months after Crush may represent a reversal of transcriptional reprogramming or selective cell death of the injured neuronal population (Hart et al., 2002; Kataoka et al., 2007; Tandrup et al., 2000). To test the latter, we generated an injury reporter mouse (Atf3-CreERT2;Gcamp6f) in which Atf3 induction drives Cre-dependent expression of the Gcamp6f (Figure S5C). This reporter efficiently marks injured Atf3+ DRG neurons 1w after Crush (Figure S5D–F). The percentage of reporter-positive neurons was unchanged from 1w to 2mo after Crush, when injured-state neurons have largely disappeared (Figures 5C–F), indicating that most injured neurons do not die after Crush, but return to a naive transcriptional state.
To determine whether injured neurons that return to the naive state after Crush retain their original cell identity, we quantified the neuronal subtypes in which the Mrgprd-CreERT2;Gcamp6f reporter is expressed 2mo after Crush. If cell identity changes after axonal injury, reporter expression would be observed in multiple cell types after the nerve regenerates. However, the reporter remains predominantly in NP neurons 2mo after Crush, as in naive mice, without increased expression in other cell types (Figures S3E–F). Thus, cell identity is retained after injury-induced transcriptional reprogramming, with recovery of original cell identity occurring over the same time course as regeneration and reinnervation.
To test whether functional reinnervation is necessary for disappearance of the injured transcriptional state, we quantified the fraction of injured state neurons between 1w and 2mo after ScNT, a model where functional reinnervation is not possible due to the ligation of the proximal sciatic nerve stump. Although there was a reduction in the fraction of injured state neurons between 1w and 2mo after ScNT, a significantly greater fraction of neurons remained in the injured state 28d (P<0.05, permutation test) and 2mo (P<0.01, permutation test) after ScNT than Crush (Figure 5B). However, DRG neuron death after ScNT may contribute (Oliveira, 2001; Shi et al., 2001). Future studies are needed to determine what fraction of surviving neurons return to the naive state after ScNT vs. remain in the injured state.
CTS marker genes are downregulated in injured neurons after Crush (Figures 5A, S5G–L) as after SpNT. To characterize gene expression changes after Crush in different neuronal subtypes, we classified injured neuronal subtypes if they co-clustered with the previously classified injured neuronal subtypes after SpNT (Figure S6A). Differential gene expression analysis comparing injured neuronal subtypes after Crush at each time point after injury with their respective naive subtypes, revealed a peak of gene induction 3–7d after injury, similar to that observed for SpNT (Figure 5G). There was significant overlap between the genes induced in any given cell type across all axotomy models (Figure 5H), indicating that a common transcriptional program is induced by axotomy in most peripheral DRG neuron subtypes, regardless of injury location (proximal or distal) or the fraction of injured DRG neurons. Because unaxotomized neurons in injured mice exhibit few gene expression changes compared to naive neurons (Figure S6B), the smaller number of gene expression changes in Crush and ScNT than SpNT is primarily a consequence of the smaller fraction of axotomized neurons in distal injury models than in SpNT. The magnitude and composition of gene expression changes are similar between distal and proximal axotomy models when only neurons in the injured state are compared with naive controls (Figures S6C–D).
Inflammatory and chemotherapy-induced pain models
The high correlation between the transcriptional programs induced by three different physical axotomy models led us to test whether similar reprogramming is engaged in a model of paclitaxel-induced allodynia and a CFA model of inflammatory pain. In mice, paclitaxel treatment causes mechanical allodynia 1w after treatment and peripheral neuropathy 4w after treatment (Toma et al., 2017), while hindpaw injection of CFA leads to inflammation and mechanical allodynia lasting for at least 1w (Figure S6E–F) (Ghasemlou et al., 2015; Jaggi et al., 2011). We performed snRNAseq on L3–5 DRGs from mice after 1w of paclitaxel or 2d after CFA when pain-related behavior is prominent, and compared gene expression changes within each DRG cell type to those which occur after axotomy. Over 99% of neurons from paclitaxel-treated mice and CFA-treated mice clustered together with naive nuclei and are classified as in a naive transcriptional state (Figure 5I). CTS differential expression analysis between paclitaxel- or CFA-treated and naive mice identified few statistically significant genes (Figure 5G, Table S3) and those significantly regulated, have little overlap with the axotomy models (Figure 5H–I). These results suggest that a painful phenotype can emerge without the transcriptional reprogramming induced in DRG neurons by axotomy. Overlapping mechanisms may nevertheless occur, such as an increase in macrophages in paclitaxel-treated DRG samples and after axotomy (Figure S2C).
Transcriptional mechanisms underlying injury-induced transcriptional reprogramming of DRG neurons
To identify TFs that mediate injury-induced transcriptional reprogramming, we focused on those that are both induced rapidly (≤1d) after injury and which have consensus DNA binding motifs enriched in the genes induced after reprogramming has occurred (Figure 6A). We identified 9 TFs (Sox11, Atf3, Jun, Bhlhe41, Klf6, Stat2, Klf7, Smad1, Ets2) upregulated within 1d after SpNT across different neuronal subtypes and whose DNA binding motifs are enriched in the set of common injury genes that define injured state neurons (Figures 6B–C). Many of the 9 TFs were previously detected after axonal injury (e.g. ATF3, JUN, SOX11) (Chandran et al., 2016; Herdegen et al., 1992; Jankowski et al., 2009; Mahar and Cavalli, 2018; Patodia and Raivich, 2012; Tsujino et al., 2000). While newly identified TFs (e.g. BHLHE41 & ETS2) warrant further investigation, two TFs, JUN and ATF3, are associated with the highest number of enriched motifs in the common injury gene set, an effect not observed for random expression-matched sets of genes (Figure S6G, permutation test, P<0.001). We chose to focus on ATF3 because it is the TF that exhibits the largest induction after injury across all neuronal subtypes. Moreover, we observed a strong and significant correlation between the level of Atf3 mRNA and its predicted activity on its target genes in individual neurons after injury (Figure 6D, Pearson’s r=0.5), consistent with a role in driving injury-induced transcriptional reprogramming.
Figure 6. Induction of a common set of transcription factors across DRG neuronal subtypes after peripheral nerve injury.
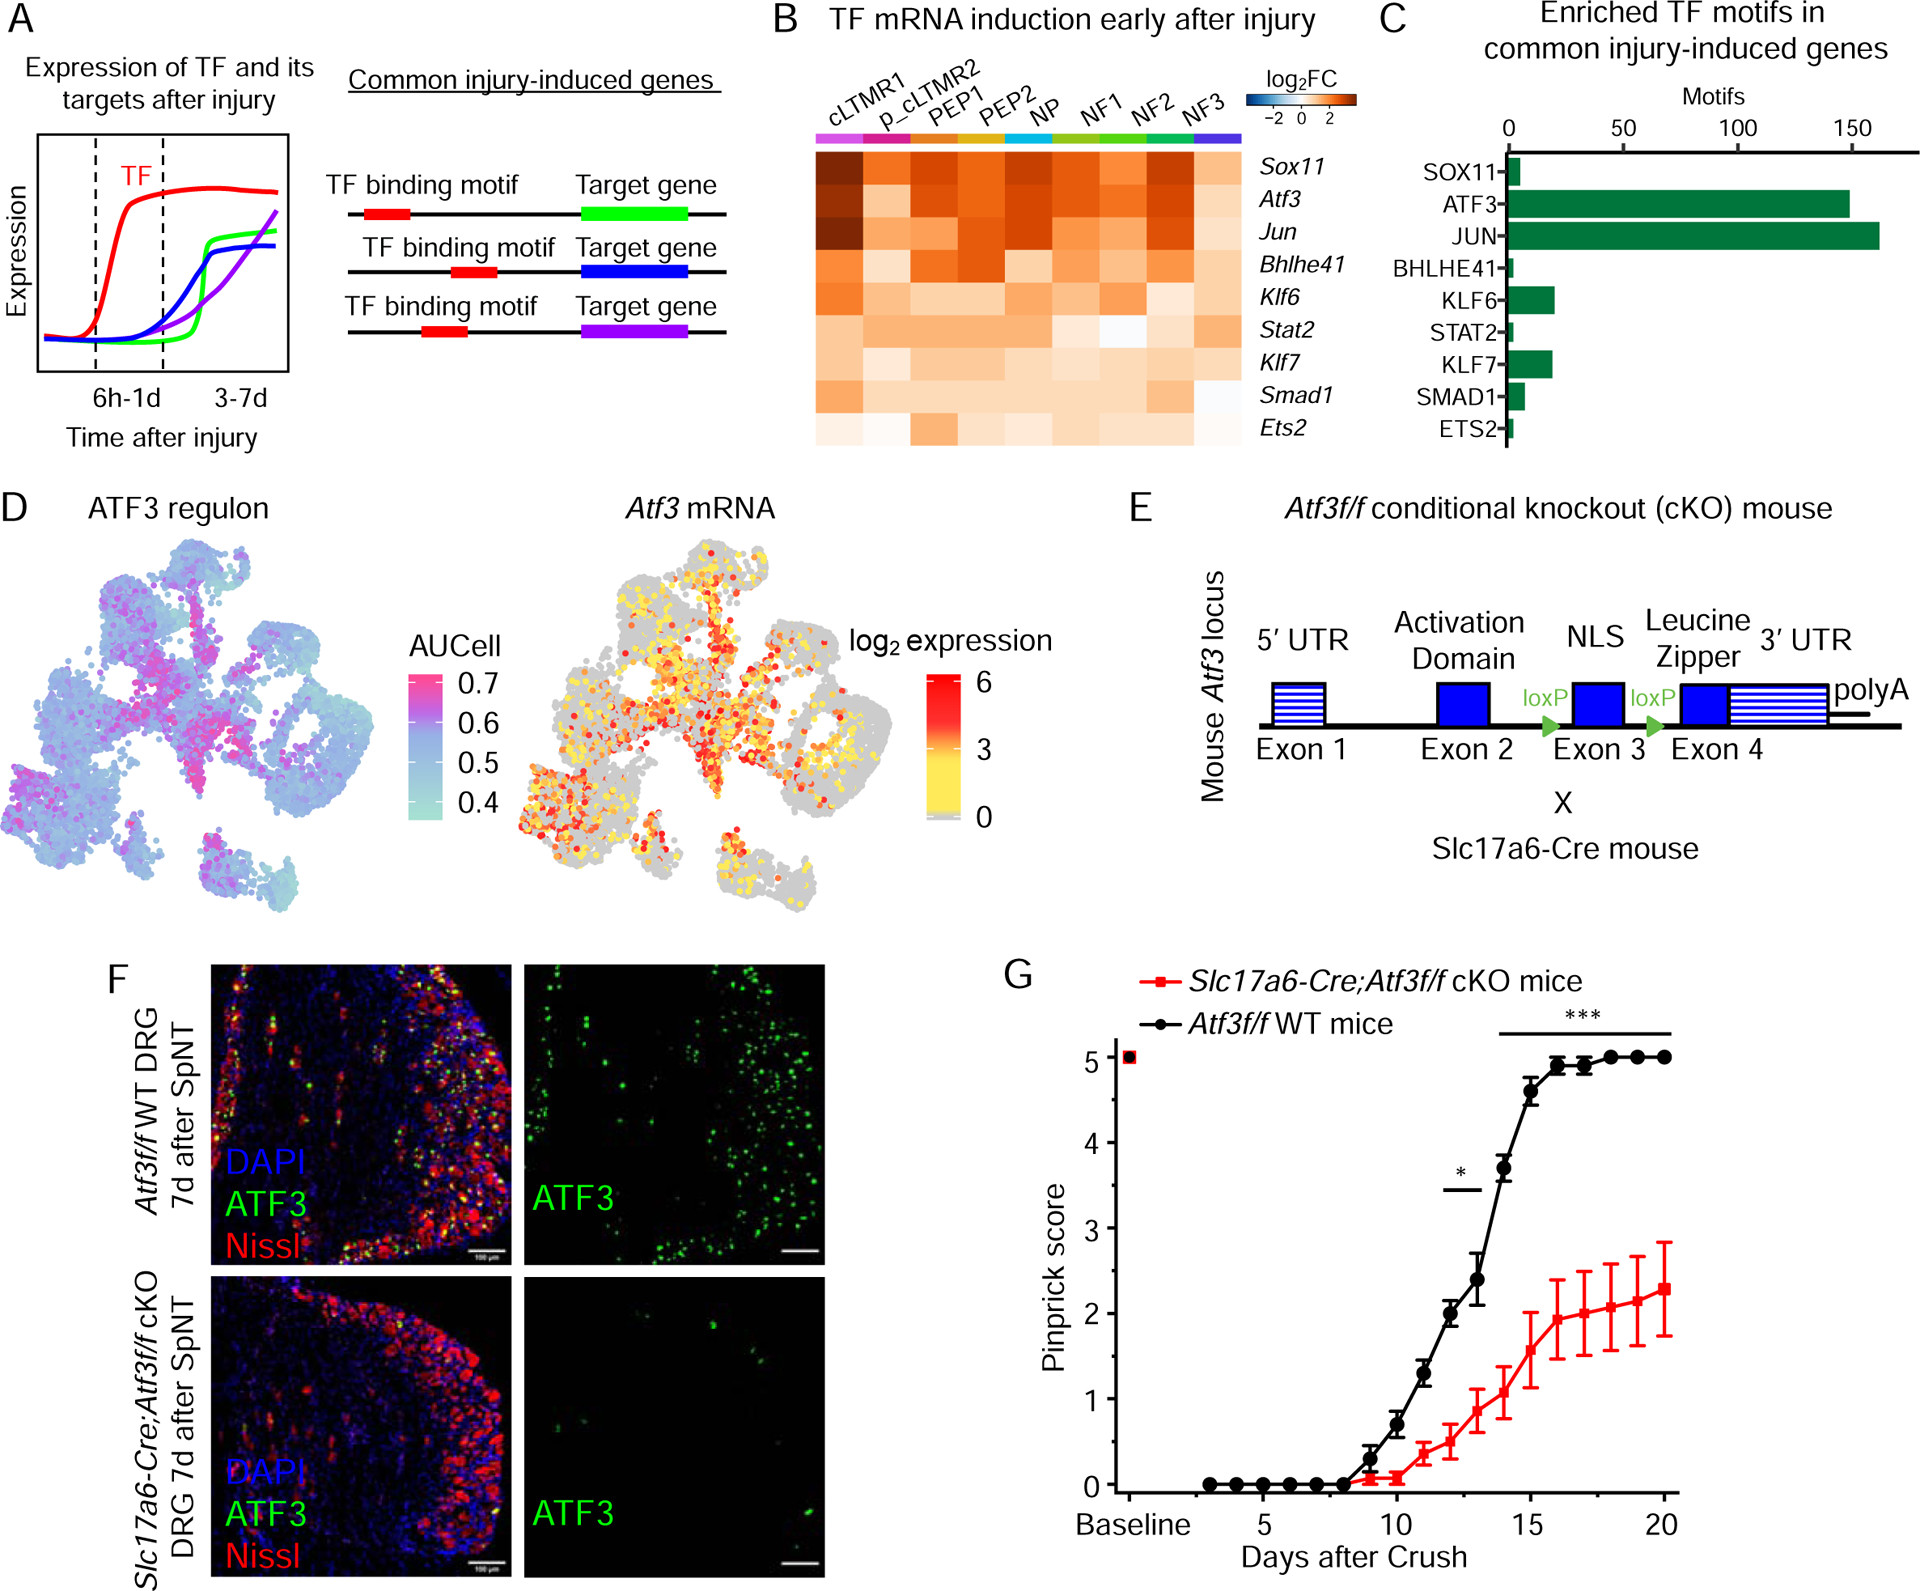
(A) Diagram of the criteria used to identify transcription factors (TFs) involved in injury-induced transcriptional reprogramming. TFs are selected if they are upregulated rapidly after injury (6hr-1d) and have their TF binding motifs significantly enriched in the set of genes commonly upregulated 3–7d after injury across cell types.
(B) Heatmap of log2FC (6h-1d after SpNT vs. naive for each cell type [columns]) for 9 TFs (rows) induced ≤1d after SpNT (FDR<0.01, log2FC>1, SpNT vs naive) in ≥5 neuronal subtypes and whose TF binding motifs are significantly enriched in the set of 524 common injury-induced genes 3–7d after SpNT (see Table S4).
(C) Bar graph of the number of early injury-induced TF binding motifs present in the 524 genes commonly upregulated 3–7d after injury across cell types.
(D) UMAP of 7,000 naive and 7,000 SpNT neuronal nuclei colored by degree of ATF3 regulon enrichment (left, AUCell score, see methods) or log2 expression of Atf3 (right).
(E) Strategy to create Atf3 conditional knockout (cKO) mice. Slc17a6-Cre;Atf3f/f = cKO, Atf3f/f = WT.
(F) Representative images of WT (top) or ATF3 cKO (bottom) L4 DRGs 7d after SpNT stained for ATF3 (green), DAPI (blue) and Nissl (red). There is a clear loss of ATF3 staining after SpNT in the cKO compared to WT.
(G) Recovery of sensory function in WT and Atf3 cKO mice after sciatic nerve Crush. Pinprick responses of Atf3 cKO mice (n=14) show a significant delay in sensory recovery compared to WT mice (n=10) (2-way repeated measures between subjects ANOVA, F(1, 22)=33.7, P=7.7×10⁻⁶, Bonferroni post-hoc, *P<0.05, ***P<0.001).
To determine directly if ATF3 plays a role in DRG neuron regeneration after injury, we generated a floxed Atf3 mouse and crossed it with Slc17a6-Cre (also known as Vglut2-Cre) mice (Figure 6E), resulting in a conditional knockout (cKO) of Atf3 from nearly all DRG neurons (fraction of DRG neurons that are ATF3+ Nissl+ 1w after SpNT - Atf3 WT: 89±1%; Atf3 cKO: 4±2%; n=4 sections, p<0.001, two-tailed Student’s t-test) (Figure 6F). Consistent with a specific role for ATF3 in axonal regeneration (Gey et al., 2016; Jing et al., 2012; Seijffers et al., 2006), deletion of ATF3 in DRG neurons resulted in a significant delay in functional sensory recovery after Crush (Figure 6G), an effect also observed using a tamoxifen-inducible cKO in adult Brn3a-CreERT2;Atf3f/f mice where Cre is expressed in all DRG neurons (O’Donovan et al., 2014) (Figures S7A–C).
Having confirmed a critical role for ATF3 in the functional regeneration of DRG neurons after axonal injury, we next asked whether ATF3 is required for injury-induced transcriptional reprogramming. To do this, we performed snRNAseq on Atf3f/f (WT) and Slc17a6-Cre;Atf3f/f cKO DRGs from naive mice or mice 1.5 or 7d after Crush. We clustered WT and Atf3 cKO neuronal nuclei together and found that their naive neuronal subtypes cluster together and express the same subtype-specific marker genes (Figures 7A–B, S7D), indicating high transcriptional similarity between naive WT and naive Atf3 cKO DRG neurons. To compare the transcriptional responses of WT and Atf3 cKO mice after Crush, we identified those clusters of neurons from injured mice not present in naive mice (Figures 7B, S7E–F). Injured Atf3 cKO neurons cluster separately from injured WT neurons (Figure 7B), are associated with significantly lower putative ATF3 target gene induction than injured WT neurons (Figure 7C) and express common injury genes at significantly lower levels than injured WT neurons (e.g. Sprr1a, Gal, Gap43) (Figures 7D, S7G, Table S6). Significantly fewer Atf3 cKO DRG neurons are in an “injured” transcriptional state 1.5 and 7d after Crush than WT injured neurons (Figure 7E), an effect that is likely not explained by neuronal cell loss (Figure S7H).
Figure 7. Atf3 is required for injury-induced transcriptional reprogramming.
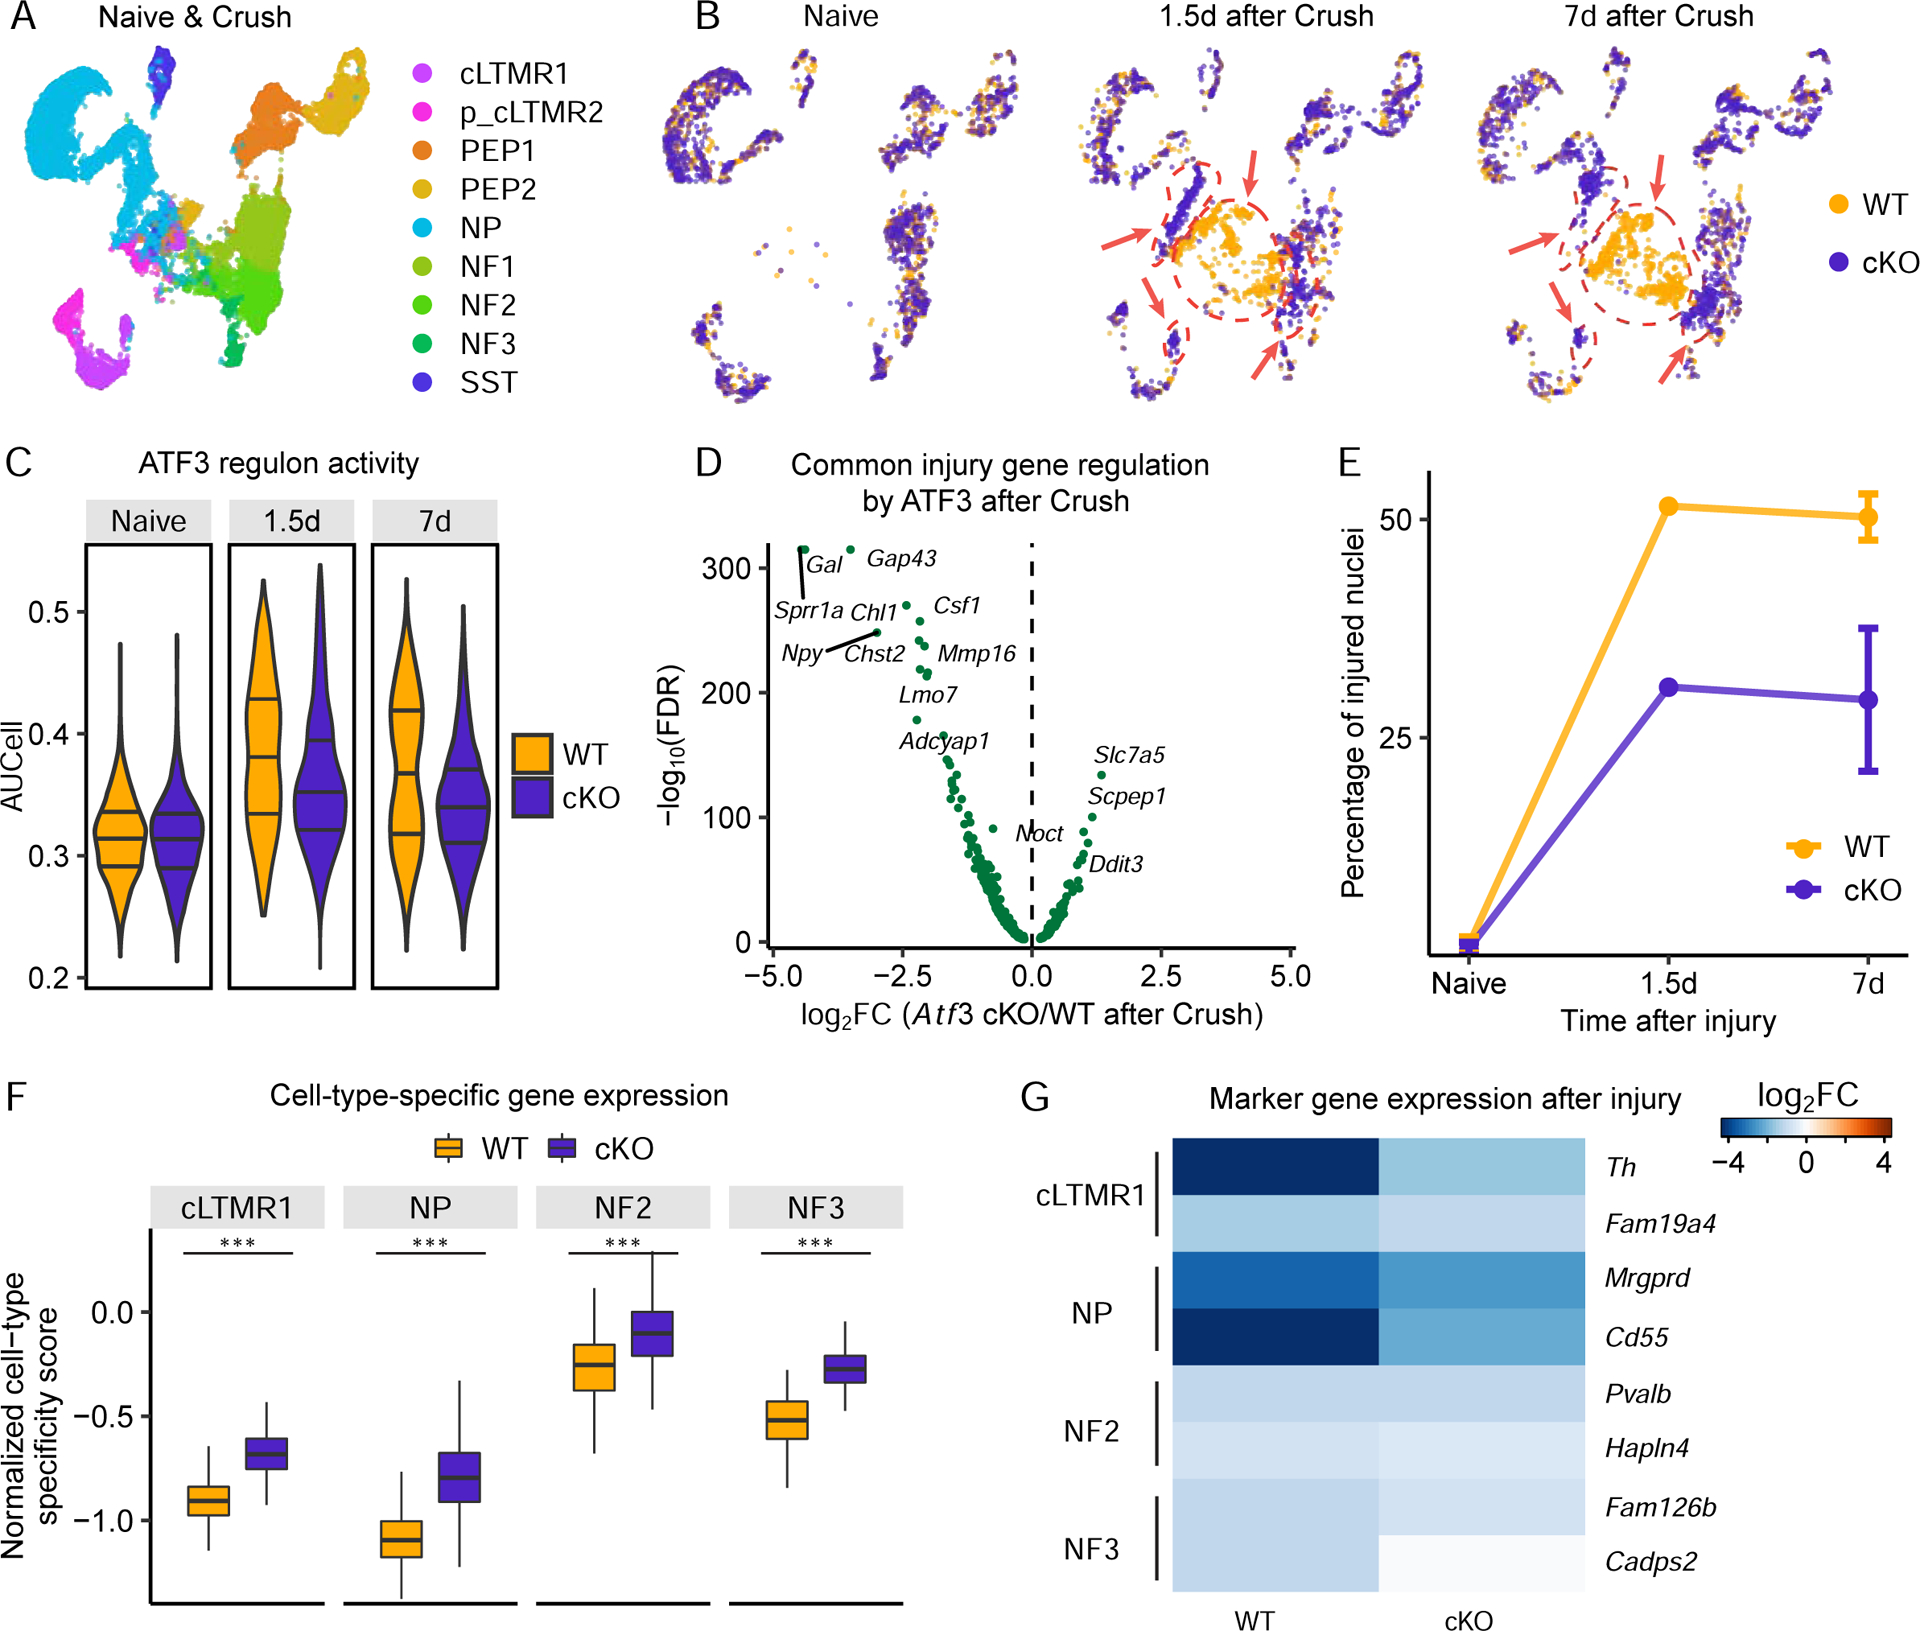
(A) UMAP plot of 8,777 Atf3f/f (WT) and 8,888 Slc17a6-Cre;Atf3f/f (cKO) DRG neurons from naive mice and mice 1.5d and 7d after Crush, colored by neuronal subtype.
(B) UMAP plot of 8,777 WT and 8,888 Atf3 cKO DRG neurons from naive mice (left), 1.5d after Crush (middle), and 7d after sciatic rush (right), colored by genotype. Arrows point to injured state clusters (see Figure S7E).
(C) Violin plot of ATF3 regulon enrichment (AUCell score) within individual neuronal nuclei. Neuronal nuclei are grouped by genotype (WT or cKO) and injury (naive, 1.5d after Crush, 7d after Crush). Lines in violin plots indicate lower or upper quartile and median. One-way ANOVA: F(5, 17659)=1042.55, P<0.001; Tukey HSD post-hoc testing P>0.05 for naive cKO vs. naive WT, P<0.001 for all other pair-wise comparisons.
(D) Volcano plot displays differential expression (log2(fold change) x-axis, -log10(FDR) y-axis) between injured state Atf3 cKO and WT neuronal nuclei (injured state classified in Figure S7E) for 523 of the 524 common injury-induced genes (Table S4) that are also expressed in Atf3 WT and cKO mice.
(E) Percent of neuronal nuclei classified as injured state in each condition (naive, 1.5d, and 7d after Crush) and genotype (WT or Atf3 cKO). There is a significant reduction in the fraction of injured state neurons in Atf3 cKO compared to WT and 7d after Crush (one-way ANOVA: F(3, 6)=105.22, P<0.001; Tukey HSD post-hoc testing P>0.05 for naive cKO vs. naive WT, P<0.01 for Crush WT vs Crush cKO, P<0.001 all other pairwise comparisons).
(F) Box plots of CTS scores (blue) in naive mice and cKO mice 7d after Crush. Scores are normalized to the naive average. Boxes indicate quartiles of expression, and whiskers are 1.5-times the interquartile range (Q1-Q3). Median is the black line inside each box. ***P<0.001, two-tailed Student’s t-test.
(G) Heatmap of the fold change of marker genes (rows) within respective cell types 7d after Crush vs. naive in either WT or Atf3 cKO mice (columns). Each marker gene is significantly less downregulated in Atf3 cKO 7d after Crush in than in WT mice (FDR<0.01).
The magnitude of the transcriptional differences between WT and Atf3 cKO neurons after nerve injury raises the possibility that the downregulation of CTS genes in injured WT neurons may involve ATF3. To test this, we compared changes in CTS gene expression after injury in four DRG neuronal subtypes in WT and Atf3 cKO mice. In all four neuronal subtypes (cLTMR1, NP, NF2, NF3), the injury-induced downregulation of CTS genes was significantly attenuated in Atf3 cKO neurons compared to WT neurons (Figures 7F–G). However, the role of ATF3 in downregulating CTS genes after injury is likely to be indirect as ATF3 binding motifs are not enriched in these genes (Figure S7I). These findings underscore the critical role ATF3 plays both in the transcriptional response to axonal injury and axonal regeneration (Schmid et al., 2014; Woolf et al., 1990).
Discussion
Peripheral axotomy initiates a cascade of events that result in the conversion of mature sensory neurons into actively growing cells. Previous studies have generated a number of mechanistic insights into this process, largely relying on gene expression studies from bulk DRG tissue (Chandran et al., 2016; Costigan et al., 2002; Xiao et al., 2002), or dissociation/sorting of small numbers of DRG neurons (Chiu et al., 2014; Sakuma et al., 2016; Usoskin et al., 2015; Zeisel et al., 2018), a process which induces many injury-related transcriptional changes (Hrvatin et al., 2018; Lacar et al., 2016; Wu et al., 2017). To avoid these confounders, we used snRNAseq to generate a DRG cell atlas from naive and injured mice. Using these data, we interrogated the transcriptional mechanisms by which injury initiates axonal regeneration and contributes to neuropathic pain (Cattin and Lloyd, 2016; Ji et al., 2016).
Remarkably, we observed that peripheral axotomy results in a profound transcriptional reprogramming of DRG neurons, involving both an induction of a common set of injury-response genes across neuronal subtypes and the coincident downregulation of genes that define transcriptional identity. This transcriptional reprogramming is reversible, as the transcriptional states of injured neuronal nuclei return to their naive states within weeks (Figures 5A–B, S3E–F), coinciding with target reinnervation (Figure S5B) (Navarro et al., 1994; Vogelaar et al., 2004).
Injury-induced transcriptional reprogramming leads to a new transcriptional state in which neuronal subtypes are difficult to distinguish because of both the upregulation of a common set of injury-response genes and the downregulation of CTS genes after injury. An analogous process also occurs in the trigeminal ganglion after infraorbital nerve injury (Nguyen et al., 2019) and in retinal ganglion cells after optic nerve injury (Tran et al., 2019). We developed a bioinformatic approach, validated by cell-type tracing, to classify each injured neuronal subtype and identify their transcriptional response to axonal injury. Although we observed CTS gene induction after axonal injury that may contribute to the distinct responses between different cell types (Figures 4D, S4C–D, Tables S3–4), the most striking observation was that injury-induced genes are largely shared across different neuronal subtypes and that the unique gene expression patterns defining distinct subtypes observed in naive neurons are downregulated after injury (Figures 4E, S4F–G).
A rapid induction of a small set of TFs within hours of axotomy precedes the profound transcriptional reprogramming that occurs over the following days. Some of these TFs (e.g. Atf3, Jun, Klf6) also have consensus DNA binding sites enriched in regions upstream of the 524 genes commonly induced across most neuronal subtypes 3–7d after injury. These features raise the possibility that early injury-induced TFs, such as ATF3, may initiate the transcriptional reprogramming that occurs over the days following injury. Supporting this, we found that conditional deletion of ATF3 in DRG neurons resulted in significantly less induction of the common neuronal injury gene program (Figures 7D, S7G) and an attenuation of injury-induced transcriptional reprogramming (Figures 7E–G) compared to WT. These findings are consistent with previous reports in mice and humans that implicate ATF3 in peripheral neuron regeneration (Bonilla et al., 2002; Gey et al., 2016; North et al., 2019; Seijffers et al., 2007; Tsujino et al., 2000) and reports suggesting that ATF3 overexpression can promote central neuron regeneration (Kole et al., 2020; Seijffers et al., 2014).
While ATF3 is necessary both for the full induction after injury of the common injury gene set and the downregulation of CTS genes, consensus ATF3 DNA binding motifs are only enriched in the common injury gene set (Figures 6C, S6G, S7I). Downregulation of CTS genes after injury may, therefore, be an indirect consequence of ATF3 or another injury-induced TF, and/or the redirection of RNA polymerase/co-activators from CTS genes to common injury response genes. ATF3 is likely to act in concert with other injury-induced TFs, such as Jun, Sox11, Smad1 and Klf6 (Chandran et al., 2016; Raivich et al., 2004), to produce the transcriptional and functional metamorphosis of mature neurons devoted to sensory transduction into injured state neurons engaged in axonal growth and target re-innervation, a state which is accompanied by pain-producing ectopic neuronal activity.
The significant overlap between the common injury genes we identify here (Table S4) and regeneration-associated genes described previously (Ma and Willis, 2015; Mahar and Cavalli, 2018), suggests that many of these genes may contribute to axonal regeneration. The downregulation of CTS genes after injury may also have functional implications, as many are ion channels that affect neuronal excitability (Figure S4C). For example, there is a broad downregulation of voltage-gated potassium channels after peripheral axotomy, as reported in bulk gene expression studies (Bangash et al., 2018; Chandran et al., 2016; Tsantoulas and McMahon, 2014) and which are associated with the neuronal hyperexcitability linked to injury-induced neuropathic pain (Colloca et al., 2017; Haroutounian et al., 2014; Serra et al., 2012). The downregulation of CTS genes may also be necessary to transcribe genes important for axonal regeneration at sufficient scale.
It has been hypothesized that axonal injury may reactivate embryonic development programs to drive regeneration (Harel and Strittmatter, 2006; Lisi et al., 2017; Poplawski et al., 2020). However, while we observed an induction of a limited number of genes after injury that are regulated during embryonic DRG development (Figure S7J, Table S7), the overlap between gene expression programs is not statistically significant.
Some of the TFs induced after axonal injury are related to families of TFs capable of reprogramming differentiated cells into induced pluripotent stem cells or the transdifferentiation of mature cells to another cell type (e.g. KLF7, SOX11, ATF3). This commonality suggests that strong environmental stimuli, such as axonal injury, may invoke transcriptional reprogramming mechanisms similar to those required to convert cells from one transcriptional identity to another, in order to change the primary function of somatosensory neurons from sensory transduction to axonal regeneration (Duan et al., 2019; Ronquist et al., 2017). However, unlike stem cell reprogramming, injury-induced reprogramming is self-limited and reversible, affecting the cell’s transcriptional state along the same time course as axonal regeneration and reinnervation. The mechanisms governing the timing and mechanisms of the activation and deactivation of injury-induced transcriptional reprogramming require future investigations.
Injury models such as paclitaxel-induced allodynia or CFA-induced inflammatory pain did not induce an injured transcriptional state similar to that observed after axotomy. Larger changes in gene expression may occur with higher doses of paclitaxel treatment or at time points when Atf3 induction has been reported (Peters et al., 2007). Our findings are broadly consistent with bulk gene expression studies (Bangash et al., 2018; Zhang and Dougherty, 2014) and support the hypothesis that distinct mechanisms may drive nociceptor sensitization in neuropathic and other pain models. However, we observed macrophage infiltration into the DRG after both peripheral axotomy and paclitaxel treatment that may contribute to the pain phenotype (Figure S2B–C, S2E), consistent with previous studies (Hu and McLachlan, 2002; Kwon et al., 2013; Liang et al., 2020; Liu et al., 2000a; Zhang et al., 2016).
In contrast to the dramatic transcriptional reprogramming of axotomized DRG neurons, non-neuronal cells such as satellite glia or Schwann cells display quite distinct injury-induced changes in gene expression (Figures 4A–B, S4A). The mechanisms of these changes and their functional consequences will need to be explored in the future.
We expect that single-cell DRG atlases from both mice and humans will help catalyze the identification of novel therapeutic targets for promoting nerve regeneration and controlling neuropathic pain. In particular, identification of genes selectively expressed in nociceptors (Figure S2A) including known analgesic targets such as Calca (CGRP), Trpv1 and Scn10a (Nav1.8) (Woolf, 2020), as well as nociceptor-selective injury-induced genes (Figure 4D, Tables S3–4) may guide development of more selective pain therapeutics. Towards this goal, we have created an online resource at www.painseq.com to enable exploration of the gene expression changes that occur in response to peripheral nerve injury.
STAR METHODS
RESOURCE AVAILABILITY
Lead Contact
Further information and requests for resources and reagents should be directed to and will be fulfilled by the Lead Contact, William Renthal (wrenthal@bwh.harvard.edu).
Materials Availability
The transgenic mouse lines generated in this study are available from Clifford J. Woolf (Clifford.woolf@childrens.harvard.edu) upon reasonable request.
Data and Code Availability
Processed data are available at www.painseq.com. Raw and processed data were also deposited within the Gene Expression Omnibus (GEO) repository (www.ncbi.nlm.nih.gov/geo) with an accession number (GSE154659). Custom R scripts are available upon request.
EXPERIMENTAL MODEL AND SUBJECT DETAILS
Mice
8–12-week-old C57BL/6J mice were obtained from the Jackson Laboratory (JAX) (strain #000664; RRID:IMSR_JAX:000664). Unless stated otherwise, male mice were used in all experiments. The Atf3-CreERT2 mice were generated by inserting an IRES_CreERT2_pA cassette at the 3’UTR of the mouse Atf3 locus in order to preserve endogenous Atf3 expression. CRISPR guide RNAs were designed to produce a defined double-strand break (DSB) at the 3’UTR in order to enable homology-directed repair (HDR). The HDR donor sequence consisted of IRES_CreERT2_pA cassette flanked by two homologous arms 1 kb (left-arm) and 4 kb (right-arm) in length. We mixed synthetic sgRNA targeting at 3’UTR of mouse Atf3, Cas9 protein and HDR donor, and then injected the mixture directly into single-cell mouse embryos. Atf3-CreERT2;Gcamp6f f/f mice were generated by crossing the Atf3-CreERT2 transgenic mice with Gcamp6f f/f mice (Jackson Labs strain #024105, RRID:IMSR_JAX:024105) and bred to homozygosity for both alleles. Gcamp6f reporter expression was induced in injured Atf3-CreERT2;Gcamp6f f/f mice 24 hrs after injury by intraperitoneal (i.p.) tamoxifen injection at the same time as in naive Atf3-CreERT2;Gcamp6f f/f mice. Atf3f/f mice were generated by inserting loxP sites around exon 3 of the mouse Atf3 gene. Slc17a6-Cre;Atf3f/f and Brn3a-CreERT2;Atf3f/f mice were generated by crossing the Atf3f/f mice with Slc17a6-ires-Cre (JAX strain #016963; RRID:IMSR_JAX:016963) which express Cre in >95% of sensory neurons (Kupari et al., 2019), or Brn3a-CreERT2 (JAX strain #032594; RRID:IMSR_JAX:032594) mice. These mice were bred as homozygotes for Atf3f/f and heterozygotes for Slc17a6-Cre or Brn3a-CreERT2. Littermate controls were used for experiments involving transgenic mice. Injured Slc17a6-Cre;Atf3f/f cKO DRG neurons express Atf3 mRNA as measured by FISH (data not shown) and snRNA-seq, but do not express nuclear ATF3 protein in sensory neurons (Figure 6F). Mrgprd-CreERT2;Gcamp6f mice were generated by crossing the Mrgprd-CreERT2 transgenic mice (JAX strain #031286; RRID:IMSR_JAX:031286) with Gcamp6f f/f mice (JAX strain #024105; RRID:IMSR_JAX:024105) and bred to homozygosity for both alleles. All animal experiments were conducted according to institutional animal care and safety guidelines at Boston Children’s Hospital and Harvard Medical School.
METHOD DETAILS
Surgical Procedures
Sciatic nerve crush and ScNT were performed as previously described (Ma et al., 2011), and the SpNT protocol was modified from previous reports (Ogawa et al., 2014; Vilceanu et al., 2010). Briefly, mice were anesthetized by administration of 2.5% isoflurane. Sciatic nerve crush and ScNT were performed by exposing the left sciatic nerve at the mid-thigh level and crushing with smooth forceps for 30 s or cutting a 2mm segment with a pair of scissors followed by a tight ligation of the proximal end to prevent regeneration, respectively. SpNT was performed by making a midline incision of mouse back skin, exposing the left L3 and L4 spinal nerves on the visual field and cutting them with a pair of scissors. These two ganglia were selected in order to maximize the number of transected sensory axons in the sciatic nerve. Intraperitoneal injections of 4mg/kg paclitaxel every other day for 6 days (total of 4 injections) were performed as previously described (Toma et al., 2017). A single intraplantar injection of 20μl CFA was performed into the left hindpaw as previously described (Ghasemlou et al., 2015). Naive and treated mice were euthanized by CO2 asphyxiation and decapitation. Ipsilateral lumbar L3-L5 ganglia from naive, crush, ScNT, paclitaxel or CFA-treated mice and ipsilateral L3-L4 ganglia from SpNT mice were collected at various time points after treatment. Ganglia from 3–5 mice per sample were immediately frozen on dry ice, then pooled for subsequent snRNAseq profiling or histology. There were 2–7 biological replicates of each pooled condition, as indicated in Figure S1. Two biological replicates were used in snRNAseq experiments of Atf3 cKO mice. Each replicate of a specific condition (naive or crush) or genotype (Atf3 cKO; Slc17a6-Cre;Atf3f/f or littermate WT controls; Atf3f/f) contained L3-L5 DRGs pooled from 1 male mouse and 1 female mouse.
Tamoxifen injections
For experiments involving CreERT2 mice, tamoxifen (Sigma) was dissolved in corn oil at 20 mg/ml. Mice were injected intraperitoneally with 75 mg/kg tamoxifen for five consecutive days. All injected mice were monitored daily for any abnormalities.
Behavioral Experiments
Mouse behavior experiments were performed as previously described (Ghasemlou et al., 2015; Latremoliere et al., 2018; Sakuma et al., 2016). Briefly, von Frey filaments were used to measure the mechanical sensitivity of ipsilateral mouse hindpaws by blinded experimenters. 50% von Frey thresholds were calculated using the Up-Down Reader (Gonzalez-Cano et al., 2018). Treatments were not randomized. Responses to pinprick stimulation of different parts of the ipsilateral hindpaw were recorded in the same animals by blinded experimenters at different time points following sciatic nerve crush as previously described (Sakuma et al., 2016).
Single-nuclei isolation from mouse DRG
Single-nuclei suspensions of lumbar DRGs from naive or injured/treated mice were collected using a modified protocol from one described previously (Renthal et al., 2018). This method increases the isolation of neuronal nuclei compared to non-gradient methods (Mo et al., 2015; Renthal et al., 2018). Briefly, DRGs were removed from dry ice and placed into homogenization buffer (0.25 M sucrose, 25 mM KCl, 5 mM MgCl2, 20 mM tricine-KOH, pH 7.8, 1 mM DTT, 5 μg/mL actinomycin, and 0.04% BSA). After a brief incubation on ice, the samples were briefly homogenized using a Tissue-Tearor and transferred to a Dounce homogenizer for an additional ten strokes with a tight pestle in a total volume of 5mL homogenization buffer. After ten strokes with a tight pestle, a 5% IGEPAL (Sigma) solution was added to a final concentration of 0.32% and five additional strokes with the tight pestle were formed. The tissue homogenate was then passed through a 40-μm filter, and diluted 1:1 with OptiPrep (Sigma) and layered onto an OptiPrep gradient as described previously (Mo et al., 2015). After ultracentrifugation, nuclei were collected between the 30 and 40% OptiPrep layers. This layer contains DRG nuclei as well as some membrane fragments likely from Schwann cells that have the same density as nuclei. We diluted this layer in 30% OptiPrep to a final concentration of 80–90,000 nuclei+fragments/mL for loading into the inDrops microfluidic device. All buffers and gradient solutions for nuclei extraction contained RNAsin (Promega) and 0.04% BSA.
Single-nucleus RNA sequencing (inDrops)
Single-nuclei suspensions were encapsulated into droplets and the RNA in each droplet was reverse transcribed using a unique oligonucleotide barcode for each nucleus as described previously (Klein et al., 2015). Nuclei encapsulation was performed in a blinded fashion and the order of sample processing was randomized. The total number of droplets collected per sample varied based on available reagents and line integrity. After encapsulation, each sample was divided into pools of approximately 3,000 droplets and library preparation was performed on each pool of droplets as described previously (Hrvatin et al. 2017). Libraries were sequenced on an Illumina Nextseq 500 to a depth of 500 million reads per ~30,000 droplets collected, resulting in at least 5 reads per UMI on average per sample. The final dataset after quality control had an average sequencing depth of 14,569 reads/nucleus. Sequencing data was processed and mapped to the mouse genome GRCm38 (modified by the addition of 3’ regions of Gcamp6f-WPRE and Cre) using the pipeline described in https://github.com/indrops/indrops (Klein et al., 2015). Counts tables from each library were then combined and processed as described below.
Initial quality control, clustering and visualization of snRNAseq
To be included for analysis, nuclei were required to contain counts of greater than 500 unique genes, fewer than 15,000 total UMI, and fewer than 10% of the counts deriving from mitochondrial genes. There were 236,756 nuclei that met these criteria. Because neuronal nuclei have a greater number of unique genes per nucleus (median UMI/nucleus = 1770, genes/nucleus = 1137) than non-neuronal nuclei (median UMI/nucleus = 927, genes/nucleus = 684), these initial criteria enrich for neuronal nuclei in the final dataset. We used the Seurat package (version 2.3.4) in R (R Core Team, 2018) to perform clustering of these nuclei as previously described (Satija et al., 2015). Raw counts were scaled to 10,000 transcripts per nucleus to control the sequencing depth between nuclei. Counts were centered and scaled for each gene. The effects of total UMI and percent of mitochondrial genes in each nucleus were regressed out using a linear model in Scaledata() function. Highly variable genes were identified using the MeanVarPlot() with default settings. The top 20 principal components were retrieved with the RunPCA() function using default parameters. Nuclei clustering was performed using FindClusters() based on the top 20 principal components, with resolution at 1 for the initial clustering of all nuclei and the sub-clustering of non-neuronal nuclei except where otherwise specified. For dimension reduction and visualization, Uniform Manifold Approximation and Projection (UMAP) coordinates were calculated in the PCA space by using the implemented function runUMAP() in Seurat. In the text, expression is defined as the raw counts that were scaled to 10,000 transcripts per nucleus, log2 expression is log2 transformed expression.
Doublet identification and classification of neuronal vs. non-neuronal nuclei
After clustering all DRG nuclei that passed initial quality control metrics as above, we next excluded nuclei from downstream analysis that were likely to be doublets between neuronal and non-neuronal nuclei. Specifically, nuclei that expressed marker genes (> 0.5 standard deviations away from the mean of the nuclei included for clustering) from multiple cell types were classified as doublets and excluded from downstream analysis. The marker genes used to make doublet calls were neurons = Rbfox3, endothelial = Cldn5, macrophages = Mrc1, glia = Mbp, and fibroblasts = Mgp). A nucleus was also classified as a doublet if it expressed multiple neuronal subtype marker genes (peptidergic nociceptors (PEP) = Tac1, non-peptidergic nociceptors (NP) = Cd55, pruriceptors (SST) = Sst, cLTMR = Fam19a4, ALTMR (NF) = Nefh. After doublet removal, 184,806 nuclei were included for downstream analysis (116,708 neuronal nuclei and 68,098 non-neuronal nuclei). Clusters enriched for the expression of the neuronal marker gene Rbfox3 were classified as neuronal clusters, and clusters enriched for the expression of the non-neuronal marker genes Cldn5, Mrc1, Mbp, or Mgp were classified as non-neuronal clusters.
Annotation of non-neuronal DRG cell types
Non-neuronal subtypes (defined by low Rbfox3 expression and expression of any non-neuronal marker) were clustered separately as described above to facilitate classification of non-neuronal subtypes. Doublet removal was performed again with higher stringency to remove nuclei from downstream analysis that expressed marker genes from multiple non-neuronal cell types (marker gene expression > 1 standard deviation away from the mean of non-neuronal nuclei). The same genes were used as above to make doublet calls. Significant enrichment (FDR < 0.01, log2FC > 0.5) of known non-neuronal marker genes within a cluster of nuclei compared to all other nuclei was used to assign the respective non-neuronal cell type to each cluster (Table S2). The final non-neuronal dataset after quality control contains 57,759 nuclei, with 32 clusters corresponding to 11 cell types. It should be noted that not all marker genes identified by single-cell RNA-seq (Sharma et al., 2020; Usoskin et al., 2015; Zeisel et al., 2018) are detected in single-nucleus RNA-seq because different populations of mRNA are sampled.
Annotation of neuronal and non-neuronal DRG subtypes
Neuronal nuclei were clustered separately as described above to facilitate neuronal subtype classification. Doublet removal was performed again with higher stringency to remove nuclei from downstream analysis that expressed marker genes from multiple neuronal subtypes (marker gene expression > 1 standard deviation away from the mean of the neuronal nuclei). The same neuronal subtype marker genes were used as above to make doublet calls. Significant enrichment (FDR< 0.01, log2FC > 0.5) of known neuronal subtype marker genes within a cluster of nuclei compared to all other neuronal nuclei was used to assign the neuronal subtype to each cluster (Table S2). Each of these subtypes was confirmed by FISH (see Figure S1). We removed 4 neuronal clusters that were significantly enriched for Rgs11 after being unable to confirm this cell population by FISH. The final annotated clusters contained cells from each biological sample, suggesting that there were minimal batch effects observed (see Figure S1D). Variation between samples in the ratio of cell types is largely explained by the injury model and timepoint after injury. Cell type distributions between individually prepared libraries of distinct cells from the same biological sample are largely consistent (see Table S1). The final neuronal dataset after quality control and removal of cells that could not be classified after injury (see below) contains 83,334 high-quality nuclei, with 33 clusters corresponding to 9 neuronal subtypes and injured state neurons.
Classification of naive and injured transcriptional states
To classify neurons as transcriptionally naive state or injured state, we calculated the percent of nuclei that were derived from naive mice or SpNT mice within each neuronal cluster. Percentages were calculated with all 11,191 naive neuronal nuclei and 6,532 SpNT neuronal nuclei > 1 day after injury. Clusters of neuronal nuclei were classified as in the injured state if >95% of the nuclei in that cluster were derived from SpNT mice and median log2 expression of injury induced genes Atf3 greater than 2. All other clusters were classified as naive state. On average, approximately 5.9% of nuclei from SpNT mice were classified as naive state (roughly the percent of un-axotomized neurons after SpNT) and these nuclei had a median Atf3 expression of 0.
Classification of injured neuronal subtypes
The injured state neurons lose most of the distinguishing gene expression features used for classifying neuronal subtypes (e.g. Tac1 expression in PEP1). Thus, to classify injured state neuronal subtypes, we aimed to identify more subtle gene expression signatures that could be used to distinguish between neuronal subtypes after injury. To do this, we co-clustered nuclei from two consecutive time points after SpNT, reasoning that if we had sufficient temporal resolution of the transition states between naive state and injured state neurons, we could project remaining neuronal subtype-specific transcriptional signatures from one time point to the next even after the primary marker genes are downregulated. Each pairwise co-clustering was as follows: naive and 6h after SpNT, 6h and 12h after SpNT, 12h and 1d after SpNT, 1d and 1.5d after SpNT, 1.5d and 2d after SpNT, 2d and 3d after SpNT, and 3d and 7d after SpNT. For example, the neuronal subtype classifications of naive neuronal clusters were then projected onto injured neuronal nuclei of unknown subtype 6h after SpNT if they were present in the same cluster. We then used these neuronal subtype classifications of 6h SpNT nuclei to guide the classification of injured neuronal nuclei of unknown subtype 12h after SpNT. We continued in this fashion until nuclei from all SpNT time points were classified.
For each pairwise clustering and projection step, if > 50% of the total nuclei (classified + unknown) in a cluster were already assigned to a specific neuronal subtype, either from the initial clustering above using marker gene expression or projection from an earlier pairwise clustering step, this subtype classification was projected to all nuclei in the same cluster. If ≤ 50% of the total nuclei in a cluster had a known subtype classification, we determined whether the classified nuclei in these clusters were from the same subtype or multiple subtypes. To do this, we used the FindMarkers() function in Seurat to identify cluster-specific gene expression patterns as described previously. If known subtype-specific marker genes for a specific subtype were significantly enriched in a specific cluster (FDR<0.01, log2FC > 0.5), we assigned this cluster the corresponding subtype as described above (e.g. Tac1+ clusters are peptidergic nociceptors). If multiple previously-classified neuronal subtypes were present in a cluster, we re-clustered these nuclei separately to maximize the potential to separate neuronal subtypes into biologically meaningful clusters. After re-clustering, the FindMarkers() function in Seurat was again performed on each cluster to identify cluster-specific gene expression patterns. If known subtype-specific marker genes for a specific subtype were significantly enriched in a specific cluster (FDR<0.01, log2FC > 0.5), we assigned this cluster the corresponding subtype as described above. If known marker genes were not enriched or marker genes for multiple subtypes were enriched in a cluster even after re-clustering, we classified these clusters as unknown and they were omitted from downstream analysis.
To assign the neuronal subtypes of injured state nuclei from crush, ScNT, paclitaxel, CFA, and naive, we clustered all injured state neuronal nuclei in the study together. Having classified SpNT nuclei previously, we were able to project those neuronal subtypes onto the injured state nuclei from other models. The injured SpNT neuronal subtype classification was projected onto a cluster if the most abundant previously-classified injured SpNT neuronal subtype was more than > 3X more abundant than the next most abundant previously-classified SpNT neuronal subtype (83.5% of nuclei classified this way). Nuclei from the remaining unclassified injured clusters were separately re-clustered and the FindMarkers() function in Seurat was run to identify cluster-specific gene expression patterns as described previously. A neuronal subtype was assigned to an unclassified cluster if known subtype-specific marker genes were significantly enriched compared to the other clusters (FDR<0.01, log2FC>0.5, 8.5% of nuclei classified this way). If known marker genes were not enriched or known marker genes for multiple subtypes were enriched in a cluster, we assigned ‘unknown’ to the cluster (8% of nuclei classified this way). In total, the cell types of 22.5% of injured nuclei across all injury models were classified as unknown and removed from downstream analyses.
We also used an independent bioinformatic approach in which injury-induced gene expression within each cell is regressed out prior to subtype assignment. To do this, we used the FindMarkers() function in Seurat to identify differential gene expression (FDR<0.01 and log2FC>1) between injured state clusters and naive state clusters across all injury models. Sixty-one genes were identified, and a score was generated with these genes using the AddModuleScore() function in Seurat. This function calculates the mean expression of the specified gene set, subtracted by the mean expression of a random gene set for each single nucleus. We then scaled the counts matrix using the Scaledata() function in Seurat, including the injury score along with UMI, % mitochondrial genes for linear regression. The regressed counts matrix was then clustered with default settings described above. Regressing out the injury score resulted in injured state nuclei clustering with their naive state counterparts, which enabled cell types to be assigned to each cluster based on their marker gene expression as described above. Neuronal subtypes assigned by the regression method were compared to the neuronal subtypes assigned by pairwise clustering and projection, and the concordance rate was 98% for naive nuclei and 92% for injured nuclei.
Classification of Atf3 cKO/WT subtypes
Initial clustering, doublet removal, annotation of neuron subtypes for nuclei collected from Slc17a6-Cre;Atf3f/f (cKO) mice and Atf3f/f (WT) mice followed the steps described above. To classify neurons as being in either the transcriptionally naive state or injured state, we calculated the percent of nuclei that were derived from naive mice or sciatic crush mice within each neuronal cluster. Clusters are classified as injured state if they are comprised of > 90% nuclei from sciatic crush mice. All other clusters were classified as naive.
To assign neuronal subtypes to injured state nuclei from WT mice, injured state WT nuclei were co-clustered with C57BL/6J neuronal nuclei and assigned to the neuronal subtype with which they cluster. This approach did not work for injured state Atf3 cKO neurons because they did not co-cluster with any injured state C67/Bl6 neuronal subtype. To assign neuronal subtypes to injured state Atf3 cKO nuclei, we first regressed out injury-induced gene expression (Atf3 cKO injured state nuclei vs. all naive state nuclei, FDR<0.01 and log2FC>1) from these nuclei prior to clustering as described in the previous section. Regressed expression counts from Atf3 cKO nuclei were then clustered together. Differential gene expression between these clusters was performed using the FindMarkers function in Seurat and neuronal subtypes were assigned based on the marker genes described in Table S2 as described above. In Atf3 cKO mice, we were not able to confidently identify p_cLTMR2, PEP, NF1, and SST subtypes after injury.
Cell type tracing of non-peptidergic neurons
Neuronal DRG nuclei from tamoxifen-treated Mrgprd-CreERT2 mice (naive, 7d, or 2m after crush) were co-clustered with neuronal nuclei from our injury time course with default clustering settings in Seurat. Neuronal subtypes were identified by pairwise clustering and projection described above. We then calculated the fraction of neuronal nuclei in each sample that express the Gcamp6f reporter greater than the threshold. The threshold was set at the peak of the distribution of normalized Gcamp6f counts in all Mrgprd-CreERT2 NP nuclei. The fraction of non-NP neuronal nuclei expressing Gcamp6f greater than the threshold was 10.8%.
Differential expression analysis
Differential expression analysis was done with edgeR (version 3.24.3) (Robinson et al., 2009) similar to that described for single-cell analysis in (Soneson and Robinson, 2018). Briefly, edgeR uses the raw counts as input, and genes detected in fewer than 5% of nuclei selected for each comparison were excluded from analysis. Counts within each nucleus were normalized by the trimmed mean of M-values (TMM) method to adjust for total RNA differences between nuclei. Dispersion was estimated by fitting a quasi-likelihood negative binomial generalized log-linear model (glmQLFit) with the conditions being analyzed. The QL F-test was used to determine statistical significance between differentially expressed genes in the experimental and control groups. For each experimental condition (e.g. NP neurons 6h after SpNT), the control group used for each comparison was the corresponding cell type from naive animals, unless otherwise specified. Corresponding cell types across each biological replicate and condition co-clustered and did not display notable batch effects (see Figure S1D). Differentially regulated genes are defined as genes with FDR<0.01 and log2FC > |1|. The number of nuclei used for each differential expression analysis is listed in Table S3. Because cLTMR2, NF3, and SST cell types are relatively rare, we opted to combine nuclei from 3 and 7 day timepoints after SpNT to ensure we had at minimum ~30 nuclei for differential expression analysis. While previous studies indicate that >25 cells yields accurate differential expression analysis results (Wang et al., 2019), we also confirmed this finding in our data by determining the overlap between 10 test analyses. Each test analysis was performed by comparing 30 randomly sampled NP cells 3 days after SpNT and 30 randomly sampled naive cells. The average hypergeometric P-value was 10−8 from all pair-wise comparisons of the 10 test analyses.
Cell-type-specificity score
“Cell-type-specific” genes in naive animals were identified using the FindMarkers() function in Seurat to compare gene expression in nuclei of each cell type to all other nuclei (FDR<0.01 and log2FC>1). These cell-type-specific genes for each cell type were used to generate cell-type-specificity scores using the AddModuleScore() function in Seurat, which resulted in a distinct cell-type-specificity score for each cell type. Each nucleus was assigned to the cell-type-specificity score of its respective cell type.
Injury score
The 524 injury-induced genes that are present in ≥ 5 neuronal subtypes (see common genes in Figure 4D, Table S4) are used to generate the injury score. The injury score was calculated for each nucleus by using the AddModuleScore() function in Seurat as described above.
Random gene selection
To generate expression-matched control gene lists, genes in each cell type were first ranked by their level of expression, and then for each cell-type-specific gene, the gene either above or below it was selected randomly. Random gene lists for motif enrichment analysis were generated as described in that section.
Gene ontology (GO) analysis
GO analysis was performed using topGO (version 2.34.0) (Alexa and Rahnenfuhrer, 2018) in R. Expressed genes (≥ 5% of SpNT+naive nuclei with the mean log2 expression > 0.1 from edgeR analysis in any neuronal subtype) were used as the background list. The common injury-induced genes described above were used as the input gene list. R package org.Mm.eg.db (version 3.7.0) was used as the genome wide annotation database for Mus musculus. Genes were annotated for their biological process and associated gene ontology terms with > 10 annotated genes and enrichment P-value < 0.05 were returned. Enrichment is defined as the number of annotated genes observed in the input list divided by the number of annotated genes expected from the background list.
PANTHER was used to categorize the molecular function of cell-type-specific genes (Figure S2A) using default settings for Mus musculus. Genes containing the molecular function of transcription factors, ion channels, and GPCRs were selected and used for plotting. Neuropeptide gene lists were obtained from http://www.neuropeptides.nl/tabel%20neuropeptides%20linked.htm.
Transcription factor analysis
We used SCENIC package (version 1.1.1–9) (Aibar et al., 2017) to conduct gene regulatory network analysis and transcription factor assessment. For inclusion in this analysis, genes needed to be detected in at least 5% of nuclei and have a mean log2 expression > 0.1. To identify potential transcription factor targets, SCENIC first performs a co-expression network analysis to identify the genes whose expression is positively correlated (Pearson’s r > 0.01) with each transcription factor expressed in the dataset. For each transcription factor and its corresponding module of genes that are positively correlated with it, SCENIC uses RcisTarget to perform motif enrichment analysis to identify the putative regulon for each transcription factor. RcisTarget was run with default settings and motif enrichment was calculated based on regions 500 bp upstream and 20 kb centered (10 kb upstream + 10kb downstream) around the transcription start site of each gene. Once a regulon is assigned for each transcription factor, SCENIC then calculates a score (AUCell) that represents the “activity” of each transcription factor within each cell based on the expression of the transcription factor and its target genes. Only transcription factors that were identified by SCENIC and also present in the list of annotated mouse transcription factors from AnimalTFDB database (http://bioinfo.life.hust.edu.cn/AnimalTFDB/) were included in the study.
Gene set motif enrichment analysis
To identify motifs that are significantly enriched in a gene set, motif enrichment analysis was run with RcisTarget (version 1.3.5). Motif analysis was performed for 20 kb regions centered (10 kb upstream + 10kb downstream) around the transcription start site of each gene. RcisTarget assigns an enrichment score for each motif based on its frequency near the transcription start site of our input gene list compared to its average frequency in the genome. Enrichment scores for each motif were then normalized and motifs with normalized enrichment scores > 3SD are considered enriched. The relative activity of the injury-induced transcription factors (see Figure 6B) was predicted by counting the motifs they are known to bind within the set of enriched motifs within a given input gene list (e.g. 438 common injury-induced genes). Notably, transcription factors that are not detected in DRG neurons after injury (e.g. c-Fos (Gao and Ji, 2009)) will not be listed in this analysis even if their motifs are enriched (e.g. AP-1) due to the induction of related family members (e.g. JUN, ATF3). Motif enrichment was performed on the set of common injury-induced genes (see Table S4) and cell-type-specific genes (see Table S2) as well as random gene sets. To calculate motif enrichment for random gene sets, motif analysis was averaged across 1000 sets of either 524 randomly selected expressed genes (to compare with common injury-induced genes) or 1,030 randomly selected expressed genes (to compare with cell-type-specific genes).
RNAScope in situ histochemistry
RNAscope fluorescence in situ hybridization (FISH) experiments were performed according to the manufacturer’s instructions, using the RNAscope Fluorescent Multiplex kit (Advanced Cell Diagnostics (ACD)) for fresh frozen tissue, as previously described (Zeisel et al., 2018). Briefly, fresh frozen ipsilateral naive or injured L4 lumbar DRGs were dissected at various points after injury and sectioned into 12 μm sections using a cryostat. In situ probes against the following mouse genes were ordered from ACD and multiplexed in the same permutations across quantified sections: Atf3 (Cat#426891 or Cat#426891-C2), Tubb3 (Cat#423391-C3), Gcamp6s (Cat#557091), Th (Cat#317621-C2), Mrgprd (Cat#417921), Hapln4 (Cat#495111), Sst (Cat#404631-C2), Tac1 (Cat#410351-C2), Mpz (Cat#573461), Lyz2 (Cat#491621), Shh (Cat#314361-C2), Nefh (Cat#443671-C3), Fam19a4 (Cat#495021-C2), Apoe (Cat#313271-C3), Rgs11 (Cat#539191), Scn7a (Cat#548561). Following FISH, some sections were imaged using a 20x widefield objective on an Olympus Slide Scanner microscope. In order to quantify marker gene expression, high resolution images of a single z-plane were obtained using a 60x oil immersion objective on a Perkin Elmer UltraView Spinning Disk confocal microscope.
FISH quantification
L4 DRG section images from 3–6 mice per probe were used for quantification. All in-focus neurons were manually segmented by blinded scorers using Tubb3 fluorescence. Images were then thresholded, puncta were automatically quantified using ImageJ and puncta counts per μm2 per neuron compared across conditions. For sciatic crush sections (Fig S5N), cutoffs were set to the mean of Atf3 puncta density in naive neurons plus 2 standard deviations, and neurons after crush are divided into Atf3 high (injured, Atf3 puncta density > cutoff) and Atf3 low (uninjured, Atf3 puncta density ≤ cutoff) populations; for SpNT slides (Fig 2H), neurons were analyzed as one population. Then neurons with the most marker puncta density in each condition were selected for visualization and statistical tests in accordance with the relative abundance of naive neuronal cell types in the snRNAseq data (top 9.28% of neurons were selected for marker Th (cLTMR1), top 18.33% for Tac1 (PEP1 and PEP2), top 22.43% for Mrgprd (NP), top 21.51% for Hapln4 (NF1–2), and top 4.25% for Sst (SST). One-way analysis of variance (ANOVA) was carried out by calling anova() function in R to compare means in different conditions. As the ANOVA test is significant, Tukey Multiple Comparisons are conducted to compare between conditions by calling TukeyHSD() function in R. ANOVA parameters for Figure 2H: Th (n = 36 [naive], 36 [6h] , 33 [7d]), F(2, 102) = 74.70, Atf3 (on Th slides), F(2, 102) = 52.87; Tac1 (n = 68 [naive], 93 [6h], 78 [7d]), F(2, 236) = 332.33, Atf3 (on Tac1 slides), F(2, 236) = 112.56; Mrgprd (n = 100 [naive], 102 [6h], 308 [7d]), F(2, 507) = 1210.87, Atf3 (on Mrgprd slides), F(2, 507) = 315.33; Hapln4 (n = 80 [naive], 114 [6h], 64 [7d]), F(2, 255) = 85.52, Atf3(on Hapln4 slides), F(2, 255) = 192.61; Sst (n = 26 [naive], 31 [6h], 37 [7d]), F(2, 91) = 82.98, Atf3 (on Sst slides), F(2, 91) = 110.91.
Western Blot
Brn3a-CreERT2;Atf3f/f mice were injected intraperitoneally with tamoxifen or vehicle. Two weeks after induction, the mice underwent sciatic nerve crush. Ipsilateral L3–5 DRGs were harvested from 4 mice (12 DRGs/mouse) 1 week after crush and pooled for protein extraction. The protein lysates were extracted in presence of a protease cocktail tablet (Roche Diagnostics) using Cell Lysis buffer (ThermoFisher). Cell debris was removed by centrifugation (4°C, 10 min) after homogenization. Protein concentrations were determined using the BCA protein assay kit (ThermoFisher). Equivalent amounts of protein were loaded and separated by 4–12% gradient SDS-PAGE and subsequently transferred to an Immobilon-P PVDF transfer membrane (EMD Millipore). Blots were blocked in 5% blotting-grade blocker (Bio-rad) in PBS for 20 min at room temperature (RT) and incubated with rabbit polyclonal antibodies against ATF3 ([1:500]; Santa Cruz; Cat#sc-188; RRID:AB_2258513), and Horseradish peroxidase (HRP)-conjugated mouse monoclonal antibody against GAPDH ([1:5000]; Cell Signaling; Cat#51332S; RRID:AB_2799390) overnight. After washing 3 times with TBST (1% Tween-20), HRP-conjugated secondary antibody ([1:20000], anti-rabbit, ThermoFisher), a SuperSignal West Femto Maximum Sensitivity chemiluminescence ECL kit (ThermoFisher), and Amersham Hyperfilm ECL (GE Healthcare Life Sciences) were used for signal detection. Image signals were analyzed and quantified using Fiji.
Immunohistochemistry
Slc17a6-Cre;Atf3f/f and Atf3f/f mice underwent SpNT. Ipsilateral L4 DRGs were harvested 1 week after SpNT from injured mice, immediately fixed with 4% PFA for 1hr at 25°C and cryoprotected with 30% sucrose in PBS overnight. DRGs were sectioned into 12μm sections, which were blocked and permeabilized with 5% normal goat serum in 0.25% Triton X-100 in PBS (Roche Diagnostics) for 30min at 25°C. Sections were incubated with rabbit polyclonal antibody against ATF3 ([1:500]; Sigma Aldrich; Cat#HPA001562; RRID:AB_1078233) at 4°C overnight and then incubated with Alexa Fluor 488 goat antibody against rabbit IgG for 40min at 25°C. Sections were then stained with 1:200 NeuroTrace 640/660 Deep-Red Fluorescent Nissl Stain (Thermo Fisher; Cat#N21483; RRID: AB_2572212) for 10min and mounted with ProLong Gold Antifade Mountant with DAPI (Thermo Fisher; Cat#P36931). Slides were imaged using a 20x widefield objective on an Olympus Slide Scanner microscope. Images were thresholded and ATF3+ neurons quantified in Fiji. Nissl+ DRG neurons were manually counted by blinded scorers. To quantify Nissl+ DRG neuron density, representative 360000μm2 sections of each Slc17a6-Cre;Atf3f/f and Atf3f/f DRG image were selected for quantification.
Two weeks after tamoxifen or vehicle injection, Brn3a-CreERT2;Atf3f/f mice underwent sciatic nerve crush and their L4 DRGs were harvested from injured mice perfused with cold PBS followed by cold 4% PFA. The perfused tissues were fixed in 4% PFA for 1hr at 4°C and cryoprotected with 30% sucrose in PBS overnight. DRGs were sectioned into 12μm sections, which were blocked and permeabilized with 1% Triton X-100 in blocking buffer (Roche Diagnostics) for 1hr at 25°C. Sections were incubated with rabbit polyclonal antibody against ATF3 ([1:1000]; Santa Cruz Biotech; Cat#sc-188; RRID:AB_2258513) and chicken polyclonal antibody against NF200 ([1:2000]; Millipore; AB5539; RRID:AB_11212161) at 4°C overnight and then incubated with Alexa Fluor 568 goat antibody against rabbit IgG and Alexa Fluor 488 goat antibody against chicken IgG for 1hr at 25°C. Images were acquired using a Nikon Eclipse 80I Microscope.
Data obtained from other sources
Embryonic DRG development data were obtained from GEO Accessions GSE98592, GSE77892, GSE77891 in February 2019, which was deposited by GUDMAP (Jain lab), http://www.gudmap.org. We performed differential expression analysis similar to that described above in edgeR to compare the expression profiles of RET+ E12.5, E14.5, E18.5 DRG neurons to adult RET+ DRGs. Briefly, genes with counts <10 were removed from differential expression. Differential expression was otherwise performed using the default settings (calcNormFactors, estimateCommonDisp(y), and estimateTagwiseDisp(y), and exacTest(“adult DRG”, “each embryonic time point”). Regeneration associated gene modules were obtained from (Chandran et al., 2016). Gene names were cleaned up by removing suffix, and genes not detected in our snRNAseq data were excluded. Hypergeometric tests (see Statistics) were performed to assess overlap between the modules and differentially expressed genes (Log2FC > |1|, FDR < 0.01) in our dataset.
Data Visualization
Plots were generated using R version 3.5.0 with ggplot2 package (version 3.2.0) (Wickham, 2016). Heatmaps were generated using gplots package (version 3.0.1.1) (Warnes et al., 2009). Figures were made using Adobe Illustrator (Adobe Systems; RRID: SCR_010279).
Quantification and Statistical Analysis
Statistical analysis
Statistical analyses including the number of animals or cells (n) and P values for each experiment are noted in the figure legends. Statistics were performed using R version 3.5.0. Hypergeometric tests were used to test the significance of overlap between two gene sets. It was conducted by calling phyper() function in R version 3.5.0. Permutation tests were used to estimate a P value for transcription factor motif enrichment by calculating the number of times out of 1000 the ATF3 motif enrichment was greater in a random set of genes than the experimental set of genes divided by 1000.
Supplementary Material
Table S1, related to Figure 1: Sample metadata for the study
Table S2, related to Figures 2 and 4: Genes that are enriched in specific DRG neuronal subtypes in naive mice. These genes are used to generate cell-type-specificity scores
Table S3, related to Figure 4: Differential gene expression analysis between mice subjected to each injury model and naive mice at multiple time point after injury
Table S4, related to Figure 4: Comparative analysis between cell types of the genes upregulated in mice subjected to spinal nerve transection (SpNT) compared to naive mice. Table includes the common injury genes induced by SpNT in ?5 neuronal subtypes, 2–4 neuronal subtypes, and those which are upregulated in 1 neuronal subtype compared to their respective naive cell types
Table S5, related to Figure 5: Differential gene expression analysis between male and female DRGs from naive mice or those subjected to sciatic nerve crush
Table S6, related to Figure 7: Atf3-dependent gene expression after sciatic nerve crush
Table S7, related to Figures 4 and 5: Differential gene expression between embryonic (E12.5, E14.5, E18.5) and adult DRG neurons
KEY RESOURCES TABLE
| REAGENT or RESOURCE | SOURCE | IDENTIFIER |
|---|---|---|
| Antibodies | ||
| Rabbit anti-ATF3 | Sigma-Aldrich | Cat#HPA001562; RRID:AB_1078233 |
| Chicken anti-Neurofilament, H | Millipore | Cat#AB5539; RRID:AB_11212161 |
| Rabbit anti-ATF3 | Santa Cruz Biotechnology (discontinued) | Cat#sc-188; RRID:AB_2258513 |
| Mouse anti-GAPDH, HRP conjugate | Cell Signaling Technology | Cat# 51332S, RRID:AB_2799390 |
| Bacterial and Virus Strains | ||
| Biological Samples | ||
| Chemicals, Peptides, and Recombinant Proteins | ||
| NeuroTrace 640/660 Deep-Red Fluorescent Nissl Stain | Thermo Fisher | Cat#N21483; RRID: AB_2572212 |
| ProLong Gold Antifade Mountant with DAPI | Thermo Fisher | Cat#P36931 |
| Tamoxifen | Sigma-Aldrich | Cat#T5648–1G |
| Freund’s Adjuvant, Complete | Sigma-Aldrich | Cat#F5881–10ML |
| RNAscope® Probe- Mm-Atf3 | ACD Bio | Cat#426891 |
| RNAscope® Probe- Mm-Atf3-C2 | ACD Bio | Cat#426891-C2 |
| RNAscope® Probe- Mm-Tubb3-C3 | ACD Bio | Cat#423391-C3 |
| RNAscope® Probe- Mm-GCaMP6s-O1 | ACD Bio | Cat#557091 |
| RNAscope® Probe- Mm-Th-C2 | ACD Bio | Cat#317621-C2 |
| RNAscope® Probe- Mm-Mrgprd | ACD Bio | Cat#417921 |
| RNAscope® Probe- Mm-Hapln4 | ACD Bio | Cat#495111 |
| RNAscope® Probe- Mm-Sst-C2 | ACD Bio | Cat#404631-C2 |
| RNAscope® Probe- Mm-Tac1-C2 | ACD Bio | Cat#410351-C2 |
| RNAscope® Probe- Mm-Mpz | ACD Bio | Cat#573461 |
| RNAscope® Probe- Mm-Lyz2 | ACD Bio | Cat#491621 |
| RNAscope® Probe- Mm-Shh-C2 | ACD Bio | Cat#314361-C2 |
| RNAscope® Probe- Mm-Nefh-C3 | ACD Bio | Cat#443671-C3 |
| RNAscope® Probe- Mm-Fam19a4-C2 | ACD Bio | Cat#495021-C2 |
| RNAscope® Probe- Mm-Apoe-C3 | ACD Bio | Cat#313271-C3 |
| RNAscope® Probe- Mm-Rgs11 | ACD Bio | Cat#539191 |
| RNAscope® Probe- Mm-Scn7a | ACD Bio | Cat#548561 |
| Critical Commercial Assays | ||
| SuperSignal™ West Femto Maximum Sensitivity Substrate | Thermo Fisher | Cat#34095
|
| Amersham™ Hyperfilm™ ECL | Thermo Fisher | Cat#45-001-504 |
| RNAscope Fluorescent Multiplex Assay | ACD Bio | Cat#320850 |
| Deposited Data | ||
| Raw and analyzed data | This paper | GEO: GSE154659 |
| Embryonic DRG RNA-seq data | GUDMAP Database | GEO: GSE98592, GSE77892, GSE77891 |
| Experimental Models: Cell Lines | ||
| Experimental Models: Organisms/Strains | ||
| Mouse: C57BL/6 | The Jackson Laboratory | Cat# JAX:000664, RRID:IMSR_JAX:000664 |
| Mouse: Atf3-CreERT2 | This paper | N/A |
| Mouse: Atf3f/f | This paper | N/A |
| Mouse: B6;129S-Gt(ROSA)26Sortm95.1(CAG-GCaMP6f)Hze/J | The Jackson Laboratory | Cat# JAX:024105, RRID:IMSR_JAX:024105 |
| Mouse: Slc17a6tm2(cre)Lowl/J | The Jackson Laboratory | Cat# JAX:016963, RRID:IMSR_JAX:016963 |
| Mouse: Mrgprdtm1.1(cre/ERT2)Wql/J | The Jackson Laboratory | Cat# JAX:031286, RRID:IMSR_JAX:031286 |
| Mouse: Tg(Pou4f1-cre/ERT2)2Jiz/J | The Jackson Laboratory | Cat# JAX:032594, RRID:IMSR_JAX:032594 |
| Oligonucleotides | ||
| Recombinant DNA | ||
| Software and Algorithms | ||
| Fiji | ImageJ | RRID:SCR_002285 |
| Adobe Illustrator CC | Adobe Systems | RRID: SCR_010279 |
| Indrops mapping | Klein et al., 2015 | https://github.com/indrops/indrops |
| R for statistical computing- 3.5.0 | R Core Team, 2018 | https://www.r-project.org/ |
| Seurat – 2.3.4 | Satija et al., 2015 | https://satijalab.org/seurat/ |
| SCENIC – 1.1.1–9 | Aibar et al., 2017 | https://aertslab.org/#scenic |
| edgeR – 3.24.3 | Robinson et al., 2009 | http://bioinf.wehi.edu.au/edgeR/ |
| ggplot2 – 3.2.0 | Wickham, 2016 | https://ggplot2.tidyverse.org/ |
| gplots – 3.0.1.1 | Warnes et al., 2009 | https://github.com/talgalili/gplots |
| topGO | Alexa, 2018 | https://bioconductor.org/packages/release/bioc/html/topGO.html |
| Other | ||
| Resource website for this
publication |
This paper | http://www.painseq.com |
Highlights.
Nerve injury induces a common transcriptional program across DRG neuronal subtypes
Injured DRG neurons transiently lose their transcriptional identity while regenerating
Atf3 drives transcriptional reprogramming and regeneration of DRG neurons after injury
Nerve injury induces distinct transcriptional responses in non-neuronal DRG cell types
Acknowledgements
We would like to thank Michael Tetreault, Daniel Taub, Nick Andrews, Harvard Single Cell Core and Neurobiology Imaging Facility for technical assistance; Sinisa Hrvatin, Aurel Nagy, Rory Kirshner and Michael Greenberg for analytic guidance and helpful discussions. W.R. is supported by NINDS K08NS101064 and the Migraine Research Foundation. C.J.W. is supported by NINDS R35NS105076, the Bertarelli Foundation, and the DARPA Panacea program (HR0011-19-2-0022). C.J.W., R.K., and D.H.G. are supported by the Dr. Miriam and Sheldon G. Adelson Medical Research Foundation.
Footnotes
Publisher's Disclaimer: This is a PDF file of an unedited manuscript that has been accepted for publication. As a service to our customers we are providing this early version of the manuscript. The manuscript will undergo copyediting, typesetting, and review of the resulting proof before it is published in its final form. Please note that during the production process errors may be discovered which could affect the content, and all legal disclaimers that apply to the journal pertain.
Declaration of Interests
W.R. is a consultant for Kallyope. C.J.W. is a founder of Nocion Therapeutics and QurAlis.
ADDITIONAL RESOURCES
References
- Abe N, and Cavalli V (2008). Nerve injury signaling. Current opinion in neurobiology 18, 276–283. [DOI] [PMC free article] [PubMed] [Google Scholar]
- Aibar S, Gonzalez-Blas CB, Moerman T, Huynh-Thu VA, Imrichova H, Hulselmans G, Rambow F, Marine JC, Geurts P, Aerts J, et al. (2017). SCENIC: single-cell regulatory network inference and clustering. Nature methods 14, 1083–1086. [DOI] [PMC free article] [PubMed] [Google Scholar]
- Alexa A, and Rahnenfuhrer J (2018). topGO: Enrichment Analysis for Gene Ontology. R package version 2.34.0 [Google Scholar]
- Avraham O, Deng P-Y, Jones S, Kuruvilla R, Semenkovich CF, Klyachko VA, and Cavalli V (2020). Satellite glial cells promote regenerative growth in sensory neurons. bioRxiv, 2019.2012.2013.874669 [DOI] [PMC free article] [PubMed] [Google Scholar]
- Bangash MA, Alles SRA, Santana-Varela S, Millet Q, Sikandar S, de Clauser L, Ter Heegde F, Habib AM, Pereira V, Sexton JE, et al. (2018). Distinct transcriptional responses of mouse sensory neurons in models of human chronic pain conditions. Wellcome open research 3, 78. [DOI] [PMC free article] [PubMed] [Google Scholar]
- Berta T, Perrin FE, Pertin M, Tonello R, Liu Y-C, Chamessian A, Kato AC, Ji R-R, and Decosterd I (2017). Gene Expression Profiling of Cutaneous Injured and Non-Injured Nociceptors in SNI Animal Model of Neuropathic Pain. Scientific Reports 7, 9367. [DOI] [PMC free article] [PubMed] [Google Scholar]
- Bonilla IE, Tanabe K, and Strittmatter SM (2002). Small proline-rich repeat protein 1A is expressed by axotomized neurons and promotes axonal outgrowth. The Journal of neuroscience : the official journal of the Society for Neuroscience 22, 1303–1315. [DOI] [PMC free article] [PubMed] [Google Scholar]
- Brouwer M, Zhou H, and Nadif Kasri N (2016). Choices for Induction of Pluripotency: Recent Developments in Human Induced Pluripotent Stem Cell Reprogramming Strategies. Stem Cell Reviews and Reports 12, 54–72. [DOI] [PMC free article] [PubMed] [Google Scholar]
- Carr MJ, Toma JS, Johnston APW, Steadman PE, Yuzwa SA, Mahmud N, Frankland PW, Kaplan DR, and Miller FD (2019). Mesenchymal Precursor Cells in Adult Nerves Contribute to Mammalian Tissue Repair and Regeneration. Cell Stem Cell 24, 240–256.e249. [DOI] [PubMed] [Google Scholar]
- Cattin AL, and Lloyd AC (2016). The multicellular complexity of peripheral nerve regeneration. Current opinion in neurobiology 39, 38–46. [DOI] [PubMed] [Google Scholar]
- Chandran V, Coppola G, Nawabi H, Omura T, Versano R, Huebner EA, Zhang A, Costigan M, Yekkirala A, Barrett L, et al. (2016). A Systems-Level Analysis of the Peripheral Nerve Intrinsic Axonal Growth Program. Neuron 89, 956–970. [DOI] [PMC free article] [PubMed] [Google Scholar]
- Chapman CR, and Vierck CJ (2017). The Transition of Acute Postoperative Pain to Chronic Pain: An Integrative Overview of Research on Mechanisms. The journal of pain : official journal of the American Pain Society 18, 359.e351–359.e338. [DOI] [PubMed] [Google Scholar]
- Chiu IM, Barrett LB, Williams EK, Strochlic DE, Lee S, Weyer AD, Lou S, Bryman GS, Roberson DP, Ghasemlou N, et al. (2014). Transcriptional profiling at whole population and single cell levels reveals somatosensory neuron molecular diversity. eLife 3. [DOI] [PMC free article] [PubMed] [Google Scholar]
- Collins KL, Russell HG, Schumacher PJ, Robinson-Freeman KE, O’Conor EC, Gibney KD, Yambem O, Dykes RW, Waters RS, and Tsao JW (2018). A review of current theories and treatments for phantom limb pain. The Journal of clinical investigation 128, 2168–2176. [DOI] [PMC free article] [PubMed] [Google Scholar]
- Colloca L, Ludman T, Bouhassira D, Baron R, Dickenson AH, Yarnitsky D, Freeman R, Truini A, Attal N, Finnerup NB, et al. (2017). Neuropathic pain. Nature Reviews Disease Primers 3, 17002. [DOI] [PMC free article] [PubMed] [Google Scholar]
- Costigan M, Befort K, Karchewski L, Griffin RS, D’Urso D, Allchorne A, Sitarski J, Mannion JW, Pratt RE, and Woolf CJ (2002). Replicate high-density rat genome oligonucleotide microarrays reveal hundreds of regulated genes in the dorsal root ganglion after peripheral nerve injury. BMC neuroscience 3, 16. [DOI] [PMC free article] [PubMed] [Google Scholar]
- Duan J, Li B, Bhakta M, Xie S, Zhou P, Munshi NV, and Hon GC (2019). Rational Reprogramming of Cellular States by Combinatorial Perturbation. Cell reports 27, 3486–3499.e3486. [DOI] [PMC free article] [PubMed] [Google Scholar]
- Frey E, Valakh V, Karney-Grobe S, Shi Y, Milbrandt J, and DiAntonio A (2015). An in vitro assay to study induction of the regenerative state in sensory neurons. Exp Neurol 263, 350–363. [DOI] [PMC free article] [PubMed] [Google Scholar]
- Gao YJ, and Ji RR (2009). c-Fos and pERK, which is a better marker for neuronal activation and central sensitization after noxious stimulation and tissue injury? The open pain journal 2, 11–17. [DOI] [PMC free article] [PubMed] [Google Scholar]
- Gatto G, Smith KM, Ross SE, and Goulding M (2019). Neuronal diversity in the somatosensory system: bridging the gap between cell type and function. Current opinion in neurobiology 56, 167–174. [DOI] [PMC free article] [PubMed] [Google Scholar]
- Gey M, Wanner R, Schilling C, Pedro MT, Sinske D, and Knoll B (2016). Atf3 mutant mice show reduced axon regeneration and impaired regeneration-associated gene induction after peripheral nerve injury. Open biology 6. [DOI] [PMC free article] [PubMed] [Google Scholar]
- Ghasemlou N, Chiu IM, Julien J-P, and Woolf CJ (2015). CD11b+Ly6G- myeloid cells mediate mechanical inflammatory pain hypersensitivity. Proc Natl Acad Sci U S A 112, E6808–E6817. [DOI] [PMC free article] [PubMed] [Google Scholar]
- Gonzalez-Cano R, Boivin B, Bullock D, Cornelissen L, Andrews N, and Costigan M (2018). Up–Down Reader: An Open Source Program for Efficiently Processing 50% von Frey Thresholds. Frontiers in Pharmacology 9. [DOI] [PMC free article] [PubMed] [Google Scholar]
- Gosselin R-D, Suter MR, Ji R-R, and Decosterd I (2010). Glial cells and chronic pain. The Neuroscientist 16, 519–531. [DOI] [PMC free article] [PubMed] [Google Scholar]
- Harel NY, and Strittmatter SM (2006). Can regenerating axons recapitulate developmental guidance during recovery from spinal cord injury? Nature Reviews Neuroscience 7, 603–616. [DOI] [PMC free article] [PubMed] [Google Scholar]
- Haroutounian S, Nikolajsen L, Bendtsen TF, Finnerup NB, Kristensen AD, Hasselstrom JB, and Jensen TS (2014). Primary afferent input critical for maintaining spontaneous pain in peripheral neuropathy. Pain 155, 1272–1279. [DOI] [PubMed] [Google Scholar]
- Hart AM, Brannstrom T, Wiberg M, and Terenghi G (2002). Primary sensory neurons and satellite cells after peripheral axotomy in the adult rat. Experimental brain research 142, 308–318. [DOI] [PubMed] [Google Scholar]
- He Z, and Jin Y (2016). Intrinsic Control of Axon Regeneration. Neuron 90, 437–451. [DOI] [PubMed] [Google Scholar]
- Herdegen T, Fiallos-Estrada CE, Schmid W, Bravo R, and Zimmermann M (1992). The transcription factors c-JUN, JUN D and CREB, but not FOS and KROX-24, are differentially regulated in axotomized neurons following transection of rat sciatic nerve. Brain research Molecular brain research 14, 155–165. [DOI] [PubMed] [Google Scholar]
- Hokfelt T, Zhang X, and Wiesenfeld-Hallin Z (1994). Messenger plasticity in primary sensory neurons following axotomy and its functional implications. Trends in neurosciences 17, 22–30. [DOI] [PubMed] [Google Scholar]
- Hrvatin S, Hochbaum DR, Nagy MA, Cicconet M, Robertson K, Cheadle L, Zilionis R, Ratner A, Borges-Monroy R, Klein AM, et al. (2018). Single-cell analysis of experience-dependent transcriptomic states in the mouse visual cortex. Nature neuroscience 21, 120–129. [DOI] [PMC free article] [PubMed] [Google Scholar]
- Hu P, and McLachlan EM (2002). Macrophage and lymphocyte invasion of dorsal root ganglia after peripheral nerve lesions in the rat. Neuroscience 112, 23–38. [DOI] [PubMed] [Google Scholar]
- Hunt D, Raivich G, and Anderson PN (2012). Activating transcription factor 3 and the nervous system. Front Mol Neurosci 5, 7–7. [DOI] [PMC free article] [PubMed] [Google Scholar]
- Jager SE, Pallesen LT, Richner M, Harley P, Hore Z, McMahon S, Denk F, and Vaegter CB (2020). Changes in the transcriptional fingerprint of satellite glial cells following peripheral nerve injury. Glia 68, 1375–1395. [DOI] [PubMed] [Google Scholar]
- Jaggi AS, Jain V, and Singh N (2011). Animal models of neuropathic pain. Fundamental & Clinical Pharmacology 25, 1–28. [DOI] [PubMed] [Google Scholar]
- Jankowski MP, McIlwrath SL, Jing X, Cornuet PK, Salerno KM, Koerber HR, and Albers KM (2009). Sox11 transcription factor modulates peripheral nerve regeneration in adult mice. Brain research 1256, 43–54. [DOI] [PMC free article] [PubMed] [Google Scholar]
- Jessen K, and Mirsky R (2016). The repair Schwann cell and its function in regenerating nerves. The Journal of physiology 594, 3521–3531. [DOI] [PMC free article] [PubMed] [Google Scholar]
- Ji R-R, Chamessian A, and Zhang Y-Q (2016). Pain regulation by non-neuronal cells and inflammation. Science 354, 572. [DOI] [PMC free article] [PubMed] [Google Scholar]
- Jing X, Wang T, Huang S, Glorioso JC, and Albers KM (2012). The transcription factor Sox11 promotes nerve regeneration through activation of the regeneration-associated gene Sprr1a. Exp Neurol 233, 221–232. [DOI] [PMC free article] [PubMed] [Google Scholar]
- Kataoka K, Kanje M, and Dahlin LB (2007). Induction of activating transcription factor 3 after different sciatic nerve injuries in adult rats. Scandinavian Journal of Plastic and Reconstructive Surgery and Hand Surgery 41, 158–166. [DOI] [PubMed] [Google Scholar]
- Klein AM, Mazutis L, Akartuna I, Tallapragada N, Veres A, Li V, Peshkin L, Weitz DA, and Kirschner MW (2015). Droplet barcoding for single-cell transcriptomics applied to embryonic stem cells. Cell 161, 1187–1201. [DOI] [PMC free article] [PubMed] [Google Scholar]
- Kole C, Brommer B, Nakaya N, Sengupta M, Bonet-Ponce L, Zhao T, Wang C, Li W, He Z, and Tomarev S (2020). Activating Transcription Factor 3 (ATF3) Protects Retinal Ganglion Cells and Promotes Functional Preservation After Optic Nerve Crush. Invest Ophthalmol Vis Sci 61, 31–31. [DOI] [PMC free article] [PubMed] [Google Scholar]
- Korpos É, Deák F, and Kiss I (2015). Matrilin-2, an extracellular adaptor protein, is needed for the regeneration of muscle, nerve and other tissues. Neural Regen Res 10, 866–869. [DOI] [PMC free article] [PubMed] [Google Scholar]
- Kupari J, Haring M, Agirre E, Castelo-Branco G, and Ernfors P (2019). An Atlas of Vagal Sensory Neurons and Their Molecular Specialization. Cell reports 27, 2508–2523.e2504. [DOI] [PMC free article] [PubMed] [Google Scholar]
- Kwon MJ, Kim J, Shin H, Jeong SR, Kang YM, Choi JY, Hwang DH, and Kim BG (2013). Contribution of macrophages to enhanced regenerative capacity of dorsal root ganglia sensory neurons by conditioning injury. The Journal of neuroscience : the official journal of the Society for Neuroscience 33, 15095–15108. [DOI] [PMC free article] [PubMed] [Google Scholar]
- Lacar B, Linker SB, Jaeger BN, Krishnaswami SR, Barron JJ, Kelder MJE, Parylak SL, Paquola ACM, Venepally P, Novotny M, et al. (2016). Nuclear RNA-seq of single neurons reveals molecular signatures of activation. Nature Communications 7, 11022. [DOI] [PMC free article] [PubMed] [Google Scholar]
- LaCroix-Fralish ML, Austin JS, Zheng FY, Levitin DJ, and Mogil JS (2011). Patterns of pain: meta-analysis of microarray studies of pain. Pain 152, 1888–1898. [DOI] [PubMed] [Google Scholar]
- Laedermann CJ, Pertin M, Suter MR, and Decosterd I (2014). Voltage-gated sodium channel expression in mouse DRG after SNI leads to re-evaluation of projections of injured fibers. Mol Pain 10, 19. [DOI] [PMC free article] [PubMed] [Google Scholar]
- Latremoliere A, Cheng L, DeLisle M, Wu C, Chew S, Hutchinson EB, Sheridan A, Alexandre C, Latremoliere F, Sheu SH, et al. (2018). Neuronal-Specific TUBB3 Is Not Required for Normal Neuronal Function but Is Essential for Timely Axon Regeneration. Cell reports 24, 1865–1879.e1869. [DOI] [PMC free article] [PubMed] [Google Scholar]
- Le Pichon CE, and Chesler AT (2014). The functional and anatomical dissection of somatosensory subpopulations using mouse genetics. Frontiers in neuroanatomy 8, 21. [DOI] [PMC free article] [PubMed] [Google Scholar]
- Liang Z, Hore Z, Harley P, Stanley FU, Michrowska A, Dahiya M, La Russa F, Jager SE, Villa-Hernandez S, and Denk F (2020). A transcriptional toolbox for exploring peripheral neuro-immune interactions. Pain. [DOI] [PubMed] [Google Scholar]
- Lindwall C, Dahlin L, Lundborg G, and Kanje M (2004). Inhibition of c-Jun phosphorylation reduces axonal outgrowth of adult rat nodose ganglia and dorsal root ganglia sensory neurons. Molecular and Cellular Neuroscience 27, 267–279. [DOI] [PubMed] [Google Scholar]
- Lisi V, Singh B, Giroux M, Guzman E, Painter MW, Cheng YC, Huebner E, Coppola G, Costigan M, Woolf CJ, et al. (2017). Enhanced Neuronal Regeneration in the CAST/Ei Mouse Strain Is Linked to Expression of Differentiation Markers after Injury. Cell reports 20, 1136–1147. [DOI] [PMC free article] [PubMed] [Google Scholar]
- Liu T, van Rooijen N, and Tracey DJ (2000a). Depletion of macrophages reduces axonal degeneration and hyperalgesia following nerve injury. Pain 86, 25–32. [DOI] [PubMed] [Google Scholar]
- Liu X, Eschenfelder S, Blenk K-H, Jänig W, and Häbler H-J (2000b). Spontaneous activity of axotomized afferent neurons after L5 spinal nerve injury in rats. PAIN® 84, 309–318. [DOI] [PubMed] [Google Scholar]
- Lopes DM, Malek N, Edye M, Jager SB, McMurray S, McMahon SB, and Denk F (2017). Sex differences in peripheral not central immune responses to pain-inducing injury. Scientific Reports 7, 16460. [DOI] [PMC free article] [PubMed] [Google Scholar]
- Luxey M, Jungas T, Laussu J, Audouard C, Garces A, and Davy A (2013). Eph:ephrin-B1 forward signaling controls fasciculation of sensory and motor axons. Developmental Biology 383, 264–274. [DOI] [PubMed] [Google Scholar]
- Ma CHE, Omura T, Cobos EJ, Latrémolière A, Ghasemlou N, Brenner GJ, van Veen E, Barrett L, Sawada T, Gao F, et al. (2011). Accelerating axonal growth promotes motor recovery after peripheral nerve injury in mice. The Journal of clinical investigation 121, 4332–4347. [DOI] [PMC free article] [PubMed] [Google Scholar]
- Ma TC, and Willis DE (2015). What makes a RAG regeneration associated? Front Mol Neurosci 8. [DOI] [PMC free article] [PubMed] [Google Scholar]
- Mahar M, and Cavalli V (2018). Intrinsic mechanisms of neuronal axon regeneration. Nat Rev Neurosci 19, 323–337. [DOI] [PMC free article] [PubMed] [Google Scholar]
- Michaelevski I, Segal-Ruder Y, Rozenbaum M, Medzihradszky KF, Shalem O, Coppola G, Horn-Saban S, Ben-Yaakov K, Dagan SY, Rishal I, et al. (2010). Signaling to transcription networks in the neuronal retrograde injury response. Science signaling 3, ra53. [DOI] [PMC free article] [PubMed] [Google Scholar]
- Mo A, Mukamel EA, Davis FP, Luo C, Henry GL, Picard S, Urich MA, Nery JR, Sejnowski TJ, Lister R, et al. (2015). Epigenomic Signatures of Neuronal Diversity in the Mammalian Brain. Neuron 86, 1369–1384. [DOI] [PMC free article] [PubMed] [Google Scholar]
- Navarro X, Verdú E, and Butí M (1994). Comparison of Regenerative and Reinnervating Capabilities of Different Functional Types of Nerve Fibers. Exp Neurol 129, 217–224. [DOI] [PubMed] [Google Scholar]
- Nguyen MQ, Le Pichon CE, and Ryba N (2019). Stereotyped transcriptomic transformation of somatosensory neurons in response to injury. eLife 8. [DOI] [PMC free article] [PubMed] [Google Scholar]
- Nishino J, Yamashita K, Hashiguchi H, Fujii H, Shimazaki T, and Hamada H (2004). Meteorin: a secreted protein that regulates glial cell differentiation and promotes axonal extension. The EMBO journal 23, 1998–2008. [DOI] [PMC free article] [PubMed] [Google Scholar]
- North RY, Li Y, Ray P, Rhines LD, Tatsui CE, Rao G, Johansson CA, Zhang H, Kim YH, Zhang B, et al. (2019). Electrophysiological and transcriptomic correlates of neuropathic pain in human dorsal root ganglion neurons. Brain : a journal of neurology 142, 1215–1226. [DOI] [PMC free article] [PubMed] [Google Scholar]
- O’Donovan KJ, Ma K, Guo H, Wang C, Sun F, Han SB, Kim H, Wong JK, Charron J, Zou H, et al. (2014). B-RAF kinase drives developmental axon growth and promotes axon regeneration in the injured mature CNS. The Journal of experimental medicine 211, 801–814. [DOI] [PMC free article] [PubMed] [Google Scholar]
- Ogawa N, Kawai H, Terashima T, Kojima H, Oka K, Chan L, and Maegawa H (2014). Gene therapy for neuropathic pain by silencing of TNF-alpha expression with lentiviral vectors targeting the dorsal root ganglion in mice. PloS one 9, e92073. [DOI] [PMC free article] [PubMed] [Google Scholar]
- Oliveira AL (2001). Apoptosis of sensory neurons and satellite cells after sciatic nerve transection in C57BL/6J mice. Brazilian journal of medical and biological research = Revista brasileira de pesquisas medicas e biologicas 34, 375–380. [DOI] [PubMed] [Google Scholar]
- Parsadanian A, Pan Y, Li W, Myckatyn TM, and Brakefield D (2006). Astrocyte-derived transgene GDNF promotes complete and long-term survival of adult facial motoneurons following avulsion and differentially regulates the expression of transcription factors of AP-1 and ATF/CREB families. Exp Neurol 200, 26–37. [DOI] [PubMed] [Google Scholar]
- Patel R, Montagut-Bordas C, and Dickenson AH (2018). Calcium channel modulation as a target in chronic pain control. Br J Pharmacol 175, 2173–2184. [DOI] [PMC free article] [PubMed] [Google Scholar]
- Patodia S, and Raivich G (2012). Role of transcription factors in peripheral nerve regeneration. Front Mol Neurosci 5, 8. [DOI] [PMC free article] [PubMed] [Google Scholar]
- Perkins JR, Antunes-Martins A, Calvo M, Grist J, Rust W, Schmid R, Hildebrandt T, Kohl M, Orengo C, McMahon SB, et al. (2014). A comparison of RNA-seq and exon arrays for whole genome transcription profiling of the L5 spinal nerve transection model of neuropathic pain in the rat. Mol Pain 10, 7–7. [DOI] [PMC free article] [PubMed] [Google Scholar]
- Peters CM, Jimenez-Andrade JM, Kuskowski MA, Ghilardi JR, and Mantyh PW (2007). An evolving cellular pathology occurs in dorsal root ganglia, peripheral nerve and spinal cord following intravenous administration of paclitaxel in the rat. Brain Res 1168, 46–59. [DOI] [PMC free article] [PubMed] [Google Scholar]
- Poplawski GHD, Kawaguchi R, Van Niekerk E, Lu P, Mehta N, Canete P, Lie R, Dragatsis I, Meves JM, Zheng B, et al. (2020). Injured adult neurons regress to an embryonic transcriptional growth state. Nature 581, 77–82. [DOI] [PubMed] [Google Scholar]
- R Core Team (2018). R: A language and environment for statistical computing. R Foundation for Statistical Computing, Vienna, Austria: Available online at https://www.R-project.org/. [Google Scholar]
- Raivich G, Bohatschek M, Da Costa C, Iwata O, Galiano M, Hristova M, Nateri AS, Makwana M, Riera-Sans L, Wolfer DP, et al. (2004). The AP-1 transcription factor c-Jun is required for efficient axonal regeneration. Neuron 43, 57–67. [DOI] [PubMed] [Google Scholar]
- Renthal W, Boxer LD, Hrvatin S, Li E, Silberfeld A, Nagy MA, Griffith EC, Vierbuchen T, and Greenberg ME (2018). Characterization of human mosaic Rett syndrome brain tissue by single-nucleus RNA sequencing. Nature neuroscience 21, 1670–1679. [DOI] [PMC free article] [PubMed] [Google Scholar]
- Rigaud M, Gemes G, Barabas M-E, Chernoff DI, Abram SE, Stucky CL, and Hogan QH (2008). Species and strain differences in rodent sciatic nerve anatomy: implications for studies of neuropathic pain. Pain 136, 188–201. [DOI] [PMC free article] [PubMed] [Google Scholar]
- Robinson MD, McCarthy DJ, and Smyth GK (2009). edgeR: a Bioconductor package for differential expression analysis of digital gene expression data. Bioinformatics 26, 139–140. [DOI] [PMC free article] [PubMed] [Google Scholar]
- Ronquist S, Patterson G, Muir LA, Lindsly S, Chen H, Brown M, Wicha MS, Bloch A, Brockett R, and Rajapakse I (2017). Algorithm for cellular reprogramming. Proceedings of the National Academy of Sciences 114, 11832. [DOI] [PMC free article] [PubMed] [Google Scholar]
- Sakuma M, Gorski G, Sheu SH, Lee S, Barrett LB, Singh B, Omura T, Latremoliere A, and Woolf CJ (2016). Lack of motor recovery after prolonged denervation of the neuromuscular junction is not due to regenerative failure. The European journal of neuroscience 43, 451–462. [DOI] [PMC free article] [PubMed] [Google Scholar]
- Satija R, Farrell JA, Gennert D, Schier AF, and Regev A (2015). Spatial reconstruction of single-cell gene expression data. Nature biotechnology 33, 495–502. [DOI] [PMC free article] [PubMed] [Google Scholar]
- Scheib J, and Höke A (2013). Advances in peripheral nerve regeneration. Nature Reviews Neurology 9, 668. [DOI] [PubMed] [Google Scholar]
- Schmid D, Zeis T, Sobrio M, and Schaeren-Wiemers N (2014). MAL overexpression leads to disturbed expression of genes that influence cytoskeletal organization and differentiation of Schwann cells. ASN Neuro 6, 1759091414548916. [DOI] [PMC free article] [PubMed] [Google Scholar]
- Seijffers R, Allchorne AJ, and Woolf CJ (2006). The transcription factor ATF-3 promotes neurite outgrowth. Molecular and cellular neurosciences 32, 143–154. [DOI] [PubMed] [Google Scholar]
- Seijffers R, Mills CD, and Woolf CJ (2007). ATF3 increases the intrinsic growth state of DRG neurons to enhance peripheral nerve regeneration. The Journal of neuroscience : the official journal of the Society for Neuroscience 27, 7911–7920. [DOI] [PMC free article] [PubMed] [Google Scholar]
- Seijffers R, Zhang J, Matthews JC, Chen A, Tamrazian E, Babaniyi O, Selig M, Hynynen M, Woolf CJ, and Brown RH Jr. (2014). ATF3 expression improves motor function in the ALS mouse model by promoting motor neuron survival and retaining muscle innervation. Proc Natl Acad Sci U S A 111, 1622–1627. [DOI] [PMC free article] [PubMed] [Google Scholar]
- Serra J, Bostock H, Sola R, Aleu J, Garcia E, Cokic B, Navarro X, and Quiles C (2012). Microneurographic identification of spontaneous activity in C-nociceptors in neuropathic pain states in humans and rats. Pain 153, 42–55. [DOI] [PubMed] [Google Scholar]
- Sharma N, Flaherty K, Lezgiyeva K, Wagner DE, Klein AM, and Ginty DD (2020). The emergence of transcriptional identity in somatosensory neurons. Nature 577, 392–398. [DOI] [PMC free article] [PubMed] [Google Scholar]
- Shi TJ, Tandrup T, Bergman E, Xu ZQ, Ulfhake B, and Hökfelt T (2001). Effect of peripheral nerve injury on dorsal root ganglion neurons in the C57 BL/6J mouse: marked changes both in cell numbers and neuropeptide expression. Neuroscience 105, 249–263. [DOI] [PubMed] [Google Scholar]
- Shortland PJ, Baytug B, Krzyzanowska A, McMahon SB, Priestley JV, and Averill S (2006). ATF3 expression in L4 dorsal root ganglion neurons after L5 spinal nerve transection. The European journal of neuroscience 23, 365–373. [DOI] [PubMed] [Google Scholar]
- Soneson C, and Robinson MD (2018). Bias, robustness and scalability in single-cell differential expression analysis. Nature methods 15, 255–261. [DOI] [PubMed] [Google Scholar]
- Tandrup T, Woolf CJ, and Coggeshall RE (2000). Delayed loss of small dorsal root ganglion cells after transection of the rat sciatic nerve. Journal of Comparative Neurology 422, 172–180. [DOI] [PubMed] [Google Scholar]
- Toma W, Kyte SL, Bagdas D, Alkhlaif Y, Alsharari SD, Lichtman AH, Chen ZJ, Del Fabbro E, Bigbee JW, Gewirtz DA, et al. (2017). Effects of paclitaxel on the development of neuropathy and affective behaviors in the mouse. Neuropharmacology 117, 305–315. [DOI] [PMC free article] [PubMed] [Google Scholar]
- Tran NM, Shekhar K, Whitney IE, Jacobi A, Benhar I, Hong G, Yan W, Adiconis X, Arnold ME, Lee JM, et al. (2019). Single-Cell Profiles of Retinal Ganglion Cells Differing in Resilience to Injury Reveal Neuroprotective Genes. Neuron 104, 1039–1055.e1012. [DOI] [PMC free article] [PubMed] [Google Scholar]
- Tsantoulas C, and McMahon SB (2014). Opening paths to novel analgesics: the role of potassium channels in chronic pain. Trends in neurosciences 37, 146–158. [DOI] [PMC free article] [PubMed] [Google Scholar]
- Tsujino H, Kondo E, Fukuoka T, Dai Y, Tokunaga A, Miki K, Yonenobu K, Ochi T, and Noguchi K (2000). Activating Transcription Factor 3 (ATF3) Induction by Axotomy in Sensory and Motoneurons: A Novel Neuronal Marker of Nerve Injury. Molecular and Cellular Neuroscience 15, 170–182. [DOI] [PubMed] [Google Scholar]
- Tuszynski MH, and Steward O (2012). Concepts and methods for the study of axonal regeneration in the CNS. Neuron 74, 777–791. [DOI] [PMC free article] [PubMed] [Google Scholar]
- Usoskin D, Furlan A, Islam S, Abdo H, Lonnerberg P, Lou D, Hjerling-Leffler J, Haeggstrom J, Kharchenko O, Kharchenko PV, et al. (2015). Unbiased classification of sensory neuron types by large-scale single-cell RNA sequencing. Nature neuroscience 18, 145–153. [DOI] [PubMed] [Google Scholar]
- Vilceanu D, Honore P, Hogan QH, and Stucky CL (2010). Spinal Nerve Ligation in Mouse Upregulates TRPV1 Heat Function in Injured IB4-Positive Nociceptors. The Journal of Pain 11, 588–599. [DOI] [PMC free article] [PubMed] [Google Scholar]
- Vit J-P, Ohara PT, Bhargava A, Kelley K, and Jasmin L (2008). Silencing the Kir4.1 potassium channel subunit in satellite glial cells of the rat trigeminal ganglion results in pain-like behavior in the absence of nerve injury. The Journal of neuroscience : the official journal of the Society for Neuroscience 28, 4161–4171. [DOI] [PMC free article] [PubMed] [Google Scholar]
- Vogelaar CF, Vrinten DH, Hoekman MFM, Brakkee JH, Burbach JPH, and Hamers FPT (2004). Sciatic nerve regeneration in mice and rats: recovery of sensory innervation is followed by a slowly retreating neuropathic pain-like syndrome. Brain Research 1027, 67–72. [DOI] [PubMed] [Google Scholar]
- Wang T, Li B, Nelson CE, and Nabavi S (2019). Comparative analysis of differential gene expression analysis tools for single-cell RNA sequencing data. BMC Bioinformatics 20, 40. [DOI] [PMC free article] [PubMed] [Google Scholar]
- Warnes GR, Bolker B, Bonebakker L, Gentleman R, Huber W, Liaw A, Lumley T, Maechler M, Magnusson A, and Moeller S (2009). gplots: Various R programming tools for plotting data. R package version 2, 1. [Google Scholar]
- Wickham H (2016). ggplot2: elegant graphics for data analysis (springer; ). [Google Scholar]
- Wolbert J, Li X, Heming M, Mausberg AK, Akkermann D, Frydrychowicz C, Fledrich R, Groeneweg L, Schulz C, Stettner M, et al. (2020). Redefining the heterogeneity of peripheral nerve cells in health and autoimmunity. Proceedings of the National Academy of Sciences 117, 9466. [DOI] [PMC free article] [PubMed] [Google Scholar]
- Woolf CJ (2020). Capturing Novel Non-opioid Pain Targets. Biological psychiatry 87, 74–81. [DOI] [PMC free article] [PubMed] [Google Scholar]
- Woolf CJ, Reynolds ML, Molander C, O’Brien C, Lindsay RM, and benowitz LI (1990). The growth-associated protein gap-43 appears in dorsal root ganglion cells and in the dorsal horn of the rat spinal cord following peripheral nerve injury. Neuroscience 34, 465–478. [DOI] [PubMed] [Google Scholar]
- Wu YE, Pan L, Zuo Y, Li X, and Hong W (2017). Detecting Activated Cell Populations Using Single-Cell RNA-Seq. Neuron 96, 313–329.e316. [DOI] [PubMed] [Google Scholar]
- Xiao H-S, Huang Q-H, Zhang F-X, Bao L, Lu Y-J, Guo C, Yang L, Huang W-J, Fu G, Xu S-H, et al. (2002). Identification of gene expression profile of dorsal root ganglion in the rat peripheral axotomy model of neuropathic pain. Proceedings of the National Academy of Sciences 99, 8360. [DOI] [PMC free article] [PubMed] [Google Scholar]
- Xie W, Strong JA, and Zhang JM (2017). Active Nerve Regeneration with Failed Target Reinnervation Drives Persistent Neuropathic Pain. eNeuro 4. [DOI] [PMC free article] [PubMed] [Google Scholar]
- Zeisel A, Hochgerner H, Lonnerberg P, Johnsson A, Memic F, van der Zwan J, Haring M, Braun E, Borm LE, La Manno G, et al. (2018). Molecular Architecture of the Mouse Nervous System. Cell 174, 999–1014.e1022. [DOI] [PMC free article] [PubMed] [Google Scholar]
- Zhang H, and Dougherty PM (2014). Enhanced excitability of primary sensory neurons and altered gene expression of neuronal ion channels in dorsal root ganglion in paclitaxel-induced peripheral neuropathy. Anesthesiology 120, 1463–1475. [DOI] [PMC free article] [PubMed] [Google Scholar]
- Zhang H, Li Y, de Carvalho-Barbosa M, Kavelaars A, Heijnen CJ, Albrecht PJ, and Dougherty PM (2016). Dorsal Root Ganglion Infiltration by Macrophages Contributes to Paclitaxel Chemotherapy-Induced Peripheral Neuropathy. The journal of pain : official journal of the American Pain Society 17, 775–786. [DOI] [PMC free article] [PubMed] [Google Scholar]
- Zheng Y, Liu P, Bai L, Trimmer JS, Bean BP, and Ginty DD (2019). Deep Sequencing of Somatosensory Neurons Reveals Molecular Determinants of Intrinsic Physiological Properties. Neuron 103, 598–616.e597. [DOI] [PMC free article] [PubMed] [Google Scholar]
Associated Data
This section collects any data citations, data availability statements, or supplementary materials included in this article.
Supplementary Materials
Table S1, related to Figure 1: Sample metadata for the study
Table S2, related to Figures 2 and 4: Genes that are enriched in specific DRG neuronal subtypes in naive mice. These genes are used to generate cell-type-specificity scores
Table S3, related to Figure 4: Differential gene expression analysis between mice subjected to each injury model and naive mice at multiple time point after injury
Table S4, related to Figure 4: Comparative analysis between cell types of the genes upregulated in mice subjected to spinal nerve transection (SpNT) compared to naive mice. Table includes the common injury genes induced by SpNT in ?5 neuronal subtypes, 2–4 neuronal subtypes, and those which are upregulated in 1 neuronal subtype compared to their respective naive cell types
Table S5, related to Figure 5: Differential gene expression analysis between male and female DRGs from naive mice or those subjected to sciatic nerve crush
Table S6, related to Figure 7: Atf3-dependent gene expression after sciatic nerve crush
Table S7, related to Figures 4 and 5: Differential gene expression between embryonic (E12.5, E14.5, E18.5) and adult DRG neurons
Data Availability Statement
Processed data are available at www.painseq.com. Raw and processed data were also deposited within the Gene Expression Omnibus (GEO) repository (www.ncbi.nlm.nih.gov/geo) with an accession number (GSE154659). Custom R scripts are available upon request.