Abstract
Corpus callosum dysgenesis (CCD) is a developmental brain condition in which some white matter fibers fail to find their natural course across the midplane, reorganizing instead to form new aberrant pathways. This type of white matter reorganization is known as long-distance plasticity (LDP). The present work aimed to characterize the Balb/c mouse strain as a model of CCD. We employed high-resolution anatomical MRI in 81 Balb/c and 27 C57bl6 mice to show that the Balb/c mouse strain presents a variance in the size of the CC that is 3.9 times higher than the variance of normotypical C57bl6. We also performed high-resolution diffusion-weighted imaging (DWI) in 8 Balb/c and found that the Balb/c strain shows aberrant white matter bundles, such as the Probst (5/8 animals) and the Sigmoid bundles (7/8 animals), which are similar to those found in humans with CCD. Using a histological tracer technique, we confirmed the existence of these aberrant bundles in the Balb/c strain. Interestingly, we also identified sigmoid-like fibers in the C57bl6 strain, thought to a lesser degree. Next, we used a connectome approach and found widespread brain connectivity differences between Balb/c and C57bl6 strains. The Balb/c strain also exhibited increased variability of global connectivity. These findings suggest that the Balb/c strain presents local and global changes in brain structural connectivity. This strain often presents with callosal abnormalities, along with the Probst and the Sigmoid bundles, making it is an attractive animal model for CCD and LDP in general. Our results also show that even the C57bl6 strain, which typically serves as a normotypical control animal in a myriad of studies, presents sigmoid-fashion pattern fibers laid out in the brain. These results suggest that these aberrant fiber pathways may not necessarily be a pathological hallmark, but instead an alternative roadmap for misguided axons. Such findings offer new insights for interpreting the significance of CCD-associated LDP in humans.
Keywords: Corpus callosum, Brain plasticity, DWI, Structural connectivity, Corpus callosum dysgenesis
Introduction
Neural plasticity is a critical brain property that describes the structural and functional changes that allow the brain to learn, to remember, to adapt to the environment, and to recover from injuries. Neural plasticity happens on multiple spatial scales. At the microscale level, it causes changes in axonal arborization (Gogolla et al., 2007) and growth or retraction of dendritic spines (Gipson and Olive, 2016; Gross et al., 2016) within individual neurons. At the mesoscale level, it involves a substantial reorganization of axonal tracts and white matter pathways. This type of neural plasticity is called long-distance axonal plasticity, or more simply, long-distance plasticity (LDP).
LDP was first described in humans born with corpus callosum dysgenesis (CCD), in whom a subset of callosal fibers fail to find their natural courses across the midplane, reorganizing instead to form new or alternative pathways (Tovar-Moll et al., 2007; Paul et al., 2007; Edwards et al., 2014). The most classical result of LDP is the Probst bundle (Probst, 1901), formed by callosal fibers that, unable to cross the midline, swerve and organize into an anteroposterior fiber system parallel to the sagittal plane. The Probst bundle is the most common anomalous tract in human CCD. It is also present in most animal models of this condition (Ozaki et al., 1987a; Ren et al., 2007; Sforazzini et al., 2016). More recently, with advances in magnetic resonance imaging (MRI) techniques, other anomalous bundles were found exclusively in humans. These include the Sigmoid bundle (which crosses the midline through a callosal remnant and connects contralateral frontal and occipito-parietal regions), (Tovar-Moll et al., 2007; Whal et al., 2008) and homotopic corticocortical bundles (which connect homotopic cortical regions through the anterior or the posterior commissures) (Tovar-Moll et al., 2014; Jakab et al., 2015a). The complete absence of the CC in the majority of previously studied animal models has prevented the preclinical study of alternative routes such as the Sigmoid bundle, which crosses the midline in CCD with reduced and partial callosal crossing, a condition also known as partial dysgenesis of the corpus callosum (pCCD).
The Balb/c mouse strain, a widely used animal model in the 80s and 90s (Bishop et al., 1996; Livy and Wahlsten, 1997; Ozaki et al., 1987a; Ozaki and Wahlsten, 1993), can either present pCCD or lack the corpus callosum entirely. The study of pCCD in Balb/c mice has allowed the investigation of tracts previously described only in humans, such as the Sigmoid bundle, which crosses midline through the callosal remnant. A previous publication suggested that abnormal connectivity between different parts of the cortex in Balb/c mice occurs through the hippocampal commissure (Olavarria et al., 1988), while another work reported altered midline glial structures related to a late hemisphere fusion (Wahlsten et al. 1987).
Here, we hypothesized that the Balb/c mouse strain is an excellent model of CCD to compare with the human condition. We employed a reverse translational approach to investigate and characterize LDP in Balb/c mice, with the hope of opening a new avenue for the investigation of neural plasticity in the mammalian brain.
2. Material and Methods
All experiments were approved by the Federal University of Rio de Janeiro (UFRJ) (048/15) and by the Animal Care and Use Committee of the National Institute of Neurological Disorders and Stroke (NINDS).
2.1. Animals
Three-month-old mice of both genders came from three different populations. The first was composed of 81 Balb/c animals from UFRJ (National Center for Structural Biology and Bioimaging, CENABIO), which were imaged in-vivo for the morphological CC quantification and ex-vivo for high-resolution MRI and histological analysis with SMI312. The second population consisted of 24 animals from NIH (8 Balb/c used for DWI, and 8 Balb/c and 8 C57bl6/J for neuronal tract-tracing). The third cohort consisted of 27 C57bl6/J animals, which were kindly provided by the Queensland Brain Institute (QBI, Brisbane, Australia) and used for DWI data comparison (Liu et al. 2016). The animals were matched for age, sex, and housed in similar environments with similar diet and husbandry.
2.2. In-vivo MRI for CCD diagnosis
MRI was performed in 81 adult Balb/c animals for clear visualization and quantification of the CC at the sagittal plane. Animals were anesthetized with inhaled 3% isoflurane. Images were acquired in a 7T magnetic resonance scanner (MRI System 7T/210 ASR Horizontal bore magnetic, Varian Technologies). Brain images were obtained using SEMS proton density (DP) (TR/TE 2500:27 ms; matrix 128 × 128; FOV 23 × 23 mm; slice thickness: 0.25mm; no gap; 8 averages in the sagittal plane, ~45 min acquisition time.
For quantification of the commissure areas, images were upsampled by a factor of 4 in Mipav (V.7.3.0), to increase the matrix. The CC boundaries were delineated in the midline sagittal slice with a freehand drawing tool to create an ROI (Figure 1 A–C) and extract the area with the contour information.
Figure 1. Populational study of CC morphology.
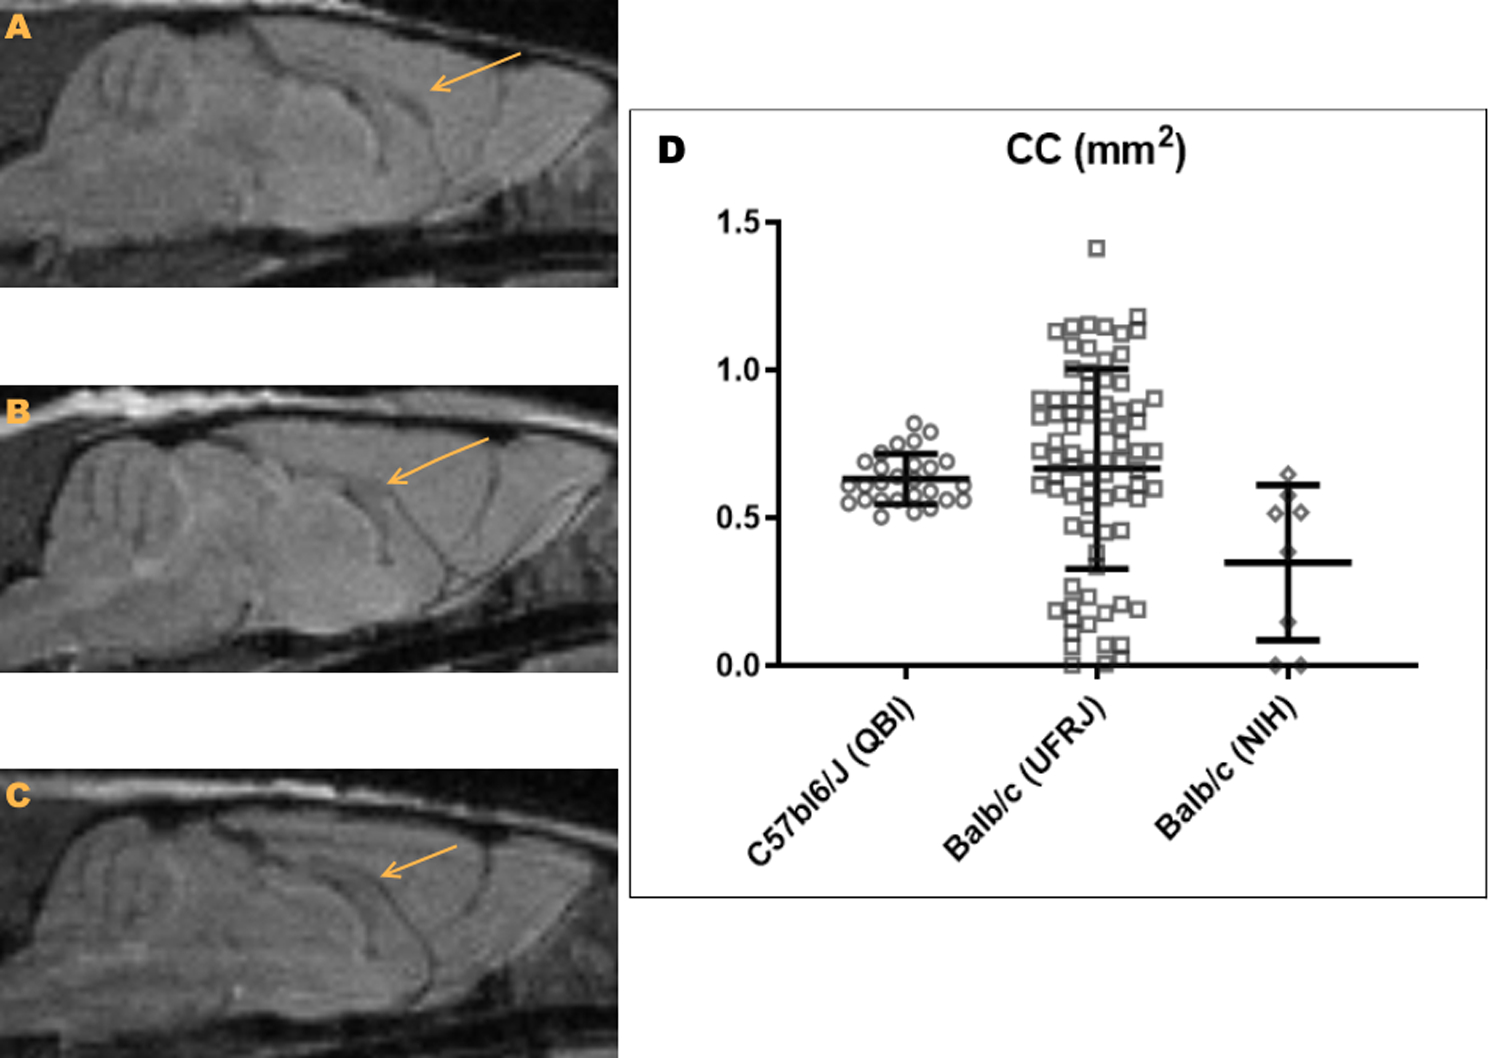
A. Example of a Balb/c mouse with a typical CC. B. Example of a Balb/c mouse with a reduced size CC. C. example of a Balb/c mouse with agenesis of the CC. D. Dispersion graph of the CC area (mm2) in C57bl6/J (from QBI, circles) and Balb/c mice (from UFRJ, squares; from NIH, diamonds). Each dot represents an individual mouse, and bars represent the mean and standard deviation.
To compare the size and morphology of the CC in Balb/c mice against a strain with no callosal anomalies reported, we obtained the same anatomical measures described above from the DWI images of the 27 C57bl6/J animals from QBI. We selected a sagittal plane through midline where the corpus callosum was visible and well defined in the b0 image, we delineated the CC and quantified its area. To verify that the differences in CC morphology were due to the differences between strains and not between MRI pulse sequences, we also analyzed the NIH Balb/c population (Figure 1D).
2.3. Ex-vivo high-resolution MRI and histological comparison
2.3.1. Perfusion
All animals were anesthetized with an intraperitoneal injection of 100 mg/kg ketamine and 10mg/kg xylazine, followed by intracardiac perfusion with phosphate buffer saline (0.1M PBS at 8 °C). After all the blood was cleared from circulation, the brain was perfused with formaldehyde (4% in PBS). After the desired fixation stage was reached (15 min perfusion), the head was removed, placed in a falcon tube with PBS for 3D high-resolution and diffusion magnetic resonance imaging (MRI) acquisitions, followed by the histology protocol.
2.3.2. Ex-vivo high-resolution anatomical MRI
This protocol was designed to have enough spatial resolution to detect the anatomical structures of interest and compare them to histology. The heads were placed in a falcon tube in 0.1M PBS. Images were acquired in a 7T magnetic resonance scanner (MRI System 7T/210 ASR Horizontal bore magnetic, Varian Technologies), using SEMS PD sequence (TR/TE 2500:27 ms; matrix 128 × 128; FOV 23 × 23 mm; slice thickness: 0.175mm; no gap; 16 averages); acquisition time was about 6h. The protocol was performed in 6 ex-vivo fixed animals (three CCD and normocallosal Balb/c).
2.3.3. Ex-vivo high-resolution diffusion-weighted MRI
The brains of eight adult Balb/c mice (3-month old, four females) were placed in a falcon tube with 0.1M PBS and 0.2% gadolinium (gadopentetate dimeglumine) for four days at 8°C to enhance MRI contrast (Liu et al., 2016).
Brains were placed in a 3D printed brain holder and inserted into a 15mm Falcon tube containing Fomblin for imaging.
Diffusion-weighted images were acquired in a 14T vertical bore small animal MRI system equipped with a micro 2.5 gradient system and a 15mm coil. Diffusion-weighted 3-D spin-echo EPI images were acquired using the following parameters: TR/TE = 450/21ms, δ/Δ = 3/7.5 ms, field of view = 12.80 × 10.24 × 6.40 mm3, matrix = 160 × 128 × 80 yielding an isotropic resolution of 80µm, number of averages = 2, bandwidth = 300 kHz, 232 diffusion-weighting directions split in three shells of 39, 77 and 116 directions, b-values = 1500, 3000, 6000 s/mm2 with 4 b0 images, acquisition time was about 2.5 days.
2.3.4. Fiber-tracking
Images were manually checked for artifacts, then subjected to eddy-current correction (Andersson and Sotiropoulos, 2016). Fiber orientation distribution (FOD) was generated by the MRtrix multi-shell multi-tissue command (Jeurissen et al., 2014).
For probabilistic tractography, regions of interest (ROIs) were manually drawn in both hemispheres at the frontal portion of the CC (or at the frontal portion of the Probst bundle in CCD cases), the posterior portion of the cortex at the level of mid hippocampus, at the entire CC (or CC remnant in cases of incomplete CCD) and the hippocampal commissure (HC). To ensure that tractography was restricted to white matter tracts, any streamline length below 0.5 mm was discarded. A sufficiently high number of streamlines are required to generate a tract profile of high confidence.
2.3.5. Connectomics
The connectome analysis was performed using the same 8 Balb/c mice previously described, and 27 C57bl6/J mice data with a similar protocol and previously published (Liu et al., 2016). Each animal was submitted to eddy current correction (Andersson and Sotiropoulos, 2016), noise removal by DWI denoise (Veraart et al., 2016), and had the FOD estimated by Tournier algorithm of MRtrix (Tournier et al., 2007). This algorithm differs from the previous tractography pipeline because the C57bl6/J data only has one shell, and, for a reliable comparison, both strains were processed equally.
After FOD estimation, a mouse atlas (Ullmann et al., 2013) with 74 ROIs, 37 in each hemisphere, was registered to each animal using the ANTs software (Avants et al., 2011) and manually checked for consistency. ROIs were used as seeds and targets for the tractography.
Fiber tractography was made from each ROI to all other ROIs, terminated if the fiber’s FOD value was below 0.2 (is not considered a fiber anymore) or if the tract-tracing procedure between each pair of ROIs reached 100 selected streamlines (enough streamlines to be considered a bundle). The ratio of selected/total streamlines was used as a measurement of connectivity strength.
Connectivity matrix was generated in Matlab (Mathworks), and edges with connectivity below 0.001 were considered artifacts and deleted from the analysis to prevent false positives.
Using the same concept of the consensus connectome (Owen et al., 2013), we created the Base matrix analysis and the Mean matrix to study the overall connectivity pattern.
Base matrix:
The base matrix was defined as the base of all the animals of the strain and was calculated in Matlab. Animals were separated into two groups: Balb/c and C57bl6/J. Each group had its matrix calculated in a way that the edge value was equal to the mean of the animals except if one of them was equal to 0. If so, the value was set to 0. This way, every edge that any animal did not have was not represented in the matrix.
Mean matrix:
Mean matrix was defined so that every edge has the same value as the mean of all edges of the animals in each group. Any edges that show in at least one animal was included in the matrix.
Binary matrices:
For each matrix (mean and base), the binaries were calculated, where each value with a value different from 0 was set to 1.
Small worldness, assortativity, global efficiency, and hierarchy were calculated using GRETNA (Liu et al. 2016) and compared using its toolbox with Bonferroni correction for multiple comparisons. We also complemented these analyses with the quantification of the intrahemispheric, interhemispheric, and total number of edges. For the statistical comparison of these elements, we used unpaired t-tests.
2.3.6. Fiber tracing
AAV-GFP (Penn Vector Core, University of Pennsylvania) was injected with a 5ml Hamilton syringe in a new cohort of animals at coordinates AP +1.2mm, ML +0.4mm, and DV +1.0mm. These coordinates were chosen to target the origin of the Sigmoid bundle at the level of the anterior cingulate cortex. The injection volume was 0.4 µl. Two weeks after the injection, the animals were anesthetized and perfused as described before, and their brains were extracted and placed in 30% sucrose in 0.1M PBS for cryopreservation. The brains were sliced in 60µm sections in the axial plane, mounted and sealed in histological slides. Images were acquired in an Axioscan (Carl Zeiss Microimaging) microscope with a 10x objective lens.
2.3.7. Histology
Brains were extracted from the cranium and sliced in all three axes (each pair of animals were sliced in a different anatomical axis) in a LEICA vibratome at 100 µm. Brains slices were washed three times in 0.1M PBS for 5 min each and incubated with an anti-mouse primary antibody for the axonal marker SMI312 (Covance, USA) and 10% normal goat serum (NGS, Millipore, USA) overnight. On the next day, the slices were washed with 0.1M PBS three times for 5 min each, incubated with Alexa 546 (1:500) (Invitrogen, Brazil) with 10% NGS for two hours, then maintained for 15 min in the same solution with the addition of 1% 4’,6-Diamidino-2-Phenylindole (DAPI, Sigma), a cell nucleus marker. Slices were placed onto histological slides and sealed with Aquapolimount (Polysciences, Inc.). Histological slices were photographed in a Nikon Eclipse 80i microscope provided with the software Neurolucida (MicroBrightField, USA)).
3. Results
We hypothesized that the Balb/c, a strain that often shows malformations of the CC, could provide a useful model to investigate long-distance plasticity, as a model of the array of abnormalities described in humans with CCD. We aimed to characterize the callosal morphometry in the Balb/c strain and investigate possible changes in the whole brain white matter network, when compared to a strain without callosal anomalies, such as the C57bl6/J, with a similar rationale as Chen et al., 2006.
3.1. Corpus Callosum variability in a populational study
We first aimed to characterize the morphology of the CC and of other commissures in the Balb/c strain. For this purpose, we used a structural proton density MRI sequence that yielded sufficient contrast-to-noise ratio for gray-white matter delineation. We measured the area of the CC in the sagittal plane in 81 animals and compared them with the same anatomical measures taken from the 27 C57bl6/J animals. Anatomical images showed no tumors or cists in any animal. Unlike the low variance CC area distribution of C57bl6/J mice, we found that the callosal area of Balb/c was widely variable, ranging from a complete absence of the CC to 1mm2-oversized CC (Figure 1). To verify that the dispersion in size of the CC was due to the strain, and not due to the MRI pulse sequence, we performed the same analysis in the cohort of 8 Balb/c mice from the NIH. Figure 1D shows that the size variance of the CC is much larger in Balb/c mice than C57bl6/J.
Using an ex-vivo high-resolution proton density anatomical MRI protocol (see methods), we compared these MRI findings with histological sections immunostained for DAPI and SMI312 in the same plane. As shown in Fig. 2, our MRI sequence had sufficient gray-white matter contrast to detect differences between healthy and CCD animals.
Figure 2. Morphological comparison of three animals with dysgenesis of the corpus callosum (CCD) and three normotypical (NT) animals in the three planes used.
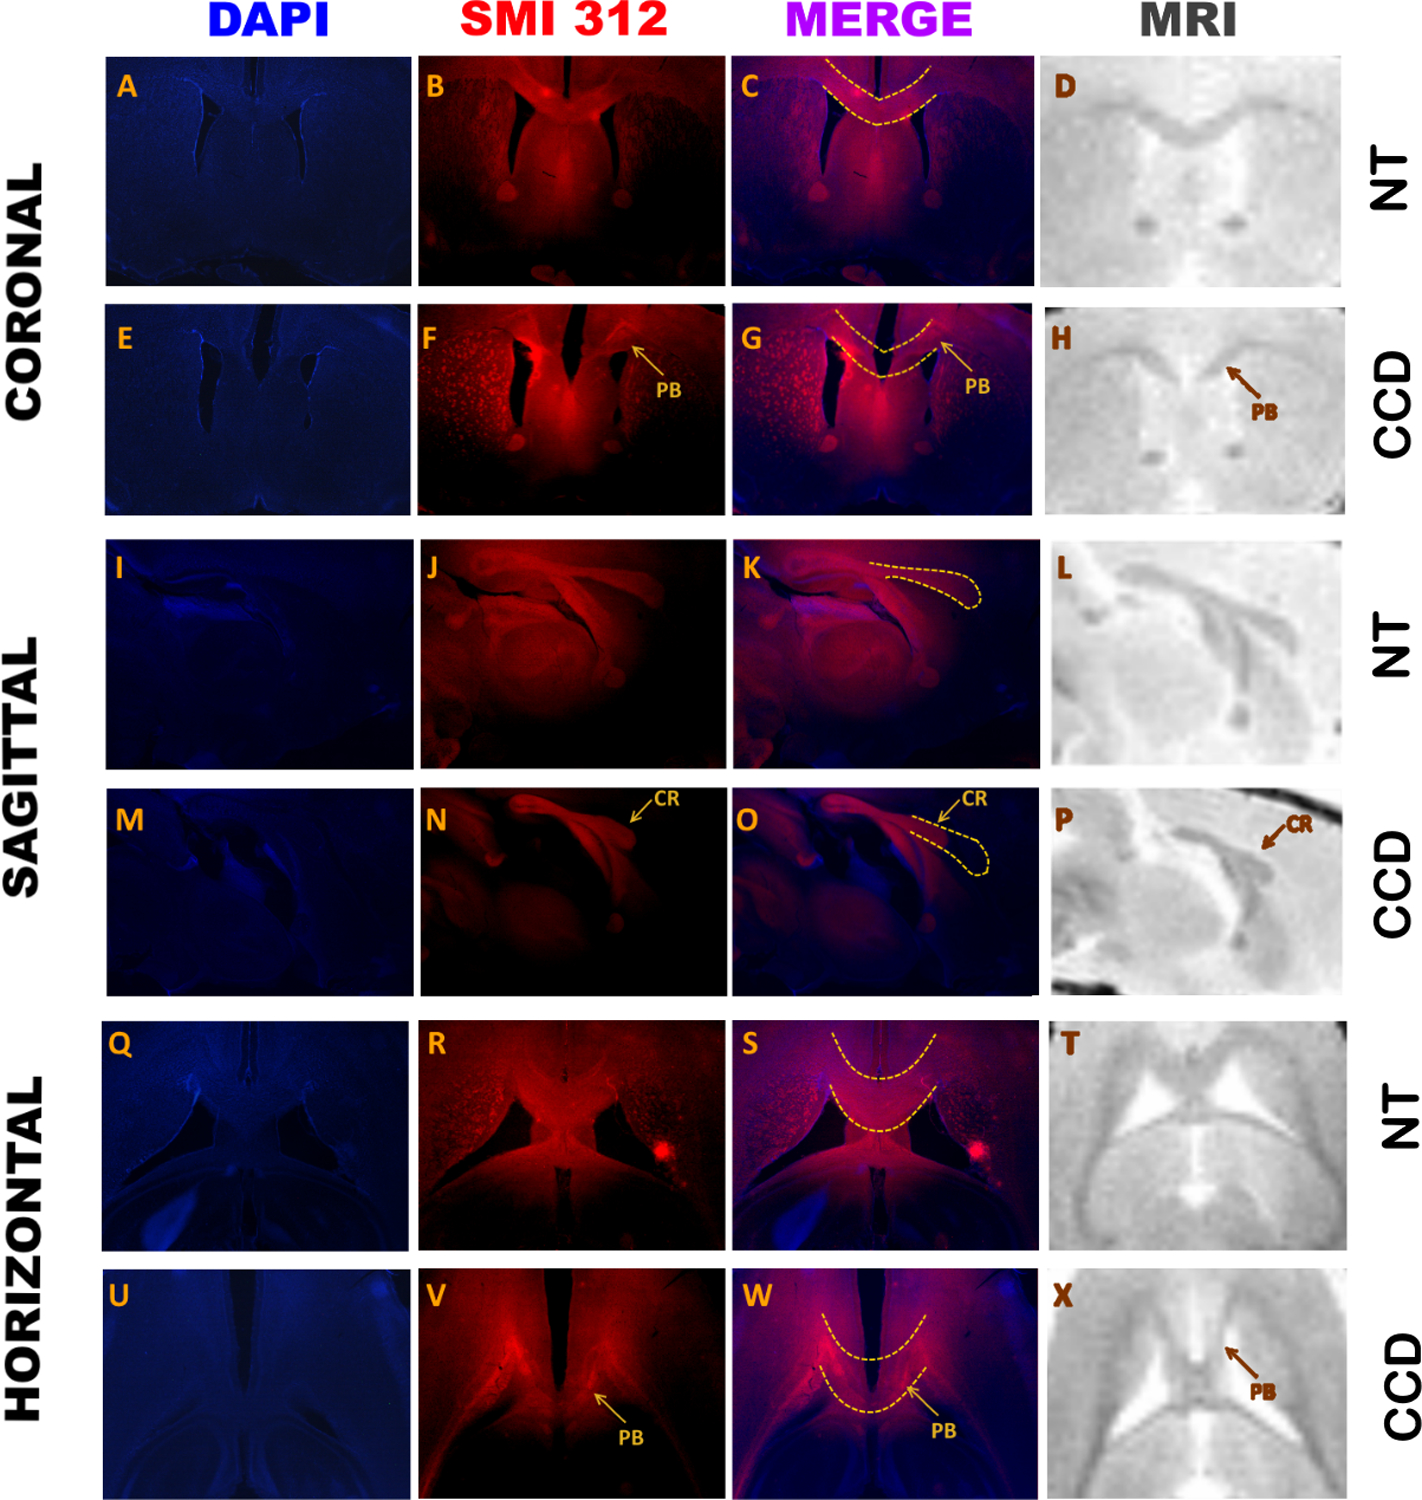
The first column is stained with DAPI, the second column shows immunohistochemistry for SMI 312, the third column is the merge of previous columns, and the fourth column is the ex-vivo high-resolution proton density (DP) MRI. Traced lines show the expected normal corpus callosum, superimposed in NT and CCD animals. CR: Callosal remnant; PB: Probst Bundle.
3.2. DWI tractography of normal and abnormal white-matter bundles
Next, we set out to investigate whether the differences in CC morphology detected with high-resolution MRI were associated with aberrant interhemispheric white-matter connectivity in the Balb/c strain. We found that four (M1F, M2M, M3F, M4F) out of eight Balb/c animals displayed abnormalities of the CC in an anatomical (b0) image. Diffusion-weighted MRI and tractography driven by manually-drawn ROI seeds in the CC (or the callosal remnant in CCD animals) were employed to characterize the interhemispheric connectivity (Figure 3). We found that all eight animals (4 males, 4 females) showed abnormalities in the DWI scans and tractography maps. Figure 3 shows examples of these abnormalities, which can also be appreciated in the connectivity maps of the interhemispheric network (Figure 4). Figure 4A shows one animal with an apparently normotypical cortico-cortical connectivity, contrasting with another animal (Figure 4B) that displayed only a “narrow bridge” juxtaposed to the HC (see also Supplementary Figures 1 and 2).
Figure 3. An anatomical view of the DWI cohort.
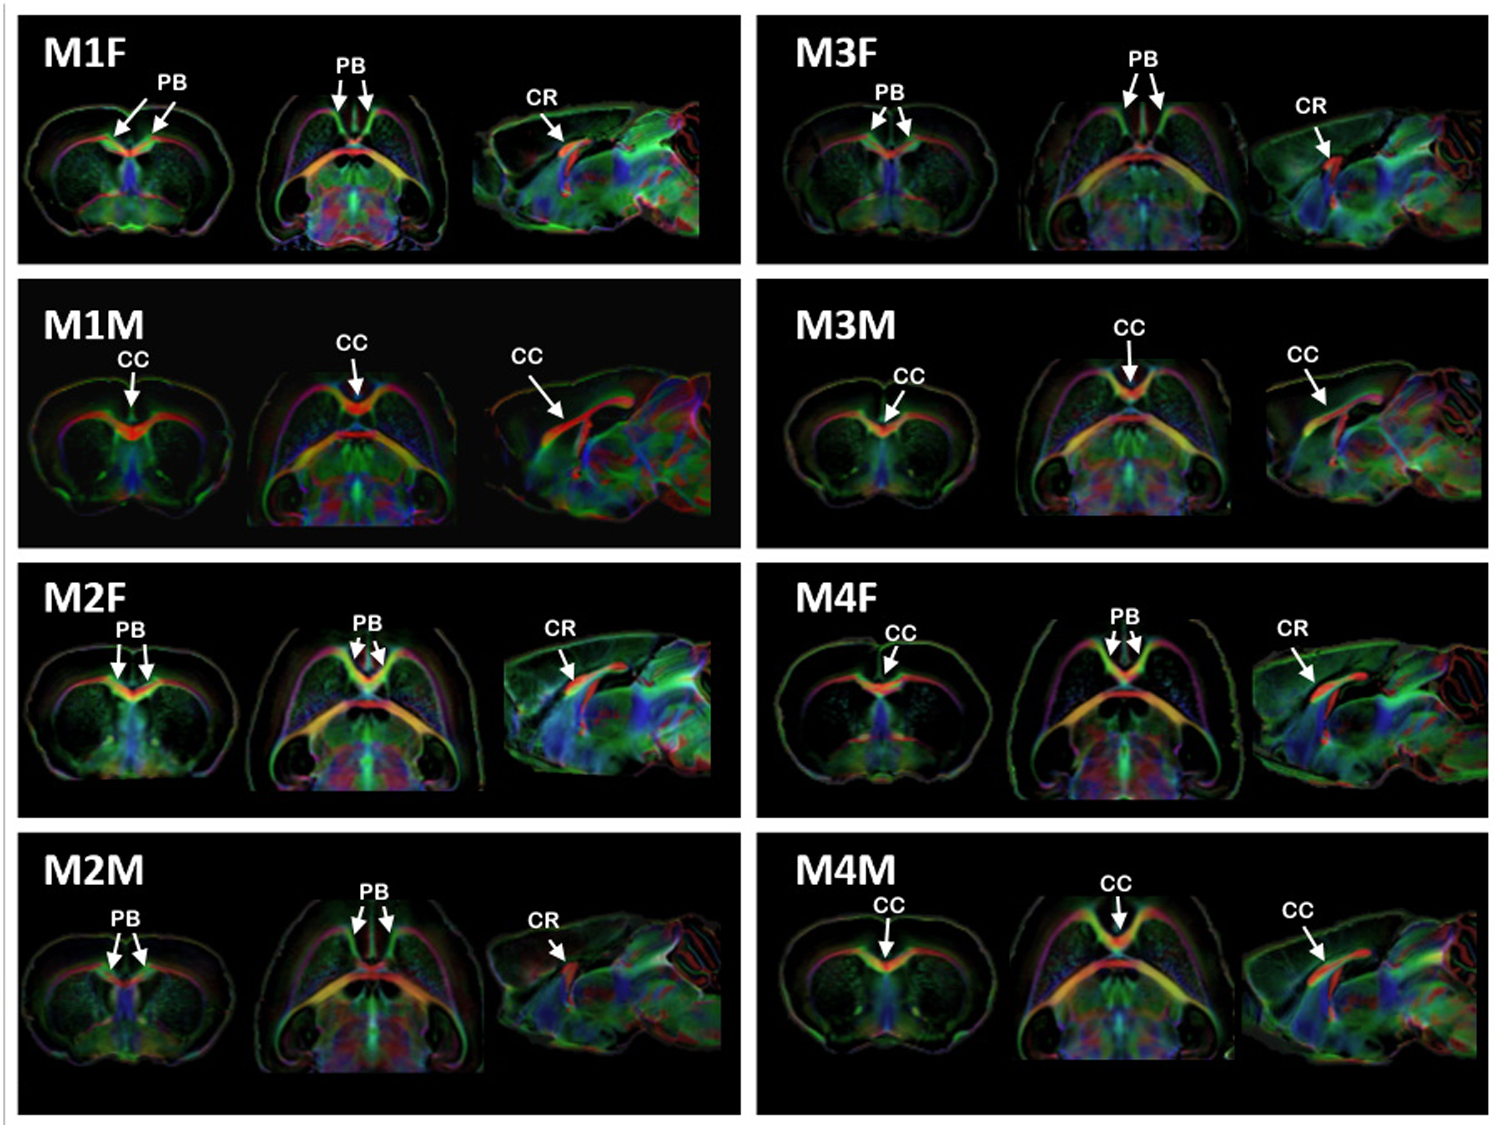
FOD maps in all three different anatomical planes (coronal, axial and sagittal) showing the anatomy of 8 Balb/c mice (4 males, 4 females) depicting the size of the corpus callosum, if present. Coronal and axial planes were taken at the level of the crossing of the most anterior part of the callosal fibers. PB: Probst bundle, CC: corpus callosum and CR: callosal remnant.
Figure 4. Global interhemispheric connectivity in Balb/c animals.
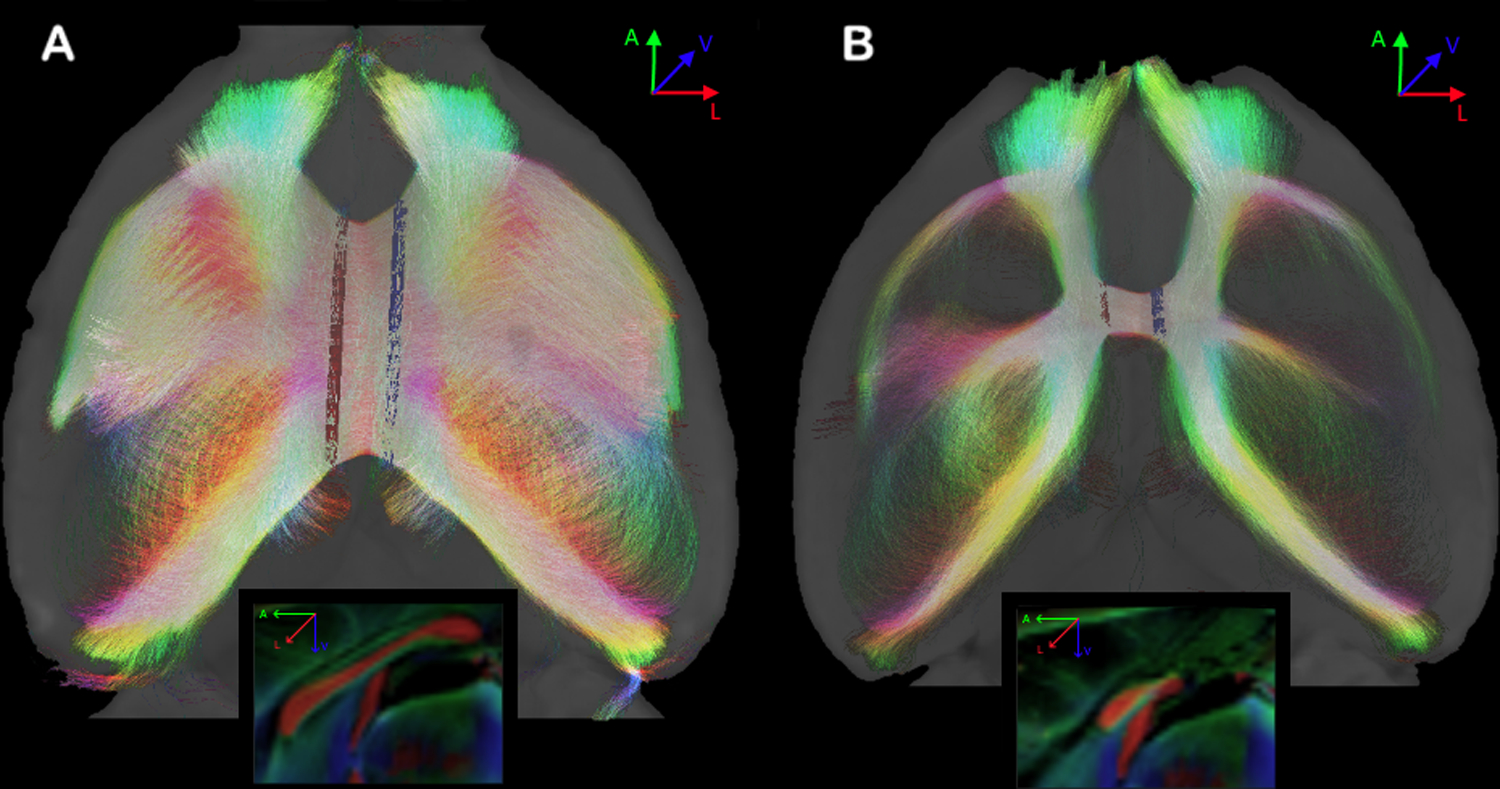
A. An animal with normal callosal morphology and normotypical callosal network. B. An animal with CCD and a pronounced decrease of interhemispheric connectivity through the CC. Sagittal views in the boxes. ROIs are shown in red and blue.
We also found that the interhemispheric frontal regions are connected in all animals with CCD, regardless of the severity of CC malformation. The frontals regions connect via the most rostral fibers that can cross the midline. Figure 5A shows an example of a Balb/c mouse with a full-sized CC. In that animal, the frontal regions connect via the genu of the CC (arrow). Figure 5B shows a mouse with severe alterations of the CC. In this animal, the interhemispheric fibers connecting the frontal regions cross the midline almost at the level of the HC (arrow).
Figure 5. Probabilistic reconstruction of fibers connecting both frontal lobes.
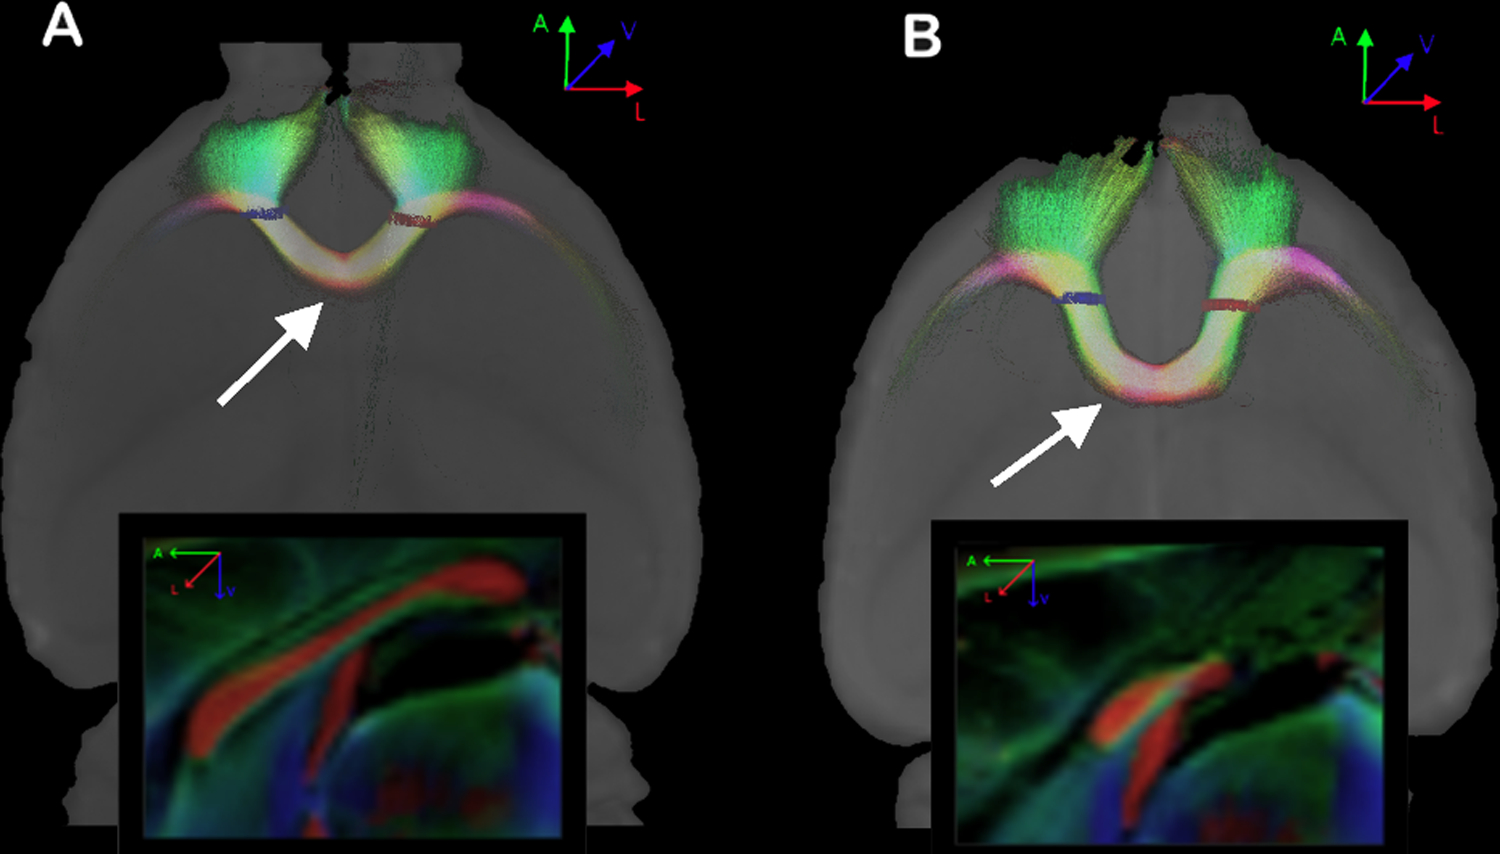
In A, a Balb/c with a normal corpus callosum. In B, another Balb/c with alterations of the corpus callosum. Note the level where the frontal fibers cross the midline in both animals (arrows), and the difference between both CCs shown in the sagittal views (boxes). ROIs are shown in red and blue.
When ROIs were placed in the frontal cortex and the contralateral posterior cortex, another anomalous interhemispheric connectivity with a sigmoid shape was found in 7/8 mice (Figure 6; see also Supplementary Figure 3). This heterotopic, anomalous bundle suggests a structural connection between the frontal cortex and the posterior contralateral cortex, resembling the Sigmoid bundle, which has so far only been described in humans with CCD (Jakab et al., 2015b; Paul et al., 2007; Tovar-Moll et al., 2007). Moreover, as described in humans with CCD (Lazarev et al., 2016), the Sigmoid heterotopic bundles were bilateral (Supplementary Figure 3). We have also compared the correlation between CC size and number of streamlines of the combined bilateral Sigmoid and Probst bundles (Supplementary Figure 4), the strong anticorrelation (r = −0.85) suggests that callosal fibers constitute the abnormal bundles.
Figure 6. Representative images of two Balb/c animals with Sigmoid bundles.
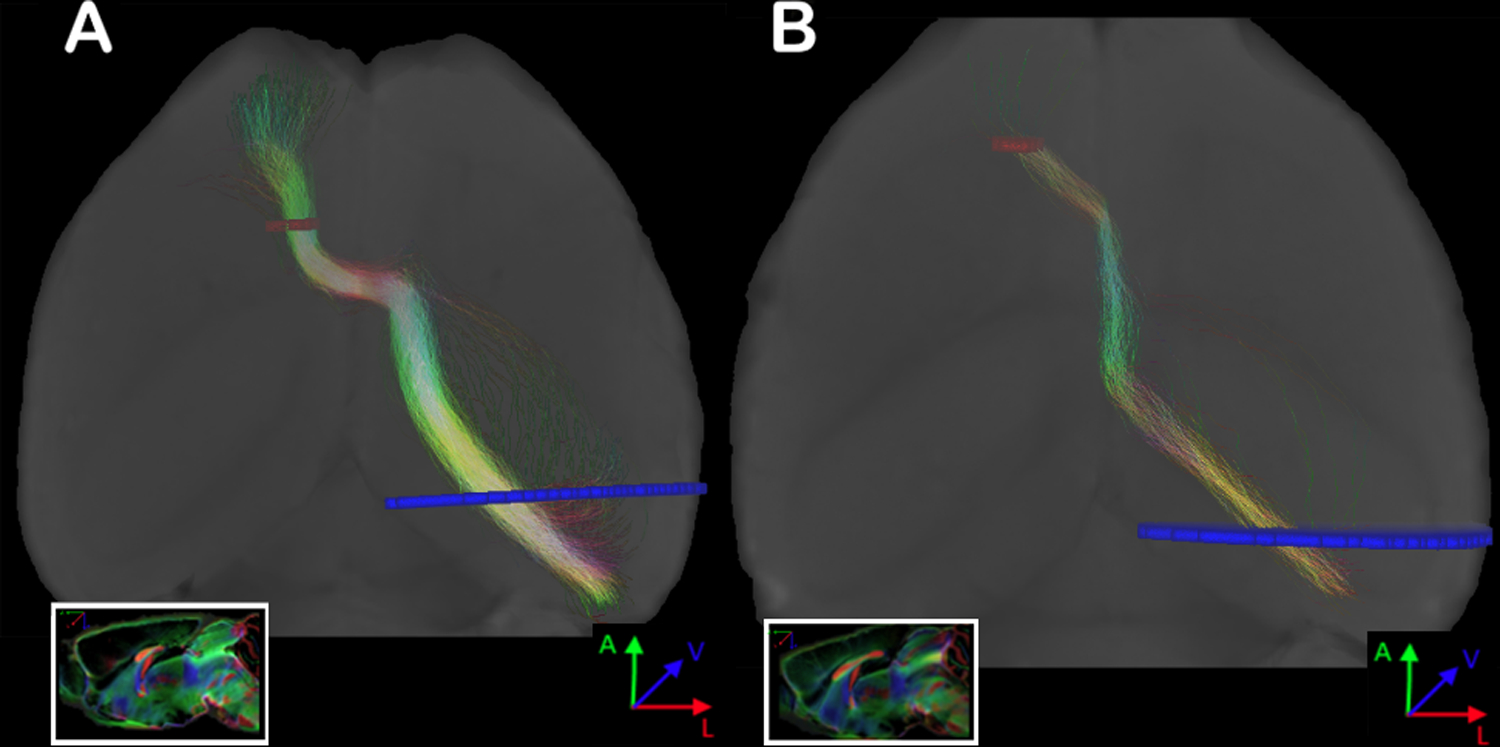
Probabilistic tractography (A and B, colors are direction encoded), connecting the frontal cortex with the contralateral posterior cortex in the same animal. ROIs were placed in the frontal pole adjacent to the white matter, and a comprehensive ROI was placed in the contralateral hemisphere at the level of the mid hippocampus. Sagittal view in the box. More complete data on these animals with Sigmoid bundles can be found in Supplementary Figure 5. ROIs are shown in red and blue.
3.3. Axonal tracing
To confirm the tractography findings, we used axonal tracer injections, a gold-standard method for white matter connectivity. The coordinates of each injection were chosen to be at the origin of the Sigmoid bundle (Figure 7A–C). The Balb/c strain showed a heterotopic bundle originating in the anterior cingulate cortex (injection site). It travels in an anteroposterior direction and splits into two bundles, one crossing the midline and another continuing its pathway in the same hemisphere (Figure 7C–E).
Figure 7. Sigmoid fibers in both strains.
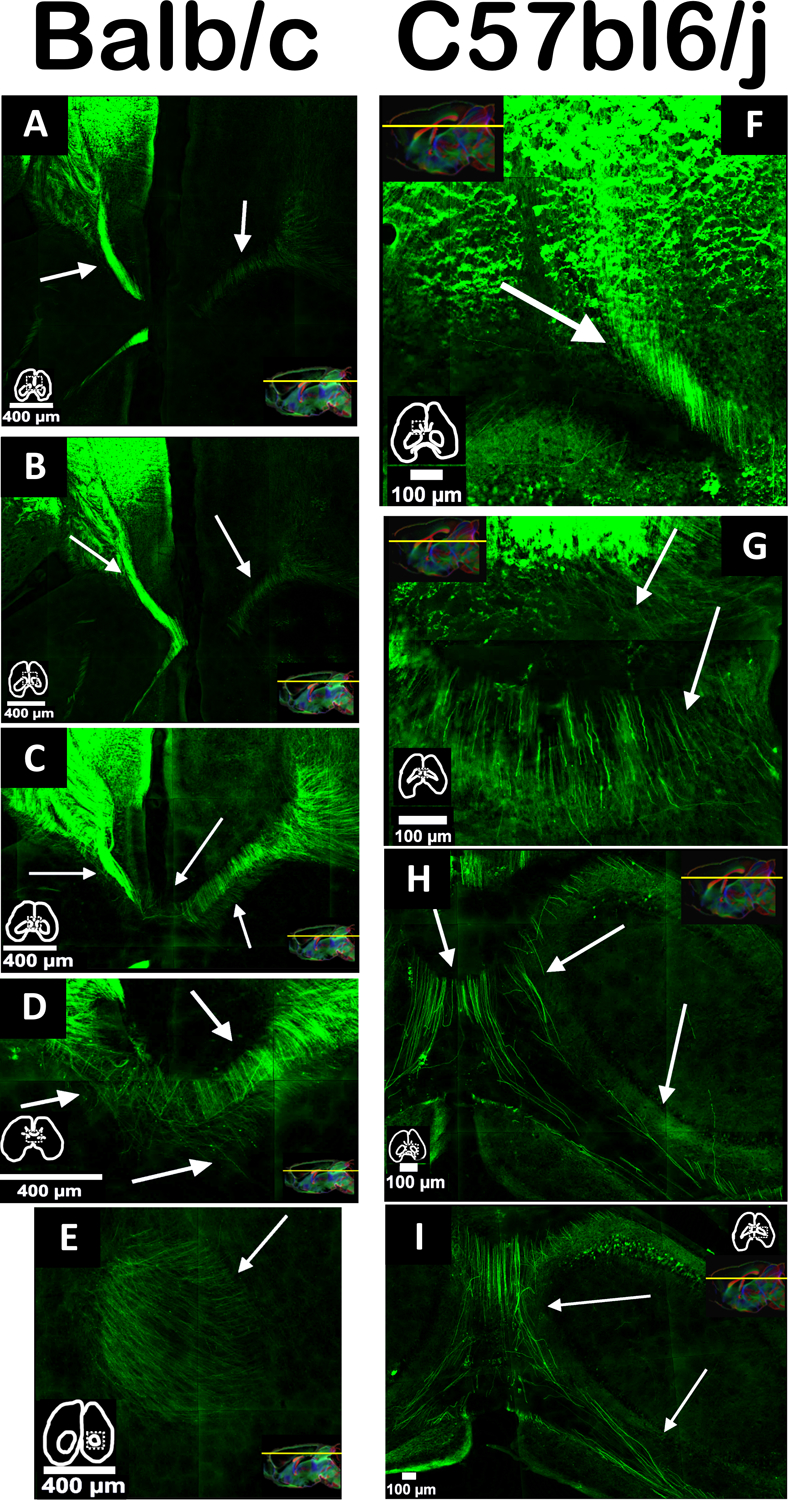
In green, we can see the fibers leaving the frontal pole and projecting posteriorly. Some of them will remain in the same hemisphere, and others will cross the midline in the direction of the hippocampus. Arrows point to the fibers, miniatures show the contours of the slice, and sagittal MRI images are from different animals in order to show the dorsal level of the sectioning in each slice.
To better characterize this apparently abnormal bundle in Balb/c mice, we injected a tracer into a homologous region in C57bl6/J mice (Figure 7F–I). Interestingly, we observed some sigmoid-shaped fibers which are topographically equivalent to those observed in Balb/c, but much less robust. The results suggest that, although these Sigmoid bundles represent aberrant connectivity, there might be a regular set of fibers with a sigmoidal pattern that, in the case of CCD, can serve as a pathway for misguided axons that will form the Sigmoid bundle.
3.4. Connectome
To better understand the whole-brain connectivity of Balb/c animals and compare them with C57bl6/J mice, we used a connectome approach (Liu et al., 2016) calculating the difference in the binary base matrix that provide us the new connections (see Methods). As detailed in Figure 8 A, the Balb/c strain has a higher number of connections (C), the vast majority of them intrahemispheric (D), and only a few interhemispheric (E). As expected, the Balb/c exhibits a shift from interhemispheric to intrahemispheric connections (F). In Figure 8B, the same matrices weighted by connectivity strength demonstrate the same pattern as the binary matrices (G through J), meaning that this phenomenon impacts not only the new connections but also the regular connections also are altered (in intensity) favoring this shift (J).
Figure 8. Base matrix connectome.
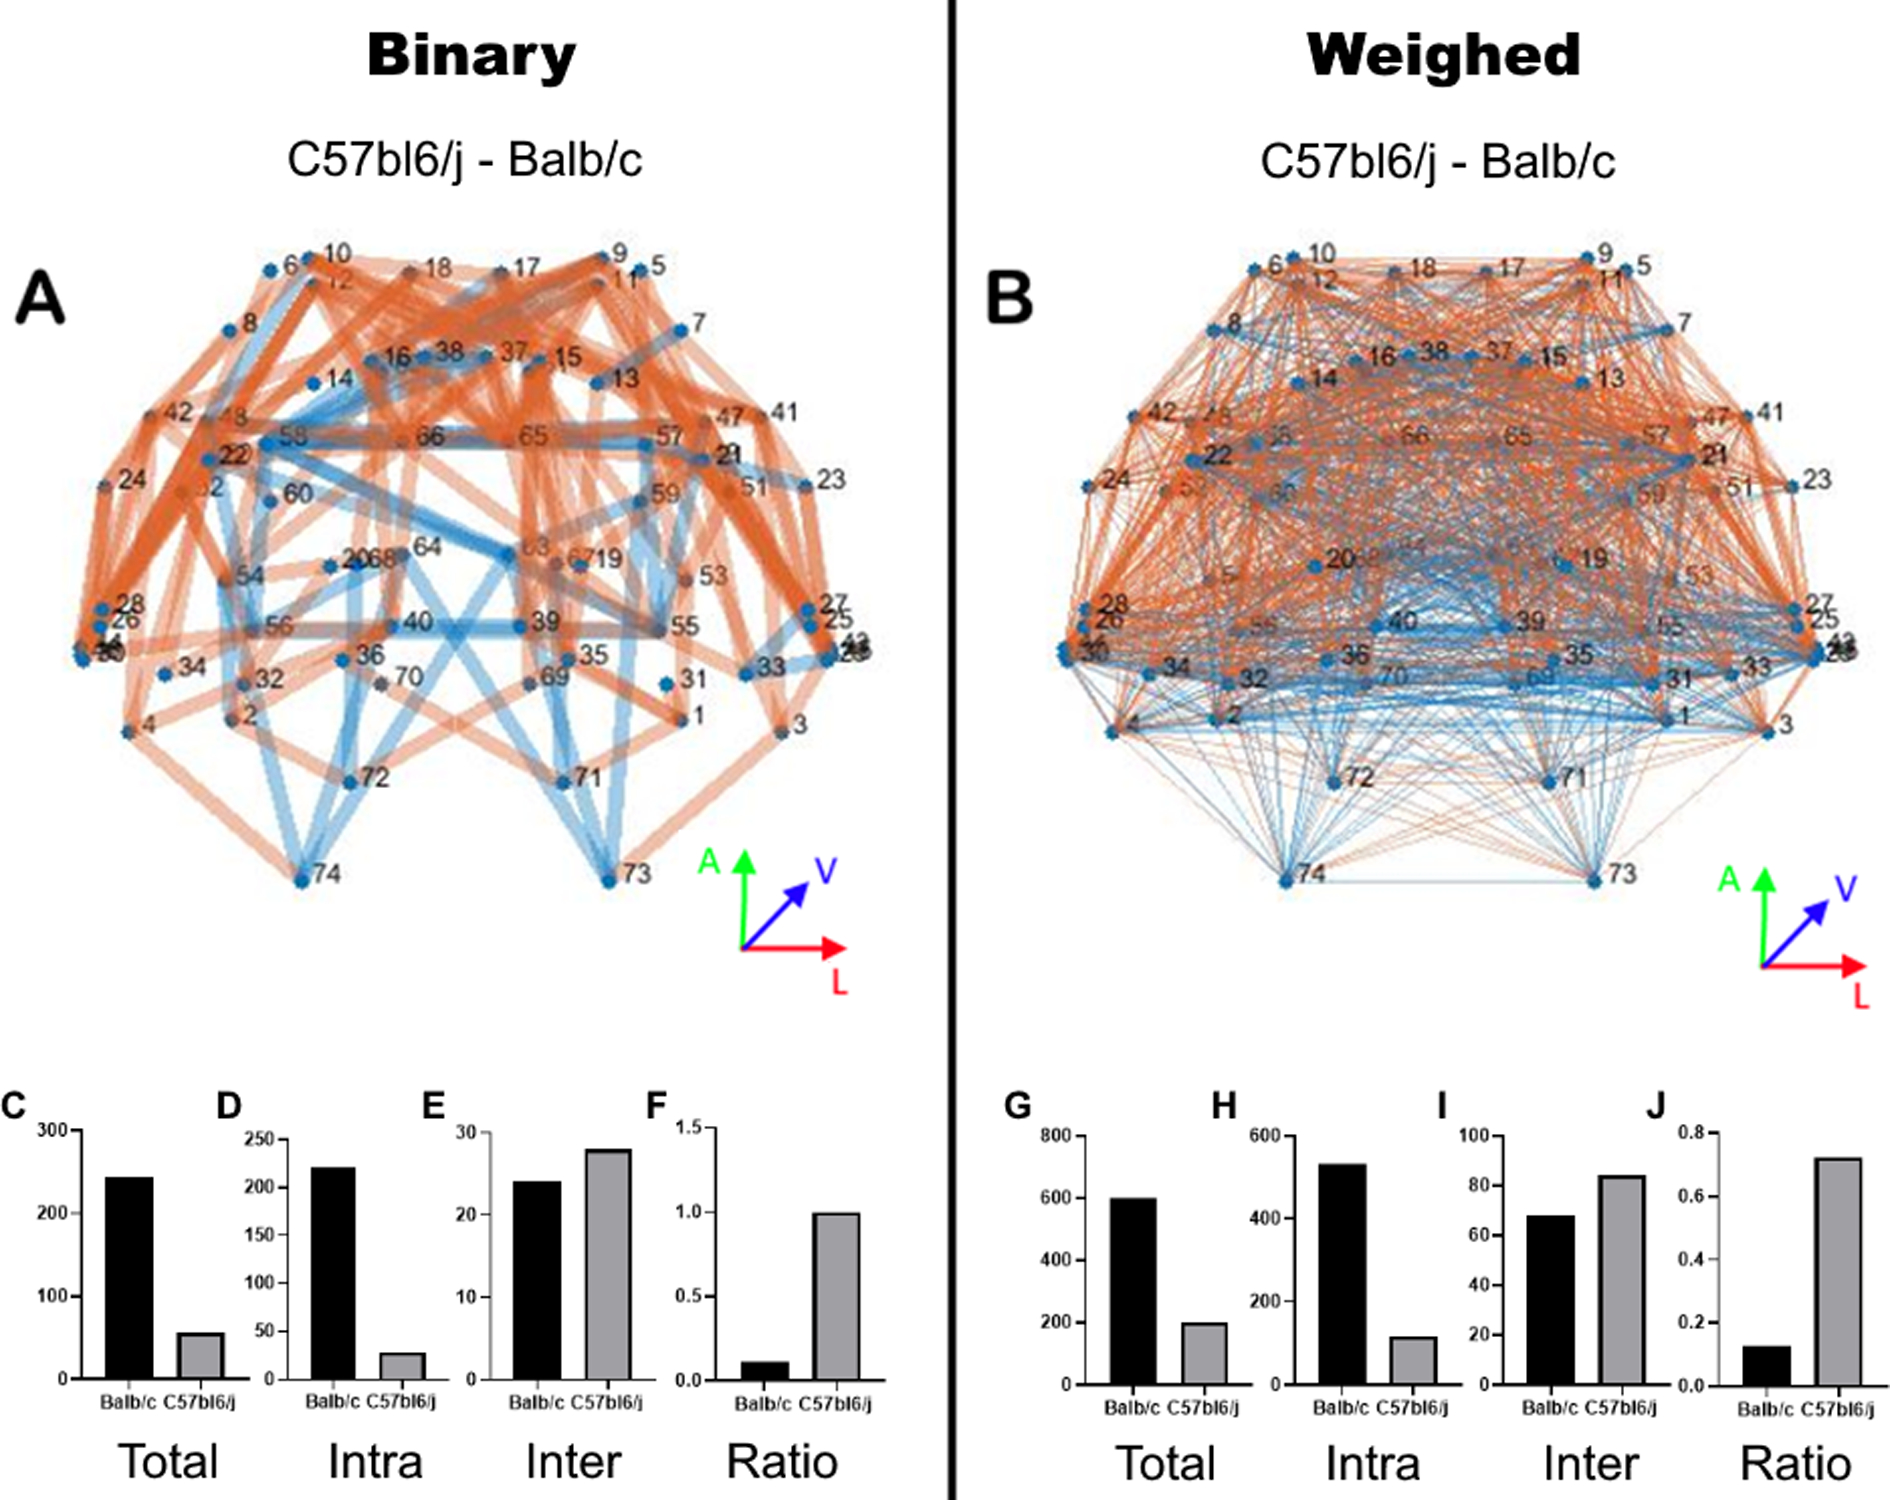
Graphic representation of the base matrix of the Balb/c subtracted from the C57bl6/J. The binary base matrix in A, weighted by the connection strength in B. The intensity is represented by line thickness. Positive values are in blue and negative values in orange. Both graphs respect the anatomical position of the nodes (axial view in the inserts), but edges do not necessarily represent the anatomical pathway. The total number of edges in binary (C) and weighed (G) matrices. Number of intrahemispherical edges in binary (D) and weighed (H) matrices. Number of interhemispheric edges in binary (E) and weighed (I) matrices. The ratio of interhemispherical edges by intrahemispherical edges in a binary (F) and weighed (J) matrices.
To better understand the contribution of each individual, we calculated the total number of edges (Figure 9A). We can see that the Balb/c strain has more edges than the C57bl6/j strain, indicating that there are more areas connected in the Balb/c strain, as a result of the CC-related plasticity. Interestingly, both the interhemispheric (Figure 9B) and intrahemispheric (Figure 9C) edges are increased in Balb/c mice in the same proportions (Figure 9D).
Figure 9. Network metrics.
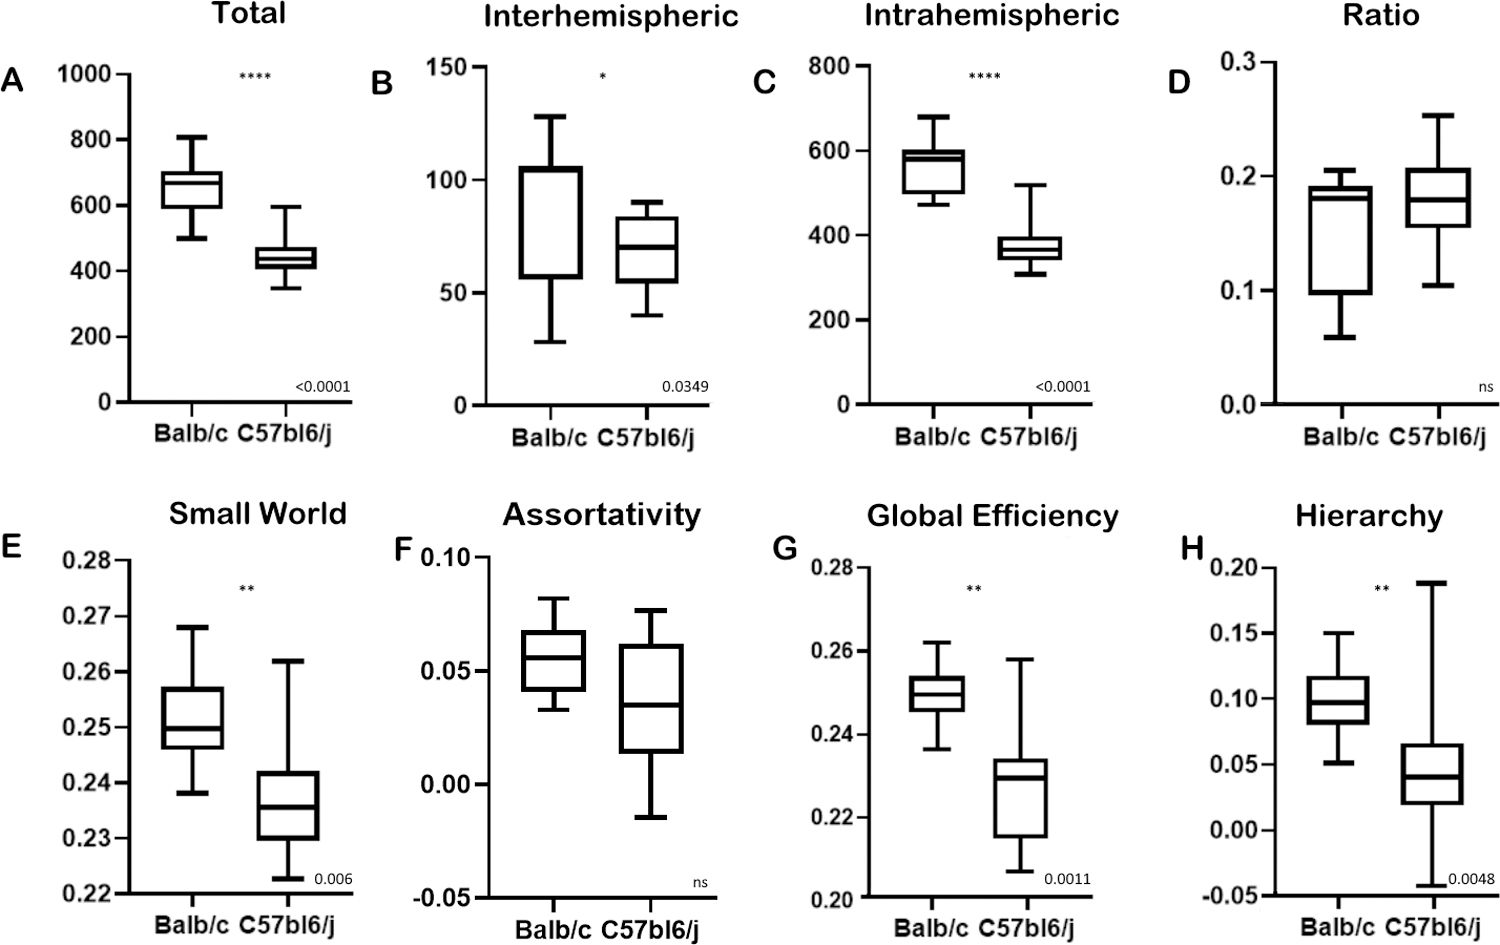
Statistic metrics derived from the binary matrices. Total number of edges (A), number of interhemispheric edges (B), number of intrahemispheric (C), the ratio of interhemispheric by intrahemispheric edges (D), coefficient of small worldness (E), Assortivity (F), Global network efficiency (G), Hierarchy (H). Error bars represent the extreme values, boxes represent the first and third quartile with the median represented by the central line. P values stated on the bottom right.
To assess the whole brain network, we calculated the network statistics. The results suggest that this aberrant and altered Balb/c network is highly complex, presenting a higher small-worldness coefficient, hierarchy, and global efficiency (Figure 9 E, G, and H). The latter showing not necessarily efficiency, but that multiple pathways connect different nodes, relating to the increased number of edges. This network also has the same assortativity, indicating that although there is a higher hierarchy, high-level nodes still link to other high-level nodes as the neurotypical C57bl6/j.
When data from the Balb/c strain are compared to the mean binary matrix of the C57bl6/J strain (see Methods), we observed that individual mice had a markedly different connectivity matrix (Figure 10), indicating a high connectivity variability, especially in the frontal regions of Balb/c mice.
Figure 10. Comparative connectomes.
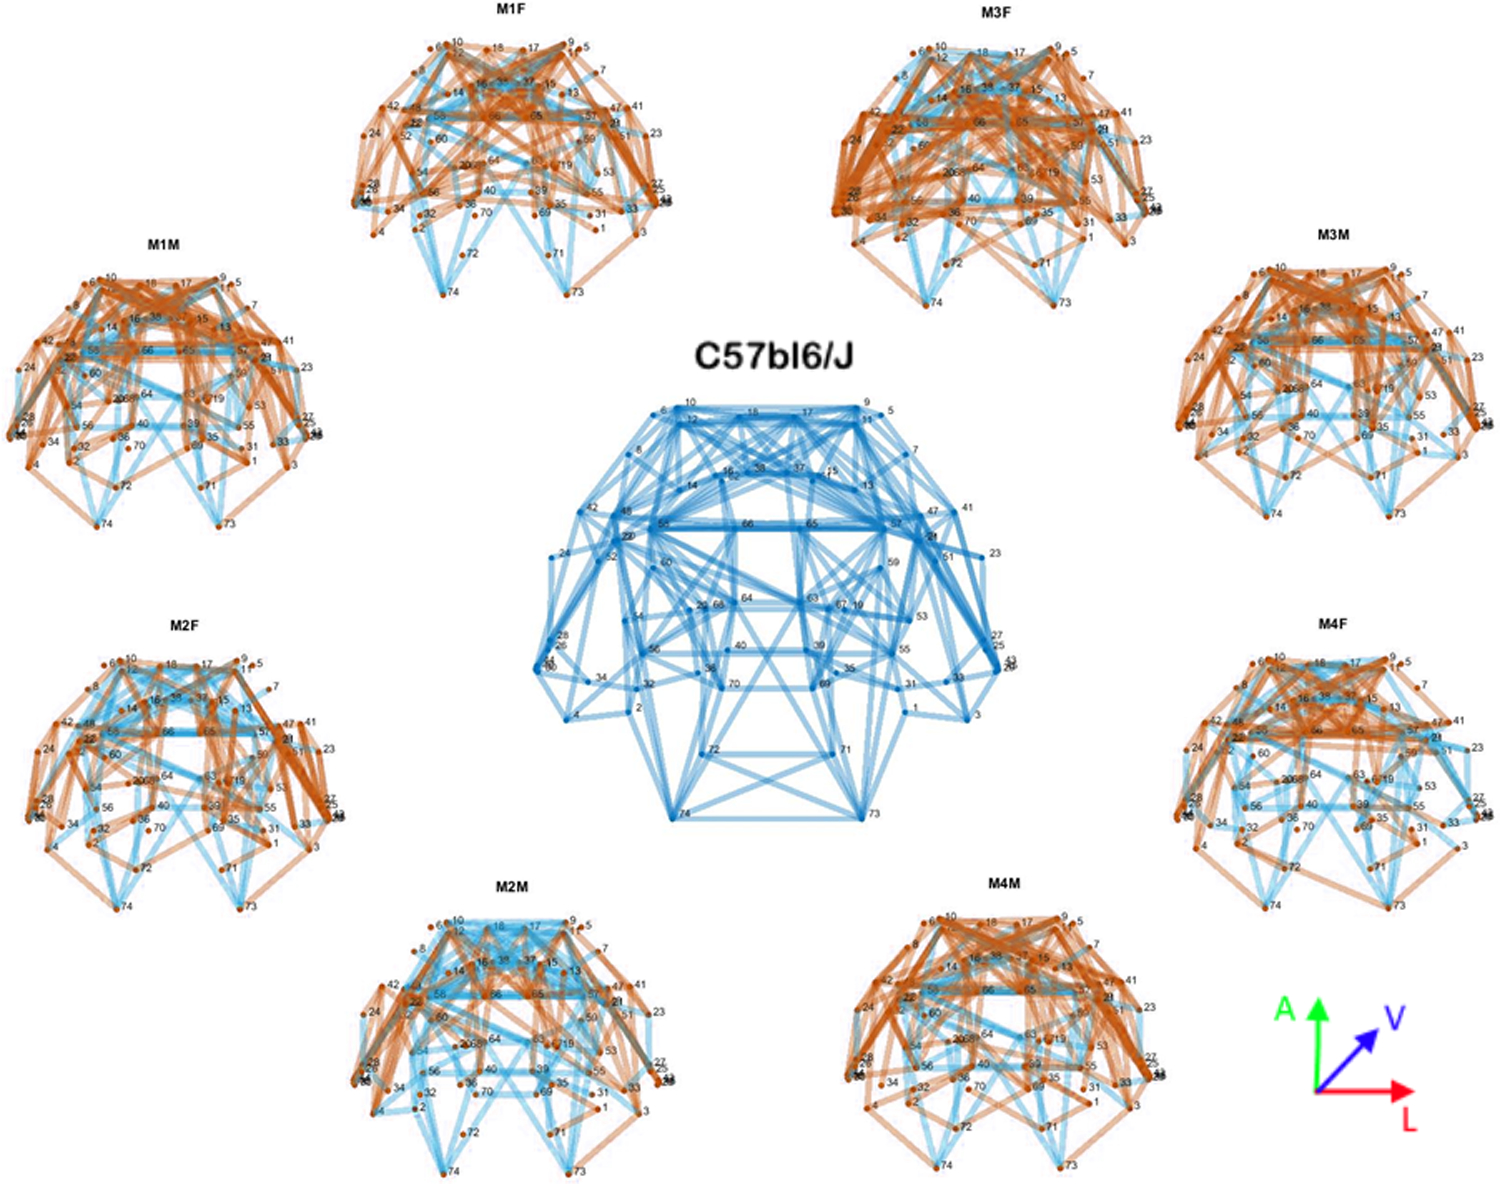
Graphic representation of the mean binary matrix connectomes. C57bl6/J (center) and each individual Balb/c (periphery). Connections only present in C57bl6/J are in blue, and connections only present in Balb/c are in orange. Common connections are not shown in the graph.
4. Discussion
We investigated the Balb/c strain to characterize long-distance plasticity patterns, as a model to explore the callosal abnormalities and more global changes in brain connectivity and to compare with changes described in humans with CCD. With high-resolution diffusion-weighted MRI, we demonstrated conspicuous, and highly variable, callosal morphology changes in the Balb/c strain, along with the presence of aberrant fiber systems, such as the Probst and Sigmoid bundles. These aberrations were true even in animals with a normal CC. Also, the connectome patterns of Balb/c mice were not only different from the normotypical strain C57bl6/J but also showed a high within-group variability. Viral tract-tracing experiments targeting the Sigmoid bundle on both strains confirmed the morphology of the Sigmoid bundle in the Balb/c animals. They also revealed that both strains display fibers that cross the midline in a sigmoid-like pattern, suggesting that these so-called abnormal bundles might have a common developmental origin, which may sometimes manifest as more subtle instances of anatomical variants in normotypical animals.
4.1. Aberrant Bundles
We found several aberrant bundles in the Balb/c strain that were originally characterized in humans. The classical longitudinal bundles of Probst have long been described (Probst, 1901), and their existence has also been established in animal models (Olavarria et al., 1988; Ozaki et al., 1987a; Ozaki and Wahlsten, 1993; Ren et al., 2007; Sforazzini et al., 2016; Stephenson et al., 2011). Such bundles have been interpreted as deviant fibers of the corpus callosum that, unable to find their appropriate guiding cues to cross the midplane, develop interhemispherically and form rostrocaudal longitudinal fascicles in both hemispheres. These bundles have been reported both in humans and in Balb/c mice with CCD, as well as in other animal models such as many knockout strains, the BTBR and ddN strains (Ozaki et al., 1987; Ren et al., 2007; Tovar-Moll et al., 2007; Paul et al., 2007; Fenlon et al., 2015).
We also clearly observed the Sigmoid bundle in Balb/c, a heterotopic tract that had only been previously identified in human CCD (Jakab et al., 2015b; Paul et al., 2007; Tovar-Moll et al., 2007, 2014). Here, the most likely hypothesis is that the Sigmoid bundle is a hypertrophied, heterotopic interhemispheric pathway derived from callosal fibers that take an aberrant course and become enlarged when the corpus callosum proper is just a small remnant. This hypothesis is tenable also because the Sigmoid bundle was found not to be exclusive of CCD animals, since the C57bl6/J strain also displayed these fibers, although less robustly. The reasons why the Sigmoid bundle remained undetected in previous studies is likely to be that (1) they were overshadowed by the CC signal in previous tractography studies; and (2) it is hard to visualize these fibers histologically in coronal sections - the most common choice by histologists if the anatomist is not looking for them because they course in anteroposterior direction.
We observed two main phenotypes of the Sigmoid bundle, one that resembles the classic human presentation (Tovar-Moll et al., 2007) (Figure 6) and another that crosses the midline, runs in the anteroposterior direction parallel to the midline until it dives into the hippocampus (Figure 7) in a trajectory (after crossing) similar to the human dorsal fornix (Pavlovic et al., 2009). Both presentations of the Sigmoid bundle were found bilaterally, which is supported by previous work in humans that describe this bundle as a bilateral crossing with dMRI and EEG coherence recording (Lazarev et al., 2016).
In humans, the dorsal fornix is altered in different patients and in close anatomic relationship to the CC (Arrigoni et al., 2016; Contarino et al., 2014). These findings suggest that the dorsal fornix could act as a pathway for misguided callosal axons in CCD.
We corroborated our histological findings on the C57bl6/J mice by analyzing the Allen connectivity atlas (Oh et al., 2014). We found that injections both on the anterior lobe and on the hippocampus depict heterotopic bundles adjacent to the CC similar to what we found in the Balb/c and C57bl6/J strain (Supplementary Figure 5).
Our results relate to two previous studies. One (Ozaki et al., 1987b) was performed in ddN acallosal mice and showed aberrant axons crossing the HC, but terminating in different portions of the neocortex. The other study was done in Balb/c and also found an abnormal pathway of crossed fibers from different regions of the neocortex projecting to the contralateral prefrontal cortex through the HC (Olavarria et al., 1988). These two studies detected heterotopic connections between the frontal pole of the cortex and the opposite hemisphere in different strains, confirming our suggestion that heterotopic connections from the frontal pole might be more common than usually thought in the literature.
4.2. Preserved connectivity
A robust finding in our partial CCD cases was the misplaced (but homotopic) frontal fibers crossing through the callosal remnant (Figure 5). This connectivity was preserved in all animals, suggesting that frontal fibers may grow across the midline following guidance cues different from the ones that give origin to the genu of the CC. Interestingly, the frontal connection exists even when the genu of the CC is absent. Human individuals with this condition also present a preserved connectivity between the two prefrontal cortices (Tovar-Moll et al. 2007).
An interesting possible implication of LDP in frontofrontal homotopic crossed connectivity is that, because of the increased distance traveled by the stimulus, instead of crossing the midline on the level of the genu of the CC, they do it much more caudally at the level of the callosal remnant. As a result, both regions might be out of synchrony, which could explain the poor performance of Balb/c mice in social interaction (Brodkin, 2007).
4.3. Global connectivity
For global connectivity we focused on two approaches: the first (Figure 8) showed that the pathways that were common to every animal of the Balb/c strain brain (as stated by the base matrix) presents different connections as compared with the C57bl6/J, revealing a shift from interhemispheric connectivity to intrahemispheric connectivity that correlates with humans structural studies (Jakab et al., 2015b; Owen et al., 2013) and is also corroborated by functional and electrophysiological studies (Owen et al., 2013; Lazarev et al., 2016). This result from the base matrix (Figure 8) shows us that all the animals have increased intrahemispheric connectivity compared to the interhemispheric (F and J), meaning that among all Balb/c animals, they have the same pathways in the intrahemispheric portion increased. When we calculate the total number of interhemispheric connections in every animal (Figure 9 B), we see that they are also increased, but not equally in all animals (relating to the wide variety of CC phenotypes). Therefore, we are able to see common intrahemispheric pathways and distinct compensatory interhemispheric pathways.
The second approach compared every Balb/c of the second cohort (N = 8) with the mean connectivity of the C57bl6/J strain (N = 27), showing that the Balb/c strain has a high variability of its global connectivity, therefore suggesting that the mechanism is regionally regulated and reflects changes in whole-brain connectivity beyond callosal wiring. Interestingly, although the frontal connectivity seems to be generally preserved in the Balb/c strain, despite the callosal abnormalities, its connectivity pathway was highly variable. As shown in Figure 10, one can note that the most variable region is the frontal pole.
It is well known in the Balb/c strain that the developing hemispheres tend to fuse at the midplane later than normal (Livy and Wahlsten, 1997), and also that the development of the CC is anteroposterior (Rash and Richards, 2001). This substantiates our findings since this late fusion could disrupt the development of the CC in a time-dependent way, generating the high degree of variability we observed.
4.4. Guidance mechanisms
Although the mechanisms for LDP of callosal fibers are largely unknown, the histology and dMRI data allow us to hypothesize about how these aberrant white matter patterns emerge. Callosal pioneer axons in CCD animals are unable to cross the midline, resulting in their misdirection either following other cues nearby or simply fasciculating onto previously formed axonal pathways. This could be the case of the Probst and Sigmoid bundles, and of the misplaced frontal fibers, which could follow the cingulate bundle on both sides of the caudal aspect of the dorsal fornix, and cross the midline when a bridge is reached. Probably the misplaced frontal fibers and the Sigmoid bundle are formed in different time windows, hence the different destinations of the bundles.
It is believed that a genetic component determines the CC phenotype in the Balb/c strain, although the exact gene(s) related to this phenomenon are still unknown (Wahlsten, 1974). In this strain, it is speculated that the corpus callosum exhibits two different bridges for its formation, the callosal pioneers and the HC (Livy and Wahlsten, 1997). A possible failure of the callosal pioneers to cross the midline and subsequent fasciculation by the followers could be responsible for the aberrant connectivity observed in these animals.
5. Conclusions
Our study shows that the Balb/c strain displays a wide range of callosal dysgenesis, either towards a complete absence of the CC or towards hypertrophy of its sagittal area. Diffusion-weighted MRI showed that some of the aberrant connections in Balb/c are similar to those seen in humans with CCD. These results show that the Balb/c strain seems to be an appropriate translational animal model to study CCD and LDP. Future investigation of this animal model may improve the understanding of the genetic, molecular, and morphological mechanisms underlying aberrant white-matter tract formation on CCD.
We demonstrated that normotypical animals (C57bl6/J) also display sigmoid-like fibers. Such evidence suggests that, although the Sigmoid bundle is known as an abnormal bundle, both pathways might have a common developmental origin and may provide an alternative and enlarged route for misguided axons, as observed in CCD.
Our findings open a new window for research in animal models, as well in humans, offering new insights for investigating and interpreting LDP and changes in brain connectivity in CCD and other developmental disorders through development to aging.
Supplementary Material
6. Acknowledgments
This work is part of the Ph.D. thesis of D.S. and was supported by Research Support Foundation of the State of Rio de Janeiro (FAPERJ), National Council for Scientific and Technological Development (CNPq), as well as by intramural grants from D’Or Institute for Research and Education (IDOR). This research was supported (in part) by the Intramural Research Program of the NIH, NINDS. LJR is supported by an Australian National Health and Medical Research Council (NHMRC) Principal Research Fellowship GNT1120615. We are thankful to Lisa Zhang for technical support, Ted Usdin and Jonathan Kuo for their microscopy expertise, and Jorge Moll for proofreading earlier versions of this manuscript. We are equally thankful to Tim Edwards and Ryan Dean for useful discussions. We thank the members and affiliates of the International Research Consortium for the Corpus Callosum and Cerebral Connectivity (IRC5,https://www.irc5.org) for discussions and input.
Footnotes
The authors have no competing interests.
7. References
- Andersson JLR, Sotiropoulos SN, 2016. An integrated approach to correction for off-resonance effects and subject movement in diffusion MR imaging. NeuroImage 125, 1063–1078. 10.1016/j.neuroimage.2015.10.019 [DOI] [PMC free article] [PubMed] [Google Scholar]
- Arrigoni F, Romaniello R, Peruzzo D, Righini A, Parazzini C, Colombo P, Bassi MT, Triulzi F, Borgatti R, 2016. Aberrant supracallosal longitudinal bundle: MR features, pathogenesis and associated clinical phenotype. European Radiology 26, 2587–2596. 10.1007/s00330-015-4084-6 [DOI] [PubMed] [Google Scholar]
- Avants BB, Tustison NJ, Song G, Cook PA, Klein A, Gee JC, 2011. A reproducible evaluation of ANTs similarity metric performance in brain image registration. NeuroImage 54, 2033–2044. 10.1016/j.neuroimage.2010.09.025 [DOI] [PMC free article] [PubMed] [Google Scholar]
- Bishop KM, Kruyer A, Wahlsten D, 1996. Agenesis of the corpus callosum and voluntary wheel running in mice. Psychobiology 24, 187–194. [Google Scholar]
- Brodkin E, 2007. Balb/c mice: Low sociability and other phenotypes that may be relevant to autism. Behavioural Brain Research 176, 53–65. 10.1016/j.bbr.2006.06.025 [DOI] [PubMed] [Google Scholar]
- Contarino VE, Bulgheroni S, Savoiardo M, Annunziata S, Aquino D, Riva D, Erbetta A, 2014. Constrained spherical deconvolution-based tractography to depict and characterize a case of “hyperplastic fornix dorsalis.” Magnetic Resonance Imaging 32, 1428–1433. 10.1016/j.mri.2014.07.007 [DOI] [PubMed] [Google Scholar]
- Chen XJ, Kovacevic N, Lobaugh NJ, Sled JG, Henkelman RM, Henderson JT. Neuroanatomical differences between mouse strains as shown by high-resolution 3D MRI. Neuroimage. 2006. 1st January;29(1):99–105. [DOI] [PubMed] [Google Scholar]
- Edwards TJ, Sherr EH, Barkovich AJ, Richards LJ, 2014. Clinical, genetic and imaging findings identify new causes for corpus callosum development syndromes. Brain 137, 1579–1613. 10.1093/brain/awt358 [DOI] [PMC free article] [PubMed] [Google Scholar]
- Fenlon LR, Liu S, Gobius I, Kurniawan ND, Murphy S, Moldrich RX, Richards LJ, 2015. Formation of functional areas in the cerebral cortex is disrupted in a mouse model of autism spectrum disorder. Neural Dev 10, 10 10.1186/s13064-015-0033-y [DOI] [PMC free article] [PubMed] [Google Scholar]
- Gipson CD, Olive MF, 2016. Structural and functional plasticity of dendritic spines - root or result of behavior?: Dendritic spine plasticity and behavior. Genes, Brain and Behavior. 10.1111/gbb.12324 [DOI] [PMC free article] [PubMed]
- Gogolla N, Galimberti I, Caroni P, 2007. Structural plasticity of axon terminals in the adult. Current Opinion in Neurobiology 17, 516–524. 10.1016/j.conb.2007.09.002 [DOI] [PubMed] [Google Scholar]
- Gross KS, Brandner DD, Martinez LA, Olive MF, Meisel RL, Mermelstein PG, 2016. Opposite Effects of mGluR1a and mGluR5 Activation on Nucleus Accumbens Medium Spiny Neuron Dendritic Spine Density. PLOS ONE 11, e0162755 10.1371/journal.pone.0162755 [DOI] [PMC free article] [PubMed] [Google Scholar]
- Jakab A, Kasprian G, Schwartz E, Gruber GM, Mitter C, Prayer D, Schöpf V, Langs G, 2015a. Disrupted developmental organization of the structural connectome in fetuses with corpus callosum agenesis. NeuroImage 111, 277–288. 10.1016/j.neuroimage.2015.02.038 [DOI] [PubMed] [Google Scholar]
- Jeurissen B, Tournier J-D, Dhollander T, Connelly A, Sijbers J, 2014. Multi-tissue constrained spherical deconvolution for improved analysis of multi-shell diffusion MRI data. NeuroImage 103, 411–426. 10.1016/j.neuroimage.2014.07.061 [DOI] [PubMed] [Google Scholar]
- Lazarev VV, de Carvalho Monteiro M, Vianna-Barbosa R, deAzevedo LC, Lent R, Tovar-Moll F, 2016. Electrophysiological Correlates of Morphological Neuroplasticity in Human Callosal Dysgenesis. PLOS ONE 11, e0152668 10.1371/journal.pone.0152668 [DOI] [PMC free article] [PubMed] [Google Scholar]
- Liu C, Li Y, Edwards TJ, Kurniawan ND, Richards LJ, Jiang T, 2016. Altered structural connectome in adolescent socially isolated mice. NeuroImage 139, 259–270. 10.1016/j.neuroimage.2016.06.037 [DOI] [PubMed] [Google Scholar]
- Livy DJ, Wahlsten D, 1997. Retarded formation of the hippocampal commissure in embryos from mouse strains lacking a corpus callosum. Hippocampus 7, 2–14. [DOI] [PubMed] [Google Scholar]
- Livy DJ, Wahlsten D, 1997. Retarded formation of the hippocampal commissure in embryos from mouse strains lacking a corpus callosum. Hippocampus 7, 2–14. [DOI] [PubMed] [Google Scholar]
- Oh SW, Harris JA, Ng L, Winslow B, Cain N, Mihalas S, Wang Q, Lau C, Kuan L, Henry AM, Mortrud MT, Ouellette B, Nguyen TN, Sorensen SA, Slaughterbeck CR, Wakeman W, Li Y, Feng D, Ho A, Nicholas E, Hirokawa KE, Bohn P, Joines KM, Peng H, Hawrylycz MJ, Phillips JW, Hohmann JG, Wohnoutka P, Gerfen CR, Koch C, Bernard A, Dang C, Jones AR, Zeng H, 2014. A mesoscale connectome of the mouse brain. Nature 508, 207–214. 10.1038/nature13186 [DOI] [PMC free article] [PubMed] [Google Scholar]
- Olavarria J, Serra-Oller MM, Yee KT, van Sluyters RC, 1988. Topography of interhemispheric connections in neocortex of mice with congenital deficiencies of the callosal commissure. Journal of Comparative Neurology 270, 575–590. [DOI] [PubMed] [Google Scholar]
- Owen JP, Li Y-O, Ziv E, Strominger Z, Gold J, Bukhpun P, Wakahiro M, Friedman EJ, Sherr EH, Mukherjee P, 2013. The structural connectome of the human brain in agenesis of the corpus callosum. NeuroImage 70, 340–355. 10.1016/j.neuroimage.2012.12.031 [DOI] [PMC free article] [PubMed] [Google Scholar]
- Ozaki HS, Murakami HT, Shimada M, 1987a. The Fibers which Leave the Probst’s Longitudinal Bundle seen in the Brain of an Acallosal Mouse: a Study with the Horseradish Peroxidase Technique. Brain Res. 400, 239–246. [DOI] [PubMed] [Google Scholar]
- Ozaki HS, Murakami TH, Toyoshima T, Shimada M, 1987b. The fibers which leave the Probst’s longitudinal bundle seen in the brain of an acallosal mouse: a study with the horseradish peroxidase technique. Brain Research 400, 239–246. 10.1016/0006-8993(87)90623-8 [DOI] [PubMed] [Google Scholar]
- Ozaki HS, Wahlsten D, 1993. Cortical axon trajectories and growth cone morphologies in fetuses of acallosal mouse strains. Journal of Comparative Neurology 336, 595–604. [DOI] [PubMed] [Google Scholar]
- Paul LK, Brown WS, Adolphs R, Tyszka JM, Richards LJ, Mukherjee P, Sherr EH, 2007. Agenesis of the corpus callosum: genetic, developmental and functional aspects of connectivity. Nature Reviews Neuroscience 8, 287–299. 10.1038/nrn2107 [DOI] [PubMed] [Google Scholar]
- Pavlovic S, Stefanovic N, Malobabic S, Babic Z, Kostić A, Pavlovic M, 2009. Longitudinal striae of the human fornix: shape, relations and variations. Surgical and Radiologic Anatomy 31, 501–506. 10.1007/s00276-009-0471-5 [DOI] [PubMed] [Google Scholar]
- Probst M, 1901. Ueber den Bau des vollständig balkenlosen Gross-hirnes sowie über Mikrogyrie und Heterotopie der grauen Substanz. Archiv für Psychiatrie und Nervenkrankheiten 34, 709–786. [Google Scholar]
- Rash BG, Richards LJ, 2001. A role for cingulate pioneering axons in the development of the corpus callosum. The Journal of Comparative Neurology 434, 147–157. 10.1002/cne.1170 [DOI] [PubMed] [Google Scholar]
- Ren T, Zhang J, Plachez C, Mori S, Richards LJ, 2007. Diffusion Tensor Magnetic Resonance Imaging and Tract-Tracing Analysis of Probst Bundle Structure in Netrin1- and DCC-Deficient Mice. Journal of Neuroscience 27, 10345–10349. 10.1523/JNEUROSCI.2787-07.2007 [DOI] [PMC free article] [PubMed] [Google Scholar]
- Sforazzini F, Bertero A, Dodero L, David G, Galbusera A, Scattoni ML, Pasqualetti M, Gozzi A, 2016. Altered functional connectivity networks in acallosal and socially impaired BTBR mice. Brain Structure and Function 221, 941–954. 10.1007/s00429-014-0948-9 [DOI] [PubMed] [Google Scholar]
- Stephenson DT, O’Neill SM, Narayan S, Tiwari A, Arnold E, Samaroo HD, Du F, Ring RH, Campbell B, Pletcher M, others, 2011. Histopathologic characterization of the BTBR mouse model of autistic-like behavior reveals selective changes in neurodevelopmental proteins and adult hippocampal neurogenesis. Molecular autism 2, 1. [DOI] [PMC free article] [PubMed] [Google Scholar]
- Tournier J-D, Calamante F, Connelly A, 2007. Robust determination of the fibre orientation distribution in diffusion MRI: Non-negativity constrained super-resolved spherical deconvolution. NeuroImage 35, 1459–1472. 10.1016/j.neuroimage.2007.02.016 [DOI] [PubMed] [Google Scholar]
- Tovar-Moll F, Moll J, de Oliveira-Souza R, Bramati I, Andreiuolo PA, Lent R, 2007. Neuroplasticity in Human Callosal Dysgenesis: A Diffusion Tensor Imaging Study. Cerebral Cortex 17, 531–541. 10.1093/cercor/bhj178 [DOI] [PubMed] [Google Scholar]
- Tovar-Moll F, Monteiro M, Andrade J, Bramati IE, Vianna-Barbosa R, Marins T, Rodrigues E, Dantas N, Behrens TEJ, de Oliveira-Souza R, Moll J, Lent R, 2014. Structural and functional brain rewiring clarifies preserved interhemispheric transfer in humans born without the corpus callosum. Proceedings of the National Academy of Sciences 111, 7843–7848. 10.1073/pnas.1400806111 [DOI] [PMC free article] [PubMed] [Google Scholar]
- Ullmann JFP, Watson C, Janke AL, Kurniawan ND, Reutens DC, 2013. A segmentation protocol and MRI atlas of the C57BL/6J mouse neocortex. NeuroImage 78, 196–203. 10.1016/j.neuroimage.2013.04.008 [DOI] [PubMed] [Google Scholar]
- Veraart J, Novikov DS, Christiaens D, Ades-aron B, Sijbers J, Fieremans E, 2016. Denoising of diffusion MRI using random matrix theory. NeuroImage 142, 394–406. 10.1016/j.neuroimage.2016.08.016 [DOI] [PMC free article] [PubMed] [Google Scholar]
- Wahlsten D, 1974. Heritable aspects of anomalous myelinated fibre tracts in the forebrain of the laboratory mouse. Brain Research 68, 1–18. 10.1016/0006-8993(74)90530-7 [DOI] [PubMed] [Google Scholar]
Associated Data
This section collects any data citations, data availability statements, or supplementary materials included in this article.


