

Abstract
Background:
Restricting TAVR to centers based on volume thresholds alone can potentially create unintended disparities in healthcare access. We aimed to compare the influence of population density in state of Florida in regard to access to TAVR, TAVR-utilization rates, and in-hospital mortality.
Methods and Results:
From 2011–2016, we used data from the AHCA to calculate travel time and distance for each TAVR-patient by comparing their home address to their TAVR-facility ZIP-code. Travel time and distance, TAVR rates, and mortality were compared across categories of low to high population density (population per sq. mi of land). Of the 6,531 patients included, the mean (SD) age was 82 (9) years, 43% were female and 91% were Caucasian. Patients residing in the lowest category (<50/sq.mi) were younger, more likely to be men, and less likely to be a racial minority. Those residing in the lowest category density faced a longer unadjusted driving distances and times to their TAVR center (Mean extra-distance(miles) = 43.5 (95% CI 35.6–51.4); p<0.001; Mean extra-time(min) = 45.6 (95% CI 38.3–52.9), p<0.001). This association persisted regardless of the methods used to determine population density. Excluding uninhabitable land, there was a 7-fold difference in TAVR utilization rates in the lowest vs. highest population density regions (7 vs. 45 per 100,000, p-for-pairwise-comparisons<0.001) and increase in TAVR in-hospital mortality (adjusted OR 6.13, 95%CI 1.97–19.1, p< 0.001).
Conclusions:
Older patients living in rural counties in Florida face (1) significantly longer travel distances and times for TAVR, (2) lower TAVR utilization rates, and (3) higher adjusted TAVR mortality. These findings suggest that there are trade-offs between access to TAVR, its rate of utilization and procedural mortality, all of which are important considerations when defining institutional and operator requirements for TAVR across the country.
Keywords: transcatheter aortic valve repair, outcomes, accreditation, registry
INTRODUCTION
The relationship between volume and outcomes has long been a focus of surgical research, and recommendations derived from these findings are now appearing in expert consensus statements.1, 2 Support for the creation of “centers of excellence” and initiatives such as the “take the volume pledge”1 have been proposed in order to limit certain high-risk surgical procedures to centers and operators with a minimum threshold of case numbers. Similar recommendations have recently appeared in expert consensus statements on the institutional requirements for transcatheter aortic valve replacement (TAVR).3 These recommendations are based on studies demonstrating a modest but significant improvement in outcomes in high volume TAVR facilities as compared with low volume centers.4, 5
Prior work has described the consequences of restricting certain procedures to centers based on volume-outcome relationships and highlighted the creation of access disparities.2 These disparities are often exaggerated in regions with low-population densities or mixed racial and socioeconomic status, and can be further exaggerated in areas with higher concentrations of older individuals.6–9 In acknowledgement of these barriers, the Department of Health and Human Services has required individual states participating in managed care plans to set time and distance standards for specialty care services to ensure timely access for specialized healthcare services.6, 10 This requirement has been especially important in states like Florida, where uninsured and underinsured rates are high, and the costs of care are soaring.11, 12 While no standard metrics for access to TAVR procedures (e.g. time or distance) have been established, the recent TAVR consensus statement does recognize that some centers performing less than the annual minimum will need to be maintained in order to meet the needs of underserved populations.3
In light of these expert statements and the inherent challenges of delivering healthcare across states like Florida, the maintenance of optimal procedural outcomes without compromising healthcare access remains an active area of debate. This is an especially difficult issue for cardiovascular procedures like TAVR that require a high degree of technical expertise and a multidisciplinary team of healthcare professionals. To further explore these relationships, we examined (1) differences in both travel time and distance, (2) TAVR utilization rates and (3) in-hospital TAVR mortality rates across the broad spectrum of Florida county population densities from low to high (i.e. rural vs. urban).
METHODS
The data that support the findings of this study will not be made available to other researchers because of restrictions in the data use agreement to conduct this research.
Study Population
The population for this study was derived from data provided by the Florida Agency for Health Care Administration inpatient database. The Florida Agency for Health Care Administration was created in 1992 to set standards for health policy and healthcare planning in the state of Florida. To achieve this goal, an inpatient database was created, and a mandatory reporting system was established for all participating hospitals, which was required to maintain the license to provide healthcare services in the state.13, 14 The reporting system consists of 72 data elements, which are captured in a deidentified fashion, including zone improvement plan (ZIP) codes for each patient’s primary residence and TAVR center, primary and secondary diagnostic codes, current procedural terminology (CPT) codes, and outcome measures including in-hospital mortality, length of stay, and healthcare costs during each inpatient visit. For the purposes of this study, all consecutive adult patients who underwent TAVR procedures from 2011 to 2016 in the state of Florida were identified using ICD-9 (35.05 and 35.06) and ICD-10 codes (02RF3).
For each TAVR patient, demographic data including age, gender, race/ethnicity, primary residency, and TAVR center ZIP codes were recorded. Quality metrics including time from hospital admission until TAVR procedure were collected, hospital length of stay, and discharge status were reported. For each patient, the time (minutes) and distance (miles) from primary residence to the TAVR center where the procedure was performed were calculated using the patient’s home ZIP code and TAVR facility ZIP code (see below for details). Census data for the county of each patient’s primary residence were obtained from the Bureau of Economic and Business Research at the University of Florida in Gainesville. Each county in the state was then categorized according to 5 different levels of population density (population per square mile) from the lowest to the highest category.
Definitions of Population Density
To examine multiple descriptors of population densities, four different definitions were examined according to the standards set by the Bureau of Economic and Business Research at the University of Florida.15 The most common way to examine population density is by dividing the total number of the population of an area by the total land area, but because the state of Florida has large uninhabited blocks of land (forests, parks, wetlands, and nonresidential land), the appropriate method to examine population densities in different counties is an area of debate. To account for these complexities, 4 definitions for population densities have been described:15 (1) total population census for each county per square mile; (2) total population census for each county per square mile after excluding zero population census blocks (i.e. uninhabited land including forests, parks, wetlands, and nonresidential land); (3) median population census for each county per square mile of total land (i.e. this is a measure of an average population density at the smallest level of census geography); and (4) 95% population census for each county per square mile of total land (i.e. this is a measure of how dense the urban cores are).15
Using data from the 2010 United States census, and the published standards on land areas for each county, Rayer and Wang calculated and displayed the population density for every county using each of the four methods. The investigators then assigned each county to the appropriate population density category from lowest to highest. A color-coded map for each method was created displaying each county in one of five colors based on the specific category of population density (Figures 1). Each of these 4 definitions allowed potential comparisons in demographic characteristics and social determinates of health in vulnerable populations residing in the state of Florida.
Figure 1.
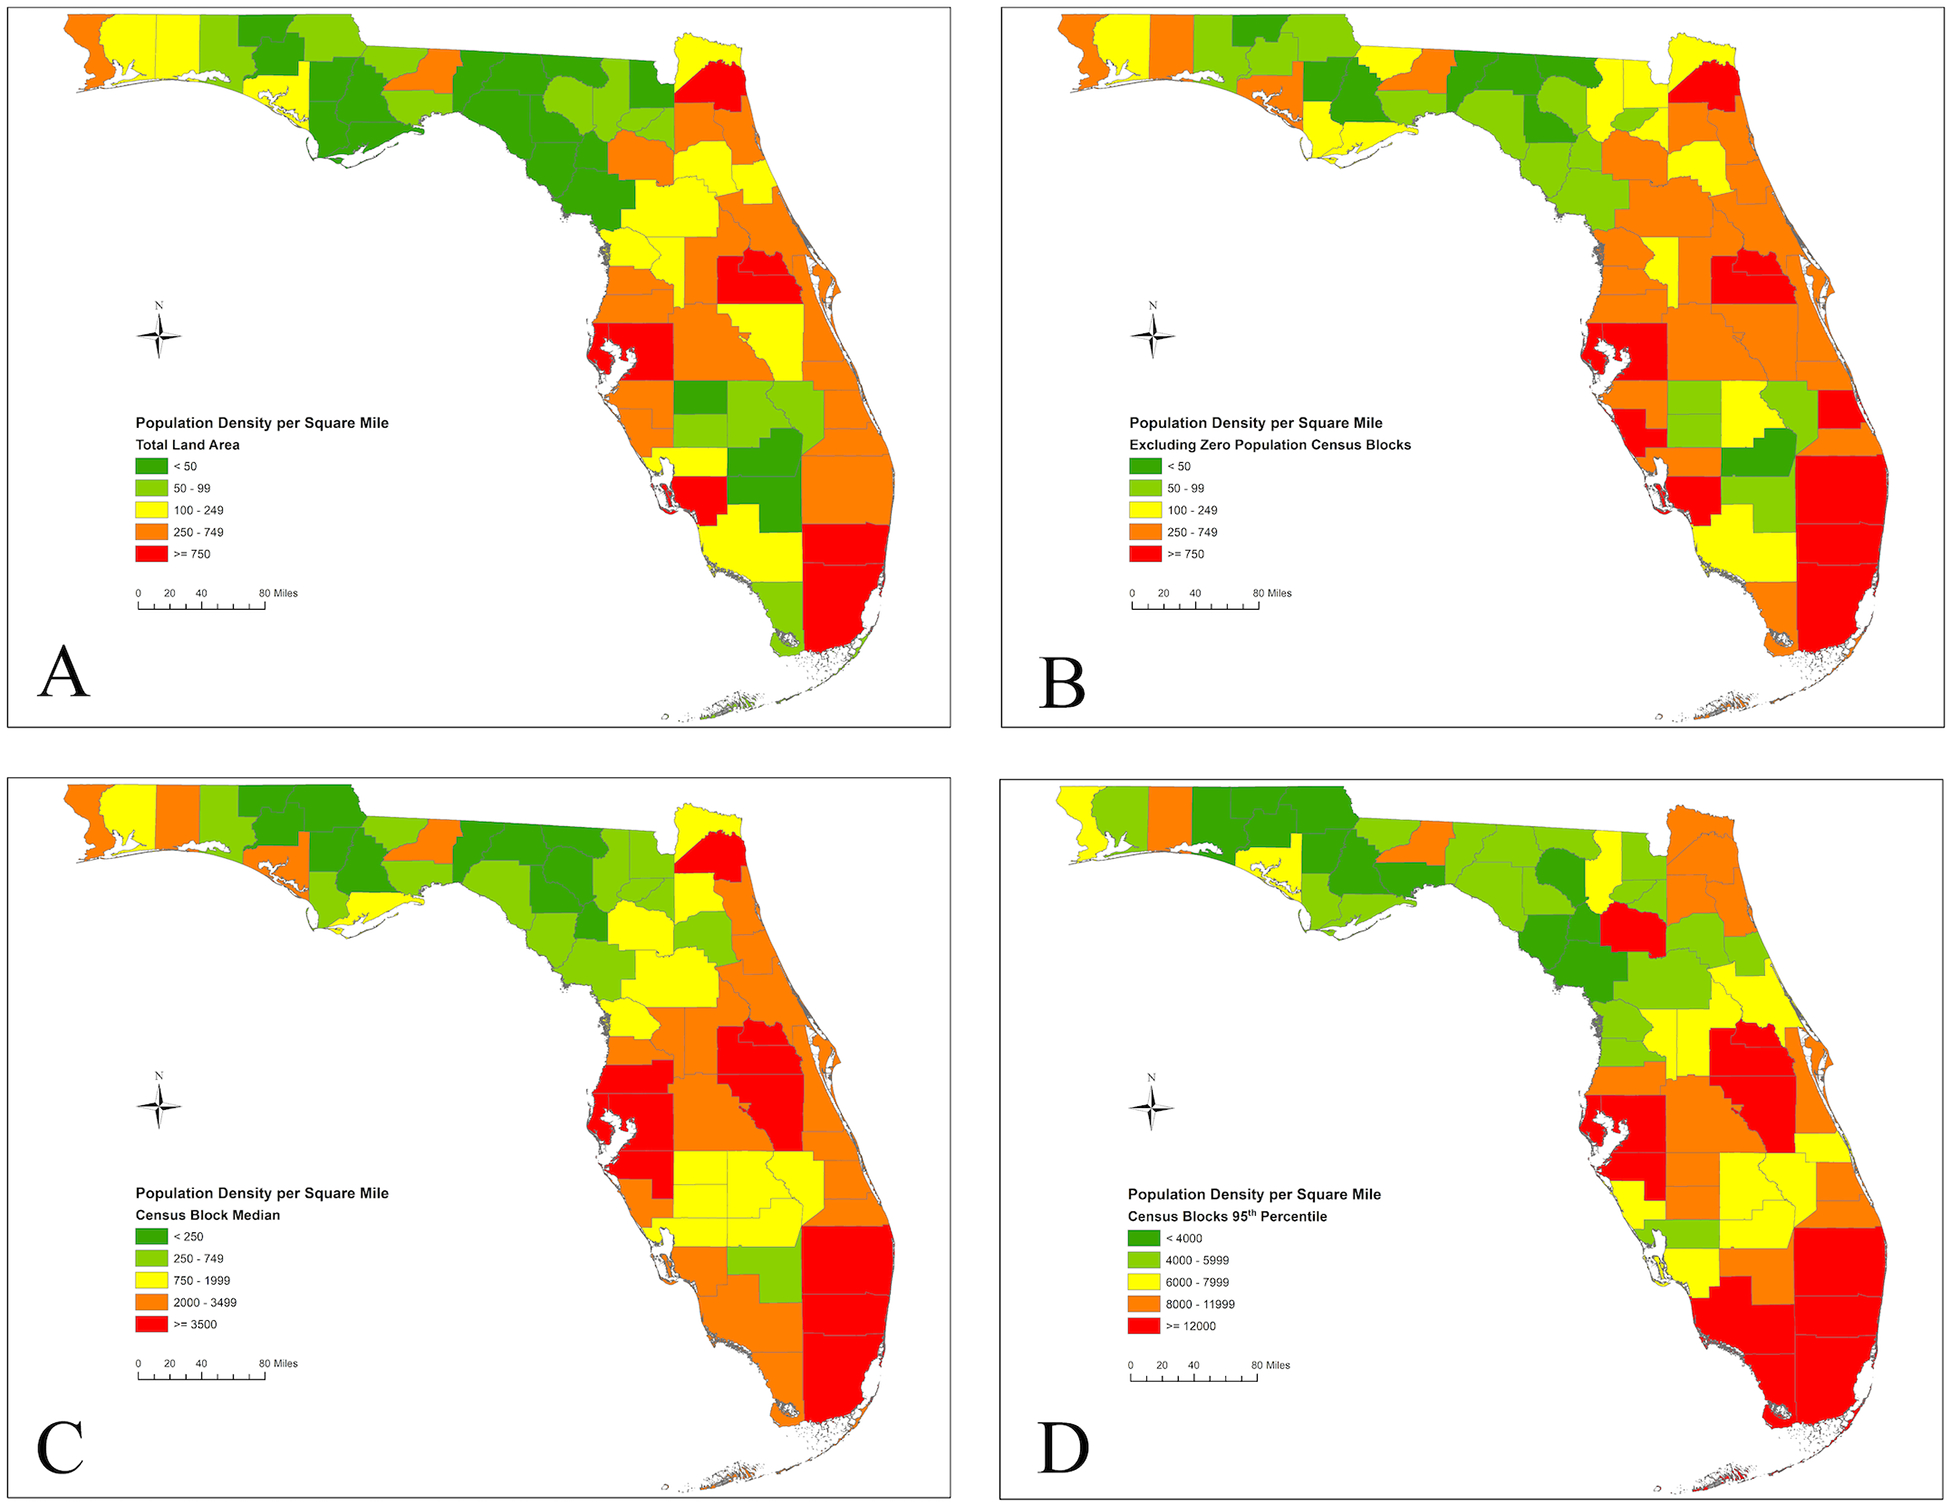
A. Population density per square mile for Florida counties using total land area, 2010. Population data was derived from the 2010 United States Census.
Figure 1. B. Population density per square mile for Florida counties excluding census blocks with zero population, 2010. Zero population land was defined as uninhabited land including forests, parks, wetlands, and nonresidential land.
Figure 1. C. Population density per square mile for Florida counties using median census block density, 2010. The median census block density is a measure of an average population density at the smallest level of census geography.
Figure 1. D. Population density per square mile for Florida counties using 95th percentile census block density, 2010. The 95th percentile census block is a measure of how dense the urban cores are.
Calculation of Age Standardized TAVR Rates
We used the 2000 U.S. Standard Population for calculating the age standardized rates.16 To get the overall age standardized rate for each county within each density category, the rates for the four age groups (<65, 65–74, 76–84, and 85) were multiplied by the 2000 national proportions. Two caveats about the rate calculation should be discussed: First, the TAVR data are for 2011–2016 while the census data used are for April 1, 2010. As a consequence, there is a mismatch in age of at least one year between the two data sources; for example, if a patient had the procedure done in 2014, that patient would have been four years younger in 2010, which could result in placing them in an incorrect age bracket. Second, the TAVR data were collected over a period of six years, and we are currently using that six-year total when calculating the rates. This results in inflated rates. To illustrate this concept, if TAVR data had only been available for 2011–2014, the resulting rates would have been about one third lower, which is incorrect. The point of using procedures performed over a multi-year period is to get a larger and more useable sample, not to get higher rates. So, to get appropriate rates for the 2011–2016 period during which the TAVR procedures were performed, we used the sum of all TAVR procedures over the study period (2011–2016) as the numerator and calculate the sum of the population estimates for the same period (2011–2016) as the denominator. This procedure was performed for each definition of population density in the state of Florida (See Supplementary Tables 1–3).
Calculation of Driving Times and Distances
The average driving time (minutes) and distances (miles) were calculated using the Google Distance Matrix application programming interface (API).17 The Distance Matrix API is a service that provides travel distance and time based on the recommended route (based on historical data) between the start and end destination, which in this case was the global positioning system coordinates corresponding to the ZIP code of the patient’s primary residence and facility’s street address, respectively.18 The application allows for developers to code for the computation of travel distance and time for multiple points within Google Maps, such as ZIP codes. Routes used for distance and time did not consider real-time traffic conditions. Both time and distance were used for comparison; however, some evidence shows time comparisons is a better measure over straight-line distances in areas with increased rurality.19 The institutional review board at the University of Miami Miller School of Medicine determined that this study represents non-human subjects research.
Statistical Analysis
The population density was first examined using the simplest definition, the total number of the population of the county area by the total land area in Florida (Figure 1). Baseline demographics, year of the procedure, hospital level-data, and inpatient outcomes were compared for all patients who underwent TAVR in Florida from 2011 to 2016 based on population density categories. Descriptive statistics, including frequencies and proportions for binary and categorical variables, and mean with standard deviation for continuous data were presented. Comparisons were performed using either chi-squared test, or analysis of variance, as appropriate. From 2011 to 2016, we presented the age standardized TAVR rate for all definitions of population density. To examine the association between different definitions of population density and hospital mortality after TAVR we performed a multivariable logistic regression model adjusting for age, gender, and elixhauser comorbidity index.
Utilizing a linear trend estimation, the distance from the patient’s primary residence to the TAVR center was compared for each category of total land population density relative to the area with highest population density in the state. These comparisons were repeated for each of the four definitions of the population density.20 In a similar fashion, the difference in the travel time by car (minutes) was estimated for each category of population density as compared to people residing in areas with the highest population densities adjusting for age, gender, and Elixhauser comorbidity index. We then plotted the mean number of TAVR procedures per 100,000 people according to population density defined as: (1) the total number of people per square mile of total land; and (2) the total number of people per square mile of land after excluding uninhabited territories (i.e. forests, parks, wetlands, and nonresidential land). Within each definition, we performed an analysis of variance (ANOVA) test to compare the differences in the overall TAVR utilization rate within each category of population density. To test for multiple pairwise comparisons, we used a Bonferroni method with an alpha of 0.05 divided by the number of pairwise comparisons.
To examine the time and distance required for participants to reach high volume TAVR centers, a sensitivity analysis excluding low volume facilities that performed on average <50 TAVR procedure/year over two consecutive years was performed. In similar fashion, a linear trend estimation was used to compare the differences in travel distance (miles) and travel time (minutes) between each category of population density and those residing in the highest population density areas.20 To illustrate where each TAVR center is located in relation to population densities in the state of Florida, we plotted the hospital that offer TAVR procedures according population density defined as total number of people per square mile of land after excluding uninhabited land. The analyses described above were then repeated using the alternative population density definitions as a sensitivity analysis. A two-sided p-value of <0.05 was considered statistically significant. All analyses were performed using STATA 15MP (StataCorp, College Station, Tx). No extramural funding was used to support this work.
Results
During the study period from 2011 to 2016, 6,559 discharges following TAVR procedures were identified. There were 28 duplicate entries that were identified and excluded, rendering a final sample size of 6,531 TAVR patients. Of these, the total number of patients who received TAVR within each category of total land population density was: <50: 101, 50–99: 242, 100–249: 740, 250–249: 2,704: >750: 2,744. Demographic characteristics of the study population were examined and compared by category of total land area population density (Table 1). The mean (SD) age was 82 (9) years, 96% were ≥65 years of age, 83% ≥75 years of age, 43% were female, and 91% Caucasian. The majority of patients who received TAVR in areas with population density of 100–249 and 250–749 people/square mile were Caucasians, while ethnic minorities resided in either highly populated areas or regions with the lowest population densities. Patients residing in the lowest category were younger and more likely to be men than those residing in high population density areas. Of the 6,531 TAVR procedures performed during the study period, the majority were performed in 2015 and 2016 with a rapid increase in the utilization rate since 2011 (Table 1). While all categories of population density showed a rapid increase in the later years of study, patients residing in the lowest categories had fewer TAVR procedures compared to those in the highest population density counties (Table 1). The majority of patients in low population density regions were treated in large hospital systems (mean hospital beds = 752 beds) and most TAVR centers were located in the areas with the highest population density.
Table 1.
Demographic characteristics of patients who received transcatheter aortic valve replacement by total land population density per square mile in the state of Florida from 2011 to 2016.
| Variable* | Total (n=6,531) |
Total Land Population Density per Square Mile | P value** | ||||
|---|---|---|---|---|---|---|---|
| <50 (n=101) |
50–99 (n=242) |
100–249 (n=740) |
250–749 (n=2,704) |
≥750 (n=2,744) |
|||
| Demographics | |||||||
| Age, years, mean (SD) | 82 (9) | 78 (10) | 81 (8) | 81 (8) | 82 (8) | 81 (8) | <0.001 |
| Female gender, (%) | 2,829 (43) | 38 (38) | 115 (48) | 295 (40) | 1,102 (41) | 1,279 (47) | <0.001 |
| Race, (%) | <0.001 | ||||||
| Caucasian, (%) | 5,936 (91) | 91 (90) | 215 (89) | 686 (93) | 2,494 (92) | 2,450 (89) | |
| Black, (%) | 201 (3) | 4 (4) | 13 (5) | 12 (2) | 65 (2) | 107 (4) | |
| Other†, (%) | 394 (6) | 6 (6) | 14 (6) | 42 (6) | 145 (5) | 187 (7) | |
| Year of Procedure, (%) | <0.001 | ||||||
| 2011 | 32 (0) | 0 (0) | 0 (0) | 1 (0) | 10 (0) | 21 (1) | |
| 2012 | 406 (6) | 6 (6) | 11 (5) | 35 (5) | 159 (6) | 195 (7) | |
| 2013 | 592 (9) | 14 (14) | 31 (13) | 59 (8) | 257 (10) | 231 (8) | |
| 2014 | 897 (14) | 16 (16) | 42 (17) | 92 (12) | 373 (14) | 374 (14) | |
| 2015 | 1,707 (26) | 27 (27) | 60 (25) | 193 (26) | 698 (26) | 729 (27) | |
| 2016 | 2,895 (44) | 37 (37) | 97 (40) | 360 (49) | 1207 (45) | 1,194 (44) | |
| Hospital-level Data, mean (SD) | |||||||
| Hospital beds | 631 (236) | 752 (170) | 716 (243) | 579 (248) | 595 (239) | 668 (222) | <0.001 |
| Distance, miles‡ | 33 (43) | 61 (48) | 82 (49) | 57 (49) | 36 (49) | 17 (49) | <0.001 |
| Time, minutes | 42 (40) | 73 (42) | 95 (47) | 67 (47) | 44 (47) | 27 (47) | <0.001 |
| Time until procedure, days‡ | 2 (4) | 2 (6) | 2 (4) | 2 (4) | 1 (4) | 2 (4) | <0.001 |
| Hospital Outcomes, % (95% CI) | |||||||
| Hospital mortality | 3 (2, 3) | 7 (3,14) | 2 (0, 4) | 3 (2, 4) | 2 (2, 4) | 4 (3, 4) | <0.001 |
| Discharge home or self-care | 33 (31, 34) | 46 (36, 56) | 42 (36, 49) | 39 (36, 43) | 37 (35, 38) | 26 (24, 27) | <0.001 |
| Discharge to acute care facility‡‡ | 26 (25, 27) | 17 (10, 26) | 18 (13, 23) | 24 (21, 27) | 27 (26, 29) | 27 (26, 29) | <0.001 |
| Length of stay, days | 7 (7, 7) | 7 (6, 9) | 7 (6, 7) | 6 (6, 7) | 6 (6, 7) | 8 (8, 8) | <0.001 |
Abbreviations: CI = confidence interval; SD = standard deviation.
% may not add to 100 due to rounding.
p-values were obtained from generalized linear model.
Includes American Indian, Alaskan Native, Asian, Native Hawaiian or Pacific Islander, and other racial minorities.
Distance (miles) is defined as the distance from the patient’s home zip code to the TAVR center where patient received the TAVR procedure. Time (minutes) is defined as the time needed to travel from the patient’s home zip code to the TAVR center where patient received the TAVR procedure.
Time until procedure is the mean number of days from admission date to procedure date.
Discharged to home care, skilled nursing facility, or rehabilitation center.
The age standardized rates for total land population density of the state of Florida is presented in Table 2. The age standardized rates look rather similar across the five density categories and across the other density classifications (Supplementary Tables 1–3). The association between population density and hospital mortality after TAVR were presented in supplementary table 4. Patients residing in low-population density areas (according to total land and excluding zero blocks definitions) had higher mortality, as compared to patients residing in high population density areas (Total Land: OR 2.31, 95% CI 1.02 – 5.23, p=0.043; Zero Block: 6.13, 95% CI 1.97– 19.1). This association was similar when restricting the analysis to high-volume TAVR centers (Supplementary Table 4)
Table 2.
Age standardized transcatheter aortic valve replacement rates from 2011 to 2016 in the state of Florida by total land population density.
| Age Group | Total Land Population Density per Square Mile | TAVR Utilization by Age Group | 2011–2016 Florida Population by Age Group |
2000 U.S. Standard Population Proportions |
Age Standardized Rates* |
|---|---|---|---|---|---|
| <65 | <50 | 6 | 1,748,154 | 0.873614 | 0.3 |
| 65–74 | <50 | 25 | 217,190 | 0.066037 | 11.5 |
| 75–84 | <50 | 46 | 112,064 | 0.044841 | 41.0 |
| 85+ | <50 | 24 | 37,392 | 0.015508 | 61.5 |
| Total | <50 | 101 | 2,114,800 | 1.000000 | 3.9 |
| <65 | 50–99 | 9 | 2,824,995 | 0.873614 | 0.3 |
| 65–74 | 50–99 | 46 | 407,720 | 0.066037 | 11.3 |
| 75–84 | 50–99 | 93 | 228,668 | 0.044841 | 40.7 |
| 85+ | 50–99 | 94 | 83,733 | 0.015508 | 111.1 |
| Total | 50–99 | 242 | 3,545,116 | 1.000000 | 4.6 |
| <65 | 100–249 | 25 | 9,921,327 | 0.873614 | 0.3 |
| 65–74 | 100–249 | 93 | 1,816,839 | 0.066037 | 5.1 |
| 75–84 | 100–249 | 344 | 1,037,188 | 0.044841 | 33.2 |
| 85+ | 100–249 | 278 | 357,474 | 0.015508 | 77.8 |
| Total | 100–249 | 740 | 13,132,828 | 1.000000 | 3.3 |
| <65 | 250–749 | 87 | 31,156,466 | 0.873614 | 0.3 |
| 65–74 | 250–749 | 335 | 4,638,404 | 0.066037 | 7.2 |
| 75–84 | 250–749 | 1,036 | 2,853,496 | 0.044841 | 36.3 |
| 85+ | 250–749 | 1,246 | 1,254,465 | 0.015508 | 99.3 |
| Total | 250–749 | 2,704 | 39,902,831 | 1.000000 | 3.9 |
| <65 | ≥750 | 129 | 50,784,464 | 0.873614 | 0.3 |
| 65–74 | ≥750 | 371 | 5,090,127 | 0.066037 | 7.3 |
| 75–84 | ≥750 | 1,060 | 2,850,454 | 0.044841 | 37.2 |
| 85+ | ≥750 | 1,184 | 1,276,689 | 0.015508 | 92.7 |
| Total | ≥750 | 2,744 | 60,001,734 | 1.000000 | 3.8 |
| <65 | All | 257 | 96,435,406 | 0.873614 | 0.3 |
| 65–74 | All | 871 | 12,170,280 | 0.066037 | 7.1 |
| 75–84 | All | 2,579 | 7,081,870 | 0.044841 | 36.4 |
| 85+ | All | 2,824 | 3,009,753 | 0.015508 | 93.8 |
| Total | All | 6,531 | 118,697,309 | 1.000000 | 3.8 |
The 2000 U.S. Standard Population for calculating the age standardized rates (see https://seer.cancer.gov/stdpopulations/stdpop.19ages.html).
The location of TAVR centers in relation to population density per square mile excluding uninhabited land is presented in Figure 2. On average, the mean distance traveled for the entire cohort was 33 miles for an average travel time of 42 minutes. Patients residing in low population density areas had significantly longer travel distances and times compared with those who lived in higher density areas. Overall, unadjusted in-hospital TAVR mortality rate was low (Hospital Mortality: 2.66%; 95% CI: 2.2 to 3.1), however the higher mortality was observed in for patients who lived in low-density areas (Table 1). The age- and sex-adjusted hospital mortality among patients residing in the low population density areas remained higher than those residing in high population density areas (Mortality: <50: 5% (95% CI: 0.1–10.2) vs. high-population density area 1% (95% CI: 0.7–7.4), p-value=0.015). More patients were discharged home and patients were less likely to go to rehabilitation or acute care facility when they resided in low population density areas.
Figure 2.
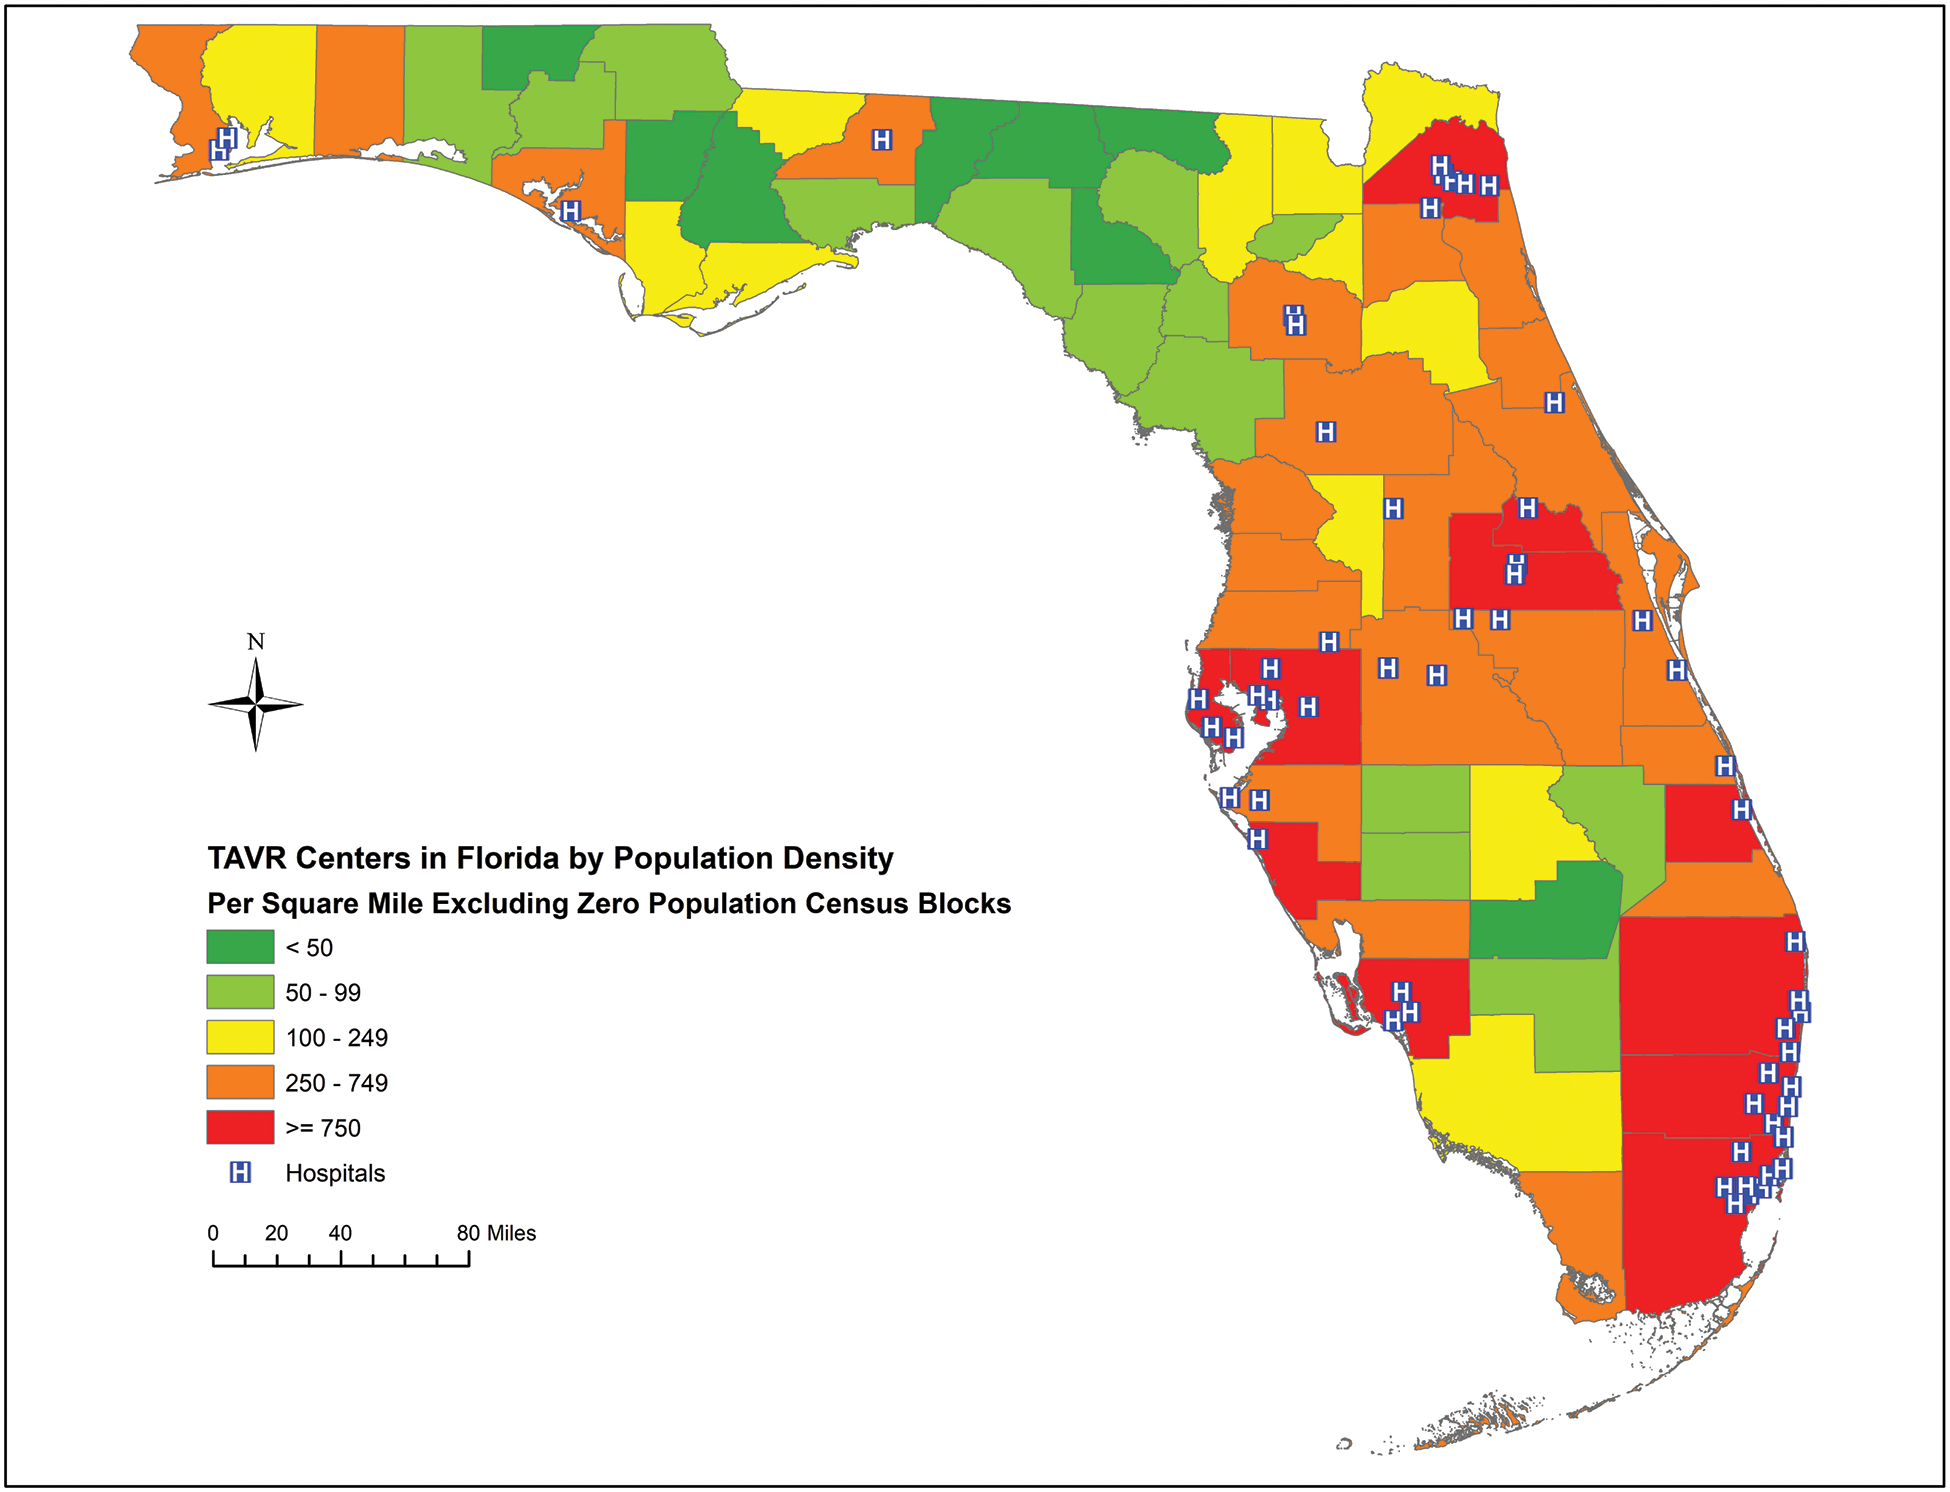
Transcatheter aortic valve replacement centers in Florida by population density. Population density per square mile for Florida counties excluding census blocks with zero population, 2010. Zero population land was defined as uninhabited land including forests, parks, wetlands, and nonresidential land.
As compared to the highest population density areas, patients living in low population density areas had an average unadjusted travel distance 43.5 (95% CI: 35.6 to 51.4) miles further and 45.6 (95% CI: 38.3 to 52.9) minutes longer (Table 3). Comparing patients in intermediate density areas to those who reside in low density areas, these travel distances and times were smaller. These differences in the estimated travel distance and time from the patient’s primary residence to the TAVR center were consistent regardless of the definition of population density (Table 3). When the analysis was limited to only high-volume centers (defined as centers performing over 50 procedures/year), the same trends were observed across the definitions of population density (Table 4). The rate of TAVR utilization is presented by two definitions of population density: (1) the total number of the population divided by the total land area of county; and (2) the total number of population divided by total land after excluding uninhabited blocks of land (i.e. zero land: forests, parks, wetlands, and nonresidential land). After excluding uninhabited land, the rate of utilization of TAVR procedures per 100,000 people was lowest in areas with low population density areas with a substantial increase as the population density increases (TAVR utilization low [<50] vs. high [≥750] population density: 7 vs. 45 TAVR procedures/100,000 people, p-value < 0.001) (Figure 3).
Table 3.
The mean unadjusted difference in distance (miles) and time (minutes) from patient’s home to transcatheter aortic valve replacement center by population density in Florida from 2011 to 2016. Note that the reference group is the highest category of high-population density areas.
| Distance to TAVR Center (Miles) * | Time to TAVR Center (Minutes) ** | |||||||
|---|---|---|---|---|---|---|---|---|
| β Coefficient# | P Value | 95% CI | β Coefficient | P Value | 95% CI | |||
| Total Land† | ||||||||
| <50 | 43.5 | <0.001 | 35.6 | 51.4 | 45.6 | <0.001 | 38.3 | 52.9 |
| 50 – 99 | 65.0 | <0.001 | 59.8 | 70.2 | 67.6 | <0.001 | 62.8 | 72.4 |
| 100 – 249 | 39.3 | <0.001 | 36.1 | 42.5 | 39.9 | <0.001 | 36.9 | 42.9 |
| 250 – 749 | 18.8 | <0.001 | 16.7 | 20.9 | 17.4 | <0.001 | 15.5 | 19.3 |
| Zero Block‡ | ||||||||
| <50 | 49.9 | <0.001 | 34.3 | 65.3 | 44.9 | <0.001 | 30.7 | 59.1 |
| 50 – 99 | 53.6 | <0.001 | 47.2 | 59.9 | 54.6 | <0.001 | 49.8 | 61.4 |
| 100 – 249 | 43.0 | <0.001 | 39.1 | 46.9 | 45.6 | <0.001 | 42.1 | 49.2 |
| 250 – 749 | 29.4 | <0.001 | 27.4 | 31.6 | 29.9 | <0.001 | 28.0 | 31.9 |
| Median‡‡ | ||||||||
| <250 | 54.7 | <0.001 | 45.6 | 63.8 | 50.2 | <0.001 | 41.8 | 58.6 |
| 250 – 749 | 37.3 | <0.001 | 31.6 | 43.0 | 40.0 | <0.001 | 34.8 | 42.3 |
| 750 – 1,999 | 33.4 | <0.001 | 30.1 | 36.6 | 35.4 | <0.001 | 32.5 | 38.4 |
| 2000 – 3,499 | 32.9 | <0.001 | 30.7 | 35.1 | 32.9 | <0.001 | 30.8 | 34.9 |
| 95th %∥ | ||||||||
| <4000 | 47.9 | <0.001 | 40.5 | 55.3 | 48.4 | <0.001 | 41.5 | 55.1 |
| 4000 – 5,999 | 38.0 | <0.001 | 34.5 | 41.5 | 39.1 | <0.001 | 35.8 | 42.3 |
| 6000 – 7,999 | 24.3 | <0.001 | 21.6 | 26.9 | 26.4 | <0.001 | 23.9 | 28.9 |
| 8000 – 11,999 | 25.8 | <0.001 | 23.1 | 28.4 | 23.9 | <0.001 | 21.4 | 26.3 |
Abbreviations: CI = Confidence interval.
Distance (miles) is defined as the distance from the patient’s home zip code to the TAVR center where patient received the TAVR procedure. Reference group is patients in highest population density area (>750 people per square mile).
Time (minutes) is defined as the time needed to travel from the patient’s home zip code to the TAVR center where patient received the TAVR procedure. (Reference: >750 people per square mile).
Total land area of the state of Florida by population density measured as people per square miles;
excluding uninhabited land (i.e. excluding blocks with zero inhabitants) (Reference: >3,500 people per square mile);
Median population density per square mile of land;
95th percentile of population density per square mile of land (Reference: >12,000 people per square mile);
The additional distance in miles travelled compared with the population density area. The models were derived from unadjusted generalized linear regression.
Table 4.
The mean unadjusted difference in distance (miles) and time (minutes) from patient’s home to transcatheter aortic valve replacement center by population density in Florida from 2011 to 2016 only among high volume centers defined as a center performing >50 procedures per year. Note that the reference group is high-population density areas.
| Distance to TAVR Center (Miles) * | Time to TAVR Center (Minutes) ** | |||||||
|---|---|---|---|---|---|---|---|---|
| β Coefficient# | P Value | 95% CI | β Coefficient | P Value | 95% CI | |||
| Total Land† | ||||||||
| <50 | 40.7 | <0.001 | 33.1 | 48.4 | 43.3 | <0.001 | 36.0 | 50.5 |
| 50 – 99 | 60.7 | <0.001 | 55.5 | 66.0 | 63.7 | <0.001 | 58.7 | 68.7 |
| 100 – 249 | 38.8 | <0.001 | 35.5 | 42.2 | 39.9 | <0.001 | 36.8 | 43.1 |
| 250 – 749 | 18.5 | <0.001 | 16.2 | 20.7 | 16.8 | <0.001 | 14.7 | 18.9 |
| Zero Block ‡ | ||||||||
| <50 | 51.8 | <0.001 | 37.0 | 66.7 | 46.2 | <0.001 | 32.2 | 60.2 |
| 50 – 99 | 49.5 | <0.001 | 43.3 | 55.8 | 52.0 | <0.001 | 46.1 | 57.9 |
| 100 – 249 | 42.2 | <0.001 | 38.2 | 46.0 | 46.0 | <0.001 | 42.2 | 49.9 |
| 250 – 749 | 32.5 | <0.001 | 30.2 | 34.7 | 33.5 | <0.001 | 31.4 | 35.6 |
| Median‡‡ | ||||||||
| <250 | 56.4 | <0.001 | 47.7 | 65.1 | 51.8 | <0.001 | 43.6 | 60.0 |
| 250 – 749 | 33.8 | <0.001 | 28.3 | 39.4 | 37.5 | <0.001 | 32.2 | 42.8 |
| 750 – 1,999 | 31.9 | <0.001 | 28.7 | 35.2 | 34.1 | <0.001 | 31.1 | 38.0 |
| 2000 – 3,499 | 35.1 | <0.001 | 32.9 | 37.5 | 35.8 | <0.001 | 33.7 | 38.1 |
| 95th %∥ | ||||||||
| <4000 | 47.6 | <0.001 | 40.7 | 54.6 | 48.4 | <0.001 | 41.8 | 55.1 |
| 4000 – 5,999 | 38.3 | <0.001 | 34.9 | 41.9 | 39.8 | <0.001 | 36.5 | 43.1 |
| 6000 – 7,999 | 26.4 | <0.001 | 23.7 | 29.2 | 28.9 | <0.001 | 26.4 | 31.5 |
| 8000 – 11,999 | 31.0 | <0.001 | 28.0 | 33.9 | 29.6 | <0.001 | 26.7 | 32.3 |
Abbreviations: CI = Confidence interval.
Distance (miles) is defined as the distance from the patient’s home zip code to the TAVR center where patient received the TAVR procedure. Reference group is patients in highest population density area (>750 people per square mile).
Time (minutes) is defined as the time needed to travel from the patient’s home zip code to the TAVR center where patient received the TAVR procedure. (Reference: >750 people per square mile).
Total land area of the state of Florida by population density measured as people per square miles;
excluding uninhabited land (i.e. excluding blocks with zero inhabitants) (Reference: >3,500 people per square mile);
Median population density per square mile of land;
95th percentile of population density per square mile of land (Reference: >12,000 people per square mile);
The additional distance in miles travelled compared with the population density area. The models were derived from unadjusted generalized linear regression.
Figure 3.
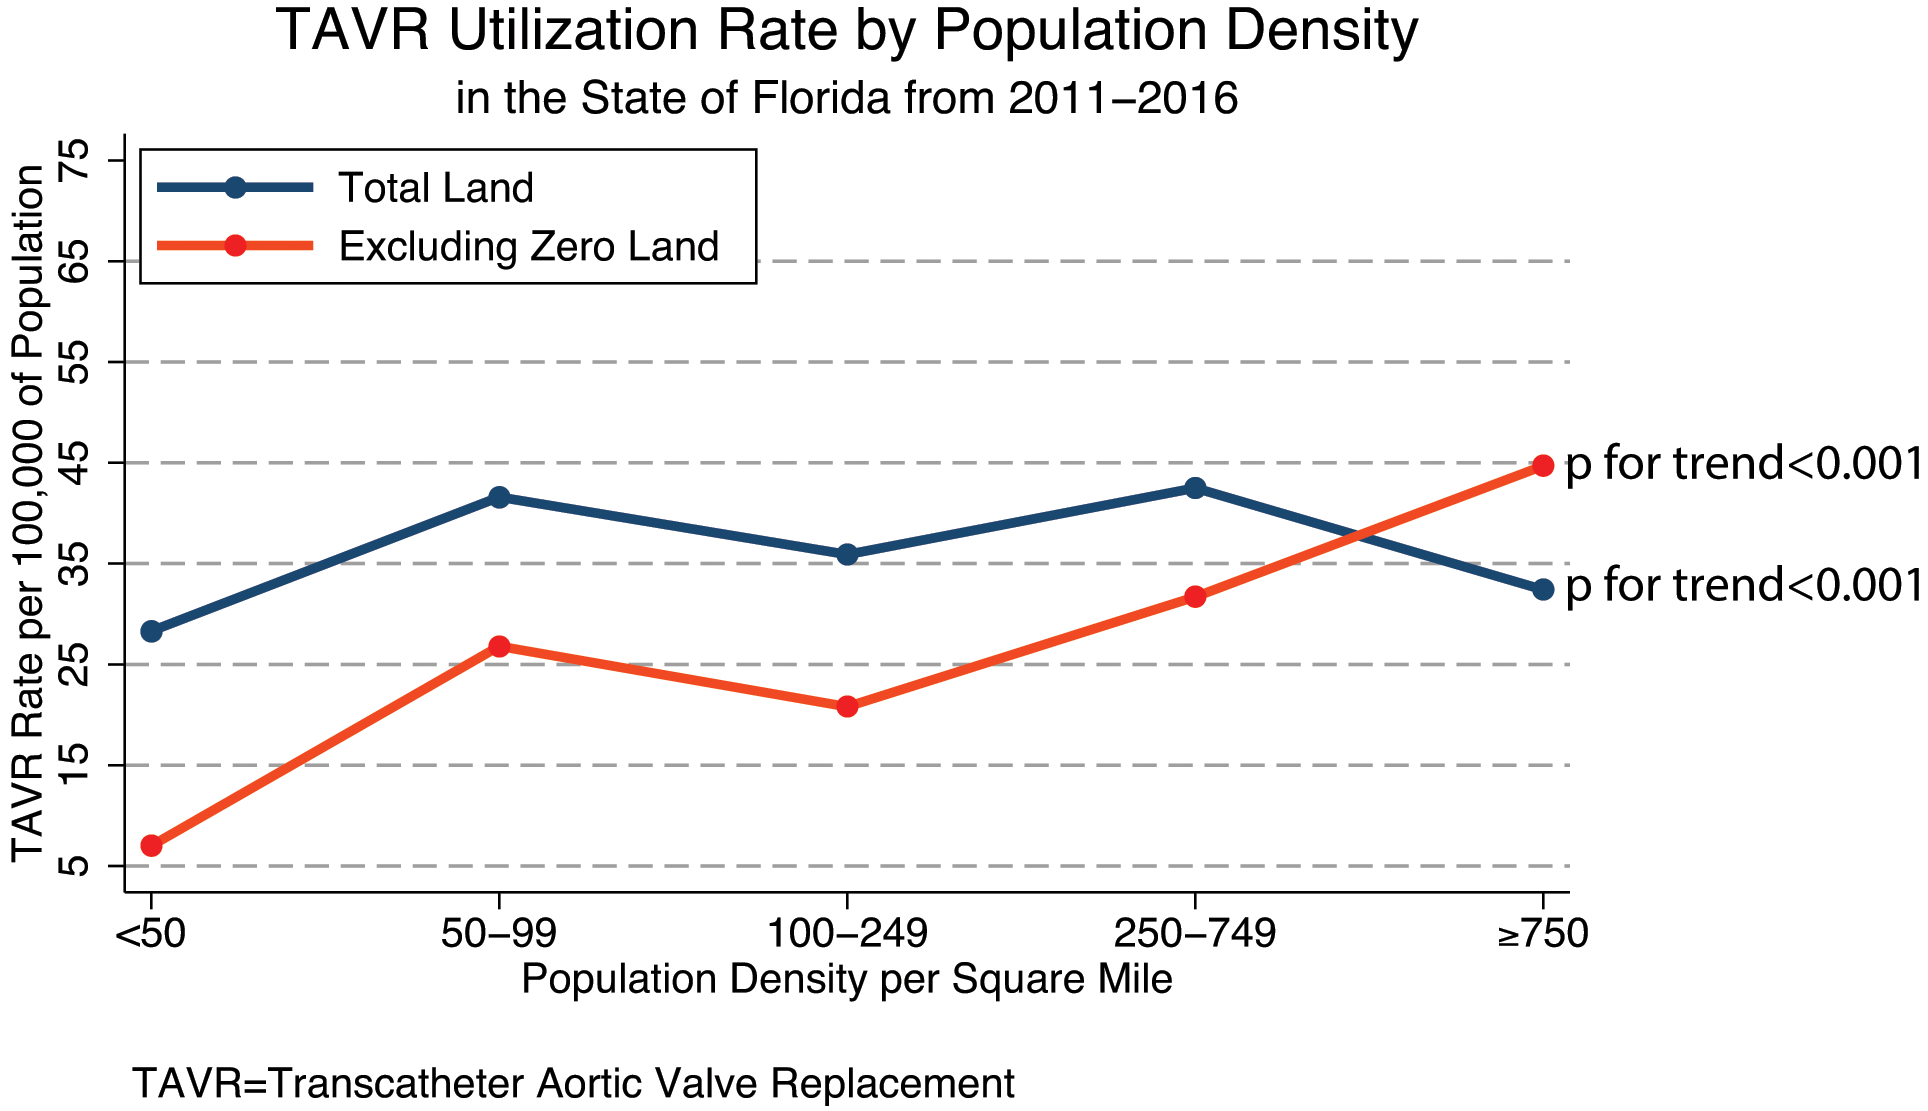
Transcatheter aortic valve replacement utilization rate by population density in Florida from 2011 to 2016. Population density was defined as (1) Total land: population per square mile for Florida counties using total land area, 2010; (2) Population density per square mile for Florida counties excluding census blocks with zero population, 2010. Zero population land was defined as uninhabited land including forests, parks, wetlands, and nonresidential land. Population data was derived from the 2010 United States Census. Population density was treated as an ordinal categorical variable and p for trend applies for both TAVR utilization rates.
Discussion
In this study, we compared TAVR travel times and distances, TAVR utilization rates and TAVR mortality across the spectrum of population densities in the state of Florida from 2011 to 2016. The main findings of this study are: (1) the majority of TAVR centers in the state of Florida were located in high population density areas; (2) there were stark differences in travel time and distance for TAVR patients residing in the lowest population density counties compared to the highest, (3) after excluding uninhabited land in the state of Florida, TAVR utilization rates varied 7-fold according from low to high population density areas; (4) TAVR mortality varied minimally for patients who are living in low versus high population density regions; and (5) higher proportion of low population density patients are discharged directly home, which may also reflect lack of geographic access to rehabilitation center/skilled nursing facility.
In previous work evaluating healthcare utilization among older patients, travel distances exceeding 10 miles from the patient’s residence to healthcare facility or centers located outside the patient’s “activity space” were associated with reduced rate of healthcare utilization.9 In this context, an additional increase in the drive time from the patient primary residence to the healthcare facility of 45–60 minutes for patients residing in the lowest population density areas, likely represent a significant access barrier for the older patients typically considered for TAVR procedures. Although the rate of growth of TAVR utilization over the study period was rapid and comparable to national estimates, the rate of adoption was slowest in the lowest population density areas in Florida.21, 22 Combined with the lower overall rate of TAVR procedures/100,000 of populations, these findings may speak to a broader issue of underdiagnosing and undertreating diseases like severe symptomatic aortic stenosis in lower population density areas. We have shown that there are differences in racial and ethnic distribution of older patients who received TAVR across different areas of population density. Rural communities with low-population densities or poor underserved urban areas may have a lack of high-quality primary care, which results in underutilization of specialized cardiac care and cardiovascular imaging. These problems in disease detection or diagnosis can in part explain the racial and ethnic differences observed in older patients undergoing TAVR procedures.23
The location of TAVR centers when it comes to population densities is critical to serve populations at risk for restricted healthcare access. We determined that highly specialized cardiac centers that provide TAVR services are located mainly in high population density areas. While relatively large healthcare systems exist in low population density areas, proper planning on how to distribute these highly specialized cardiac centers is lacking. The American Association for Thoracic Surgery, American College of Cardiology, Society for Cardiovascular Angiography and Interventions, and Society of Thoracic Surgeons have suggested a minimal standard for TAVR procedures to maximize quality outcomes and minimize procedure related complications. The rapid growth of TAVR centers in areas of high population density relative to low population density areas can create an imbalance in healthcare services by regions and geography. This imbalance in cardiac care was previously shown in centers offering percutaneous coronary interventions.24 For example, the state of Nevada has a high prevalence of coronary artery disease burden, but the number of PCI centers in proportion to the population is significantly lower than a comparable states with a similar population.24
The age standardized TAVR rates tend to be highest in the second lowest density category (except for the 95th percentile classification), but in general the rates are quite comparable. Where they vary, that seems to be more due to small sample sizes at lower densities rather than reflecting substantive differences. There is much less variation between the four density classifications at the two highest density categories (the range is only 0.2 for the highest density category and 0.7 for the second highest) compared to the two lowest density categories (the range is 1.8 for the lowest and 1.7 for the second lowest).
Financial barriers to establish TAVR programs in low-population density areas exist. While surgical aortic valve replacement has great financial benefits for most hospitals,25 there are financial disincentives for smaller, rural hospitals to establish TAVR programs. Diagnosis-related group payments vary widely, and these payments are lowest for more rural, non-teaching hospitals.26 With lower reimbursement rates for TAVR in rural regions, the “halo effect” associated with structural heart disease procedures cannot make up for this financial disincentive. It should be noted that many rural hospitals in the United States are designated as “critical access hospitals”. These hospitals are not reimbursed via the inpatient prospective payment systems, but rather paid according to what Centers for Medicare and Medicaid Services deem to be 101% of reasonable costs
The costs associated with opening a TAVR programs (e.g. hybrid operating room or high-quality computed tomography) also weigh heavily on hospitals above other needs for their community. Other financial factors that preclude TAVR centers in low-population density areas include the competitive healthcare market and the emergence of large healthcare system that aim to consolidate high-end cardiovascular service lines in urban hospital systems in high population density areas. The differential utilization of TAVR procedures may not only be TAVR-specific, but the concept can potentially be applied to all procedural care. Future research should study this differential utilization of other cardiovascular procedures (e.g. coronary artery bypass graft surgery) by population density. If similar findings are found, this will point out to the overall lack of medical and advanced procedural resources in areas of low population densities.
As TAVR guidelines aim to establish minimum standards to achieve the highest quality through volume thresholds these disparities in access to care can be exaggerated by imposing limits on expansion. In states with high health care costs, large uninsured patient populations, and access barriers, such as Florida, limiting care to specific centers has been controversial as reflected in current concerns over Certificate of Need (CON) laws.11, 12, 27 Supporters of CON repeal, which already has minimal CON requirements, cite inflated costs and limited access as reasons for repealing these types of laws and recommendations. Expanding access by appropriate planning of TAVR centers targeting low density areas can mitigate problems related to disparity and healthcare access. The recent Centers for Medicare and Medicaid Services coverage determination for hospitals without TAVR experience included a minimum of 50 surgical aortic valve replacement operations in the prior year. For surgeons without TAVR experience, the volume threshold is at least 100 career open heart surgeries and that for interventional cardiologist include a minimum of 100 structural heart disease procedures in a lifetime or 30-left sided structural procedures per year. While we believe that these quality metrics are important to ensure safe outcomes, it may restrict access for certain patients in low-population density areas. From health policy perspective, healthcare access should be discussed to decrease healthcare disparities created by volume requirements.
It should be noted that despite the differences in the distribution of TAVR centers by population density, racial, and ethnic factors, the U.S. has more TAVR programs per population than any other country. This expansion of TAVR programs was driven by different factors including industry, hospitals/physicians, and patient advocacy groups. While there were real efforts to extend TAVR services to cover populations in need, concerns were raised regarding large profit margins and market acquisition, hospital requesting accreditation without meeting the minimum quality metrics for establishment of TAVR programs, and industry funding for advocacy groups that makes the appropriate planning for TAVR centers more challenging. The National Coverage Decisions are needed to establish a network of treatment centers that meet reasonable standards to provide high-quality care and healthcare access that is equivalent to other specialized services. Guidelines should reflect the balance between quality standards and healthcare access for communities at risk for under diagnosis and under treatment of aortic valve disease. While creative solutions like ride-sharing platforms could be used to improve access, this approach has produced mixed results in the primary care setting.28 Other creative solutions to address healthcare access include the establishment of local primary valvular heart disease care centers in low-population density areas to promote and improve screening, diagnosis, and prognostication of valvular heart disease and that will ultimately lead to higher referral to specialized TAVR centers in urban areas. If pre-procedural work-up and post-procedure care can be done competently at the local level and if telemedicine can allow meetings with TAVR center personnel for those living in low-population density areas, then the need to travel to a TAVR center may become a one-time occurrence.
Limitations
There are limitations to this retrospective analysis. First, calculating travel times with applications like the Google Matrix distance does not take into consideration potential traffic congestion, which may not represent the traffic conditions at the time the patient is traveling for their procedure. For this reason, we considered both distance and time in our analyses.29 Second, we used the population density estimates derived from 2010 census data that were validated by Rayer and Wang and reported previously.15 The population has grown in the years between 2010 and 2016. While the updated census data can produce slightly different population estimates, the relative population density of the counties in the state of Florida did not change substantively over that time interval. Further, the method used to examine population density in the state of Florida is an area of debate because of the large uninhabited land in the state. In order to avoid this limitation, we presented the data utilizing all 4 definitions of population that were previously described. Third, it plausible that sophisticated patients who need TAVR procedures may travel many miles to get to a TAVR program that is nationally “ranked”. While this can result in bias, many patients from this socioeconomic status likely reside in urban area rather than rural counties with low-population densities. These socioeconomic factors (e.g. education levels and income) could be major determinants of TAVR outcomes. However, current and future planned generation of risk-adjustment algorithms do not include these factors in risk calculation and future studies should consider these factors when evaluating health outcomes in older patients after TAVR procedures. It should be noted that while there was a difference in the unadjusted mortality rate by population density, clinical and socioeconomic variables that confound the relationship between population density and mortality may still exist. Fourth, we assume that TAVR was “appropriate” in everyone who received the procedure. Setting minimal standards for institutions can theoretically result in “overutilization” of TAVR procedures, an important problem when evaluating healthcare access versus quality. Fifth, CPT codes are frequently used in outpatient datasets to identify procedures. In this inpatient dataset, ICD-10 could not be validated against CPT codes for TAVR (33361–69) because patients are deidentified and linkage with outpatient data was not possible. Sixth, evaluation of density from demography and population perspective can performed as either continuous or ordinal categorical variable. Although there were about 6,531 TAVR procedures over that six-year period in the state of Florida, the relevant variable for the density analysis is the county, because that is where density was measured. We could have used zip code data instead, which would have provided more cases for the density analysis, but there would still be too few procedures for many areas to calculate reasonably stable rates. Thus, we chose to aggregate county-level data into broader density brackets. Lastly, TAVR utilization data available for analysis include only those patients who received TAVR. Data on patients who should receive TAVR, but did not, are not available in the inpatient database. Examination of underutilization of TAVR in low-population density areas should be addressed in future research.
Conclusion
Floridians living in more rural counties face significantly longer travel distances and times for TAVR, much lower TAVR utilization rates and higher TAVR procedural mortality. This is of particular importance for vulnerable elderly for whom these phenomena may create disparities in care. The inherent trade-offs between access to TAVR, its rate of utilization and procedural mortality are all important considerations when determining institutional and operator requirements for TAVR across the country.
Supplementary Material
What is known?
Restricting cardiovascular procedures, including transcatheter aortic valve replacement (TAVR), to centers based on volume-outcome relationships can create healthcare access disparities.
What the study adds?
The majority of TAVR centers in the state of Florida were located in high population density areas and there were stark differences in travel time and distance for TAVR patients residing in the lowest population density counties compared to the highest.
After excluding uninhabited land in the state of Florida, TAVR utilization rates varied 7-fold according from low to high population density areas.
Higher proportion of low population density patients are discharged directly home, which may also reflect lack of geographic access to rehabilitation center/skilled nursing facility.
Floridians living in more rural counties face significantly longer travel distances and times for TAVR, much lower TAVR utilization rates and higher TAVR procedural mortality.
Acknowledgments:
This work is part of a PhD thesis for Dr. Damluji at Johns Hopkins University’ GTPCI program. The abstract for this work was submitted to the 2019 Transcatheter Cardiovascular Therapeutics Conference in San Francisco, CA.
FUNDING: Dr. Damluji receives research funding from the Pepper Scholars Program of the Johns Hopkins University Claude D. Pepper Older Americans Independence Center Funded by the NIH-National Institute on Aging P30-AG021334.
Footnotes
DISCLOSURES: Dr. Moscucci received book royalties from Wolters Kluwer Lippincott Williams & Wilkins and has stock ownership in Gilead Sciences, Inc. The authors declare that they have no other competing interests.
References
- 1.Urbach DR. Pledging to Eliminate Low-Volume Surgery. N Engl J Med. 2015;373:1388–90. [DOI] [PubMed] [Google Scholar]
- 2.Blanco BA, Kothari AN, Blackwell RH, Brownlee SA, Yau RM, Attisha JP, Ezure Y, Pappas S, Kuo PC and Abood GJ. “Take the Volume Pledge” may result in disparity in access to care. Surgery. 2017;161:837–845. [DOI] [PubMed] [Google Scholar]
- 3.Bavaria JE, Tommaso CL, Brindis RG, Carroll JD, Deeb GM, Feldman TE, Gleason TG, Horlick EM, Kavinsky CJ, Kumbhani DJ, Miller DC, Seals AA, Shahian DM, Shemin RJ, Sundt TM 3rd and Thourani VH. 2018 AATS/ACC/SCAI/STS Expert Consensus Systems of Care Document: Operator and Institutional Recommendations and Requirements for Transcatheter Aortic Valve Replacement: A Joint Report of the American Association for Thoracic Surgery, American College of Cardiology, Society for Cardiovascular Angiography and Interventions, and Society of Thoracic Surgeons. J Am Coll Cardiol. 2019;73:340–374. [DOI] [PubMed] [Google Scholar]
- 4.Carroll JD, Vemulapalli S, Dai D, Matsouaka R, Blackstone E, Edwards F, Masoudi FA, Mack M, Peterson ED, Holmes D, Rumsfeld JS, Tuzcu EM and Grover F. Procedural Experience for Transcatheter Aortic Valve Replacement and Relation to Outcomes: The STS/ACC TVT Registry. J Am Coll Cardiol. 2017;70:29–41. [DOI] [PubMed] [Google Scholar]
- 5.Feldman AM and DiSesa VJ. Transcatheter aortic valve replacement: flattening the cost curve. JAMA. 2014;312:25–6. [DOI] [PubMed] [Google Scholar]
- 6.Fiscella K, Franks P, Gold MR and Clancy CM. Inequality in quality: addressing socioeconomic, racial, and ethnic disparities in health care. JAMA. 2000;283:2579–84. [DOI] [PubMed] [Google Scholar]
- 7.Politzer RM, Yoon J, Shi L, Hughes RG, Regan J and Gaston MH. Inequality in America: the contribution of health centers in reducing and eliminating disparities in access to care. Med Care Res Rev. 2001;58:234–48. [DOI] [PubMed] [Google Scholar]
- 8.Syed ST, Gerber BS and Sharp LK. Traveling towards disease: transportation barriers to health care access. J Community Health. 2013;38:976–93. [DOI] [PMC free article] [PubMed] [Google Scholar]
- 9.Nemet GF and Bailey AJ. Distance and health care utilization among the rural elderly. Soc Sci Med. 2000;50:1197–208. [DOI] [PubMed] [Google Scholar]
- 10.Ndumele CD, Cohen MS and Cleary PD. Association of State Access Standards With Accessibility to Specialists for Medicaid Managed Care Enrollees. JAMA Intern Med. 2017;177:1445–1451. [DOI] [PMC free article] [PubMed] [Google Scholar]
- 11.Gunja MZ, Collins SR, Doty MM and Beutel S. Insurance Coverage, Access to Care, and Medical Debt Since the ACA: a Look at California, Florida, New York, and Texas. Issue Brief (Commonw Fund). 2017;7:1–12. [PubMed] [Google Scholar]
- 12.Bai G and Anderson GF. Extreme Markup: The Fifty US Hospitals With The Highest Charge-To-Cost Ratios. Health Aff (Millwood). 2015;34:922–8. [DOI] [PubMed] [Google Scholar]
- 13.Brown LD. Commissions, clubs, and consensus: Florida reorganizes for health reform. Health Aff (Millwood). 1993;12:7–26. [DOI] [PubMed] [Google Scholar]
- 14.Murrin S State Standards For Access To Care In Medicaid Managed Care. Department of Health and Human Services; https://oig.hhs.gov/oei/reports/oei-02-11-00320.pdf. Published September 2014. Accessed April 2020. [Google Scholar]
- 15.Rayer S and Wang Y. Measuring Population Density For Counties In Florida. Bureau of Business and Economic Research; https://www.bebr.ufl.edu/population/website-article/measuring-population-density-counties-florida. Published October 14, 2004. Accessed April 2020. [Google Scholar]
- 16.Standard Populations Data. National Cancer Institute; https://seer.cancer.gov/stdpopulations/stdpop.19ages.html. Accessed April 2020. [Google Scholar]
- 17.Distance Matrix API. Google.c https://developers.google.com/maps/documentation/distance-matrix/start. Accessed April 2020.
- 18.https://www.census.gov/geo/maps-data/data/gazetteer2016.html. Last Accessed: April 2020.
- 19.Jordan H, Roderick P, Martin D and Barnett S. Distance, rurality and the need for care: access to health services in South West England. International journal of health geographics. 2004;3:21. [DOI] [PMC free article] [PubMed] [Google Scholar]
- 20.Epstein RH and Dexter F. Development and validation of a structured query language implementation of the Elixhauser comorbidity index. J Am Med Inform Assoc. 2017;24:845–850. [DOI] [PMC free article] [PubMed] [Google Scholar]
- 21.Mylotte D, Osnabrugge RLJ, Windecker S, Lefevre T, de Jaegere P, Jeger R, Wenaweser P, Maisano F, Moat N, Sondergaard L, Bosmans J, Teles RC, Martucci G, Manoharan G, Garcia E, Van Mieghem NM, Kappetein AP, Serruys PW, Lange R and Piazza N. Transcatheter aortic valve replacement in Europe: adoption trends and factors influencing device utilization. Journal of the American College of Cardiology. 2013;62:210–219. [DOI] [PubMed] [Google Scholar]
- 22.Brennan JM, Holmes DR, Sherwood MW, Edwards FH, Carroll JD, Grover FL, Tuzcu EM, Thourani V, Brindis RG, Shahian DM, Svensson LG, O’Brien SM, Shewan CM, Hewitt K, Gammie JS, Rumsfeld JS, Peterson ED and Mack MJ. The association of transcatheter aortic valve replacement availability and hospital aortic valve replacement volume and mortality in the United States. The Annals of thoracic surgery. 2014;98:2016–22; discussion 2022. [DOI] [PubMed] [Google Scholar]
- 23.Vemulapalli S, Carroll JD, Mack MJ, Li Z, Dai D, Kosinski AS, Kumbhani DJ, Ruiz CE, Thourani VH, Hanzel G, Gleason TG, Herrmann HC, Brindis RG and Bavaria JE. Procedural Volume and Outcomes for Transcatheter Aortic-Valve Replacement. N Engl J Med. 2019;380:2541–2550. [DOI] [PubMed] [Google Scholar]
- 24.Langabeer JR, Henry TD, Kereiakes DJ, Dellifraine J, Emert J, Wang Z, Stuart L, King R, Segrest W, Moyer P and Jollis JG. Growth in percutaneous coronary intervention capacity relative to population and disease prevalence. J Am Heart Assoc. 2013;2:e000370. [DOI] [PMC free article] [PubMed] [Google Scholar]
- 25.McCarthy FH, Savino DC, Brown CR, Bavaria JE, Kini V, Spragan DD, Dibble TR, Herrmann HC, Anwaruddin S, Giri J, Szeto WY, Groeneveld PW and Desai ND. Cost and contribution margin of transcatheter versus surgical aortic valve replacement. J Thorac Cardiovasc Surg. 2017;154:1872–1880 e1. [DOI] [PMC free article] [PubMed] [Google Scholar]
- 26.National Healthcare Quality and Disparities Report chartbook on rural health care. Rockville, MD: Agency for Healthcare Research and Quality; 2017;AHRQ Pub. No. 17(18)-0001–2-EF. [PubMed] [Google Scholar]
- 27.Kirkner RM. Certificate of Need: ‘70s Remnant Shows Its Age. Manag Care. 2016;25:11–2. [PubMed] [Google Scholar]
- 28.Chaiyachati KH, Hubbard RA, Yeager A, Mugo B, Lopez S, Asch E, Shi C, Shea JA, Rosin R and Grande D. Association of Rideshare-Based Transportation Services and Missed Primary Care Appointments: A Clinical Trial. JAMA internal medicine. 2018;178:383–389. [DOI] [PubMed] [Google Scholar]
- 29.Phibbs CS and Luft HS. Correlation of travel time on roads versus straight line distance. Medical care research and review : MCRR. 1995;52:532–42. [DOI] [PubMed] [Google Scholar]
Associated Data
This section collects any data citations, data availability statements, or supplementary materials included in this article.