

Abstract

Thin polymer films have found many important applications in organic electronics, such as active layers, protective layers, or antistatic layers. Among the various experimental methods suitable for studying the thermo-optical properties of thin polymer films, temperature-dependent spectroscopic ellipsometry plays a special role as a nondestructive and very sensitive optical technique. In this Review Article, issues related to the physical origin of the dependence of ellipsometric angles on temperature are surveyed. In addition, the Review Article discusses the use of temperature-dependent spectroscopic ellipsometry for studying phase transitions in thin polymer films. The benefits of studying thermal transitions using different cooling/heating speeds are also discussed. Furthermore, it is shown how the analysis and modeling of raw ellipsometric data can be used to determine the thermal properties of thin polymer films.
1. Introduction
Thin polymer films have found many important applications in organic electronics, such as active layers, protective layers, or antistatic layers. A good, specific example of this is the wide range of applications for organic semiconductor poly(3,4-ethylene dioxythiophene) (PEDOT) doped with poly(4-styrenesulfonate) (PSS), which include energy conversion applications (solar cells), antistatic and conductive coatings, capacitors, touch panels, organic light emitting diodes, and printed organic electronics.1−9 Other examples of widely studied thin organic layers are thin layers of poly(3-hexylthiophene-2,5-diyl) (P3HT) and (6,6)-phenyl-C61-butyric (PCBM) explored as active layers in bulk organic solar cells.10−16 Optimization of their effectiveness has become an active branch of research and can be carried out using various physical methods,17−21 e.g., by thermal or vapor annealing,19 by dopant addition,18,22 or by introducing auxiliary layers to photovoltaic structures.23
To properly design organic optoelectronic devices, it is necessary to learn the thermo-optical properties of the thin polymeric layers used in their construction. These materials must ensure adequate time stability of many important parameters in addition to the specific physical properties characteristic of the planned device. In particular, it is extremely important to determine the optimal operating temperature range, including peak operating temperatures. Therefore, the glass transition temperature (Tg)24−28 of polymeric materials and their thin films used in organic electronics is one of the most important physical parameters routinely taken into account at the device planning stage. Its value determines the stability limits of the material microstructure and the stability of material parameters such as thermal expansion or stiffness modulus. For these reasons, the glass transition is the subject of intensive studies in the material science, chemistry, and physics of condensed matter. The results of these studies have been presented in many scientific articles, including both theoretical and experimental studies, see refs (29−39) and the references therein.
Among the various experimental methods suitable for studying the thermo-optical properties of thin polymer films, temperature-dependent spectroscopic ellipsometry plays a special role.40 A recent review by Erber et al.40 concerning the determination of the glass transition of polymers in nanoscopic films takes into account the role of the substrate, interfaces, and their dimensional confinement. The authors discussed the influence of polymer film thickness, i.e., the confinement effect, on Tg. They pointed out the unique role of temperature-dependent ellipsometry as a nondestructive and very sensitive optical technique. The use of spectroscopic ellipsometry as a highly sensitive and noninvasive method to obtain fundamental information about conjugated polymer films has been overviewed by Campoy-Quiles et al.41 They discussed the wide possibilities of using in situ ellipsometry to characterize phase behavior in quasi-isothermal experiments. Their work also includes a brief discussion of information that can be derived directly from the raw ellipsometric angles. This discussion is based on the empirical observation that the ellipsometric parameters usually change approximately linearly with the thickness of the layer.
However, issues related to the physical origin of the dependence of ellipsometric angles on temperature have not been adequately discussed in the literature so far. This review article is attempting to fill this gap. In addition, this article discusses the use of temperature-dependent spectroscopic ellipsometry for studying phase transitions in thin polymer films. The benefits of studying thermal transitions using different cooling/heating speeds and a modulated-temperature technique35 are also discussed. Furthermore, it shows how the analysis and modeling of raw ellipsometric data can be used to determine the thermal properties of thin polymer films. This work also discusses the latest, interesting results regarding thermo-optical properties of thin organic layers irreducibly adsorbed on the substrate.42−44
2. Structural Order within Polymer Films and Phase Transitions Occurring in Them
It is not an exaggeration to say that we live in an era of plastics. Plastics successfully replace metal, and their important applications in various industries are so numerous that it is difficult to count them. Their success results mainly from their ease of production and processing, as well as from the diversity of their properties. All plastics are polymeric materials, but not vice versa. Their properties are widely discussed in the scientific literature, e.g.45−49 These properties, which can be examined ellipsometrically, will be briefly discussed here. Our description mainly concerns the features of thin polymer films associated with their microstructure and morphology. In general, long-range three-dimensional order at the atomic scale occurs in the crystalline state of matter. On the other hand, the lack of such a structural order is characteristic of the amorphous phase.50−53 In nature, the crystalline state is more energetically favorable because the energy of an ordered system of atoms or molecules is lower than the energy of an unstructured one.
Usually, the polymers contain crystalline and amorphous regions. A helpful parameter in determining whether a polymer is partially crystalline is the degree of crystallinity. The two-phase microstructure of a polymer can be related to the degree of crystallinity, C, as follows:54−60
| 1 |
where ρc is the density of completely crystalline polymer, ρs is the density of the sample under consideration, and ρa is the density of completely amorphous polymer.
Crystalline phase formation depends on the architecture of the polymer chain, the polymerization method, and the method of crystallization (which is related to the temperature and the rate of cooling). An example of an almost completely amorphous polymer for which crystallinity degree is approximately zero is atactic polypropylene. Examples of partially crystalline polymers include poly(ethylene terephthalate) (PET) and polyethylene (PE). PET has a degree of crystallinity of 30–40%, and low-density polyethylene (LDPE) has C in the range of 45–55%, while high-density polyethylene (HDPE) has C possible in the range 70–80%.61 Most commercial polymeric materials are partially crystalline polymers with different degrees of crystallinity.59 In amorphous polymers, it is only possible to distinguish the local order within a diameter of about 1 nm. The crystalline regions may be as small as about 2 nm in one or two crystallographic directions, and usually less than 50 nm in the remaining.62,63 The crystallization kinetics of polymeric materials is frequently described by the Avrami equation,64−67 which represents changes in the volume fraction of the crystallized phase as a function of time.
The thermal transition with the characteristic features of a second-order phase transition (continuous, not stepwise change according to Landau’s theory) that can be observed in amorphous polymers, and therefore also in partially crystalline polymers, is the glass transition in which a polymer melt changes on cooling to a polymer glass or a polymer glass changes on heating to a polymer melt.70 The glass transition is not an equilibrium transformation, unlike other phase transitions.70−69 This means that during cooling, the supercooled polymer melt undergoes kinetic slowdown rather than the rapid loss of entropy. While cooling, at the glass transition the viscosity of the material increases rapidly and is accompanied by a change in the heat capacity, a decrease in the coefficient of expansion and a significant increase in the relaxation time, among others. Fakhraai and Forrest71 probed slow dynamics in supported thin polymer films using variable cooling rate ellipsometric measurements of polystyrene. By relating the cooling rate to the relaxation time, they showed that the relaxation dynamics of thin films appear to follow the Arrhenius equation within an activation energy that decreases with decreasing film thicknesses.
Thermal transitions occurring in semicrystalline polymers can be described by appropriate characteristic temperatures on a typical DSC curve, as shown in Figure 1. The first of these is the glass transition occurring at Tg. The following shows the cold crystallization at Tcc, crystallization at Tc, as shown in Figure 2, and melting at Tm. At higher temperatures, the processes of oxidation and degradation of polymers are also visible.
Figure 1.

Thermal transitions occurring in polymers, developed using the idealized DSC curve (heating scan), based on ref (60).
Figure 2.

Thermal transitions occurring in polymers, developed using the idealized DSC curve (cooling scan), based on ref (60).
3. Theoretical Background of Temperature-Dependent Ellipsometry
3.1. Basics of Ellipsometry
Ellipsometry is an optical technique that enables accurate, indirect optical measurements of film thickness and the dielectric properties of materials. Essentially, an ellipsometer is an optical device that measures the ratio of the intensity of orthogonally polarized light components reaching its detector. The very high sensitivity of this optical technique allows a researcher to follow changes in the polarization of light caused by its interaction with matter.
The basics of ellipsometry are widely described in many books72−79 and scientific articles.80−83 For the purpose of this Review Article, a brief introduction on reflection ellipsometry is presented here. Ellipsometry is based on an optical phenomenon in which linearly polarized light is reflected (or transmitted) at the boundary of two media, changing the polarization to elliptical. In the case of optically isotropic materials, this property of reflected light can be described in the following matrix equation:
| 2 |
where Eνa denotes
the complex amplitude of the electric field component of the incident
light beam, a = i, or the reflected
light beam, a = r, which in addition
can be polarized in two orthogonal directions, either ν = p or ν = s;  are polarization-dependent Fresnel reflection
coefficients. The diagonal form of the reflection matrix in eq 2 indicates the absence
of mixing p and s polarized components
of light waves upon reflection in the group of materials considered.
Standard ellipsometry measures the complex reflectance ratio ρ:81
are polarization-dependent Fresnel reflection
coefficients. The diagonal form of the reflection matrix in eq 2 indicates the absence
of mixing p and s polarized components
of light waves upon reflection in the group of materials considered.
Standard ellipsometry measures the complex reflectance ratio ρ:81
| 3 |
where Ψ and Δ are ellipsometric angles. This pair of angles fully describes the polarization ellipse, in a plane perpendicular to the direction of light propagation, and through eq 3 their relationship with the measured quantity ρ. In turn, this ellipse can equally well be described by another pair of angles, namely, ellipticity and azimuth, which better reflect the name of this experimental technique as ellipsometry. For the simplest optical system, consisting of two isotropic infinite media, designated by indexes 0 and 1, with one boundary plane in which reflection and transmission of the incident light beam occurs, which is shown in Figure 3, the explicit form of reflection coefficients rp = r01p and rs = r01 is as follows:79
| 4 |
Here, ñ0 and ñ1 are the complex refractive indices for these two media, and corresponding angles of the light propagation θ0 and θ1 within the specific medium are related to each other by Snell’s law:
| 5 |
Figure 3.

Three-phase optical system.
It follows thus from eqs 3, 4, and 5 that
the experimentally measured complex quantity ρ for the two-phase
optical system is a function of ñ0, ñ1, and θ0.
Of course, this list should be supplemented with a wavelength of light
λ, which has not yet been explicitly considered, because it
manifests itself implicitly through the spectral dependence of the
relevant refractive indexes. For completeness, it is worth adding
that in the complex refractive index  the real part is the refractive
index n, which describes the change in the speed
of light propagation
in a given medium, and its imaginary part is the extinction coefficient k describing the absorption properties of this medium; for
a transparent medium, k = 0. In the real world, it
often happens that the boundary between two media is in the form of
a thin layer with different optical properties. This can be caused,
for example, inevitably by the presence of surface roughness or intentionally
by deposition of a thin film on the substrate. In such cases, the
three-phase optical system, sketched in Figure 3, is a much more correct description. Due
to the fact that ellipsometry is an experimental technique showing
high sensitivity to the thickness of such a layer, we will also present
formulas for the complex reflection coefficients rp and rs for a three-phase optical system.
the real part is the refractive
index n, which describes the change in the speed
of light propagation
in a given medium, and its imaginary part is the extinction coefficient k describing the absorption properties of this medium; for
a transparent medium, k = 0. In the real world, it
often happens that the boundary between two media is in the form of
a thin layer with different optical properties. This can be caused,
for example, inevitably by the presence of surface roughness or intentionally
by deposition of a thin film on the substrate. In such cases, the
three-phase optical system, sketched in Figure 3, is a much more correct description. Due
to the fact that ellipsometry is an experimental technique showing
high sensitivity to the thickness of such a layer, we will also present
formulas for the complex reflection coefficients rp and rs for a three-phase optical system.
To this end, it can be seen that such an optical system consists of two parallel boundary planes spaced apart by the layer thickness. Therefore, the total amplitude of the reflected wave, in addition to the contribution from the reflection of the incident beam from the upper surface, also includes the contribution derived from all secondary reflections in the layer. Each time the secondary light wave travels the distance between these planes, it obtains an additional phase shift. All this can be expressed mathematically as the following infinite geometric series.80
| 6 |
Here, t01ν and t10 are the Fresnel transmission coefficients of the secondary waves entering and leaving the layer while the change in phase b depending on the wavelength λ, the thickness of the layer h, the refractive index of the layer ñ1, and cos(θ1) is as follows:
| 7 |
Finally, the complex
reflection coefficients rp and rs for a three-phase
optical system are calculated
on the basis of eq 2 for Eνr with ν = p, s using eqs 6 and 7. It is worth noting that these equations
depend on the product hñ1, by the
quantity b. As such, this relationship causes difficulties
in accurately determining the thickness of the layer for thin layers,
for example, thinner than 20 nm; see, for example, ref (81) and references therein.
On the other hand, the use of variable angle spectroscopic ellipsometry79 can significantly increase the accuracy of determining
both the refractive index and the thickness of the layer. Of course,
the variable angle in this technique means changing the angle, θ0, of incidence of the light beam. The hierarchy of optical
models in terms of their complexity extends from the simplest two-phase
models through three-phase models to multiphase or multilayer models.
We postpone the discussion of the basic methods for determining the
thickness of the layer and/or its refractive index using ellipsometry
to Section 5. Nevertheless,
it should be mentioned here that, in ellipsometry, often such quantities
as complex refractive index and complex dielectric function, ε̃,
are used interchangeably because of their mutual relationship ε̃
= ñ2. For optically isotropic materials,
these dielectric functions have no directional dependence. Uniaxial
anisotropic materials with their optical axis oriented perpendicular
to the surface, such as, e.g., spin-coated PEDOT:PSS or ordered P3HT
phase, are still described by eq 2.2,82 However, their principal dielectric functions
are no longer scalar values, but εx = εy ≠ εz, where ετ, τ = x, y, z denote τ-component
of the dielectric function of a given material. In the case of materials
with uniaxial optical anisotropy whose optical axis is oriented in
the z direction, their component of the dielectric
function in the plane, 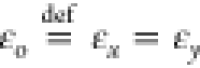 , is described as ordinary and
that off-plane,
, is described as ordinary and
that off-plane,  , respectively, as extraordinary. At this
stage, the question of why structural phase transitions can be investigated
by means of spectroscopic ellipsometry should be asked. To answer
this question, the dependence of the refractive index on temperature
should be considered.
, respectively, as extraordinary. At this
stage, the question of why structural phase transitions can be investigated
by means of spectroscopic ellipsometry should be asked. To answer
this question, the dependence of the refractive index on temperature
should be considered.
3.2. Temperature-Dependent Spectroscopic Ellipsometry
Adding the possibility of heating or cooling the sample in a controlled manner during ellipsometric measurements enables thermal analysis of the tested sample. This opens a method to study the dielectric properties of thin polymer films during glass transition or other structural phase changes. Transitions, such as crystallization or melting, as well as the entire spectrum of thermal properties of different materials, can be examined by temperature-dependent ellipsometry, just like in thermal analysis. Optical properties and film thickness are influenced by the thermal expansion. The thickness of the film usually increases, and the refractive index decreases with a temperature increase; see, e.g., refs (83−95). This can be seen by writing an expression for the thermally induced increment dh of the film thickness h upon a temperature increase by dT:
| 8 |
where αh is the linear thermal expansion coefficient (TEC), explicitly defined as
| 9 |
The expression for an increase in the refractive index, dn, can be obtained from the Lorentz–Lorenz equation,96−98 which relates n with the mass density, δ, molecular weight, M, and molecular polarizability, γ, which in turn also depends on δ, by the following relationship:
| 10 |
where NA is the Avogadro number. Therefore, three different thermal effects δ(T), γ(δ(T)), and γ(T) can contribute to the dependence of the refractive index, n, on the temperature. So, the thermo-optic coefficient (TOC), β, defined as
| 11 |
can be written as99
| 12 |
where 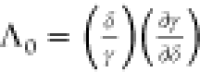 is the polarity coefficient, αV is the thermal expansion coefficient (causing a change in
the mass density), and the subscript 0 indicates that the values of
the respective quantities are set at a certain reference temperature, T0. It should be noted that it is the experimental
study of the linear relationship β(αV) that
can be used to determine the values of both quantities Λ0 and
is the polarity coefficient, αV is the thermal expansion coefficient (causing a change in
the mass density), and the subscript 0 indicates that the values of
the respective quantities are set at a certain reference temperature, T0. It should be noted that it is the experimental
study of the linear relationship β(αV) that
can be used to determine the values of both quantities Λ0 and  . Namely, (i) the presence of the temperature-dependent
density
. Namely, (i) the presence of the temperature-dependent
density  in eq 10 leads to
the appearance of αV in
the first term of eq 12, which corresponds to the number 1 in the first parentheses; (ii)
the nonzero value of γ(δ(T)) causes a
deviation from 1 by Λ0, which is proportional to
αV; and (iii) the direct dependence of γ on T causes a β shift which is independent of αV. We will also notice that the minus sign preceding the first
term in eq 12 takes
into account the fact that, as the temperature rises, the density
decreases. The coefficients of thermal expansion in eqs 8 and 12 are
not the same and are, therefore, marked differently. In eq 8, αh is the linear coefficient of thermal expansion, whereas in eq 12, αV is the volume coefficient of thermal expansion.100 For isotropic bulk materials, a simple relationship, αh ≈ (1/3)αV, is fulfilled.101 However, for thin polymer films, volume thermal
expansion may be highly anisotropic and dependent on the polymer–substrate
interaction character.99,102
in eq 10 leads to
the appearance of αV in
the first term of eq 12, which corresponds to the number 1 in the first parentheses; (ii)
the nonzero value of γ(δ(T)) causes a
deviation from 1 by Λ0, which is proportional to
αV; and (iii) the direct dependence of γ on T causes a β shift which is independent of αV. We will also notice that the minus sign preceding the first
term in eq 12 takes
into account the fact that, as the temperature rises, the density
decreases. The coefficients of thermal expansion in eqs 8 and 12 are
not the same and are, therefore, marked differently. In eq 8, αh is the linear coefficient of thermal expansion, whereas in eq 12, αV is the volume coefficient of thermal expansion.100 For isotropic bulk materials, a simple relationship, αh ≈ (1/3)αV, is fulfilled.101 However, for thin polymer films, volume thermal
expansion may be highly anisotropic and dependent on the polymer–substrate
interaction character.99,102
Wide areas of polymer
applications have been stimulating intensive
research into polymer thermo-optical properties for many years. The
thermo-optic coefficients of 10 polymers with diverse chemical structures
were analyzed by Zhang et al.99 The authors
found a linear relationship between TOCs and corresponding TECs, with
a directional coefficient of −0.56 and an intercept  of −3.7 × 10⁻⁶ which directly relates
to the linear dependence β(αV) described by eq 12. We show this relationship
in Figure 4, because
it allows easy estimation of the
value of one of the two parameters involved, as well as comparison
of the determined values with the published data.
of −3.7 × 10⁻⁶ which directly relates
to the linear dependence β(αV) described by eq 12. We show this relationship
in Figure 4, because
it allows easy estimation of the
value of one of the two parameters involved, as well as comparison
of the determined values with the published data.
Figure 4.

Thermo-optic coefficients of various polymers, based on ref (99).
Ellipsometry is sensitive both to the thickness of the film and its refractive index, i.e., ρ(n, h).103 Therefore, four thermal effects contribute to the dependence of ρ(Ψ, Δ) on temperature. Three of them, mentioned above, contribute to the dependence of the refractive index n on temperature, which within the linear approximation and definition β given by eq 11 can be written as follows:
| 13 |
However, the fourth effect results from the dependence of the film thickness, h, on the temperature. Let us explain in more detail the origin of the fourth effect. Basically, the coefficient of thermal expansion is an anisotropic quantity. Given a thin layer with uniaxial symmetry, its average volume TEC can be written as αV ≈ αx + αy + αz, where αi, i = x, y, and z, are linear TEC in x, y, and z directions, and αx = αy ≠ αz, respectively. Now it is easy to see, from eqs 12 and 13, that the thermo-optical properties (n(T), β0) of the layer are affected by αV with a nontrivial volumetric effect. However, h(T) will still change only under the influence of αz. Campoy-Quiles et al.41 gave a brief overview of information that can be obtained directly from the raw ellipsometric angles. Their discussion is based on the empirical observation that the ellipsometric parameters usually change approximately linearly with the thickness of the layer. However, on the basis of the above discussion, we can determine the range of its application, namely, to isotropic films, i.e., those for which the following equality holds: αh ≈ (1/3)αV.
Summarizing the information
provided here, we will list the quantities
necessary to determine the thermo-optical properties of thin polymer
films, which can be determined using temperature-dependent ellipsometry,
namely, n0, β0, and αh. Of course, the use of spectroscopic ellipsometry
allows us to determine the spectral dispersion n0 and β0. However, if we additionally know
αV, we can also determine Λ0, taking
into account that  for polymers is a small quantity.99 It
should be remembered that the assumption
αV ≈ 3αh can often be made, especially to estimate the value of Λ0 for relatively thick films.
for polymers is a small quantity.99 It
should be remembered that the assumption
αV ≈ 3αh can often be made, especially to estimate the value of Λ0 for relatively thick films.
According to the literature discussed below, it is often possible to quite accurately determine the characteristic temperature (temperatures) of the thermal transition based on the analysis of raw ellipsometric data. The relevant examples are presented and discussed in Section 4. However, studies of thermal transitions are most often based on determining the appropriate changes in physical quantities, such as thickness h or refractive index n, using ellipsometric data modeling. The issues related to the modeling of ellipsometric data are discussed in more detail in Section 5.
4. Determining the Temperature of Thermal Transitions Based on Analysis of Raw Ellipsometric Data
The issues related to determining glass transition temperatures in thin polymer films based on the analysis of raw ellipsometric data will be discussed first. The observed size of changes in ellipsometric angles caused by a 100 °C sample temperature change does not exceed a few degrees at best. This is directly related to the low numerical value of material parameters such as TEC and TOC. Representative data for polymers are shown in Figure 4. However, one can expect that the linear approximation to the ellipsometric angles, discussed in the previous section, should be sufficiently well met in a wide temperature range on both sides of the thermal transition. This observation also indicates a way to detect thermal transitions. Namely, straight lines should be drawn in the low- and high-temperature ranges for the considered ellipsometric angle, and the point of their intersection will determine the temperature of a given thermal transition.
Clough et al.110 provide an example in which the glass transition temperature was determined based on the analysis of raw ellipsometric data. They studied thin polystyrene films coated on SiOx/Si(100) substrates and performed temperature scans using a single-wavelength Stokes ellipsometer. They annealed the samples at 125 °C for 1 h before measurement. The measurements were taken during the cooling cycle in the temperature range 140–36 °C at 1 °C/min. In Figure 5, the results for a 30 nm thick PS layer are shown. In Figure 5a, the dependence of Ψ vs temperature is presented. The good quality of the experimental data is clearly visible; however, the contrast between the lower and higher border temperatures is not very high in this thin film. Therefore, in order to increase the sensitivity, the authors determined Tg using the temperature dependence of the Ψ derivative as shown in Figure 5b. In this approach, Tg is defined as the midpoint of the higher and lower border temperatures.
Figure 5.

(a) Ellipsometric angle Ψ as a function of temperature. (b) The Ψ derivative as a function of temperature for thin PS film (h = 30 nm). Reprinted with permission from ref (110). Copyright 2011 American Chemical Society.
One of the oldest examples of the use of one-wavelength ellipsometry is the work of Beaucage et al.,91 in which thin layers of polystyrene were studied. This paper presents the dependence of the refractive index as a function of temperature inverse, on the basis of which the glass transition temperature of the tested material was determined.
Another example in which the glass transition temperature was precisely determined on the basis of the analysis of raw ellipsometric data is the work of Fakhraai and Forrest.71 They studied thin polystyrene (PS) films spin-coated on a Pt(50 nm)/Ti/SiN(50 nm)/Si substrate and performed the temperature scans using an EXACTA 2000 fast nulling ellipsometer. The authors determined Tg from the temperature dependence of the analyzer angle derivative at a cooling rate of 6 K/min. In their approach, the Tg was defined as the midpoint of the high border temperature T+ and the low border temperature T–.
A similar method for determining the glass transition temperature can be found in the work of Wang et al.111 These authors investigated the effect of film thickness on its molecular structure and Tg for poly[N-9′-heptadecan-2,7-carbazol-alt-5,5-(4′,7′-di-2-thienyl-2′,1′,3′-benzothia-diazol)] (PCDTBT). Figure 6b, taken from their work, shows Ψ as a function of T at λ = 650 nm for three films that are 102, 62, and 30 nm thick. It is easy to see that their glass transition temperatures, which are 128, 120, and 110 °C, respectively, are closely related to the thickness of the samples. So, this example shows that Tg decreases as the layers become thinner.
Figure 6.

Determination the glass transition temperature of polymer films based on the dependence Ψ on temperature. (a) For PAMS450k. Reprinted with permission from ref (112). Copyright 2000 American Chemical Society. (b) For PCDTBT, with different thicknesses. Reprinted with permission from Wang et al. from ref (111). Creative Commons CC BY license, https://creativecommons.org/licenses/by/2.0.
The glass transition temperature can be determined from the temperature dependencies of both ellipsometric angles, Ψ and Δ. Ouakili et al.113 describe the multiple glass transition phenomena of polystyrene and poly(methyl methacrylate) thin films with thicknesses in range 5–200 nm. Figure 7 presents an example of the dependence Δ(T) for two thin films of polystyrene with a thickness of 9 and 70 nm. The glass transition Tg of these samples is placed at about 80 and 95 °C, respectively.
Figure 7.

Determination of the glass transition of thin films of polystyrene with thickness 9 and 70 nm for Δtaken at 3.0 eV (413 nm) and 4.4 eV (281 nm). Reprinted with permission from ref (113). Copyright 2011 Elsevier.
Similar curves for thin PS films are presented in work of Chandran and Basu.114 They studied the variation of thin films’ glass transition temperatures as well as interface and surface effects for polymer–nanoparticle blend systems by analyzing the dependence Δ(T) for two thin films of polystyrene, containing homogeneously dispersed gold nanoparticles. Thin films with 72 and 78 nm thickness have Tg at about 100 and 103 °C, respectively.
Raw ellipsometric data often cannot be fitted well linearly. Sometimes the calculation of the derivative dΔ/dT allows the characteristic temperatures to be determined with greater accuracy. For example, this is clearly seen in Figure 8a, taken from work of Geng and Tsui,115 where the temperature dependence of Δ(T) is of this nature, while the analysis of dΔ(T)/dT allows a more accurate Tg determination. These tests have been carried out on PMMA films with the same molecular mass deposited on silicon substrates for multiple film thicknesses.
Figure 8.

(a) Dependence Δ and Ψ on temperature and (b) dependence of the derivative of ellipsometric angle Δ on temperature, for the single-layer of PMMA on SiOx (gray) and double-layer PMMA on SiOx (black). Adapted with permission from ref (115). Copyright 2016 American Chemical Society.
It should be emphasized also that Δ(T), in Figure 8a, changes by a few degrees as T increases, but Ψ changes by only a few tenths of a degree, so the noise level should be taken into account. Therefore, the wavelength and angle of incidence at which the best sensitivity can be achieved should also be considered. A good example of this can be found in the work of Lee et al.,142 from which we present Figure 9, showing the spectral dependences of Ψ(λ) and Δ(λ) at 30, 80, 130, and 170 °C, for 110 nm thick PS film deposited on the grafted PS layer. In order to determine the glass transition temperature, two spectral widows have been chosen in this example, namely, 553–563 nm (A) and 734–744 nm (B).
Figure 9.

Spectral dependence of ellipsometric angles Ψ and Δ for the PS film deposited on a grafted PS layer, measured at 30, 80, 130, and 170 °C. Reprinted with permission from ref (142). Copyright 2010 American Chemical Society.
These spectral windows were selected to provide good sensitivity to temperature changes at lower wavelengths and to avoid interference caused by noise at higher wavelengths.
The other characteristic temperatures of thermodynamic phase transitions occurring in thin polymer films were also determined on the basis of the analysis of raw ellipsometric data. The phenomena observed were related to the cold crystallization, melting on the heating cycle, or crystallization on the cooling cycle, in accordance with the thermal transitions sketched in Figure 2. They are usually accompanied by rapid changes in the value of ellipsometric angles as opposed to the glass transition case discussed above.88−117 In Figure 10, the temperature dependence of the ellipsometric angles Ψ(T) and Δ(T), as determined by Campoy-Quiles et al.,41 illustrate these relationships. The authors studied samples of thin films of regioregular (with side chains in head–tail order) P3HT. The kinks observed in Figure 10a,b just below 100 °C during the heating cycle are due to the glass transition of the amorphous phase. The significant changes around 200 °C correspond to the melting of the crystalline phase (during subsequent heating cycle) or crystallization (during the cooling cycle).
Figure 10.

Ellipsometric angles Ψ and Δ as a function of temperature, at λ = 550 nm for regioregular P3HT. Based on data from ref (117).
Another example can be taken from the work of Xu et al.118 who focused on the study of the mobility gradient
of PET chains near the substrate. The authors presented the dependence
Δ(T) and  for thin PET
films; see Figure 11a, where the temperatures
of these thermal transitions were marked. In turn, Figure 11b shows how these transitions
are affected by film thickness. The thickness of the samples was in
the range 17–59 nm, and both transitions were visible only
for films whose thickness was greater than 40 nm. The dipper insight
into the origin of these thermal transitions can be provided by ellipsometric
modeling; see the discussion at the beginning of Section 5.4. We will only mention here
that the interpretation regarding the effect of layer thickness on
the characteristic temperatures of thermal transitions is confirmed
by AFM.118 It is also worth noting that,
as in the case of DSC, subsequent heating and cooling cycles can be
used in temperature-dependent ellipsometry to monitor structural changes
in the polymer layer under investigation.
for thin PET
films; see Figure 11a, where the temperatures
of these thermal transitions were marked. In turn, Figure 11b shows how these transitions
are affected by film thickness. The thickness of the samples was in
the range 17–59 nm, and both transitions were visible only
for films whose thickness was greater than 40 nm. The dipper insight
into the origin of these thermal transitions can be provided by ellipsometric
modeling; see the discussion at the beginning of Section 5.4. We will only mention here
that the interpretation regarding the effect of layer thickness on
the characteristic temperatures of thermal transitions is confirmed
by AFM.118 It is also worth noting that,
as in the case of DSC, subsequent heating and cooling cycles can be
used in temperature-dependent ellipsometry to monitor structural changes
in the polymer layer under investigation.
Figure 11.

Temperature dependence of the ellipsometric angle Δ and its derivative for the thin PET film (a) and temperature of cold crystallization on the surface and for a bulklike part of films of PET with various thicknesses (b). Adapted with permission from ref (118). Copyright 2017 American Chemical Society.
Up to now, in this section, we have focused on issues related to determining the glass transition temperatures of thin polymer films based on the analysis of raw ellipsometric data, presenting representative examples taken from a rich collection of published works. We will now discuss cases in which such analysis provides equivocal results. The problem is the accuracy of determining the temperature of a given thermal transition, which can be affected by several factors, such as those related to the quality of the sample, i.e., surface roughness, and thickness unevenness,40,80 as well as the presence of residual solvent in the samples,119−121 error measurement, noise, a large dispersion of data, and a small range of linear dependence of data values. Problems related to sample imperfections can and should be identified by measuring the degree of depolarization. Also, there are methods, such as optical models, that can take into account the physical imperfection of samples.80 This always happens at the expense of using more complex optical models containing a greater number of specific parameters. Therefore, the best practice is accurate sample selection and the use of only nondepolarizing samples in tests by temperature-dependent spectroscopic ellipsometry.
Experimental data may also be dominated by the thermal properties
of the substrates on which the samples are deposited122 and/or may depend on sample/substrate interaction.102,123,124 For this reason, detailed knowledge
about the temperature-dependent dielectric properties of the substrate
is required, and appropriate substrate selection can greatly facilitate
the analysis of ellipsometric data. A good example illustrating the
influence of the substrate on ellipsometric results is provided by
Glor and Fakhraai.148 Separate physical
processes that can affect the measurement data can be related to the
sorption or desorption of atmospheric gases on the surface of the
sample. In addition, water vapor may also condense on the surface
of the sample. Efremov et al.125 illustrate
well how a vacuum and the presence of residual gases affect the results
of temperature-dependent ellipsometric measurements. Figure 12 presents the dependence  for a thin PS film (thickness 37 nm) determined
at high and low vacuum. As can be seen, at a lower vacuum, positive
dΔ/dT values are maintained up to 50 °C,
and this indicates that the expansion coefficient has a negative value
in this temperature range. The presence of residual gases, whose main
ingredient is water, appearing due to desorption from the surface
of the sample, causes the appearance of negative thermal expansion
coefficient values.
for a thin PS film (thickness 37 nm) determined
at high and low vacuum. As can be seen, at a lower vacuum, positive
dΔ/dT values are maintained up to 50 °C,
and this indicates that the expansion coefficient has a negative value
in this temperature range. The presence of residual gases, whose main
ingredient is water, appearing due to desorption from the surface
of the sample, causes the appearance of negative thermal expansion
coefficient values.
Figure 12.

Derivative  as a function of temperature for thin films
of PS. The heating and cooling cycles under higher vacuums are marked
by Δ and ∇ symbols, respectively. The heating and cooling
cycles under lower vacuums are presented with ▲ and ▼
symbols, respectively.125 Reprinted with
permission from ref (125). Copyright 2008 AIP Publishing.
as a function of temperature for thin films
of PS. The heating and cooling cycles under higher vacuums are marked
by Δ and ∇ symbols, respectively. The heating and cooling
cycles under lower vacuums are presented with ▲ and ▼
symbols, respectively.125 Reprinted with
permission from ref (125). Copyright 2008 AIP Publishing.
We finish this chapter with a brief overview of information that can be obtained directly from raw ellipsometric data in temperature-dependent ellipsometry. Namely, studies of the literature show that it is common practice to determine the glass transition temperature based on raw ellipsometric data, e.g., refs (99,142). Representative examples from the literature on the use of raw ellipsometric data obtained from temperature-dependent ellipsometry are shown in Table 1. Some of these studies are limited to this method of determining the temperature, Tg. It should be remembered, however, that raw temperature-dependent ellipsometric data reflect changes in both layer thickness and refractive index caused by temperature changes. Because these contributions can be competitive, thermal transitions in raw data may also be poorly visible in such cases. For this reason, there is a large group of works in which, apart from analyzing raw ellipsometric data, appropriate ellipsometric modeling is also performed.
Table 1. Representative Examples from the Literature Concerning the Use of Raw Ellipsometric Data Obtained from Temperature-Dependent Ellipsometry.
| investigated polymer system abbreviated name | param used | wavelength (nm)/angle of incidence (deg) | addl param used | investigated thermal transition | ref | |
|---|---|---|---|---|---|---|
| PCDTBT | Ψ(T) | 650 nm | Tg | (111) | ||
| PAMS | Ψ(T) | 631 nm | Tg | (112) | ||
| PS | Ψ(T) | 388 nm | h(T) | Tg | (116) | |
| PMMA | Ψ(T) | Tg | (127) | |||
| PS | Ψ(T) | Tg | (128) | |||
| EVA | Ψ(T) | 631 nm | Tc, Tm | (133) | ||
| PPO, PS | Ψ(T) | 631 nm | Tg | (134) | ||
| APFO3,a P3HT, PFO | Ψ(T) | 550, 800 nm | h(T) | Tc | (135) | |
| PAMS, PS | Ψ(T) | 633 nm | Tg | (140) | ||
| PFO, F8BT | tan Ψ(T) | Tg, Tc | (129) | |||
| F8TBT, F8TBT:PC61BM | tan Ψ(T) | 800 nm | Tg, Ti | (130) | ||
| APFO3 | tan Ψ(T) | 800 nm | h(T) | Tg, Ti | (136) | |
| PFO, F8BT | tan Ψ(T) | Tg | (126) | |||
| PS with nanoparticles | Δ(T) | 350 nm | h(T) | Tg | (114) | |
| i-PMMA | Δ(T) | Tg | (113) | |||
| PMMA | Δ(T) | dΔ/dT(T) | Tg | (115) | ||
| PET | Δ(T) | dΔ/dT(T) | Tc | (118) | ||
| PS, PMMA | Δ(T) | dΔ/dT(T) | Tg | (125) | ||
| i-PMMA | Δ(T) | Tg | (131) | |||
| P3HT:PCBM | Δ(T) | 280 nm | h(T) | Tg, Tc, Tm | (132) | |
| PtBMA | Δ(T) | Tg | (138) | |||
| PMMA | Δ(T) | Tg | (141) | |||
| PMMA | cos Δ(T) | h(T), n(T) | Tg | (93) | ||
| aaHPOH, aaHPOBz, aaHPOSi | Ψ(T), Δ(T) | 589 nm | h(T), n(T) | Tg | (84) | |
| PMMA | Ψ(T), Δ(T) | 450 nm |
h(T), 
|
Tg | (123) | |
| PtBMA LB | Ψ(T), Δ(T) | 497 nm | Tg | (141) | ||
| grafted PS | Ψ(T), Δ(T) | 553–563 nm, 734–744 nm | h(T) | Tg | (142) | |
| PS | Tg | (110) | ||||
| PS | A(T) | Tg | (71) | |||
| PS | A(T), P(T) | h(T), n(T) | Tg | (30) | ||
| PS | A(T), P(T) | h(T), n(T) | Tg | (88) |
Poly[2,7-(9,9-dioctylfluorene)-alt-5,5-(4,7-di-2-thienyl-2,1,3-benzothiadiazole)].
5. Temperature-Dependent Ellipsometric Modeling
In the previous section, the determination of thermal transition temperatures based on analysis of raw ellipsometric data was discussed. Issues regarding the determination of characteristic temperatures using ellipsometric data modeling based on more advanced numerical techniques will be discussed in more detail here. Let us briefly discuss the basic approaches used to determine optical properties by ellipsometry. The simplest one, called the direct inversion method, is just the mathematical operation performed in order to calculate a complex refractive index from measured ellipsometric angles Ψ and Δ. For example, for the simplest optical model that consists of two phases, the refractive index ñ1 of medium 1 can be calculated using eqs 3, 4, and 5 as follows:80
| 14 |
Therefore, eq 14 can be used to calculate ñ1(λ), point by point, from the known dependence of ñ0, Ψ, and Δ on the wavelength, λ. It should be emphasized that direct inversion does not introduce any parametrization on the spectral dependence of ñ1. In contrast, more advanced approaches use such a parametrization. They are intended for a specific group of materials and for a specific range of the light spectrum.72,79,80 A useful and most commonly used parametrization is known as the Cauchy optical model.72−80 The Cauchy dispersion describes the dependence of the refractive index and extinction coefficient on the wavelength according to the following expressions:132
| 15 |
| 16 |
Here, n(λ, T) is the refractive index, and k(λ, T) is the extinction coefficient. Temperature-dependent parameters ni and ki (where i = 0, 1 and 2) are the Cauchy model parameters. A clear advantage of this optical model is that for transparent materials the value of the extinction coefficient can be set to zero, i.e., k(λ, T) = 0, in their spectral transparency range. Moreover, this model also provides a simple description of materials with weak spectral dependence at long wavelengths.72,79,80 Still, a simple optical system consisting of a thin polymer film deposited on a thick substrate, as shown in Figure 3, contains three optical phases: ambient medium, film, and substrate. For this system, ρ = ρ(ñ0, ñ1, h, ñ2, θ, λ) is a function of physical parameters such as the thickness of the polymer film h, the wavelength λ of the incident light at an angle θ, and complex refractive indexes, which in turn may also depend on λ and additional parameters describing their dispersion. In principle, the unknown parameters are determined by fitting the modeled ρm(Ψm, Δm) to the ellipsometric data ρ(Ψ, Δ) using the following relationships:
| 17 |
where the dependence on θ, λ, and T is not explicitly written. Most often in the experimental implementation, ñ0 is 1, because it is atmospheric air, and the method of calculating ñ2 has been described above, so there are only two quantities in eq 17 to determine, namely, ñ1 and h. It still can be considered as a simple case when one of these quantities is known. Because then the second can be accurately determined by adjusting the parameters describing the optical model of the sample to the ellipsometric data. The cases where both the thickness of the film and its refractive index are unknown are more complex. However, it often happens that polymer films are transparent in a fairly wide spectral region. In such cases, it is best to place the film on the light-absorbing substrate and solve the ellipsometric equation for a three-phase system. In the considered cases, the refractive index and film thickness can still be relatively easily determined, using the combined Cauchy model in the transparent area, followed by direct inversion for the entire spectrum; for more details, see, e.g., ref (80) and references therein. However, in practice it looks a bit different; namely, the commercial software provided with the ellipsometer uses robust algorithms based on linear regression,72 which are much more universal and can also be used in much more complex optical systems, e.g., for multilayer systems. Ellipsometric modeling is widely described in the literature, including textbooks, e.g.,72,79 so we will shorten the discussion on this topic to the necessary minimum. Analysis of ellipsometry data is usually performed using linear regression analysis, and the optical constants and film structures, including layer thickness, but not only this, are determined by minimizing fit errors calculated on the basis of the mean squared error function (MSE).72 During modeling, ellipsometric angles Ψm and Δm are calculated for specific values of their parameters and compared with corresponding Ψ and Δ determined experimentally. All this is done as part of one error function that can simultaneously contain data for different incidence angles and experiments with multiple samples, e.g., samples with different layer thicknesses. This procedure is repeated iteratively for changed parameter values in such a way as to minimize the error function.72 At the end of this discussion, we emphasize that, in ellipsometric modeling, verification of results, including analysis of statistical errors and correlations between parameters, is a very important step.
A solid theoretical basis for determining temperature-dependent optical properties is provided by the linear n(T) analysis. However, this is despite the fact that the unified linear analysis of reflection and transmission ellipsometry was developed by Azzam et al.143 already in 1975. The corresponding extension of this linear analysis to temperature-dependent ellipsometry has not yet been reported. Therefore, the techniques discussed so far are used, explicitly taking into account the dependence of the parameters of the optical model and the thickness of the layer on the temperature. However, some tips on temperature-dependent ellipsometry can be given. Namely, an important requirement for reliable modeling of ellipsometric data is that the number of unknown parameters of the model should not be greater than the number of equations used to determine their values.10,104,105 For this reason, ellipsometric studies are often carried out in the spectrally transparent range of the sample being tested, using the direct inversion method or the Cauchy optical model.107 Another important requirement is the validation of the optical model, e.g., by its use to describe the dielectric properties of the tested material at a reference temperature, usually room temperature. In addition, for supported films, knowledge about temperature-dependent dielectric properties of the substrate is also required.148 Usually, the assumption that the refractive index of ambient atmosphere is temperature-independent is sufficiently good (the refractive index of air is approximately constant and near 1). More practical, interesting, and very valuable information on the modeling of temperature-dependent ellipsometric data is provided, for example, by Glor and Fakhraai in ref (148). Also note that when discussing the published results below, we will denote TEC and layer thickness using the symbols from the original articles.
5.1. Determination of Characteristic Temperatures of Thermal Transitions Using Data Modeling
The direct inversion method was used, for example, by Lee et al.142 These authors studied thin layers of PS terminated with hydroxyl groups (PSOH) and PS. Ellipsometric angles Ψ and Δ were measured at an incidence angle of 70° in a very narrow 10 nm spectral range (553–563 nm and 734–744 nm). Figure 13 shows the temperature dependence Ψ, Δ, and thickness, and the appropriate glass transition temperature is marked on all graphs. In addition, the coefficient of thermal expansion of the material before and after the vitreous transition was also marked.142 More reliable results of ellipsometric modeling can be obtained if a wider spectrum of wavelengths is used. This can be achieved by parametrizing the spectral dependence of the complex refractive index. This approach has been successfully used in temperature-dependent spectroscopic ellipsometry to determine h(T) and n(λ, T), for example, in the work of Hajduk et al.,132 where phase transitions occurring in thin films of P3HT, PCBM, and their blends were studied. Figure 14 shows, for example, the dependence of film thickness on temperature for thin layers of these materials.
Figure 13.

Ellipsometric angles Ψ and Δ as a function of temperature, analyzed in 10 nm zones, and thickness dependence on temperature for the 110 nm thin PS film. Reprinted with permission from (142). Copyright 2010 American Chemical Society.
Figure 14.

Thickness as a function of temperature for thin films of P3HT (a), PCBM (b), and their blends (c). Adapted from ref (132). Full Beilstein-Institut Open Access License Agreement 1.1.
The characteristic temperatures visible on these diagrams for pure materials are attributed to glass transitions at 10 °C for P3HT and 110 °C for PCBM, respectively, while cold crystallization occurs at higher temperatures. However, in the case of P3HT:PCBM, Figure 14c, the presence of such a large number of thermal transitions indicates the phase separation in this material; for more details, see (132).
A similar way of using the Cauchy model can be found in Park et al.145 The authors investigated the dependence of Tg on the thickness and composition of thin poly(costyrene-methacrylate) P(S-co-PMMA) and poly(2-vinylpyridine-co-styrene) layers deposited on Si substrates. The glass transition temperature was determined as the abscissa of the intersection point of two linear approximations to the curve on both sides of a given thermal transition. Another example of the use of ellipsometric modeling can be found in the work of Sharp and Forrest,146 who studied the segmental dynamics in thin layers of isotactic poly(methyl methacrylate). More examples of determining Tg based on h(T) and n(T) curves from ellipsometric modeling can be found in.30,83,84,86,88,93,95 In work of E. Bittrich et al.92 thin films of polyimide were studied. They characterized glass transition of these films and analyzed their thermal expansion. Representative results from their work are shown in Figure 15. Although the glass transition temperature has not been determined directly in the plots, it can be seen that the thermal transition is influenced by the film thickness.
Figure 15.

Dependence of thickness d and refractive index n on temperature for thin polyimide films. The samples were cured at temperatures in the range 230–380 °C before measuremets, according to the legend on the right panel. Reprinted with permission from ref (92). Copyright 2017 Elsevier.
At this point, it should be said that the refractive index of the polymer layers can sometimes increase, and their thickness decreases with increasing temperature. An example can be found, e.g., in the work of Jaglarz et al.147 in which thin layers of poly(3-hexylthiophene) P3HT and poly(3-octylthiophene) P3OT were tested. The above behavior was observed at elevated temperatures exceeding 200 °C, and the authors attributed this to structural changes in the films.147 The effect of film shrinkage during their heating can also be caused by the loss of residual solvent and is known in the literature.121,182 A good example of this can be found in the article by Baker et al.,183 presenting methods of studying structural relaxation in polymer films using ellipsometry.
The necessity of standardizing the method of determining the glass transition temperature based on ellipsometric measurements was indicated by Glor and Fakhraai.148 They proposed an appropriate protocol using the variable cooling rate technique. This proposal was based on methodology already explored, inter alia, to study thin polystyrene films in order to show the correlation between the average dynamics of the film and the dynamics of its free surface.149−154 The proposed protocol consists of several steps, starting from rigorous recipes for preparing thin polymer films and determining their thickness. Then, the glass transition temperature can be determined, depending on the cooling rate. The authors indicated the necessary elements of the analysis of the average dynamics of the studied layers. The cooling-rate-dependent Tg measurement (CR-Tg) protocol was included in Glor et al.155 The authors examined thin films of poly(2-vinylpyridine) (P2VP) (with thickness 217 nm), deposited on silicon substrates. They recorded thickness changes during temperature modulation. Relevant plots of the dependence of thickness versus time are shown in Figure 16.155 This example also clearly demonstrates how important it is to accurately account for the thermal expansion coefficient of the substrate.
Figure 16.

Time-dependent temperature changes according to the protocol (CR-Tg) (A) and corresponding thickness calculated for the thin P2VP layer, using the Cauchy model (B). Based on data from ref (155).
In many works aimed at determining Tg, the behavior of the thermal expansion coefficient αh was analyzed as a function of temperature in accordance with eq 9; see, e.g., refs (36, 156−159). However, in practice, instead of eq 9, finite element approximation is used to numerically differentiate layer thickness as a function of temperature. The explicit form for αh(T) in this approximation is as follows:
| 18 |
where ΔT is the temperature step. Kawana and Jones158 used this relation, taking ΔT = 4.2 °C.159 Another phenomenological dependence for the linear TEC was presented by Forrest and Dalnoki-Veress,29 namely
 |
19 |
where w is the temperature width and G, A, M, and B are the parameters describing linear behavior in the vitreous and rubbery states. The changes in αh(T) according to eq 19 are shown in Figure 17. Quite recently, Erber at al.40 used the analytically integrated form of eq 19 to describe the dependence of the layer thickness on temperature:
Figure 17.

Coefficient of linear thermal expansion as a function of temperature with marked fitting parameters G, M, A, B, based on ref (92).
We conclude this section with a brief overview regarding the application of ellipsometric modeling to data obtained from temperature-dependent ellipsometry (Table 2). In the ellipsometric modeling, independent of the temperature, the measured ellipsometric data is used to determine the values of physical quantities, such as h, n, and k. For optical systems with a large number of parameters, the dependence of ellipsometric data on the angle of incidence is also used. However, in temperature-dependent ellipsometry, the amount of recorded data increases so much that these measurements are made practically only for one fixed value of the angle of incidence of light. Therefore, in this experimental method two physical quantities, usually h(T) and n(T), are determined on the basis of measured ρ(Ψ, Δ, T). Among the various experimental techniques used to determine these quantities, temperature-modulated ellipsometry also gives the possibility to distinguish thermal processes that are reversible from those that are irreversible.148
Table 2. Representative Examples from the Literature Regarding the Application of Ellipsometric Modeling to Data Obtained from Temperature-Dependent Ellipsometry.
| investigated polymer system abbreviated name | param used | investigated thermal transition | ref |
|---|---|---|---|
| P3HT:PCBM | h(T) | Tg | (18) |
| PMMA, PS | h(T) | Tg | (85) |
| PS | h(T) | Tg | (87) |
| PS | h(T) | Tg | (89) |
| PFDA | h(T) | Tg, Tm | (90) |
| PS | h(T) | Tg | (100) |
| P(S-co-PMMA) | h(T) | Tg | (145) |
| PS | h(T) | Tg | (148) |
| P2VP | h(T) | Tg | (155) |
| PS | h(T) | Tg | (160) |
| PS, TMPC | h(T) | Tg | (162) |
| PA | h(T) | Tg | (163) |
| PS | h(T) | Tg | (164) |
| PS | h(T) | Tg | (165) |
| PS | h(T) | Tg | (167) |
| PS | h(T), n(T) | Tg | (83) |
| i-PMMA | h(T), n(T) | Tg | (86) |
| P(PFDA-co-MMA) | h(T), n(T) | Tg | (95) |
| i-PMMA | h(T), n(T) | Tg | (146) |
| PS | h(T), n(T) | Tg | (91) |
| Pl | h(T), α(T), n(T) | Tg | (92) |
| PS | α(T) | Tg | (158) |
| PS | α(T) | Tg | (159) |
| PS, PnBMA,a SmBMAb | α(T) | Tg | (166) |
Poly(n-butyl methacrylate).
Styrene/n-butyl methacrylate copolymers.
5.2. Influence of Thin Polymer Film Thickness on Tg
The reduction of the glass transition temperature when the thickness of the film decreases is reported in many scientific articles; see, e.g., the review by Erber et al.40 and ref (42). However, there is evidence that very thin polymer films can also have an increased Tg value than the corresponding bulk materials due to interaction with substrate.42,102 Over 20 years of research on the effects of geometric confinement of polymeric films did not lead to unequivocal results.40,42,91,92,157 There are a large number of scientific works reporting that the glass transition temperature of thin polymer films differs significantly from the bulk value, Tg,bulk.29,34,35,42−44,84−87,126,137,158,168,169 However, the interpretation of these results is not unambiguous and is often controversial.91,92 Undoubtedly, it is widely accepted that surface effects play a decisive role here. Namely, the physical conditions at the interface of the polymer film with the air and/or substrate can be significantly different from those at the center of the film. Striking examples are works devoted to irreversibly adsorbed ultrathin polymer layers, whose thermo-optical properties are precisely the result of a strong interaction with the substrate.42−44 Therefore, taking into account that a glassy transition occurs at temperatures where independent movement of polymer chain segments with lengths of just a few mer units becomes possible.184 It is clear that the controversies mentioned above relate to the thickness of the polymer film, for which the influence of surface layers begins to be significant. Erber et al.40 noticed that most robust results suggest that Tg deviations occur below 15 nm film thicknesses and can be assigned to interfacial interactions. Figure 18 presents results from refs (40, 71, and 116), showing the Tg deviation from the bulk value, Tg,bulk, for thin PS films, deposited on different substrates. In this figure the horizontal line at ΔT = −5° distinguishes somehow arbitrary data with a visible deviation from Tg,bulk. Moreover, the substrate type had no effect on the glass transition temperature for layers with a thickness above 40 nm, while previous reports significantly moved the limit of this effect, even to 100 nm.170−172
Figure 18.

Reduction of the glass transition temperature from the bulk value as a function of PS film thickness: points collected from refs (40, 71, 116). The horizontal line at ΔT = −5° distinguishes data with a visible deviation from Tg,bulk. Solid circles, PS films on SiOx, H-passivated Si, HMDS on SiOx, and Pt substrates (ref (40)); diamonds, empty circles, triangles, films with different molar mass of PS on H-passivated Si (ref (116)); stars, films on Pt substrates (ref (71)).
Kim et al.87 showed the dependence of the thermal expansion coefficient on temperature for two PS layers with thicknesses of 475 and 23 nm. In the case of a very thin layer, the points are very scattered, which makes it difficult to determine the glass transition temperature. The authors used the fast Fourier transform method over 60 data points to obtain a smooth curve and determine Tg more accurately. To explain the effect of scattered points, a three-layer model, first proposed in DeMaggio et al.,172 can be used, where the supported film consists of three layers: the free-surface layer, the middle layer, and the substrate layer (adsorbed layer). Confirmation can be found in Ellison and Torkelson’s work;173 they reported that the value of averaged Tg in thin polymer films depends on their thickness, on the basis of fluorescence measurements. On the other hand, the Tg value in the surface layer of the polymer decreases with respect to the bulk Tg, unlike in the substrate layer. Each component layer consists of cooperatively rearranging regions, in which length is related quantitatively with the length of nanoconfinement (its confinement in nanoscale). The thickness of the layer in which there is a deviation in Tg from Tg,bulk depends on the interaction strength at the interface. When there is a strong interaction between polymer film and substrate, the thickness of such a layer may exceed 100 nm. Further explanations can be found in Kawana and Jones,159 who presented an analysis of ellipsometric data collected on thin PS films (with thickness in the 10–170 nm range) deposited on Si substrates. Similarly to ref (87), the authors observed a significant dispersion of points in the α(T) dependence for layers thinner than 30 nm. An example can be found in Figure 19, which shows the TEC of 29 and 164 nm thick polystyrene films as a function of temperature.
Figure 19.

Relative linear thermal expansion coefficient of thin polystyrene films with thickness 29 and 164 nm as a function of temperature. Reprinted with permission from ref (158). Copyright 2001 American Physical Society.
This was explained by the presence of a thin surface layer with liquid properties. In the study,158 the temperature dependence of the TEC α is normalized to the averaged value of the molten (liquid) phase αliq, for films with different thicknesses. To rationalize results, it was assumed that α(T) of the films consists of the sum of contributions from two phases:158
| 20 |
Here, the labels “liq” and “glass” refer to the quantities in the liquid and glass phases, respectively. Note that this approximation accounts for the existence of the two separated phases in layers with temperature-dependent thicknesses hliq(T) and h – hliq(T), respectively. Figure 20 presents this thickness as a function of temperature. The 10 nm thick liquid-like layer exists even at temperatures well below glass transition.
Figure 20.

Thickness of the average, liquid-like layer of a thin, supported polystyrene film with liquid-like thermal expansion properties as a function of temperature. Based on data from ref (158).
5.3. Dependence of the Coefficient of Thermal Expansion on the Thickness of Irreversibly Adsorbed Layers
Spontaneous interactions that can arise between the rigid surface of the substrate and the soft surface of the polymer cause polymer chains to be more adsorbed to the substrate. Such adsorption may be irreversible due to van der Waals forces. One of the key papers describing the impact of interactions between the layer and the substrate on the glass transition temperature was the work of Wallace et al.102 The tested thin polystyrene layers were deposited on hydrogenated silicon substrates. The thickness of tested films was from 7.5 to 198.8 nm. In this work, the values of the thermal expansion coefficient were measured by means of X-ray reflection. It was shown that thin films less than 40 nm thick did not show a glass transition until the temperature value was at least 60 °C higher than the Tg of the bulk. The coefficient of thermal expansion of these films was described as follows:102
| 21 |
where αnglass is the thermal expansion coefficient of the layer constrained within the substrate in the glassy state and αn is the thermal expansion coefficient of the molten layer, A is the constant characteristic thickness, and h is the thickness of the layer we are interested in. The value of A indicates approximately the thickness for which the change in glass transition temperature is not noticeable. This is the distance over which the substrate affects the polymer film and its Tg. For films thicker than 40 nm, the chains on the free surface have high mobility, which is due to the fact that the glass transition temperature of the surface layer is lower than that in the bulk. However, this relationship does not work for very thin layers (below 40 nm), when the substrate plays a major role and affects the thermal expansion of the material, regardless of whether the chains on the surface have greater mobility. In such cases, we can talk about the compensation of the effect of the free surface of the layer on the temperature Tg through its interaction with the substrate. An interesting example from the literature in which this effect was studied is the work of Perez-de-Eulate et al.174 describing how irreversible adsorption reduces the effect of the free surface on the Tg of thin layers of poly(4-tert-butylstyrene) (PTBS). In particular, the authors determined the dependence of the thickness of an irreversible adsorbed layer on the annealing time of a thin layer of PTBS. Thin PTBS films were deposited by spin coating from polymer solutions on silicon wafers coated with a native oxide layer. The films were deposited at a constant thickness of 200 nm and annealed for various times at 180 °C. Chains that were not adsorbed were removed with the same solvent, and the sample after 10 min of exposure under atmospheric conditions was measured by spectroscopic ellipsometry. Ellipsometric angles Ψ and Δ were fitted using Cauchy’s dispersion, and the multilayer optical model consisted of the following layers: air/PTBS/SiOx/Si. The relation of Dalnoki -Veres175 is used for describing the effect of annealing on the thickness dependence of the Tg:
 |
22 |
where ξ0 is the altered segmental mobility and Rs is the rheological temperature at the free interface. This quantity is derived from parametrization of the dynamics and is indicating the temperature at which the molten bulk layer has the same mobility like a free surface and ξ0 has the length scale associated with perturbation of the glass transition. Figure 21 presents, for PTBS films, the comparison between the time evolution of ΔTg with the recovery of bulk Tg upon annealing and with the kinetics of irreversible adsorption.
Figure 21.

Time evolution of Tg shift for films of PTBS with thickness higher than 45 nm.174 Adapted with permission from ref (174). Copyright 2017 American Chemical Society.
The obtained results suggest that irreversible adsorption at the polymer/substrate interface limits or totally erases the impact of the free surface on the thermal Tg. The free surface does not affect Tg in very thin layers, because the increased mobility of the chains on this surface is balanced by the reduced mobility of the chains that are irreducibly adsorbed on the substrate. Therefore, such very thin layers change into ultraviscous plates, whose flow properties are smaller compared to those of the bulk material.176,177
The mechanism of irreversible adsorption was studied, e.g., in work of Davis et al.,178 where the pure polymers and copolymers of PS and PMMA deposited on silicon wafers were investigated. The difference between adsorption of pure polymers and copolymer is shown in Figure 22.
Figure 22.

Scheme of proposed differences between PS, PMMA, and P(S-r-MMA) adsorbed layers. Based on ref (178).
Polystyrene films show looser surface adsorption than PMMA films, while the P(S-r-MMA) copolymer has more substrate-bound chains than PS and does not show large loops. It is worth noting that the copolymers show a dependence of Tg on the composition of homopolymers, which allows controlling the glass transition temperature by changing their composition accordingly. It is these irreversible adsorbed layers with heterogeneous composition that behave differently. The relationship between the increase in thickness of such a layer and the annealing time at constant temperature (Tg,bulk + 45 K) was measured by ellipsometry. It was shown that the rate of increase in the thickness of the adsorbed film was initially logarithmic (for the first 3 h), and then these changes became almost constant and linear (for the next 32 h). The trend of linear growth rates indicates that thermal chain fluctuations play a smaller role in reducing adsorption than the interaction energy with the substrate, which is associated with so-called packing frustration.
A brief overview of the impact of irreversible adsorption on the mechanisms of thermal expansion of confined 1D polymer layers was given in the paper of Braatz et al.42 In these investigations, thin films of polystyrene were deposited on aluminum and silicon oxide substrates. The thermal expansion coefficient in the direction normal to the substrate was determined using temperature-dependent spectroscopic ellispometry. The ellipsometric angles were fitted to the multilayer model. In particular, thin supported films have been described using a three-layer model to explicitly take into account the presence of a surface layer and one that comes into contact with the substrate. The latter layer is about 4 nm thick and is also known as the dead layer43,44 in which there is no molecular movement; its coefficient of thermal expansion is approximately 0. The structure of these layers is densely packed with loose adsorbed chains.179 It has been shown in a study43 that dead layers have a thermal expansion coefficient greater than zero under the influence of packing frustration.180,181 The dependence of TEC coefficients (here the thermal expansion of irreversible adsorbed layer in glass and melted state) on the thickness of the adsorbed layer, hads, is shown in eq 23 below. Thermal expansion of the interfacial layers, in the melt and glassy states, is enhanced with respect to the bulk values. The film thickness has a similar impact on both thermal expansion coefficients, and the final expression for this dependence can be written as follows:42
| 23 |
This equation is valid for hads > δ(hads), where δ is the thickness of the dead layer. Thorough analysis revealed that excessive thermal expansion occurs near the adsorption layer. This is a characteristic feature of very thin polymer layers, which results from packaging frustration and is independent of the chain length. For the formation, dead layers are responsible the forces immobilizing the chains on the surface, which are also subjected to the packing frustration. It can be concluded that, in fact, the thickness of the dead layer increases for films that are thick enough not to undergo excessive thermal expansion at the joint. In addition, the increase in thermal expansion coefficients TEC indicates that the adsorbed layers are not clearly associated with an increase in Tg.43
5.4. Surface Effects and Thermal Transition Depth Profiles in Thin Polymer Films
We have already discussed
in Section 4 that the
thermal transitions occurring in partially crystalline polymers are
connected with microstructural reorganization of polymeric material
and can be described by appropriate characteristic temperatures. Therefore,
thermodynamic phase transitions, such as cold crystallization, crystallization,
or melting of crystals, can be successfully investigated using the
techniques discussed so far. Changes in the raw ellipsometric angles
associated with thermodynamic phase transitions are often more pronounced.
An example of this is the stepwise crystallization shown in Figure 11, discussed in Section 4, as observed in
thin PET films by Xu et al.118 However,
significantly deeper insight into the origin of these thermal transitions
and their nature can be obtained using ellipsometric modeling. Thus,
in the mentioned example, a multilayer optical model was used, which
included the thickness of the layer adsorbed directly on the substrate,
the thickness of the layer in which the interactions of the substrate
disappear, followed by the bulk type layer, and finally the thin surface
layer in which the increased mobility of polymer chains occurs. The
use of this optical model has allowed for a much more comprehensive
interpretation of the experimental results and, for example, the identification
of a smaller peak as derived from thermally induced structural changes
in the surface layer; for more details, see ref (118). It is worth noting here
that surface effects regarding the difference in the glass transition
temperature between the surface layer and the polystyrene core layer
are described in refs (159−161). Very interesting research in this topic is the work on determining
the depth profiles of thermal transitions in thin polymer films. Such
studies were carried out by Muller et al.135 They tested four different organic semiconductors (among others,
the well-known and widely used P3HT), which are used as active layers
in optoelectronic devices. Transition temperature depth profiles calculated
by the authors included the following: liquid-crystalline melting
temperature ( ), crystalline melting temperature (Tm), and recrystallization temperature (Tc). The authors showed on the example of the
70 nm thick APFO3 film that the average temperature of liquid-crystalline
melting (
), crystalline melting temperature (Tm), and recrystallization temperature (Tc). The authors showed on the example of the
70 nm thick APFO3 film that the average temperature of liquid-crystalline
melting ( ) is dependent on the wavelength of the
applied light. More specifically, the estimated average melting temperature
at a wavelength of 800 nm was approximately 185 °C, while the
reading at λ = 550 nm had a value close to 215 °C. In order
to determine the depth profile of
) is dependent on the wavelength of the
applied light. More specifically, the estimated average melting temperature
at a wavelength of 800 nm was approximately 185 °C, while the
reading at λ = 550 nm had a value close to 215 °C. In order
to determine the depth profile of  , they proposed a model that is a combination
of two phases, where separate sets of the optical parameters describe
the liquid-crystalline phase and the isotropic liquid phase, respectively.
Next, they assumed that below the
, they proposed a model that is a combination
of two phases, where separate sets of the optical parameters describe
the liquid-crystalline phase and the isotropic liquid phase, respectively.
Next, they assumed that below the  temperature, the liquid crystal layer has
no sublayers, and the isotropic liquid is at temperatures greater
than
temperature, the liquid crystal layer has
no sublayers, and the isotropic liquid is at temperatures greater
than  . In addition, in the case of an intermediate
temperature range, the authors examined several models of intermediate
film configurations. A two-layer structure consisting of a liquid
crystal layer on top of the isotropic liquid layer provides the lowest
standard deviation when fitting the model parameters to the ellipsometric
spectra over the entire temperature range.135 An example of thermal transition temperature depth profiles for
five thin polymer films as determined by Muller et al.135 is shown in Figure 23.
. In addition, in the case of an intermediate
temperature range, the authors examined several models of intermediate
film configurations. A two-layer structure consisting of a liquid
crystal layer on top of the isotropic liquid layer provides the lowest
standard deviation when fitting the model parameters to the ellipsometric
spectra over the entire temperature range.135 An example of thermal transition temperature depth profiles for
five thin polymer films as determined by Muller et al.135 is shown in Figure 23.
Figure 23.

Depth profile of the transition temperatures
in thin films of several
blends and polymers:  for APFO-Green9 (poly[2,7-(9,9-dioctylfluorene)]-alt-5,5-(5,10-di-2-thienyl-2,3,7,8-tetraphenyl-pyrazino-[2,3-g]quinoxaline)), APFO3 (poly[2,7-(9,9-dioctylfluorene)-alt-5,5-(4,7-di-2-thienyl-2,1,3-benzothiadiazole)]), and
9:1 APFO3:PCBM: Tm for P3HT and Tc for PFO (poly(9,9-dioctylfluorene)). Thin
film thicknesses are marked on the graph. Reprinted with permission
from ref (135). Copyright
2013 American Chemical Society.
for APFO-Green9 (poly[2,7-(9,9-dioctylfluorene)]-alt-5,5-(5,10-di-2-thienyl-2,3,7,8-tetraphenyl-pyrazino-[2,3-g]quinoxaline)), APFO3 (poly[2,7-(9,9-dioctylfluorene)-alt-5,5-(4,7-di-2-thienyl-2,1,3-benzothiadiazole)]), and
9:1 APFO3:PCBM: Tm for P3HT and Tc for PFO (poly(9,9-dioctylfluorene)). Thin
film thicknesses are marked on the graph. Reprinted with permission
from ref (135). Copyright
2013 American Chemical Society.
As can be seen in this figure, the surface effect is clearly visible for all layers of tested polymer systems. It can be distinguished by rapid changes in transition temperature in a thin surface layer.
The examples discussed in this section show that temperature-dependent spectroscopic ellipsometry also makes it possible to distinguish local thermal transformations (such as glass transition Tg, crystallization temperature Tc, or melting point Tm) on the surface (Ttsurface) from thermal transitions in the bulk of the sample (Ttbulk).
6. Outlook and Ending Remarks
Temperature-dependent spectroscopic ellipsometry is a nondestructive optical technique suitable for experimental polymer science. Frequently, thermal transitions occurring in thin polymer films are clearly visible, so it is possible to determine characteristic temperatures directly from raw ellipsometric data, while detailed analysis of ellipsometric data can provide accurate quantitative information on the dependence of the thickness of polymer films and their optical parameters on temperature. In this work, the methods used to analyze and model raw ellipsometric data have been discussed. Since ellipsometry is sensitive both to the thickness of the film and its refractive index, four thermal effects contribute to the dependence of ellipsometric angles on temperature. Three processes are derived from the dependence of the refractive index n on temperature. The fourth effect results from the dependence of the film thickness on the temperature. The raw ellipsometric data analysis is used to determine the characteristic temperature(s) of the thermal process(es). This analysis works well under the following conditions: (i) the thermo-optical coefficient and thermal expansion coefficient are very weakly dependent on temperature, so the linear relationship for ρ is satisfied; (ii) the data is not noisy and highly dispersed; and (iii) the substrate, on which the film is deposited, has been selected appropriately. Temperature-dependent ellipsometric modeling is more complex and time-consuming because it requires the use of more advanced numerical techniques to analyze large data sets. On the other hand, the advantage of this approach is the ability to determine the temperature dependence of the thermal expansion coefficient, TEC, and the spectral dependence of the thermo-optic coefficient, TOC. The highest level of modeling for temperature-dependent spectroscopic ellipsometry data is to determine the thermal transition depth profiles. It is a spectroscopic technique that not only allows the determination of the characteristic temperatures of thermal transitions of thin polymer films but also indirectly allows a probe of their thermal relaxation times, e.g., by using the variable rate cooling technique. Most results published on this topic concern the reduction of the glass transition temperature of thin polymer films due to the reduction of their thickness. However, recent, reliable results indicate that the method of sample preparation has a big impact. There is now strong experimental evidence that a thin layer of molten polymer, the thickness of which depends on temperature, is formed on the free surface of the polymeric material. In addition, the glass transition temperature depends on the thickness of the thin layer and the nature of its interaction with the substrate.
Temperature-dependent spectroscopic ellipsometry has great potential for more frequent use in determining the thermo-optical properties of thin polymer layers. The development of experimental techniques undoubtedly contributes to this. For example, ellipsometers are currently available that collect data from the entire spectrum in a split second. The examples of application of this experimental technique discussed here clearly show the high accuracy of ellipsometry in determining the TOC and TEC values of thin polymer layers. The attractiveness of temperature-dependent ellipsometry is also increased due to the possibility of filtering thermal processes that are reversible from those that are irreversible, which are offered by the technique of temperature modulation.35,148 We hope that our work will contribute to a significant increase in the number of articles presenting a more complete analysis of the thermo-optical properties of polymer layers, especially those that determine the spectral dispersion of the thermo-optic coefficient and which are clearly lacking in the existing literature. It should also be mentioned that there are visible deficiencies in the theoretical foundations of temperature-dependent ellipsometry, e.g., a lack of linear analysis for ellipsometric angles. Therefore, we trust that our article will give the right impulse and initiate appropriate theoretical research in this direction. It can also be assumed that interesting experimental work will further focus on explaining the relationship between Tg reduction in irreversibly adsorbed layers, the role of the substrate, packing frustration, and free volume.
Acknowledgments
This work has been supported by the National Science Centre, Poland, Grant DEC-2018/02/X/ST5/01418.
Biographies

Barbara Hajduk is currently an adjunct at the Centre of Polymer and Carbon Materials of the Polish Academy of Sciences in Zabrze, Poland. She received the MSc. Eng. in Engineering Physics and Ph.D. in Materials Science from the Silesian University of Technology in Gliwice in 2004 and 2012, respectively. Her main research interests concern preparation and characterization of thin polymer films for optoelectronic and photovoltaic applications. For several years, she has specialized in the study of optical and physical properties of polymer materials using spectroscopic ellipsometry, including in situ investigations using temperature-dependent ellipsometry.

Henryk Bednarski is currently an adjunct at the Centre of Polymer and Carbon Materials of the Polish Academy of Sciences in Zabrze. In 1989, he obtained a master’s degree in physics at the University of Silesia in Katowice. In 1994, he obtained a Ph.D. degree at the Institute of Physics of the Polish Academy of Sciences in Warsaw, and in 2014 the postdoctoral degree in physics at the University of Silesia in Katowice. His scientific interests include the following: description of magnetic and magneto-optical properties of diluted magnetic semiconductors in mass and quantum structures, theory of bound magnetic polarons in diluted magnetic semiconductors and insulators, electronic structure of thin polymer layers, mechanisms of polymer fragmentation in ESI-MS/MS analysis, and ellipsometry of thin polymer films.

Barbara Trzebicka graduated from the Silesian University of Technology and obtained her D.Sc. from the Warsaw University of Technology in 2011 and the professor title from the President of Poland in 2016. Professor Trzebicka is working at the Centre of Polymer and Carbon Materials of the Polish Academy of Sciences in the Laboratory of Nanostructured Polymers. At present she is the director of the institute. The scientific interest of Professor Trzebicka concerns physicochemical studies of stimuli sensitive polymers, amphiphilic polymers and their self-organization, polymers for biomedical applications, polymeric bioconjugates, and carbon materials. Her research was financed by numerous independently granted projects, from both European and Polish sources. Her numerous activities in the organization of scientific efforts include the Regional Fond of Ph.D. scholarships, organization of international conferences, and special issue editing for scientific journals.
The authors declare no competing financial interest.
References
- Hu Z.; Zhang J.; Hao Z.; Zhao Y. Influence of doped PEDOT:PSS on the performance of polymer solar cells. Sol. Energy Mater. Sol. Cells 2011, 95, 2763–2767. 10.1016/j.solmat.2011.04.040. [DOI] [Google Scholar]
- Bednarski H.; Hajduk B.; Jurusik J.; Jarząbek B.; Domański M.; Łaba K.; Wanic A.; Łapkowski M. The Influence of PEDOT to PSS Ratio on the Optical Properties of PEDOT:PSS Thin Solid Films − Insight from Spectroscopic Ellipsometry. Acta Phys. Pol., A 2016, 130 (5), 1242–1244. 10.12693/APhysPolA.130.1242. [DOI] [Google Scholar]
- Iftimie S.; Radu A.; Radu M.; Besleaga C.; Pană I.; Craciun S.; Girtan M.; Ion L.; Antohe S. Influence of PEDOT:PSS layer on the performances of “bulk heterojunction” photovolatic cells based on MEH-PPV:PCBM(1:4) polymeric blends. Digest Journal of Nanomaterials and Biostructures 2011, 6 (4), 1631–1638. [Google Scholar]
- Kula S.; Szlapa - Kula A.; Kotowicz S.; Filapek M.; Bujak K.; Siwy M.; Janeczek H.; Maćkowski S.; Schab - Balcerzak E. Phenanthro[9,10-d]imidazole with thiophene rings toward OLEDs application. Dyes Pigm. 2018, 159, 646–654. 10.1016/j.dyepig.2018.07.014. [DOI] [Google Scholar]
- Bechara R.; Petersen J.; Gernigon V.; Lévéque P.; Heiser T.; Toniazzo V.; Ruch D.; Michel M. PEDOT:PSS-free organic solar cells using tetrasulfonic copper phthalocyanine as buffer layer. Sol. Energy Mater. Sol. Cells 2012, 98, 482–485. 10.1016/j.solmat.2011.11.005. [DOI] [Google Scholar]
- Saghaei J.; Fallahzadeh A.; Saghaei T. ITO-free organic solar cells using highly conductive phenol-treated PEDOT:PSS anodes. Org. Electron. 2015, 24, 188–194. 10.1016/j.orgel.2015.06.002. [DOI] [Google Scholar]
- Choi J. K.; Jin M. L.; An C. J.; Kim D. W.; Jung H.-T. High-Performance of PEDOT/PSS Free Organic Solar Cells on an Air – Plasma - Treated ITO Substrate. ACS Appl. Mater. Interfaces 2014, 6, 11047–11053. 10.1021/am4049964. [DOI] [PubMed] [Google Scholar]
- Kotowicz S.; Korzec M.; Siwy M.; Golba S.; Malecki J. G.; Janeczek H.; Mackowski S.; Bednarczyk K.; Libera M.; Schab-Balcerzak E. Novel 1,8-naphthalimides substituted at 3-C position: Synthesis and evaluation of thermal, electrochemical and luminescent properties. Dyes Pigm. 2018, 158, 65–78. 10.1016/j.dyepig.2018.05.017. [DOI] [Google Scholar]
- Savva A.; Georgiou E.; Papazoglou G.; Chrusou A. Z.; Kapnisis K.; Choulis S. A. Photovoltaic analysis of the effects of PEDOT:PSS – additives hole selective contacts on the efficiency and life time performance of inverted organic solar cells. Sol. Energy Mater. Sol. Cells 2015, 132, 507–514. 10.1016/j.solmat.2014.10.004. [DOI] [Google Scholar]
- Bednarski H.; Hajduk B.; Domański M.; Jarząbek B.; Nitschke P.; Łaba K.; Wanic A.; Łapkowski M. Unveiling of Polymer/Fullerene Blend Films Morphology by Ellipsometrically Determined Optical Order within Polymer and Fullerene Phases. J. Polym. Sci., Part B: Polym. Phys. 2018, 56, 1094–1100. 10.1002/polb.24627. [DOI] [Google Scholar]
- Yue G.; Wu J.; Xiao Y.; Lin J.; Huang M. Flexible solar cells based on PCBM/P3HT heterojunction. Frontiers of Optoelectronics in China 2011, 4 (1), 108–113. 10.1007/s12200-011-0203-4. [DOI] [Google Scholar]
- Kupijai A. J.; Behringer K. M.; Schaeble F. G.; Galfe N. E.; Corazza M.; Gevorgyan S. A.; Krebs F. C.; Stutzmann M.; Brandt M. S. Bipolar polaron pair recombination in P3HT/PCBM solar cells. Phys. Rev. B: Condens. Matter Mater. Phys. 2015, 92, 245203. 10.1103/PhysRevB.92.245203. [DOI] [Google Scholar]
- Gupta A.; Praveen S.; Kumar A.; Shree P.; Mishra S.; Joseph C. M. Preparation and characterisation of P3HT-PCBM Organic Solar Cells. International Journal of Electrical and Electronics Engineering 2012, 1 (4), 13–15. [Google Scholar]
- Iwan A.; Boharewicz B.; Tazbir I.; Sikora A.; Schab - Balcerzak E.; Grucela - Zajac M.; Skorka Ł. Structural and electrical properties of mixture based on P3HT:PCBM and low band gap naphthalene diimide-imines. Synth. Met. 2014, 189, 183–192. 10.1016/j.synthmet.2014.01.016. [DOI] [Google Scholar]
- Berger P. R.; Kim M. Polymer solar cells: P3HT:PCBM and beyond. J. Renewable Sustainable Energy 2018, 10, 013508. 10.1063/1.5012992. [DOI] [Google Scholar]
- Swart H. C.; Ntwaeaborwa O. M.; Mbule P. S.; Dhlamini M. S.; Mothudi B. B. P3HT: PCBM Based Solar Cells: A Short Review Focusing on ZnO Nanoparticles Buffer Layer, Post-Fabrication Annealing and an Inverted Geometry. J. Mater. Sci. Eng. B 2015, 5 (1–2), 12–35. 10.17265/2161-6221/2015.1-2.002. [DOI] [Google Scholar]
- Chang S.-C.; Hsiao Y.-J.; Lin T.-C.; Li T.-S.; Zeng S.-A.; Yu C.-E. Improving Power Conversion Efficiency of P3HT/PCBM based Organic Solar Cells by Optimizing Graphene Doping Concentration and Annealing Temperature. Int. J. Electrochem. Sci. 2016, 11, 5819–5828. 10.20964/2016.07.72. [DOI] [Google Scholar]
- Pearson A. J.; Wang T.; Jones R. A. L.; Lidzey D. G.; Staniec P. A.; Hopkinson P. E.; Donald A. M. Rationalizing Phase Transitions with Thermal Annealing Temperatures for P3HT:PCBM Organic Photovoltaic Devices. Macromolecules 2012, 45, 1499–1508. 10.1021/ma202063k. [DOI] [Google Scholar]
- Cheng C.-E.; Dinelli F.; Yu C.-T.; Shih H.-W.; Pei Z.; Chang C.-S.; Chien F. S.-S. Influences of thermal annealing on P3HT/PCBM interfacial properties and charge dynamics in polymer solar cells. Jpn. J. Appl. Phys. 2015, 54, 122301. 10.7567/JJAP.54.122301. [DOI] [Google Scholar]
- Yoshida K.; Oku T.; Suzuki A.; Akiyama T.; Yamasaki Y. Fabrication and Characterization of PCBM:P3HT Bulk Heterojunction Solar Cells Doped with Germanium Phthalocyanine or Germanium Naphthalocyanine. Mater. Sci. Appl. 2013, 4, 1–5. 10.4236/msa.2013.44A001. [DOI] [Google Scholar]
- Stubhan T.; Salinas M.; Ebel A.; Krebs F. C.; Hirsch A.; Halik M.; Brabec C. J. Increasing the Fill Factor of Inverted P3HT:PCBM Solar Cells Through Surface Modification of Al-Doped ZnO via Phosphonic Acid-Anchored C60 SAMs. Adv. Energy Mater. 2012, 2 (5), 532. 10.1002/aenm.201100668. [DOI] [Google Scholar]
- Das S.; Alford T. L. Improved efficiency of P3HT:PCBM solar cells by incorporation of silver oxide interfacial layer. J. Appl. Phys. 2014, 116, 044905. 10.1063/1.4891246. [DOI] [Google Scholar]
- Zhuo Z.-L.; Wang Y.-S.; He D.-W.; Fu M. Improved performance of P3HT:PCBM solar cells by both anode modification and short-wavelength energy utilization using Tb(aca)3phen. Chin. Phys. B 2014, 23 (9), 098802. 10.1088/1674-1056/23/9/098802. [DOI] [Google Scholar]
- Roth C. B.; Dutcher J. R. Glass transition and chain mobility in thin polymer films. J. Electroanal. Chem. 2005, 584, 13–22. 10.1016/j.jelechem.2004.03.003. [DOI] [Google Scholar]
- Berthier L.; Biroli G. Theoretical perspective on the glass transition and amorphous materials. Rev. Mod. Phys. 2011, 83, 587–645. 10.1103/RevModPhys.83.587. [DOI] [Google Scholar]
- Hutchinson J. M. Determination of the glass transition temperature Methods correlation and structural heterogeneity. J. Therm. Anal. Calorim. 2009, 98 (3), 579–589. 10.1007/s10973-009-0268-0. [DOI] [Google Scholar]
- Kalogeras I. M.; Hagg Lobland H. E. The nature of the glassy state: structure and glass transitions. Journal of Materials Education 2012, 34 (3–4), 69–94. [Google Scholar]
- Jadhav N. R.; Gaikwad V. L.; Nair K. J.; Kadam H. M. Glass transition temperature: Basics and application in pharmaceutical sector. Asian J. Pharm. 2009, 3 (2), 82–89. 10.4103/0973-8398.55043. [DOI] [Google Scholar]
- Forrest J. A.; Dalnoki-Veress K. The glass transition in thin polymer films. Adv. Colloid Interface Sci. 2001, 94, 167–196. 10.1016/S0001-8686(01)00060-4. [DOI] [Google Scholar]
- Bäumchen O.; McGraw J. D.; Forrest J. A.; Dalnoki-Veress K. Reduced Glass Transition Temperatures in Thin Polymer Films: Surface Effect or Artifact?. Phys. Rev. Lett. 2012, 109, 055701. 10.1103/PhysRevLett.109.055701. [DOI] [PubMed] [Google Scholar]
- de Gennes P. G. Glass transitions in thin polymer films,. Eur. Phys. J. E: Soft Matter Biol. Phys. 2000, 2, 201–205. 10.1007/PL00013665. [DOI] [Google Scholar]
- Batistakis C.; Lyulin A. V. Simulated glass transition in thin polymer films: Influence of truncating the non-bonded interaction potentials. Comput. Phys. Commun. 2014, 185, 1223–1229. 10.1016/j.cpc.2013.12.020. [DOI] [Google Scholar]
- Peter S.; Meyer H.; Baschnagel J. Thickness-Dependent Reduction of the Glass-Transition Temperature in Thin Polymer Films with a Free Surface. J. Polym. Sci., Part B: Polym. Phys. 2006, 44, 2951–2967. 10.1002/polb.20924. [DOI] [Google Scholar]
- Ellison C. J.; Torkelson J. M. The distribution of glass-transition temperatures in nanoscopically confined glass formers. Nat. Mater. 2003, 2, 695–700. 10.1038/nmat980. [DOI] [PubMed] [Google Scholar]
- Ediger M. D.; Forrest J. A. Dynamics near Free Surfaces and the Glass Transition in Thin Polymer Films: A View to the Future. Macromolecules 2014, 47 (2), 471–478. 10.1021/ma4017696. [DOI] [Google Scholar]
- Forrest J. A.; Dalnoki-Veress K.; Stevens J. R.; Dutcher J. R. Effect of Free Surfaces on the Glass Transition Temperature of Thin Polymer Films. Phys. Rev. Lett. 1996, 77 (10), 2002–2005. 10.1103/PhysRevLett.77.2002. [DOI] [PubMed] [Google Scholar]
- Dutcher J. R.; Dalnoki-Veress K.; Forrest J. A.. Optical Probes of the Glass Transition in Thin Polymer Films. In Supramolecular Structure in Confined Geometries; Warr G., Manne S., Eds.; American Chemical Society Symposium Series, 1999; Vol. 736, pp 127–139. [Google Scholar]
- Efremov M. Yu.; Olson E. A.; Zhang M.; Zhang Z.; Allen L. H. Glass Transition in Ultrathin Polymer Films: Calorimetric Study. Phys. Rev. Lett. 2003, 91 (8), 085703. 10.1103/PhysRevLett.91.085703. [DOI] [PubMed] [Google Scholar]
- Fukao K.; Miyamoto Y. Slow dynamics near glass transitions in thin polymer films. Phys. Rev. E: Stat. Phys., Plasmas, Fluids, Relat. Interdiscip. Top. 2001, 64 (1), 011803. 10.1103/PhysRevE.64.011803. [DOI] [PubMed] [Google Scholar]
- Erber M.; Tress M.; Bittrich E.; Bittrich L.; Eichhorn K.-J.. Glass Transition of Polymers with Different Architectures in the Confinement of Nanoscopic Films. In Ellipsometry of Functional Organic Surfaces and Films, 2nd ed.; Hinrichs K., Eichhorn K.-J., Eds; Springer Series in Surface Sciences; Springer, 2018; Vol. 52, Chapter 4, pp 109–114. [Google Scholar]
- Campoy-Quiles M.; Alonso M. I.; Bradley D. D. C.; Richter L. J. Advanced Ellipsometric Characterization of Conjugated Polymer Films. Adv. Funct. Mater. 2014, 24, 2116–2134. 10.1002/adfm.201303060. [DOI] [Google Scholar]
- Braatz M.-L.; Infantas Melendez L.; Sferrazza M.; Napolitano S. Unexpected impact of irreversible adsorption on thermal expansion: Adsorbed layers are not that dead. J. Chem. Phys. 2017, 146, 203304. 10.1063/1.4974834. [DOI] [PubMed] [Google Scholar]
- Carrillo J. M.; Cheng S.; Kumar R.; Goswami M.; Sokolov A. P.; Sumpter B. G. Untangling the Effects of Chain Rigidity on the Structure and Dynamics of Strongly Adsorbed Polymer Melts. Macromolecules 2015, 48, 4207. 10.1021/acs.macromol.5b00624. [DOI] [Google Scholar]
- Napolitano S.; Wübbenhorst M. Effect of a Reduced Mobility Layer on the Interplay between Molecular Relaxations and Diffusion-Limited Crystallization Rate in Ultrathin Polymer Films“. J. Phys. Chem. B 2007, 111 (21), 5775–5780. 10.1021/jp068721t. [DOI] [PubMed] [Google Scholar]
- Fakirov S.Fundamentals of Polymer Science for Engineers; Wiley-VCH Verlag GmbH & Co. KGaA, 2017. [Google Scholar]
- Trends and Applications in Advanced Polymeric Materials; Nayak S. K., Mohanty S., Unnikrishnan L., Eds.; Scrinever Publishing, Wiley, 2017. [Google Scholar]
- Deformation and Fracture Behaviour of Polymer Materials; Grellmann W., Langer B., Eds.; Springer Series in Materials Science; Springer International Publishing, 2017; Vol. 247. [Google Scholar]
- Smart Polymers and Composites; Nasar A., Ed.; Materials Research Forum LLC, 2018. [Google Scholar]
- Polymer Gels: Perspectives and Applications; Thakur V. K., Thakur M. K., Voicu S. I., Eds.; Gel Horizons: From Science to Smart Materials; Springer Nature Singapore Pte Ltd., 2018. [Google Scholar]
- Stachurski Z. H. On Structure and Properties of Amorphous Materials. Materials 2011, 4, 1564–1598. 10.3390/ma4091564. [DOI] [PMC free article] [PubMed] [Google Scholar]
- Rennie A. R.Amorphous Polymers. Mechanical Properties and Testing of Polymers; Swallowe G.M., Ed.; Springer-Science+Business Media, B.V., 1999; Chapter 6 . [Google Scholar]
- Ferreiro V.; Douglas J. F.; Amis E. J. Phase ordering in blend films of semi-crystalline and amorphous polymers. Macromol. Symp. 2001, 167, 73–88. 10.1002/1521-3900(200103)167:1<73::AID-MASY73>3.0.CO;2-T. [DOI] [Google Scholar]
- Structure–Property Relationships in Amorphous Mi51. Definitions of Terms Relating to Crystalline Polymers (1988); www.iupac.org, 18 May 2001.
- Andjelić S.; Scogna R. C. Polymer crystallization rate challenges: The art of chemistry and processing. J. Appl. Polym. Sci. 2015, 132 (38), 42066. 10.1002/app.42066. [DOI] [Google Scholar]
- Kavesh S.; Schultz J. M. Meaning and Measurement of Crystallinity in Polymers: A Review. Polym. Eng. Sci. 1969, 9 (5), 331–338. 10.1002/pen.760090504. [DOI] [Google Scholar]
- Zhang M. C.; Guo B.-H.; Xu J. A Review on Polymer Crystallization Theories. Crystals 2017, 7 (1), 4. 10.3390/cryst7010004. [DOI] [Google Scholar]
- Batista N. L.; Olivier P.; Bernhart G.; Rezende M. C.; Botelho E. C. Correlation between degree of crystallinity, morphology and mechanical properties of PPS/carbon fiber laminates. Mater. Res. 2016, 19 (1), 195–201. 10.1590/1980-5373-MR-2015-0453. [DOI] [Google Scholar]
- Hoffman J. D.; Weeks J. J. Specific Volume and Degree of Crystallinity of Semicrystalline Poly (chlorotrifluoroethylene), and Estimated Specific Volumes of the Pure Amorphous and Crystalline Phases. Journal of Research of the National Bureau of Standards 1958, 60 (5), 465–479. 10.6028/jres.060.048. [DOI] [Google Scholar]
- Ehrenstein G. W.; Theriault R. P.. Polymeric Materials: Structure, Properties, Applications; Henser Verlag, 2001; pp 67–78, ISBN 1-56990-310-7. [Google Scholar]
- Kalogeras I. M.Glass-Transition Phenomena in Polymer Blends. In Encyclopedia of Polymer Blends, Vol. 3: Structure, 1st ed.; Isayev A. I., Ed.; Wiley-VCH Verlag GmbH & Co. KGaA: Weinheim, 2016. [Google Scholar]
- Ghaemy M.; Hadjmohammadi M. R.; Tabaraki R. Study of Crystallinity of High-Density Polyethylene by Inverse Gas Chromatography. Iranian Polymer Journal 2000, 9 (2), 117–124. [Google Scholar]
- Lotz B.; Miyoshi T.; Cheng S.Z. D. 50th Anniversary Perspective: Polymer Crystals and Crystallization: Personal Journeys in a Challenging Research Field. Macromolecules 2017, 50, 5995–6025. 10.1021/acs.macromol.7b00907. [DOI] [Google Scholar]
- Zhang M. C.; Guo B.-H.; Xu J. A Review on Polymer Crystallization Theories. Crystals 2017, 7, 4–37. 10.3390/cryst7010004. [DOI] [Google Scholar]
- Hay J. N. Application of the modified Avrami equations to polymer crystallization kinetics. Br. Polym. J. 1971, 3 (2), 74–82. 10.1002/pi.4980030205. [DOI] [Google Scholar]
- Narine S. S.; Humphrey K. L.; Bouzidi L. Modification of the Avrami Model for Application to the Kinetics of the Melt Crystallization of Lipids. J. Am. Oil Chem. Soc. 2006, 83 (11), 913–921. 10.1007/s11746-006-5046-6. [DOI] [Google Scholar]
- Yang J.; McCoy B. J.; Madras G. Distribution kinetics of polymer crystallization and the Avrami equation. J. Chem. Phys. 2005, 122 (6), 064901. 10.1063/1.1844373. [DOI] [PubMed] [Google Scholar]
- Jain N.L.; Swinton F. L. Studies in polymer crystallization – I. Pure polyethylene oxide. Eur. Polym. J. 1967, 3 (3), 371–378. 10.1016/0014-3057(67)90006-7. [DOI] [Google Scholar]
- Hans-Georg E.Thermal Transitions. In Macromolecules; Springer US: New York, 1977; pp 373−419.
- Ge J. J.; Zhang A.; McCreight K. W.; Wang S.-Y.; Harris F. W.; Cheng S. Z. D. Phase Structures, Transition Behaviors, and Surface Alignment in Polymers Containing a Rigid Rodlike Backbone with Flexible Side Chains. 2. Phase Transition Kinetics in a Main-Chain/Side-Chain Liquid Crystalline Polyester. Macromolecules 1998, 31, 4093–4101. 10.1021/ma980285o. [DOI] [Google Scholar]
- Galina H.Fizykochemia Polimerów; Oficyna Wydawnicza Politechniki Rzeszowskiej: Rzeszów, 1998. [Google Scholar]
- Fakhraai Z.; Forrest J. A. Probing Slow Dynamics in Supported Thin Polymer Films. Phys. Rev. Lett. 2005, 95, 025701. 10.1103/PhysRevLett.95.025701. [DOI] [PubMed] [Google Scholar]
- Fujiwara H.Spectroscopic Ellipsometry. Principles and Aplications; John Wiley and Sons Ltd.: England, 2007. [Google Scholar]
- Riedling K.Ellipsometry for Industrial Applications; Springer-Verlag Wien: New York, 1988. [Google Scholar]
- In Situ Real-Time Characterization of Thin Films; Auciello O., Krauss A. R., Eds.; John Wiley and Sons Inc.: New York, 2001. [Google Scholar]
- Ellipsometry at the Nanoscale; Losurdo M., Hingerl K., Eds.; Springer-Verlag Berlin Heidelberg, 2013. [Google Scholar]
- Ellipsometry of Functional Organic Surfaces and Films, 2nd ed.; Hinrichs K., Eichhorn K.-J., Eds.; Springer Series in Surface Science 52; Springer International Publishing, 2018. [Google Scholar]
- Polymer Surface Characterisation; Sabbatini L., Ed.; Walter de Gruyter GmbHG: Berlin, 2014. [Google Scholar]
- Functional Polymer Films; Knoll W., Advincula R. C., Eds.; Wiley-VCH, 2005. [Google Scholar]
- Handbook of Ellipsometry; Tompkins H. G., Irene E. A., Eds.; Wiliam Andrew Publishing Inc.: USA, 2005. [Google Scholar]
- Jung J.; Bork J.; Holmgaard T.; Kortbek N. A.; Pedersen K.. Ellipsometry, Scientific Project; Institute of Physics and Nanotechnology, Aalborg University, 2004. [Google Scholar]
- Nestler P.; Helm C. A. Determination of refractive index and layer thickness of nm-thin films via ellipsometry. Opt. Express 2017, 25, 27077–27085. 10.1364/OE.25.027077. [DOI] [PubMed] [Google Scholar]
- Engmann S.; Turkovic V.; Denner P.; Hoppe H.; Gobsch G. Optical Order of the Polymer Phase within Polymer/Fullerene Blend Films. J. Polym. Sci., Part B: Polym. Phys. 2012, 50, 1363–1373. 10.1002/polb.23131. [DOI] [Google Scholar]
- Singh L.; Ludovice P. J.; Henderson C. L. Influence of molecular weight and film thickness on the glass transition temperature and coefficient of thermal expansion. Thin Solid Films 2004, 449, 231–241. 10.1016/S0040-6090(03)01353-1. [DOI] [Google Scholar]
- Erber M.; Khalyavina A.; Eichhorn K.-J.; Voit B. I. Variations in the glass transition temperature of polyester with special architectures confined in thin films. Polymer 2010, 51, 129–135. 10.1016/j.polymer.2009.11.032. [DOI] [Google Scholar]
- Fryer D. S.; Peters R. D.; Kim E. J.; Tomaszewski J. E.; de Pablo J. J.; Nealey P. F.; White C. C.; Wu W.-L. Dependence of the Glass Transition Temperature of Polymer Films on Interfacial Energy and Thickness. Macromolecules 2001, 34, 5627–5634. 10.1021/ma001932q. [DOI] [Google Scholar]
- Sharp J. S.; Forrest J. A. Dielectric and ellipsometric studies of the dynamics in thin films of isotactic poly(methylmethacrylate) with one free surface. Phys. Rev. E: Stat. Phys., Plasmas, Fluids, Relat. Interdiscip. Top. 2003, 67, 031805. 10.1103/PhysRevE.67.031805. [DOI] [PubMed] [Google Scholar]
- Kim S.; Hewlett S. A.; Roth C. B.; Torkelson J. M. Confinement effects on glass transition temperature, transition breadth, and expansivity: Comparison of ellipsometry and fluorescence measurements on polystyrene films. Eur. Phys. J. E: Soft Matter Biol. Phys. 2009, 30, 83–92. 10.1140/epje/i2009-10510-y. [DOI] [PubMed] [Google Scholar]
- Dalnoki-Veress K.; Forrest J. A.; Murray C.; Gigault C.; Dutcher J. R. Molecular weight dependence of reductions in the glass transition temperature of thin, freely standing polymer films. Phys. Rev. E: Stat. Phys., Plasmas, Fluids, Relat. Interdiscip. Top. 2001, 63, 031801. 10.1103/PhysRevE.63.031801. [DOI] [PubMed] [Google Scholar]
- Chandran S.; Basu J. K.; Mukhopadhyay M. K. Variation in glass transition temperature of polymer nanocomposite films driven by morphological transitions. J. Chem. Phys. 2013, 138, 014902. 10.1063/1.4773442. [DOI] [PubMed] [Google Scholar]
- Christian P.; Coclite A. M. Vapor-phase-synthesized fluoroacrylate polymer thin films:thermal stability and structural properties. Beilstein J. Nanotechnol. 2017, 8, 933–942. 10.3762/bjnano.8.95. [DOI] [PMC free article] [PubMed] [Google Scholar]
- Beaucage C.; Composto R.; Stein R. S. Ellipsometric Study of the Glass Transition and Thermal Expansion Coefficients of Thin Polymer Films. J. Polym. Sci., Part B: Polym. Phys. 1993, 31, 319–326. 10.1002/polb.1993.090310310. [DOI] [Google Scholar]
- Bittrich E.; Windrich F.; Martens D.; Bittrich L.; Häussler L.; Eichhorn K.-J. Determination of the glass transition temperature in thin polymeric films used for microelectronic packaging by temperature-dependent spectroscopic ellipsometry. Polym. Test. 2017, 64, 48–54. 10.1016/j.polymertesting.2017.09.030. [DOI] [Google Scholar]
- Grohens Y.; Brogly M.; Labbe C.; David M.-O.; Schultz J. Glass Transition of Stereoregular Poly(methyl methacrylate) at Interfaces. Langmuir 1998, 14 (11), 2929–2932. 10.1021/la971397w. [DOI] [Google Scholar]
- Tu H.; Heitzman C. E.; Braun P. V. Patterned Poly(N-isopropylacrylamide) Brushes on Silica Surfaces by Microcontact Printing Followed by Surface-Initiated Polymerization. Langmuir 2004, 20, 8313–8320. 10.1021/la049663a. [DOI] [PubMed] [Google Scholar]
- Christian P.; Coclite A. M. Thermal studies on proton conductive copolymer thin films based on perfluoroacrylates synthesized by initiated Chemical Vapor Deposition. Thin Solid Films 2017, 635, 3–8. 10.1016/j.tsf.2017.01.023. [DOI] [Google Scholar]
- Schwarz D.; Wormeester H.; Poelsema B. Validity of Lorentz-Lorentz equation in porosimetry studies. Thin Solid Films 2011, 519 (9), 2994–2997. 10.1016/j.tsf.2010.12.053. [DOI] [Google Scholar]
- Baklanov M. R.; Mogilnikov K. P.; Polovinkin V. G.; Dultsev F. N. Determination of pore size distribution in thin films by ellipsometric porosimetry. J. Vac. Sci. Technol., B: Microelectron. Process. Phenom. 2000, 18 (3), 1385–1391. 10.1116/1.591390. [DOI] [Google Scholar]
- Salazar D.; Soto-Molina R.; Lizarraga-Medina E. G.; Felix M. A.; Radnev N.; Marquez H. Elipsometric Study of SiOx Thin Films by Thermal Evaporation. Open J. Inorg. Chem. 2016, 6 (3), 175–182. 10.4236/ojic.2016.63013. [DOI] [Google Scholar]
- Zhang Z.; Zhao P.; Lin P.; Sun F. Thermo-optic coefficients of polymers for optical waveguide applications. Polymer 2006, 47, 4893–4896. 10.1016/j.polymer.2006.05.035. [DOI] [Google Scholar]
- Kanaya T.; Miyazaki T.; Inoue R.; Nishida K. Thermal expansion and contraction of polymer thin films. Phys. Status Solidi B 2005, 242 (3), 595–606. 10.1002/pssb.200460378. [DOI] [Google Scholar]
- Gordan O. D.; Zahn D. R.T.. Small Organic Molecules.In “Ellipsometry of Functional Organic Surfaces and Films; Hinrichs K., Eichhorn K.-J., Eds.; Springer Series in Surface Sciences 52; Springer, 2018; Chapter 10. [Google Scholar]
- Wallace W. E.; van Zanten J. H.; Wu W. L. The influence of impenetrable interface on a polymer glass – transition temperature. Phys. Rev. E: Stat. Phys., Plasmas, Fluids, Relat. Interdiscip. Top. 1995, 52 (4), R3329–R3332. 10.1103/PhysRevE.52.R3329. [DOI] [PubMed] [Google Scholar]
- Chandler-Horowitz D.; Candela G. On the accuracy of ellipsometric thickness determinations for very thin films. Journal de Physique Colloques 1983, 44 (C10), 23–26. 10.1051/jphyscol:19831003. [DOI] [Google Scholar]
- Likhachev D. V. Model selection in spectroscopic ellipsometry data analysis: Combining an information criteria approach with screening sensitivity analysis. Appl. Surf. Sci. 2017, 421, 617–623. 10.1016/j.apsusc.2016.09.139. [DOI] [Google Scholar]
- Woollam J. A.; Johs B.; Herzinger C. M.; Hilfiker J.; Synowicki R.; Bungay C. L. Overview of Variable Angle Spectroscopic Ellipsometry (VASE), Part I: Basic Theory and Typical Applications. Proc. SPIE 2017, CR72, 1029402. 10.1117/12.351660. [DOI] [Google Scholar]
- Bosch S.; Monzonis F. ″General inversion method for single-wavelength ellipsometry of samples with an arbitrary number of layers. J. Opt. Soc. Am. A 1995, 12, 1375–1379. 10.1364/JOSAA.12.001375. [DOI] [Google Scholar]
- Gupta Y.; Arun P. First Step to Ellipsometry. International Journal of Physics 2015, 3 (1), 8–11. 10.12691/ijp-3-1-2. [DOI] [Google Scholar]
- Akbalık A.; Soulan S.; Tortai J.-H.; Fuard D.; Kone I.; Hazart J.; Schiavone P. An inverse ellipsometric problem for thin film characterization: Comparison of different optimization methods. Proc. SPIE 2009, 7272, 72723S. 10.1117/12.814118. [DOI] [Google Scholar]
- De La Luz J.; Montez M.; Polański K. Investigations of the surface dielectric function by means of the scanning ellipsometry and transition radiation methods. Acta Physicae Superficierum 1990, 1, 37–53. [Google Scholar]
- Clough A.; Peng D.; Yang Z.; Tsui O. K. C. Glass Transition Temperature of Polymer Films That Slip. Macromolecules 2011, 44, 1649–1653. 10.1021/ma102918s. [DOI] [Google Scholar]
- Wang T.; Pearson A. J.; Dunbar A. D.F.; Staniec P. A.; Watters D. C.; Coles D.; Yi H.; Iraqi A.; Lidzey D. G.; Jones R. A. L. Competition between substrate-mediated π-π stacking and surface-mediated Tg depression in ultrathin conjugated polymer films. Eur. Phys. J. E: Soft Matter Biol. Phys. 2012, 35, 129. 10.1140/epje/i2012-12129-3. [DOI] [PubMed] [Google Scholar]
- Kim J. H.; Jang J.; Zin W.-C. Estimation of the Thickness Dependence of the Glass Transition Temperature in Various Thin Polymer Films. Langmuir 2000, 16, 4064–4067. 10.1021/la991618t. [DOI] [Google Scholar]
- El Ouakili A.; Vignaud G.; Balnois E.; Bardeau J.-F.; Grohens Y. Multiple glass transition temperatures of polymer thin films as probed by multi-wavelength ellipsometry. Thin Solid Films 2011, 519, 2031–2036. 10.1016/j.tsf.2010.10.015. [DOI] [Google Scholar]
- Chandran S.; Basu J. K. Effect of nanoparticle dispersion on glass transition in thin films of polymer nanocomposites. Eur. Phys. J. E: Soft Matter Biol. Phys. 2011, 34, 99. 10.1140/epje/i2011-11099-2. [DOI] [PubMed] [Google Scholar]
- Geng K.; Tsui O. K. C. Effects of Polymer Tacticity and Molecular Weight on the Glass Transition Temperature of Poly(methyl methacrylate) Films on Silica. Macromolecules 2016, 49, 2671–2678. 10.1021/acs.macromol.6b00108. [DOI] [Google Scholar]
- Keddie J. L.; Jones R. A. L.; Cory R. A. Size-Dependent Depression of the Glass Transition Temperature in Polymer Films. Europhysical Letters 1994, 27, 59–64. 10.1209/0295-5075/27/1/011. [DOI] [Google Scholar]
- Alonso M. I.; Campoy-Quiles M.. Conjugated Polymers: Relationship Between Morphology and Optical Properties. Ellipsometry of Functional Organic Surfaces and Films, 2nd ed.; Hinrichs K., Eichhorn K.-J., Eds.; Springer Series in Surface Sciences 52; Springer, 2018; Chapter 15, pp 109–114. [Google Scholar]
- Xu J.; Liu Z.; Lan Y.; Zuo B.; Wang X.; Yang J.; Zhang W.; Hu W. Mobility Gradient of Poly(ethylene terephthalate) Chains near a Substrate Scaled by the Thickness of the Adsorbed Layer. Macromolecules 2017, 50 (2017), 6804–6812. 10.1021/acs.macromol.7b00922. [DOI] [Google Scholar]
- Zhang X.; Yager K. G.; Kang S.; Fredin N. J.; Akgun B.; Satija S.; Douglas J. F.; Karim A.; Jones R. L. Solvent Retention in Thin Spin-Coated Polystyrene and Poly(methylmethacrylate) Homopolymer Films Studied By Neutron Reflectometry. Macromolecules 2010, 43, 1117–1123. 10.1021/ma902168w. [DOI] [Google Scholar]
- Lewis E. A.; Vogt B. D. Thickness Dependence of Structural Relaxation in Spin-Cast Polynorbornene Films with High Glass Transition Temperatures (>613 K). J. Polym. Sci., Part B: Polym. Phys. 2018, 56, 53–61. 10.1002/polb.24434. [DOI] [Google Scholar]
- Richardson H.; Sferrazza M.; Keddie J. L. Influence of the glass transition on solvent loss from spin-cast glassy polymer thin films. Eur. Phys. J. E 2003, 12, 87–91. [DOI] [PubMed] [Google Scholar]
- van Zanten J. H.; Wallace W. E.; Wu W.-l. Effect of strongly favourable substrate interactions on the thermal properties of ultra thin polymer films. Phys. Rev. E: Stat. Phys., Plasmas, Fluids, Relat. Interdiscip. Top. 1996, 53, R2053–R2056. 10.1103/PhysRevE.53.R2053. [DOI] [PubMed] [Google Scholar]
- Erber M.; Tress M.; Mapesa E. U.; Serghei A.; Eichhorn K.-J.; Voit B.; Kremer F. Glassy Dynamics and Glass Transition in Thin Polymer Layers of PMMA Deposited on Different Substrates. Macromolecules 2010, 43, 7729–7733. 10.1021/ma100912r. [DOI] [Google Scholar]
- Lu X.-l.; Mi Y.-l. Glass Transition Behavior of Spin-coated Thin Films of a Hydrophilic Polymer on Supported Substrates. Chin. J. Polym. Sci. 2015, 33 (4), 607–612. 10.1007/s10118-015-1612-4. [DOI] [Google Scholar]
- Efremov M. Yu.; Soofi S. S.; Kiyanova A. V.; Munoz C. J.; Burgardt P.; Cerrina F.; Nealey P. F. Vacuum ellipsometry as a method for probing glass transition in thin polymer films. Rev. Sci. Instrum. 2008, 79, 043903. 10.1063/1.2901601. [DOI] [PubMed] [Google Scholar]
- Campoy-Quiles M.; Sims M.; Etchegoin P. G.; Bradley D. D. C. Thickness-Dependent Thermal Transition Temperatures in Thin Conjugated Polymer Films. Macromolecules 2006, 39, 7673–7680. 10.1021/ma0605752. [DOI] [Google Scholar]
- Yamamoto S.; Tsujii Y.; Fukuda T. Glass Transition Temperatures of High-Density Poly(methyl methacrylate) Brushes. Macromolecules 2002, 35, 6077–6079. 10.1021/ma0255128. [DOI] [Google Scholar]
- Hénot M.; Chenneviére A.; Drockenmuller E.; Shull K.; Léger L.; Restagno F. Influence of grafting on the glass transition temperature of PS thin films. Eur. Phys. J. E: Soft Matter Biol. Phys. 2017, 40, 11. 10.1140/epje/i2017-11500-2. [DOI] [PubMed] [Google Scholar]
- Campoy-Quiles M.; Etchegoin P. G.; Bradley D. D. C. Exploring the potential of ellipsometry for characterisation ef electronic, optical, morphologic and thermodynamic properties of polyfluorene thin films’. Synth. Met. 2005, 155, 279–282. 10.1016/j.synthmet.2005.01.031. [DOI] [Google Scholar]
- Müller C.; Bergqvist J.; Vandewal K.; Tvingstedt K.; Anselmo A. S.; Magnusson R.; Alonso M. I.; Moons E.; Arwin H.; Campoy-Quiles M.; Inganäs O. Phase behaviour of liquid-crystalline polymer/fullerene organic photovoltaic blends: thermal stability and miscibility. J. Mater. Chem. 2011, 21, 10676–10684. 10.1039/c1jm11239b. [DOI] [Google Scholar]
- El Ouakili A.; Vignaud G.; Balnois E.; Bardeau J.-F.; Grohens Y. Glass transition temperatures of isotacticpoly(methymethacrylate) thin films and individual chains probed by multi wavelength ellipsometry. Eur. Phys. J.: Appl. Phys. 2011, 56, 13703–7. 10.1051/epjap/2010100221. [DOI] [Google Scholar]
- Hajduk B.; Bednarski H.; Jarząbek B.; Janeczek H.; Nitschke P. P3HT:PCBM blend films phase diagram on the base of variable-temperature spectroscopic ellipsometry. Beilstein J. Nanotechnol. 2018, 9, 1108–1115. 10.3762/bjnano.9.102. [DOI] [PMC free article] [PubMed] [Google Scholar]
- Kim J. H.; Jang J.; Zin W.-C. Thickness Dependence of the Melting Temperature of Thin Polymer Films. Macromol. Rapid Commun. 2001, 22, 386–389. 10.1002/1521-3927(20010301)22:6<386::AID-MARC386>3.0.CO;2-S. [DOI] [Google Scholar]
- Kim J. H.; Jang J.; Lee D.-Y.; Zin W.-C. Thickness and Composition Dependence of the Glass Transition Temperature in Thin Homogeneous Polymer Blend Films. Macromolecules 2002, 35, 311–313. 10.1021/ma010198n. [DOI] [Google Scholar]
- Müller C.; Andersson L. M.; Peña-Rodríguez O.; Garriga M.; Inganäs O.; Campoy-Quiles M. Determination of Thermal Transition Depth Profiles in Polymer Semiconductor Films with Ellipsometry. Macromolecules 2013, 46, 7325–7331. 10.1021/ma400871u. [DOI] [Google Scholar]
- Müller C. On the Glass Transition of Polymer Semiconductors and Its Impact on Polymer Solar Cell Stability. Chem. Mater. 2015, 27, 2740–2754. 10.1021/acs.chemmater.5b00024. [DOI] [Google Scholar]
- Kremer F.; Tress M.; Mapesa E. U.; Huth H.; Müller J.; Serghei A.; Schick C.; Eichhorn K.-J.; Voit B.; Kremer F. Glassy dynamics and glass transition in nanometric layers and films: A silver lining on the horizon. J. Non-Cryst. Solids 2015, 407, 277–283. 10.1016/j.jnoncrysol.2014.08.016. [DOI] [Google Scholar]
- Narladkar A.; Balnois E.; Vignaud G.; Grohens Y. Difference in Glass Transition Behavior Between Semi Crystalline and Amorphous poly(lactic acid) Thin Films. Macromol. Symp. 2008, 273, 146–152. 10.1002/masy.200851321. [DOI] [Google Scholar]
- Vignaud G.; Bardeau J.-F.; Gibaud A.; Grohens Y. Multiple Glass-Transition Temperatures in Thin Supported Films of Isotactic PMMA as Revealed by Enhanced Raman Scattering. Langmuir 2005, 21, 8601–8604. 10.1021/la050898b. [DOI] [PubMed] [Google Scholar]
- Kim J. H.; Jang J.; Zin W.-C. Thickness Dependence of the Glass Transition Temperature in Thin Polymer Films. Langmuir 2001, 17, 2703–2710. 10.1021/la001125k. [DOI] [Google Scholar]
- See Y.-K.; Cha J.; Chang T.; Ree M. Glass Transition Temperature of Poly(tert-butyl methacrylate) Langmuir-Blodgett Film and Spin-Coated Film by X-ray Reflectivity and Ellipsometry. Langmuir 2000, 16, 2351–2355. 10.1021/la991074v. [DOI] [Google Scholar]
- Lee H.; Ahn H.; Naidu S.; Seong B. S.; Ryu D. Y.; Trombly D. M.; Ganesan V. Glass Transition Behavior of PS Films on Grafted PS Substrates. Macromolecules 2010, 43, 9892–9898. 10.1021/ma101743u. [DOI] [Google Scholar]
- Azzam R. M. A.; Elshazly - Zaghloul M.; Bashara N. M. Combined reflection and transmission thin-film ellipsometry: a unified linear analysis. Appl. Opt. 1975, 14, 1652–1663. 10.1364/AO.14.001652. [DOI] [PubMed] [Google Scholar]; 144 Soave P. A.; Ferreira Dau R. A.; Becker M. R.; Pereira M. B.; Horowitz F. Refractive index control in bicomponent polymer films for integrated thermo-optical applications. Opt. Eng. 2009, 48 (12), 124603. 10.1117/1.3275452. [DOI] [Google Scholar]
- Rzodkiewicz W.; Panas A. Determination of the Analytical Relationship between Refractive Index and Density of SiO2 Layers. Acta Phys. Pol., A 2009, 116 (Supplement), 92–94. 10.12693/APhysPolA.116.S-92. [DOI] [Google Scholar]
- Park C. H.; Kim J. H.; Ree M.; Sohn B.-H.; Jung J. C.; Zin W.-C. Thickness and composition dependence of the glass transition temperature in thin random copolymer films“. Polymer 2004, 45, 4507–4513. 10.1016/j.polymer.2004.04.048. [DOI] [Google Scholar]
- Sharp J. S.; Forrest J. A. Dielectric and ellipsometric studies of the dynamics in thin films of isotactic poly(methylmethacrylate) with one free surface. Phys. Rev. E: Stat. Phys., Plasmas, Fluids, Relat. Interdiscip. Top. 2003, 67, 031805. 10.1103/PhysRevE.67.031805. [DOI] [PubMed] [Google Scholar]
- Jaglarz J.; Nosidlak N.; Wolska N. Thermo-optical properties of conducted polythiophene polymer films used in electroluminscent devices. Opt. Quantum Electron. 2016, 48, 392. 10.1007/s11082-016-0649-0. [DOI] [Google Scholar]
- Glor E. C.; Fakhraai Z. Cooling Rate Dependent Ellipsometry Measurements to Determine the Dynamics of Thin Glass Films. J. Visualized Exp. 2016, 107, 1–9. 10.3791/53499. [DOI] [PMC free article] [PubMed] [Google Scholar]
- Ediger M. D.; Forrest J. A. Dynamics near Free Surfaces and the Glass Transition in Thin Polymer Films: A View to the Future. Macromolecules 2014, 47 (2), 471–478. 10.1021/ma4017696. [DOI] [Google Scholar]
- Serghei A.; Huth H.; Schick C.; Kremer F. Glassy dynamics in thin polymer layers having a free upper interface. Macromolecules 2008, 41 (10), 3636–3639. 10.1021/ma702381t. [DOI] [Google Scholar]
- Huth H.; Minakov A. A.; Schick C. Differential AC-chip calorimeter for glass transition measurements in ultrathin films. J. Polym. Sci., Part B: Polym. Phys. 2006, 44 (20), 2996–3005. 10.1002/polb.20921. [DOI] [Google Scholar]
- Tress M.; Mapesa E. U.; Kossack W.; Kipnusu W. K.; Reiche M.; Kremer F. Glassy dynamics in condensed isolated polymer chains. Science 2013, 341 (6152), 1371–1374. 10.1126/science.1238950. [DOI] [PubMed] [Google Scholar]
- Boucher V. M.; Cangialosi D.; Yin H.; Schonhals A.; Alegrıa A.; Colmenero J. Tg depression and invariant segmental dynamics in polystyrene thin films. Soft Matter 2012, 8 (19), 5119–5122. 10.1039/c2sm25419k. [DOI] [Google Scholar]
- Kremer F.; Tress M.; Mapesa E. U. Glassy dynamics and glass transition in nanometric layers and films: A silver lining on the horizon. J. Non-Cryst. Solids 2015, 407, 277–283. 10.1016/j.jnoncrysol.2014.08.016. [DOI] [Google Scholar]
- Glor E. C.; Angrand G. V.; Fakhraai Z. Exploring the broadening and the existence of two glass transitions due to competing interfacial effects in thin, supported polymer films. J. Chem. Phys. 2017, 146, 203330. 10.1063/1.4979944. [DOI] [PubMed] [Google Scholar]
- Ree M.; Chen K.-J.; Kirby D. P.; Katzenellenbogen N.; Grischkowsky D. Anisotropic properties of high-temperature polyimide thin films: Dielectric and thermal-expansion behaviors. J. Appl. Phys. 1992, 72 (5), 2014–2021. 10.1063/1.351629. [DOI] [Google Scholar]
- Fukao K.; Miyamoto Y. Glass transitions and dynamics in thin polymer films: Dielectric relaxation of thin films of polystyrene. Phys. Rev. E: Stat. Phys., Plasmas, Fluids, Relat. Interdiscip. Top. 2000, 61 (2), 1743–1754. 10.1103/PhysRevE.61.1743. [DOI] [PubMed] [Google Scholar]
- Kawana S.; Jones R. A. L. Character of the glass transition in thin supported polymer films. Phys. Rev. E 2001, 63, 021501. 10.1103/PhysRevE.63.021501. [DOI] [PubMed] [Google Scholar]
- Kawana S.; Jones R. A. L. Effect of physical ageing in thin glassy polymer films. Eur. Phys. J. E: Soft Matter Biol. Phys. 2003, 10, 223–230. 10.1140/epje/i2002-10111-4. [DOI] [PubMed] [Google Scholar]
- Askar S.; Evans C. M.; Torkelson J. M. Residual stress relaxation and stiffness in spin-coated polymer films: Characterization by ellipsometry and fluorescence. Polymer 2015, 76, 113–122. 10.1016/j.polymer.2015.08.036. [DOI] [Google Scholar]
- Pye J. E.; Roth C. B. Physical Aging of Polymer Films Quenched and Measured Free-Standing via Ellipsometry: Controlling Stress Imparted by Thermal Expansion Mismatch between Film and Support. Macromolecules 2013, 46, 9455–9463. 10.1021/ma401872u. [DOI] [Google Scholar]
- Pham J. Q.; Green P. F. The glass transition of thin film polymer/polymer blends: Interfacial interactions and confinement. J. Chem. Phys. 2002, 116, 5801. 10.1063/1.1456035. [DOI] [Google Scholar]
- Cristofolini L.; Arisi S.; Fontana M. P. Glass Transition and Relaxation Following Photo Perturbation in Thin Polymeric Films. Phys. Rev. Lett. 2000, 85 (23), 4912–4915. 10.1103/PhysRevLett.85.4912. [DOI] [PubMed] [Google Scholar]
- Pham J. Q.; Mitchell C. A.; Bahr J. L.; Tour J. M.; Krishanamoorti R.; Green P. F. Glass Transition of Polymer/Single-Walled Carbon Nanotube Composite Films. J. Polym. Sci., Part B: Polym. Phys. 2003, 41, 3339–3345. 10.1002/polb.10702. [DOI] [Google Scholar]
- Pye J. E.; Roth C. B. Above, Below, and In-Between the Two Glass Transitions of Ultrathin Free-Standing Polystyrene Films: Thermal Expansion Coefficient and Physical Aging. J. Polym. Sci., Part B: Polym. Phys. 2015, 53, 64–75. 10.1002/polb.23635. [DOI] [Google Scholar]
- Mok M. M.; Kim J.; Marrou S. R.; Torkelson J. M. Ellipsometry measurements of glass transition breadth in bulk films of random, block, and gradient copolymers. Eur. Phys. J. E: Soft Matter Biol. Phys. 2010, 31, 239–252. 10.1140/epje/i2010-10569-3. [DOI] [PubMed] [Google Scholar]
- Mirigian S.; Schweizer K. S. Theory of activated glassy relaxation, mobility gradients, surface diffusion, and vitrification in free standing thin films. J. Chem. Phys. 2015, 143, 244705. 10.1063/1.4937953. [DOI] [PubMed] [Google Scholar]
- Grohens Y.; Hamon L.; Reiter G.; Soldera A.; Holl Y. Some relevant parameters affecting the glass transition of supported ultra-thin polymer films. Eur. Phys. J. E: Soft Matter Biol. Phys. 2002, 8, 217–224. 10.1140/epje/i2001-10088-4. [DOI] [PubMed] [Google Scholar]
- Raegen A. N.; Massa M. V.; Forrest J. A.; Dalnoki-Veress K. Effect of atmosphere on reductions in the glass transition of thin polystyrene films. Eur. Phys. J. E: Soft Matter Biol. Phys. 2008, 27, 375–377. 10.1140/epje/i2008-10394-3. [DOI] [PubMed] [Google Scholar]
- Israelachvili J. N.Intermolecular & Surface Forces, 2nd ed.; Academic Press: San Diego, 1991. [Google Scholar]
- Keddie J. L.; Jones R. A. L.; Cory R. A. Interface and surface effects on the glass-transition temperature in thin polymer-films. Faraday Discuss. 1994, 98, 219–230. 10.1039/fd9949800219. [DOI] [Google Scholar]
- DeMaggio G. B.; Frieze W. E.; Gidley D. W.; Zhu M.; Hristov H. A.; Yee A. F. Interface and Surface Effects on the Glass Transition in Thin Polystyrene Films. Phys. Rev. Lett. 1997, 78 (8), 1524–1527. 10.1103/PhysRevLett.78.1524. [DOI] [Google Scholar]
- Ellison C. J.; Torkelson J. M. Sensing the Glass Transition in Thin and Ultrathin Polymer Films via Fluorescence Probes and Labels. J. Polym. Sci., Part B: Polym. Phys. 2002, 40, 2745–2758. 10.1002/polb.10343. [DOI] [Google Scholar]
- Perez-de-Eulate N. G.; Sferrazza M.; Cangialosi D.; Napolitano S. Irreversible Adsorption Erases the Free Surface Effect on the Tg of Supported Films of Poly(4-tert-butylstyrene). ACS Macro Lett. 2017, 6, 354–358. 10.1021/acsmacrolett.7b00129. [DOI] [PubMed] [Google Scholar]
- Forrest J. A.; Dalnoki-Veress K. When Does a Glass Transition Temperature Not Signify a Glass Transition?. ACS Macro Lett. 2014, 3, 310–314. 10.1021/mz4006217. [DOI] [PubMed] [Google Scholar]
- Yang Z.; Fujii Y.; Lee F. K.; Lam C.-H.; Tsui O. K. C. Glass Transition Dynamics and Surface Layer Mobility in Unentangled Polystyrene Films. Science 2010, 328, 1676–1679. 10.1126/science.1184394. [DOI] [PubMed] [Google Scholar]
- Chai Y.; Salez T.; McGraw J. D.; Benzaquen M.; Dalnoki- Veress K.; Raphael E.; Forrest J. A. A Direct Quantitative Measure of Surface Mobility in a Glassy Polymer. Science 2014, 343, 994. 10.1126/science.1244845. [DOI] [PubMed] [Google Scholar]
- Davis M. J. B.; Zuo B.; Priestley R. D. Competing polymer–substrate interactions mitigate random copolymer adsorption. Soft Matter 2018, 14 (35), 7204–7213. 10.1039/C8SM01433G. [DOI] [PubMed] [Google Scholar]
- Gin P.; Jiang N.; Liang C.; Taniguchi T.; Akgun B.; Satija S. K.; Endoh M. K.; Koga T. Revealed Architectures of Adsorbed Polymer Chains at Solid-Polymer Melt Interfaces. Phys. Rev. Lett. 2012, 109, 265501. 10.1103/PhysRevLett.109.265501. [DOI] [PubMed] [Google Scholar]
- Lotz B. Frustration and Frustrated Crystal Structures of Polymers and Biopolymers. Macromolecules 2012, 45, 2175–2189. 10.1021/ma202326t. [DOI] [Google Scholar]
- Kléman M. Frustration in polymers. J. Phys., Lett. 1985, 46, 723–732. 10.1051/jphyslet:019850046016072300. [DOI] [Google Scholar]
- Lopez-Garcia I.; Keddie J. L.; Sferrazza M. Probing the early stages of solvent evaporation and relaxation in solvent-cast polymer thinfilms by spectroscopic ellipsometry. Surf. Interface Anal. 2011, 43, 1448–52. 10.1002/sia.3728. [DOI] [Google Scholar]
- Baker E. A.; Rittigstein P.; Torkelson J. M.; Roth C. B. Streamlined Ellipsometry Procedure for Characterizing Physical Aging Rates of Thin Polymer Films. J. Polym. Sci., Part B: Polym. Phys. 2009, 47, 2509–2519. 10.1002/polb.21861. [DOI] [Google Scholar]
- Lan T.; Torkelson J. M. Methacrylate-Based Polymer Films Useful in Lithographic Applications Exhibit Different Glass Transition Temperature-Confinement Effects at High and Low Molecular Weight. Polymer 2014, 55, 1249–1258. 10.1016/j.polymer.2014.01.031. [DOI] [Google Scholar]