Abstract
Deregulation of the BCL2 gene family plays an important role in the pathogenesis of acute myeloid leukemia (AML). The BCL2 inhibitor, venetoclax, has received FDA approval for the treatment of AML. However, upfront and acquired drug resistance ensues due, in part, to the clinical and genetic heterogeneity of AML, highlighting the importance of identifying biomarkers to stratify patients onto the most effective therapies. By integrating clinical characteristics, exome and RNA sequencing, and inhibitor data from primary AML patient samples, we determined that myelomonocytic leukemia, upregulation of BCL2A1 and CLEC7A, as well as mutations of PTPN11 and KRAS conferred resistance to venetoclax and multiple venetoclax combinations. Venetoclax in combination with an MCL1 inhibitor AZD5991 induced synthetic lethality and circumvented venetoclax resistance.
Introduction
Acute myeloid leukemia (AML) is a molecularly and clinically heterogeneous disease with poor prognosis1-3. Despite substantial research, AML treatment did not evolve profoundly until recently. Since 2017, the US Food and Drug Administration (FDA) approved several new targeted agents for the treatment of AML, including the BCL2-inhibitor venetoclax4-10.
AML cells often up-regulate pro-survival members of the BCL2 family, such as BCL2 and MCL1, to avoid apoptosis11,12. Overexpression of BCL2 is implicated in sustaining the survival of AML cells, conferring a poor prognosis, and inducing treatment resistance12,13. Therefore, targeting BCL2 has long been an attractive strategy to treat AML and other hematological malignancies. Among others, venetoclax is a potent BCL2-selective BH3-mimetic that induces responses in the majority of patients with previously treated Chronic lymphocytic leukemia (CLL) or small lymphocytic lymphoma, and therefore was approved by FDA for the treatment of these diseases14,15. For de novo older AML patients, venetoclax in combination with low dose hypomethylation agents induced about 70% response rates6-8,16. However, it was only modestly effective in relapsed/refractory and/or secondary AML as monotherapy (19% complete remission (CR)/ complete remission with incomplete blood count recovery (CRi)) or coupled with hypomethylation treatment (54% CR/CRi)4,9. Moreover, similar to other targeted therapy, subsequently acquired resistance was observed in most patients following venetoclax treatment.
Several mechanisms have been shown to contribute to venetoclax resistance. One of the main determinants of resistance to venetoclax is the upregulation of other anti-apoptotic BCL2 family proteins, including MCL1, BCL2L1 (BCL-xL), and BCL2L2 (BCL-w)17-20. Another major factor affecting leukemia cell survival and drug sensitivity is the disruption of mitochondrial structure and metabolic-related pathways21-25. Recent genome-wide CRISPR screening studies have identified that knockout of TP53, BAX, and PMAIP1 confers venetoclax resistance, and depletion of mitochondrial chaperonin CLPB can sensitize AML to venetoclax24,26. Studies have also shown that venetoclax-resistant cells exhibit increased phospho-ERK (pERK) and pAKT, suggesting that the upregulation of MAPK and AKT pathways may lead to venetoclax resistance20,27,28. However, most of these studies were conducted in AML cell lines, which do not recapitulate the clinical diversity and genetic heterogeneity of primary AML samples. We, therefore, integrated clinical parameters, whole exome sequence (WES) data, and RNAseq data with primary AML sample venetoclax response data from the Beat AML cohort29, to identify more clinically relevant phenotypic and genomic determinants as biomarkers to predict response to venetoclax30.
Result
Factors influencing venetoclax sensitivity
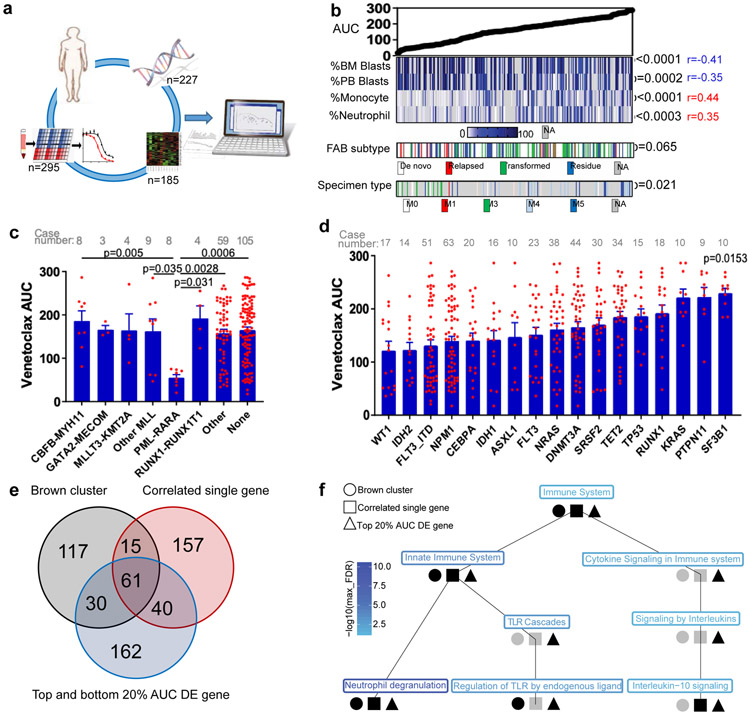
To determine whether sensitivity to venetoclax correlates with prominent clinical characteristics, gene expression, or genetic abnormalities found in AML patients, we analyzed patient samples from the Beat AML cohort that had been subjected to venetoclax screening, many of which had WES, RNAseq, and detailed clinical annotations (Figure 1a). We first compared the distribution of venetoclax sensitivity represented by area under the curve (AUC) to clinical characteristics and common chromosome translocations (Figures 1b-c and Supplementary Table 1). Overall, we found a significant association between venetoclax resistance with low bone marrow (BM)/peripheral blood (PB) blast count, high monocyte/neutrophil count, transformed AML, and FAB M4 and M5 AML subset. In contrast, AML with high blast count, FAB M3, and PML-RARA translocations were more sensitive to venetoclax.
Figure 1. Identification of molecular markers for venetoclax resistance.
a, Schematic of integrating patient clinical, demographic, WES, RNAseq, and venetoclax in vitro screening assay data to identify biomarkers predicting venetoclax response.
b, Venetoclax AUC from primary AML patient samples (N=297 samples) was compared among a multitude of clinical characteristics (Supplementary Table 1). Significance was determined using either two tailed Mann-Whitney or Kruskal-Wallis tests (for categorical variables) or two tailed Pearson correlations (for continuous variables), and corrected for multiple comparisons (Bonferroni correction). The numerical source data have been provided as Source Data_Figure 1b.
c, The graph depict mean ± SEM of venetoclax AUC among different chromosome translocation groups. The presence/absence of translocations was determined from karyotype. Only translocations that were found in ≥3 patients were considered. Significance was determined using a Kruskal-Wallis test. The numerical source data have been provided as Source Data_Figure 1c.
d, The graph depicts mean ± SEM of venetoclax AUCs among common AML mutation groups. Briefly, we compared AUCs from all samples harboring each mutation to AUCs from all other samples WT for that mutation. Mutation data were collected by either targeted sequencing, whole-exome sequencing, or targeted polymerase chain reaction (PCR)-based methods (FLT3-ITD and NPM1). Significance was determined using two tailed Mann-Whitney tests and corrected for multiple comparisons (Bonferroni correction). The numerical source data have been provided as Source Data_Figure 1d.
e, Venn diagrams depict distribution and overlap of the three gene lists: WGCNA brown gene expression cluster, most correlated single genes (single genes correlated with venetoclax AUC with r>=0.5 or r<=0.5 and FDR <0.05), and top 20% DE genes (the most differentially expressed genes between the top 20% and the bottom 20% venetoclax AUC samples) (N=180 samples). For the single-gene correlations, two tailed student's t-tests were used testing whether the slope of the regression line (auc~gene_expression) was different than zero. FDR correction was used for multiple comparison adjustments. For the top 20% and the bottom 20% AUC DE analyses, two tailed student's t-tests were computed testing for significance for the ‘top 20%’ – ‘bottom 20%’ (resistant - sensitive) expression log2 fold changes. The resulting p-values were FDR corrected per inhibitor. We did not perform a familywise error correction. Venn diagrams were generated using an online tool: http://bioinformatics.psb.ugent.be/webtools/Venn/. DE: differentially expressed. The numerical source data have been provided as Source Data_Figure 1e.
f, The graph shown is the Reactome pathway hierarchy containing all pathways significant in at least 1 of the 3 analyses (WGCNA brown gene expression cluster; single genes correlated with venetoclax AUC with r>=0.5 or r<=0.5; and the most DE genes between the top 20% and the bottom 20% AUC samples (N=180 samples)). All pathways were assessed for significance at the FDR <0.05 level based on an over-representation analysis using the hypergeometric distribution and Benjamani-Hochberg adjustment. Black indicates the pathway was significant at FDR <0.05 and grey indicates otherwise. The pathway names are colored by the level of significance with blue being the most significant and light blue being least significant in terms of the maximum of the significant FDR for the three analyses.
Next, we evaluated the relationship between venetoclax sensitivity and common AML mutations. We observed that cases with KRAS, PTPN11, and SF3B1 mutations were relatively resistant to venetoclax (as shown by higher AUCs and hazard ratios>1) (Figure 1d and Extended Data Fig. 1a). Accordingly, these mutations also demonstrated decreased sensitivity to ABT-737 (a BCL2, BCL-w, and BCL-xL inhibitor) (Extended Data Fig. 1b,c). Notably, KRAS, PTPN11, and SF3B1 mutations are mutually exclusive in the Beat AML cohort (Extended Data Fig. 1d). For gene expression, we identified 273 genes correlated with venetoclax AUC with r≥0.5 or r<−0.5 and FDR≤2E-10 (Supplementary Table 2). We also correlated venetoclax sensitivity with the 14 gene expression clusters identified from the Beat AML cohort WGCNA analysis29 (Supplementary Table 3). We observed that the “brown cluster” correlates best with drug sensitivity. Moreover, we compared gene expression between the most sensitive (the lowest 0-20th percentile of AUC) and the most resistant (the highest 80th-100th percentile of AUC) samples. We identified 293 genes with >=3 or <=0.3 -fold changes (Supplementary Table 4). Moreover, there is high overlap among these three gene lists (20.8-27.4%, Figure 1e) and the Reactome pathway analysis demonstrated that they are all associated with immune system, innate immune function, and neutrophil degranulation (Figure 1f).
BCL2A1 overexpression confers venetoclax resistance
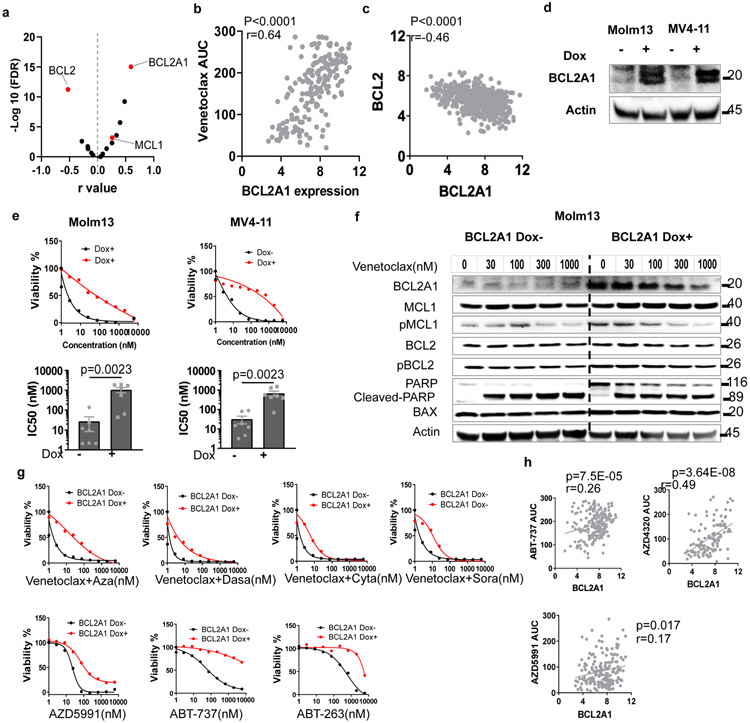
We identified a number of genes whose expression correlates with venetoclax sensitivity. To identify major drivers of venetoclax sensitivity, we first focused on BCL2 family members. As expected, BCL2 expression inversely correlates with venetoclax AUC (Figure 2a). Interestingly, BCL2A1 expression positively correlates with venetoclax AUC, and its correlation is the highest among the 17 common BCL2 family genes (Figures 2a-b and Supplementary Table 1). Moreover, BCL2A1 is in all three lists of genes associated with venetoclax sensitivity. Interestingly, BCL2A1 expression negatively correlates with BCL2 expression (Figure 2c). To investigate if BCL2A1 upregulation causes venetoclax resistance, we transduced four different AML cell lines (Molm13, MV4-11, THP-1, and CTS) with doxycycline (Dox) inducible BCL2A1 overexpression lentivirus (Figure 2d). Indeed, BCL2A1 overexpression induced at least a 20-fold increase of venetoclax IC50 for these cell lines (Figure 2e and Extended Data Fig. 2a). While venetoclax readily induced apoptosis in empty vector (Dox−) cells, less apoptosis occurred in BCL2A1 overexpression cells (Dox+), across different concentrations of venetoclax, as indicated by PARP cleavage (Figure 2f). Given that expression of other anti-apoptotic BCL2 family proteins did not change between Dox+ and Dox− cells (Figure 2f), the BCL2A1-mediated venetoclax resistance phenotype is likely to be an on-target and direct effect of BCL2A1 alone. Furthermore, from cell line models and primary AML inhibitor sensitivity assay, we observed that BCL2A1 overexpression also conferred relative resistance to venetoclax combinations and the majority of other BCL2 family inhibitors in the ex vivo drug assay, but not azacytidine or cytarabine alone (Figures 2g,h and Extended Data Fig. 2a-c).
Figure 2. Overexpression of BCL2A1 confers resistance to BCL2 family inhibitors and venetoclax combinations.
a, Data represent −log10(FDR) values vs. the Pearson r values between venetoclax AUC and BCL2 family gene expression levels from 180 AML patient samples, determined by the two tailed Pearson correlation coefficients. Two tailed student's t-tests were used testing whether the slope of the regression line (auc~gene_expression) was different than zero and adjusted for multiple comparisons using FDR correction. The numerical source data have been provided as Source Data_Figure 2a.
b, Correlation between BCL2A1 gene expression levels and venetoclax AUC (N=180 samples) from Beat AML patient samples determined by a two tailed Pearson correlation coefficient. The numerical source data have been provided as Source Data_Figure 2b.
c, Correlation between BCL2A1 and BCL2 gene expression levels from Beat AML patient samples (N=601 samples) determined by a two tailed Pearson correlation coefficient. The numerical source data have been provided as Source Data_Figure 2c.
d, Western blot showing overexpression of BCL2A1 from Molm13 and MV4-11 cells transduced with Dox-inducible BCL2A1 virus in the presence of Dox. Actin was used as a control. The blot shown is representative of two independent experiments with consistent results. The image source data have been provided as Source Data Fig. 2.
e, Representative graphs depict higher viabilities (mean from 3 technical replicates) of Molm13 and MV4-11 cells transduced with Dox-inducible BCL2A1 virus in the presence of Dox and dose gradients of venetoclax (top). Bar graphs depict higher mean ± SEM of venetoclax IC50 (N=7 independently repeated experiments) of Molm13 and MV4-11 cells transduced with Dox-inducible BCL2A1 virus in the presence of Dox (bottom). Significance was determined using two tailed Mann-Whitney tests.
f, Western blot analysis of BCL2 family proteins and full-length/cleaved PARP of Molm13 cells transduced with Dox-inducible BCL2A1 virus in the absence or presence of Dox and dose gradients of venetoclax for 16 hours (h). Actin was used as a control. Blots shown are representative of two independent experiments with consistent results. The image source data have been provided as Source Data Fig. 5.
g, Graphs depict the viabilities (mean from 3 technical replicates) of Molm13 and MV4-11 cells transduced with Dox-inducible BCL2A1 virus in the absence or presence of Dox and indicated venetoclax combination and other BCL2 inhibitors. Graphs shown are representative of two independent experiments. Aza: azacytadine; Dasa: dasatinib; Cyta: cytarabine; and Sora: sorafenib. The numerical source data have been provided as Source Data_Figure 2g.
h, Graphs depict the correlation between BCL2A1 gene expression levels ABT-737 (N=209 samples), AZD4320 (N=119 samples), or AZD5991 from AML patient samples (N=178 samples) determined by two tailed Pearson correlation coefficient tests. The numerical source data have been provided as Source Data_Figure 2h.
Next, we compared the expression of BCL2A1, BCL2, and MCL1 among different leukemia subsets by mining previous large cohort gene expression datasets31-33. We observed that CLL samples demonstrated higher BCL2, lower BCL2A1, and a similar level of MCL1 expression compared to AML or acute lymphoblastic leukemia (Extended Data Fig. 2d). This may explain the high sensitivity of venetoclax in CLL samples and the low response rate of venetoclax alone in AML samples. Accordingly, AML samples with PML-RARA fusion that were venetoclax sensitive also demonstrated relatively high BCL2, low BCL2A1, and similar MCL1 expression compared to other subsets of AML samples (Extended Data Fig. 2e). In contrast, AML samples with low blast count, a high neutrophil count, FAB M4/M5, and/or transformed AML that were venetoclax resistant also demonstrated relatively high BCL2A1 expression (Extended Data Fig. 2f-h).
Targeting BCL2A1 induces apoptosis, inhibits cell growth, and synergizes with venetoclax
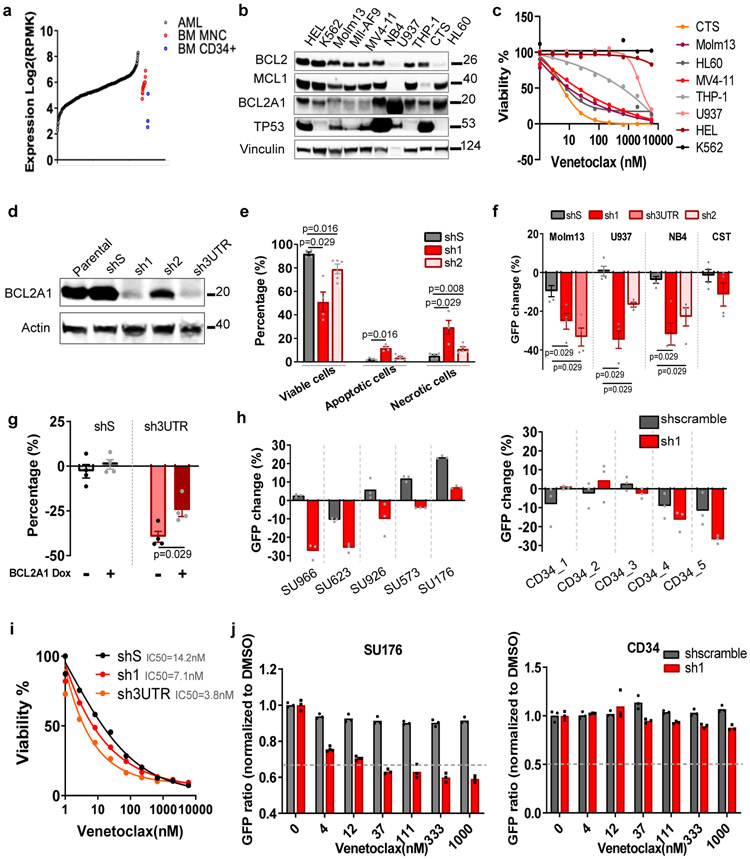
In normal hematopoiesis, BCL2A1 expresses at a low level in hematopoietic stem cells (HSC), and a high level in mature monocytes and granulocytes (Extended Data Fig. 3a). We also observed that BCL2A1 was upregulated in the majority, MCL1 in more than half, and BCL2 in a small subset of AML samples (Figures 3a and Extended Data Fig. 3b). Moreover, previous studies showed that BCL2A1 knockout mice are viable, fertile, and demonstrate minimal defects in HSC function and myeloid cell differentiation34. This prompted us to further investigate whether knockdown of BCL2A1 has an anti-leukemia effect, while sparing normal hematopoiesis. We observed that AML cell lines express various levels of BCL2A1, which partially correlates with venetoclax sensitivity (Figures 3b,c). Knockdown of BCL2A1 with shRNA (sh1, sh2, and sh3UTR), but not the scramble control (shS) induced enhanced apoptosis in U937 cells and inhibited cell growth in different AML cell lines (Figures 3D-F and Extended Data Fig. 3c). The anti-growth effect could be partially rescued by overexpression of BCL2A1 (Figure 3g), indicating an on-target effect. Notably, knockdown of BCL2A1 also inhibited the growth of majority of primary AML cells, but only a subset of CD34+ cord blood hematopoietic stem and progenitor cell (HSPC) controls (Figure 3h). Consistent with data from BCL2A1 knockout mice34, knockdown of BCL2A1 did not affect CD34+ HSPC colony-forming ability (Extended Data Fig. 3d), indicating a desirable therapeutic window to target BCL2A1 upregulated leukemia cells while sparing healthy HSPCs. Furthermore, knockdown of BCL2A1 sensitized Molm13 cells and primary AML cells to venetoclax, but not CD34+ HSPCs (Figure 3i,j).
Figure 3. Targeting BCL2A1 induces apoptosis, inhibits cell growth, and synergizes with venetoclax.
a, BCL2A1 expression in 453 primary AML samples, 3 BM CD34+ HSPCs, and 19 BM MNC controls.
b, Western blot analyses of BCL2 family proteins in AML cell lines. Vinculin was used as a control. The experiment was conducted twice independently with similar results. The image source data have been provided as Source Data Fig. 3.
c, The graph depicts cell viabilities (mean from 3 technical replicates) of AML cell lines in the presence of dose gradients of venetoclax. The graph is representative of two independent experiments with consistent results. The numerical source data have been provided as Source Data_Figure 3c.
d, Western blot analysis of BCL2A1 expression of U937 cells transduced with control shS or shRNA targeting BCL2A1 (sh1, sh2, and sh3UTR). Actin was used as a control. The experiment was conducted twice independently with similar results. The image source data have been provided as Source Data Fig. 5.
e, The graph depicts mean ± SEM of percentages of viable (Annexin V−/PI−), apoptotic (Annexin V+/PI−), and necrotic cells (Annexin V+/PI+) of U937 cells transduced with shS, sh1, and sh2 48h after FACS sorting as assessed by flow cytometry (five independent experiments). Significance was determined using two tailed Mann-Whitney tests comparing to the respective shS control.
f, The graph depicts the mean ± SEM of percentage changes of indicated double transduced cells (GFP+) after 72h cell culture (N=15 independent experiments). Significance was determined using two tailed Mann-Whitney tests, comparing to the respective shS control.
g, The graph depicts the mean ± SEM of percentage changes (N=4 independent experiments) of shS or sh3UTR transduced (GFP+) U937 cells expressing Dox-inducible BCL2A1 construct in the presence or absence of Dox after 72h of cell culture. Significance was determined using two tailed Mann-Whitney tests comparing to the respective Dox− control.
h, The graph depicts percentage changes (N=3 cell culture technical replicates) of shS and sh1 transduced (GFP+) primary AML cells (left) and CD34+ cord blood HSPCs (right). The numerical source data have been provided as Source Data_Figure 3h.
i, The graph depicts the mean ± SEM of cell viabilities (N=3 technical cell culture replicates) of Molm13 cells transduced with shS, sh1, and Sh3UTR in the presence of dose gradients of venetoclax. The graph is representative of two independent experiments with consistent results. The numerical source data have been provided as Source Data_Figure 3i.
j, The graph depicts GFP ratios (normalized to non-transduced cells, N=3 technical cell culture replicates) of shS and sh1 transduced (GFP+) primary AML cells (left) and CD34+ cord blood HSPCs (right) in the presence of concentration gradients of venetoclax. The numerical source data have been provided as Source Data_Figure 3j.
High expression of CLEC7A or CD14 predicts venetoclax resistance
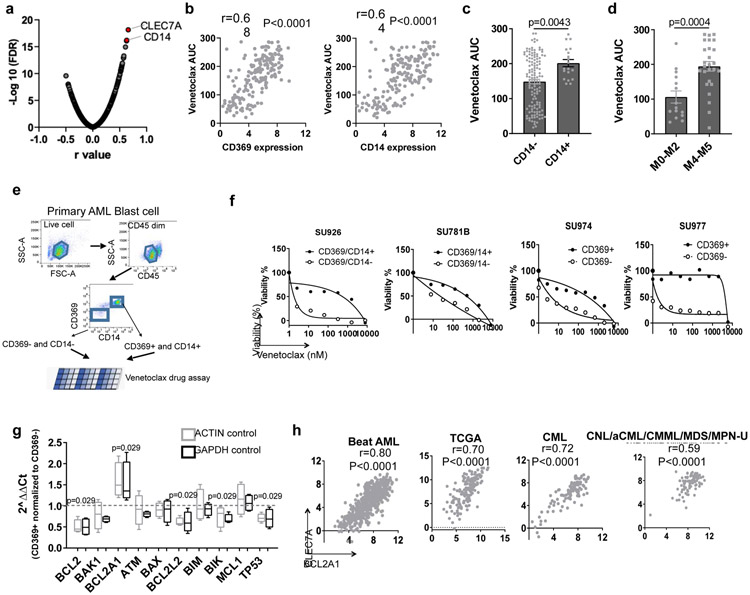
To identify clinically applicable cell surface markers that could be used as biomarkers for venetoclax sensitivity and/or BCL2A1 upregulation, we screened the correlation between venetoclax and cell surface Gene Ontology (GO) Term related genes. The top two genes are CLEC7A (encodes CD369) and CD14, which are cell surface markers for granulocyte and monocyte that express at low levels in normal HSPCs as shown by multiple large cohort RNAseq analysis (Figures 4a-b and Extended Data Fig. 4a). CLEC7A and CD14 express at higher levels in AML M4 and M5 subsets, and at a lower lever in AML with PML-RARA or M3 (Extended Data Fig. 4b). Accordingly, leukemia blasts with CD14 expression demonstrated higher venetoclax AUCs compared to leukemia blasts with no CD14 expression determined by clinical immunophenotyping in the Beat AML cohort (Figure 4c). Furthermore, AML FAB M4/M5 subgroups, especially M4, showed higher venetoclax AUC comparing to FAB non-M4/M5 subsets (Figure 4d).
Figure 4. Expression of CLEC7A or CD14 predicts venetoclax sensitivity.
a, Data represent −log10(FDR) values vs. the Pearson r values between venetoclax AUC and gene expression levels of cell surface GO term genes from 180 AML patient samples, determined by a two tailed Pearson correlation coefficient test. The list of cell surface proteins is provided as Source Data_Figure 4a.
b, Correlation between CLEC7A and CD14 gene expression levels and venetoclax AUC (N=180 samples) from AML patient samples determined by two tailed Pearson correlation coefficient tests.
c, The graph depicts the mean ± SEM of venetoclax AUCs of primary AML patient samples categorized based on the presence (N=19 samples) or absence of CD14 (N=131 samples) expression detected by clinical flow cytometry. Significance was determined using a two tailed Mann-Whitney test.
d, The graph depicts the mean ± SEM of venetoclax AUCs of primary AML patient samples in the non-M4/M5 (N=15 samples) and M4/M5 (N=26 samples) groups for those samples with clinical annotation. Significance was determined using a two tailed Mann-Whitney test.
e, Schematic diagram of isolating CD369 and/or CD14 positive and negative primary AML blasts and performing venetoclax sensitivity assay.
f, Graphs depict cell viabilities (mean from 3 technical replicates) of CD369/CD14+ or CD369/CD14− primary leukemia blast cells in the presence of dose gradients of venetoclax from 4 different leukemia patients’ samples. The numerical source data have been provided as Source Data_Figure 4f.
g, The box plot depicts the 5-95 percentile of 2^ΔΔCt of indicated apoptosis-related genes between CD369 and/or CD14 positive and negative primary AML blasts (N=4 biologically independent experiments). ACTIN and GAPDH were used as controls. Significance was determined using two tailed Mann-Whitney tests. The numerical source data have been provided as Source Data_Figure 4g.
h, Graphs depict positive correlations between CLEC7A and BCL2A1 gene expression of primary patient samples from the Beat AML (N=601 samples), TCGA AML (N=173 samples), CML (N=102 samples), and CNL/aCML/CMML/MDS/MPN-U (N=94 samples) cohorts determined by two tailed Pearson correlation coefficient tests. The numerical source data have been provided as Source Data_Figure 4h.
To further validate that CD369 and CD14 surface expression is associated with venetoclax resistance, we sorted leukemic blasts from individual patient samples into CD369 and/or CD14 positive and negative cells and performed a venetoclax sensitivity assay (Figures 4e). CD369 and/or CD14+ blasts demonstrated higher venetoclax AUC compared to CD369 and/or CD14− blasts in all 4 primary AML samples tested (Figure 4f). Furthermore, CD369 and/or CD14+ cells express higher BCL2A1, and lower BCL2 and TP53 compared to the marker negative blast cells (Figure 4g). Notably, CLEC7A and CD14 expression correlates with BCL2A1 expression in the Beat AML, AML TCGA3, a CNL, and an internal CML (paper in preparation) cohort35 (Figure 4h). However, overexpression of BCL2A1 did not upregulate CD369 (Extended Data Fig. 4c). Direct overexpression of CD369 neither upregulated BCL2A1 expression, nor induced venetoclax resistance (Extended Data Fig. 4d,f,g). Interestingly, KRAS mutation was the top gene alteration associated with increased CLEC7A and CD14 expression in the Beat AML cohort (Extended Data Fig. 4g). These data indicate that high expression of CLEC7A and CD14 in a subset of AML cases, including AML with KRAS mutations, is associated with venetoclax resistance, likely due in part to high expression of BCL2A1 in these cells as a consequence of myelomonocytic differentiation.
KRAS mutations confer venetoclax resistance
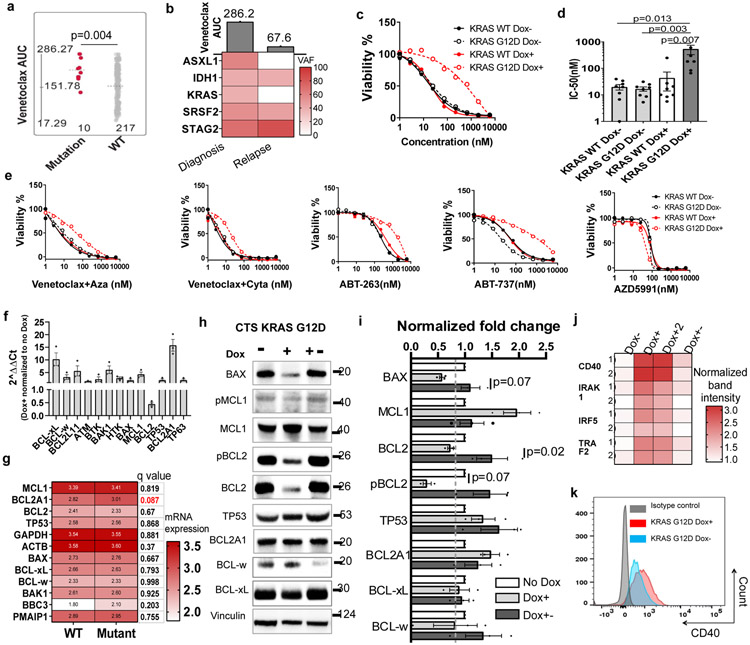
From the Beat AML cohort, we also observed that KRAS mutations demonstrated higher venetoclax AUC compared to KRAS wild type (WT) samples (Figures 1d and 5a). Interestingly, one AML patient sample was venetoclax resistant before chemotherapy with KRAS, IDH1, ASXL1, SRSF2, and STAG2 mutations, but became venetoclax sensitive at disease relapse with the loss of KRAS and ASXL1 mutations (Figure 5b). To further investigate if it is the KRAS mutation, but not the co-occurring mutations that accounts for resistance to venetoclax, we overexpressed KRAS WT and G12D with a Dox-inducible lentivirus in three different AML cell lines. We observed that KRAS G12D, but not KRAS WT, induced venetoclax resistance in all three AML cell lines, and venetoclax resistance is reversible upon Dox withdrawal (Figure 5c,d and Extended Data Fig. 5a). Interestingly, NRAS G12D did not confer venetoclax resistance as shown from the primary patient data and our cell line models (Extended Data Fig. 5b,c). Furthermore, KRAS G12D also conferred resistance to venetoclax combinations and two BCL2, BCL-w, and BCL-xL inhibitors (ABT-263 and ABT-737), but not an MCL1 inhibitor AZD5991, or other single agents (Figure 5e and Extended Data Fig. 5d,e).
Figure 5. KRAS mutations confer venetoclax resistance.
a, The graph demonstrates higher venetoclax AUCs in AML samples harboring KRAS mutations (N=10 samples) compared to samples without KRAS mutations (N=217 samples). Significance was determined using a two tailed Mann-Whitney test. Slashed line indicates the mean of the group.
b, The graph summarizes the change of mutation VAF and venetoclax AUC from an AML patient at diagnosis and disease relapse.
c, Representative graphs depict cell viabilities (mean from 3 technical replicates) of Molm13 transduced with Dox-inducible KRAS WT and G12D virus in the absence or presence of Dox and dose gradients of venetoclax. The experiment was performed 8 times independently with consistent results. The numerical source data have been provided as Source Data_Figure 5c.
d, The graph depicts the mean ± SEM of IC50 (N=8 biological independently repeated experiments) of Molm13 cells expressing Dox-inducible KRAS WT and G12D virus in the absence or presence of Dox. Significance was determined using a Kruskal-Wallis test. The numerical source data have been provided as Source Data_Figure 5d.
e, Graphs depict cell viabilities (mean from 3 technical replicates) of Molm13 transduced with Dox-inducible KRAS WT and G12D virus in the absence or presence of Dox and dose gradients of venetoclax combinations and other BCL2 family inhibitors. The graph is representative of two independent experiments. Aza: azacytidine; Cyta: cytarabine. The numerical source data have been provided as Source Data_Figure 5e.
f, Graphs depict 2^ ΔΔCt of indicated apoptosis-related genes of KRAS G12D expressing cells in the presence of Dox normalized to cells cultured in the absence of Dox (N=4 independent experiments). HPRT was used as a control. Significance was determined using two tailed Mann-Whitney tests. The numerical source data have been provided as Source Data_Figure 5f.
g, The graph depicts the mean log2 expression of the listed gene in samples in KRAS mutant (N=25 samples) and WT (N=597 samples) group. RNAseq analysis from the BeatAML cohort exported from cBioPortal (https://www.cbioportal.org/). Two tailed student's t-tests were performed and corrected Benjamini-Hochberg procedure. Please find more information at cBioPortal website.
h, Western blot analyses of BCL2 family proteins extracted from Molm13 cells transduced with Dox-inducible KRAS G12D virus in the absence of Dox, presence of Dox, or after Dox withdrawal for more than 3 weeks. The graph is representative of three independent experiments with similar results. The image source data have been provided as Source Data Fig. 5.
i, The graph depicts the mean ± SEM of western blot band intensities quantified using ImageJ software. The bar graph depicts normalized fold changes of the band intensity of BCL2 family proteins extracted from inducible KRAS G12D expressing cells in the presence of Dox normalized to cells cultured without Dox. Significance was determined using two tailed Mann-Whitney tests from three independent experiments.
j, The graph summarizes the dot intensities from the NFkB pathway proteome array blot quantified using ImageJ Figi software. Each antibody is spotted in duplicate. Dox conditions have two biological independently established replicates. No Dox and Dox withdrawal controls were established once. Image source data have been provided as Extended Data Fig. 5j.
k, Representative flow cytometry overlayed histograms showing increased CD40 expression in KRAS G12D cells in the presence of Dox. The graph is representative of two independent experiments with consistent results.
To explore the potential underlying mechanisms associated with KRAS mutant-mediated venetoclax resistance, we performed RT-PCR and immunoblot analysis. We observed that KRAS G12D-expressing cells demonstrated a trend of reduced BCL2 and increased BCL2A1 transcripts (Figure 5f). Notably, AML samples harboring KRAS mutations also demonstrated increased BCL2A1 mRNA (Figure 5g). At the protein level, significantly reduced BCL2, pBCL2, and BAX, and a trend of increased MCL1 and BCL2A1 were observed in KRAS-mutant expressing cells, which have been shown previously or are shown in the current study to be associated with resistance to venetoclax (Figures 5h,i and Extended Data Fig. 5f-i)26,27,36,37. Furthermore, we observed that KRAS G12D also upregulated several NF-KB responsive genes, including CD40 (Figure 5j,k and Extended Data Fig. 5j), which has been shown to confer venetoclax resistance17,38, and upregulate BCL2A139,40. We did not observe obvious changes of BCL2 family proteins and CD40 in NRAS G12D cells (Extended Data Fig. 5g,h and 5k). These data, together with the inhibitor data showing that KRAS mutant cells remained sensitive to MCL1 inhibition, suggest that KRAS mutations induce venetoclax resistance, at least partially through upregulation of MCL1.
PTPN11 mutations confer venetoclax resistance
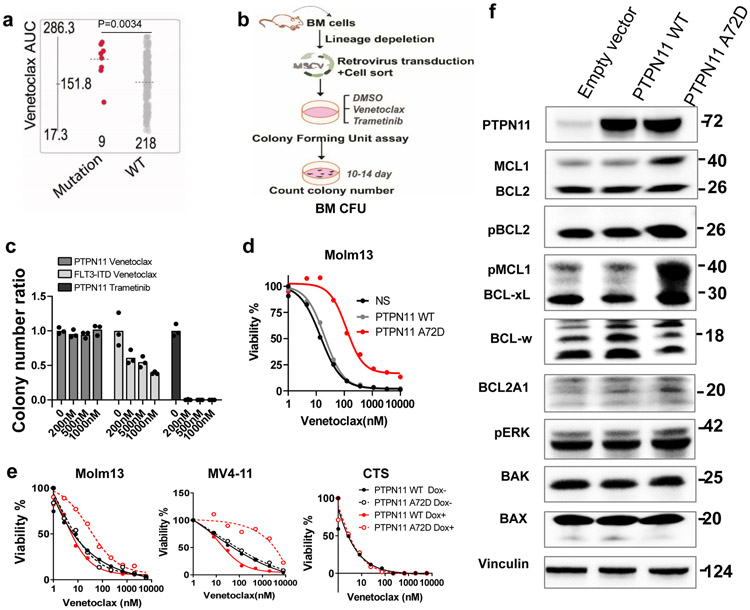
To investigate if PTPN11 mutation alone is sufficient to induce the venetoclax resistance observed in the Beat AML cohort (Figures 1d and 6a), we overexpressed mutant PTPN11 in mouse BM lineage-negative hematopoietic stem and progenitor cells (HSPCs) and three human AML cell lines (Figures 6b,c). We observed that PTPN11 A72D transduced cells were relatively resistant to venetoclax compared to FLT3-ITD transduced HSPCs (Figure 6c). While trametinib was able to kill all PTPN11 A72D transduced cells at a low dose (200nM), venetoclax failed to kill PTPN11 A72D cells even at a high does (1000nM). Interestingly, PTPN11 mutant induced venetoclax resistance upon inducible or constitutive expression in Molm13 and MV4-11 cells, but not CTS cells, which express a low level of MCL1 (Figure 6d,e and Extended Data Fig. 6a-c). Interestingly, venetoclax combinations, ABT-263, and ABT-737 could partially correct PTPN11 A72D mediated resistance, whereas AZD5991 could completely overcome PTPN11 mutant mediated resistance, in both our cell line models and the Beat AML primary patient screening assay (Extended Data Fig. 6d,e).
Figure 6. PTPN11 mutations confer venetoclax resistance.
a, The graph demonstrates higher venetoclax AUCs in AML samples with PTPN11 mutations (N=9 samples) compared with PTPN11 WT samples (N=218 samples). Significance was determined using a two tailed Mann-Whitney test. The slashed line indicates the mean of the group.
b, Schematic illustrates BM CFU assay.
c, The graph depicts the normalized colony number ratios (N=3 technical cell culture replicates) of PTPN11 A72D transduced BM HSPCs treated with gradient concentrations of venetoclax or trametinib. The graph is representative of two independent experiments with similar results. The numerical source data have been provided as Source Data_Figure 6c.
d, Representative graphs depict viabilities (mean from 3 technical replicates) of Molm13 transduced with lentivirus encoding an empty vector, PTPN11 WT, or A72D constitutively. The graph is representative of two independent experiments with consistent results. The numerical source data have been provided as Source Data_Figure 6d.
e, Representative graphs depict cell viabilities (mean from 3 technical replicates) of Molm13, MV4-11, and CTS cells transduced with Dox-inducible PTPN11 WT and A72D virus in the absence or presence of Dox and dose gradients of venetoclax. The graph is representative of two independent experiments. The numerical source data have been provided as Source Data_Figure 6e.
f, Western blot analyses of BCL2 family proteins extracted from Molm13 cells expressing an empty vector, PTPN11 WT, or PTPN11 A72D constitutively. Actin was used as a control. Blots are representative of three independent experiments. The image source data have been provided as Source Data Fig. 6.
We further performed BCL2 protein immunoblotting to understand the mechanisms associated with PTPN11 mutant-mediated venetoclax resistance. We observed that PTPN11 A72D induced enhanced and/or sustained MCL1, pMCL1, and BCL-xL expression (Figures 6f and Extended Data Fig. 6f). These data suggest that mutant-PTPN11 mediated venetoclax resistance is at least partially dependent on increased MCL1 and BCL-xL, which could be targeted by the MCL1 inhibitor AZD5991 and partially by BCL-xL inhibitors ABT-263 and ABT-737.
Venetoclax in combination with the MCL1 inhibitor AZD5991 overcomes venetoclax resistance by eliminating MCL1
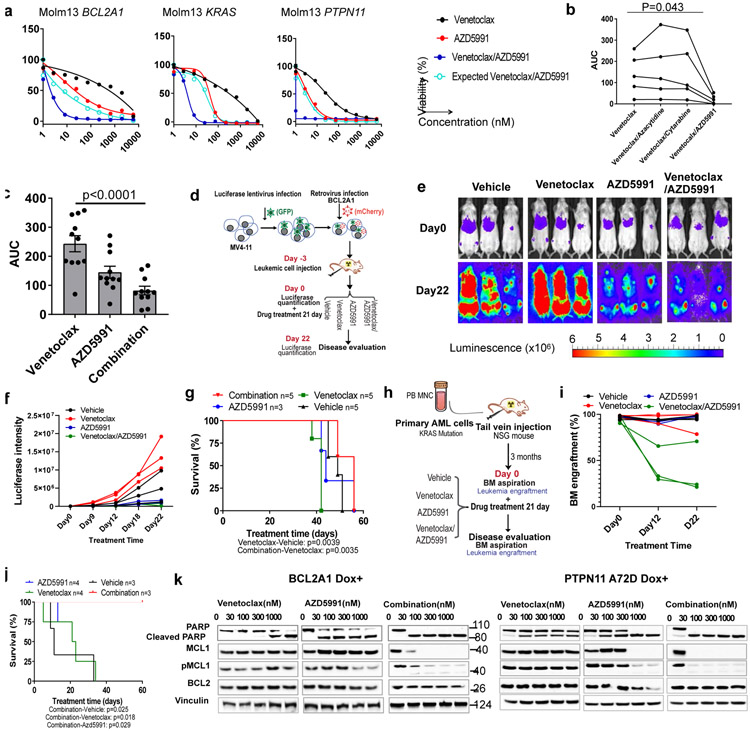
Recent studies have shown that MCL1 inhibitors alone or in combination with venetoclax can overcome venetoclax resistance and are tolerable in human MCL1 knock-in AML xenograft models41-43. Therefore, we determined whether venetoclax, coupled with the MCL1 inhibitor AZD5991 could circumvent the resistance mediated by BCL2A1 overexpression, and KRAS and PTPN11 mutations. Excitingly, we observed that this combination demonstrated robust cytotoxicity and synergy in all three venetoclax resistant settings, including induction of full sensitivity for KRAS and PTPN11 mutations, and partial rescue of BCL2A1 overexpression-mediated resistance (Figures 7a,b and Extended Data Fig. 7a) in cell line models. For primary AML samples, venetoclax in combination with azacytidine or cytarabine remained resistant to venetoclax highly resistant samples (AUC>200); whereas the venetoclax/AZD5991 combination was effective and synergistic independent of the venetoclax sensitivity in the majority of the cases (Figure 7b-c, Extended Data Fig. 7b,c, and Supplementary 5-6). To test this in vivo, we overexpressed BCL2A1 in MV4-11 cells expressing luciferase and injected transduced cells into NOD/SCID/gamma (NSG) mice (Figure 7d). After confirmation of engraftment, the mice were randomly assigned to four treatment groups: vehicle, venetoclax, AZD5991, or combination. We observed that AZD5991 slowed leukemia progression and the combination significantly reduced the leukemia burden and extended overall survival (Figure 7e-g). We also generated a xenograft model from a primary patient sample harboring a KRAS G12D mutation (Figures 7h). Strikingly, we observed that the combination dramatically reduced leukemic infiltration in the BM and extended overall survival (Figures 7i,j). Mechanistically, we observed that venetoclax in combination with AZD5991 eliminated MCL1 and pMCL1 robustly even at a low concentration (30nM) (Figure 7k), which might be responsible for the robust cytotoxic effect of the combination.
Figure 7. Venetoclax and AZD5991 in combination treatment overcomes venetoclax resistance.
a, Graphs depict cell viabilities (mean from 3 technical replicates) of BCL2A1, KRAS G12D, and PTPN11 A72D transduced cells treated with indicated inhibitors in the presence of Dox. EOB was used to calculate the expected effect of the combination. The graphs are representative of two independent experiments with similar results. EOB; Excess over Bliss. The numerical source data have been provided as Source Data_ Figure 7a_Extended data Fig.7a
b, The graph depicts the AUCs of the indicated drug from 5 primary AML samples. Available samples were used from adult patients with myeloid malignancies from both genders and all age groups. Significance was assessed using a matched one way ANOVA (Friedman test). The numerical source data have been provided as Source Data_ Figure 7b_Extended Data Fig.7b.
c, The graph depicts the mean ± SEM of drug AUCs of venetoclax, AZD5991, and two drugs in combination from 10 primary AML samples. Available samples were used from adult patients with myeloid malignancies from both genders and all age groups. Significance was assessed using a two tailed Kruskal-Wallis test.
d, Schematic illustrates the in vivo model of BCL2A1 mediated venetoclax resistance (MV4-11 cells overexpressing BCL2A1).
e, Serial bioluminescence images of MV4-11 BCL2A1 overexpression-engrafted NSG mice during treatment. The experiment was performed once.
f, The graph depicts luciferase intensity (average radiance (p/s/cm2/sr), N=3 mice) of MV4-11 cells expressing BCL2A1 in the presence of indicated treatment. The experiment was performed once. The numerical source data have been provided as Source Data_Figure 7f.
g, Survival curves of 7-week old female NSG mice transplanted with BCL2A1 and luciferase-GFP treated with indicated drugs. The experiment was performed once. The numerical source data have been provided as Source Data_Figure 7g.
h, Schematic outline of the mouse model of KRAS mutation mediated venetoclax resistance (primary AML cell).
i, The graph depicts BM engraftment (N=3 mice) of SU176 patient AML cells in 7-week old female NSG mice before and during treatment. The experiment was performed once. The numerical source data have been provided as Source Data_Figure 7i.
j, Survival curves of mice transplanted with blasts from SU176 leukemia sample harboring a KRAS G12D mutation treated with indicated drugs. N refers to the number of mice. The numerical source data have been provided as Source Data_Figure 7j.
k, Western blot analyses of BCL2 family proteins of Molm13 cells expressing BCL2A1 (left) and PTPN11 A72D (right) in the presence of Dox-treated with dose gradients of venetoclax, AZD5991, and the two drugs in combination for 16h. Blots are representative of two independent experiments. The image source data have been provided as Source Data Fig. 7.
Discussion
Previous studies have shown that venetoclax sensitivity correlates and depends on BCL2 expression, and upregulation of BCL-xL and MCL1 have been identified as major contributors to venetoclax resistance9,19. Surprisingly, we observed from the Beat AML cohort that among BCL2 family members, high BCL2A1 expression demonstrates the strongest correlation with venetoclax resistance. This finding is confirmed by a recent study from another independent AML patient cohort44. We further validated that BCL2A1 upregulation mediated resistance to venetoclax-induced apoptosis in AML cell line models. Importantly, BCL2A1 overexpression also conferred relative resistance to common venetoclax combinations and other BCL2 family targeted therapies. This is in agreement with a previous study showing BCL2A1 expression inversely correlated with the activity of ABT-737 in CLL45. Notably, studies have also implicated that long-term treatment with BCL2 inhibitors and other chemotherapeutics can further upregulate the expression of BCL2A1, leading to BCL2 inhibitor resistance and chemoresistance46,47. Therefore, there is an immediate unmet need for targeting BCL2A1 in AML. In the absence of a pharmacologic inhibitor of BCL2A1, we knocked down BCL2A1 with shRNAs, leading to inhibition of growth and enhanced apoptosis of leukemia cells and synergized with venetoclax to inhibit AML cell survival.
Using clinically applicable markers to identify patients who are most likely to respond to a particular treatment is a critical step for future AML clinical management with the recent approval of an increasing number of novel therapies. In the current study, we identified that AML with high monocyte/neutrophil count, FAB M4/M5, AML with high levels of monocyte/neutrophil markers (CD14/CLEC7A), and MDS/MPN transformed AML are relatively resistant to venetoclax. These phenotypic markers may correlate with increased expression of BCL2A1 in monocytic leukemia precursors and their progeny, as we observed high BCL2A1 expression in M4/M5 and transformed AML, strong positive correlation between CLEC7A/CD14 and BCL2A1 expression, and specifically increased expression of BCL2A1 in the monocyte and granulocyte lineages during hematopoietic differentiation. This is in line with previous studies which suggest that cell differentiation status affects venetoclax sensitivity39,48-50, and a recent study that showed that monocytic subclones expanded and conferred resistance to venetoclax-azacytidine therapy51. AML blast counts, PB counts, and immunophenotyping are already routinely performed in clinical evaluation, therefore, blast and monocyte/neutrophil count, as well as CD14 expression, are ideal biomarker candidates to predict response to venetoclax-containing regimens. Unfortunately, CD369 is not included in most current immunophenotyping panels and FAB phenotype is less frequently assessed and reported in clinical practice. For predicting response to venetoclax-containing regimens, our data strongly support the continued evaluation of the FAB subtype as well as the addition of CD369 into immunophenotyping panels.
BCL2 family genes are rarely mutated in leukemia. However, a myriad of genetic changes accompanies the evolution of a normal cell to a cancer cell, partly by affecting BCL2 family members. KRAS mutations were previously shown to induce BCL-xL upregulation, which subsequently mediates treatment resistance in solid tumors52,53. In the current study, we identified and validated that KRAS mutations conferred resistance to venetoclax monotherapy or combination treatment, by downregulating BCL2 and BAX and upregulating MCL1 and BCL2A1, possibly through activation of the NFkB pathway, rather than only through ERK pathway activation, since we observed upregulation of pERK by both NRAS and KRAS mutants (Extended Data Fig. 5g), yet NRAS mutations did not induce venetoclax resistance. PTPN11 mutations were previously shown to upregulate MCL1 to accelerate MLL-AF9-mediated leukemogenesis54. PTPN11 mutations have also been shown to promote BM hematopoietic progenitor cell survival55 and lung tumorigenesis by upregulating BCL-xL56. Consistent with these findings, we determined that PTPN11 mutations conferred venetoclax resistance via upregulating MCL1, pMCL1, and BCL-xL, which could be circumvented by BCL-xL and MCL1 inhibition. Further studies are ongoing to determine the detailed mechanisms of the dysregulated BCL2 family pathway by KRAS and PTPN11 mutations in AML. Next-generation sequencing has become part of routine clinical practice in the treatment of AML, and KRAS and PTPN11 hotspot mutations are included in common AML genetic testing panels making them good candidates as biomarkers for venetoclax-containing regimens.
As we have established biomarkers for venetoclax resistance, we further explored potential therapeutics to overcome venetoclax resistance. We observed that the venetoclax and AZD5991 combination could overcome venetoclax resistance and demonstrated robust synergy across all three venetoclax resistant cell line models and primary AML patient samples in vitro and in vivo. We further uncovered evidence that this drug combination robustly eliminates MCL1 and pMCL1 that may account for the synergistic effects.
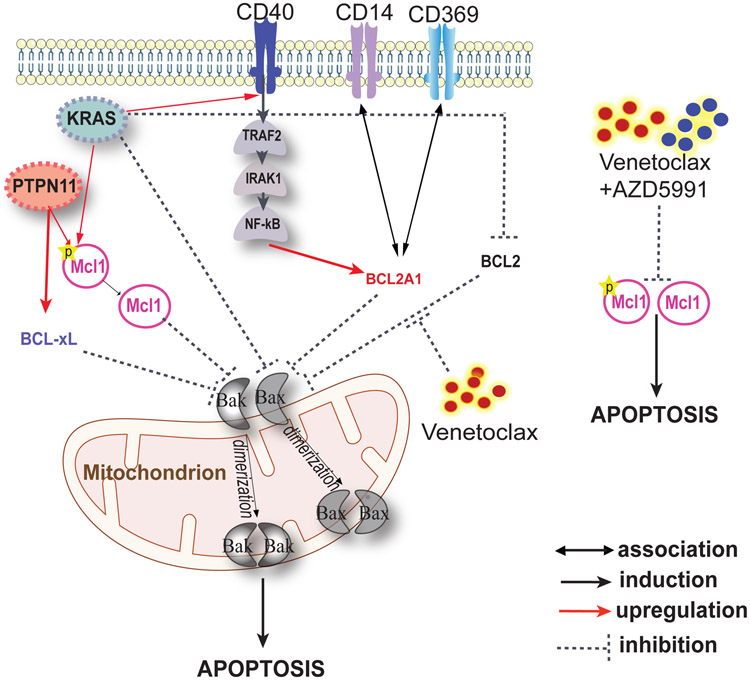
The encouraging efficacy of novel targeted therapies has brought about huge advances in the treatment of AML. However, patients exhibit heterogeneous responses and often develop resistance that limits long-term disease-free and overall survival. Establishing biomarkers to predict drug response and exploration of alternative therapeutics to overcome drug resistance are ongoing areas of investigation. By mining large leukemia functional genomic data sets from the Beat AML cohort, we have identified, validated, and revealed the mechanisms of clinically applicable biomarkers for venetoclax resistance in AML, and further determined that venetoclax in combination with the MCL1 inhibitor AZD5991 can overcome venetoclax resistance (Figure 8).
Figure 8. Schematic illustrates phenotypic markers and mechanisms associated with venetoclax resistance.
High expression of BCL2A1 confers venetoclax resistance. High expression of cell surface marker CD369 and CD14 confers venetoclax resistance, potentially through correlation with high BCL2A1 expression. KRAS mutations are resistant to venetoclax through downregulating BCL2 and BAX, as well as upregulating BCL2A1, MCL1, and CD40. PTPN11 mutations confer venetoclax resistance through upregulation of MCL1 and BCL-xL. Venetoclax in combination with AZD5991 demonstrates robust efficacy and synergy by eliminating MCL1 and pMCL.
Methods
Patient Samples
Samples were obtained with written, informed consent obtained from all patients according to the Declaration of Helsinki and approved Institutional Review Boards (IRB) protocol (Oregon Health & Science University (OHSU) IRB no. 4422; Stanford IRB no. 18329 and 6453). Mononuclear cells (MNCs) were isolated by Ficoll gradient centrifugation from freshly obtained BM aspirates or PB draws. Cells were frozen in liquid nitrogen for subsequent flow cytometry (FACS) analysis and inhibitor assay. Stanford primary AML sample information is summarized in Supplementary Table 5-6. Available samples were used from both gender and all age ranged adult patients with myeloid malignancies.
Cell Cultures
HEK 293T/17 cells (provided by Dr. Richard Van Etten) were maintained in DMEM supplemented with 10% FBS, L-glutamine, and penicillin/streptomycin. Molm13, MV4-11, CTS, U937, K562, NB4, HEL, and THP-1 were maintained in RPMI 1640 (Invitrogen) supplemented with 10% FBS, L-glutamine, and penicillin/streptomycin. Mycoplasma contamination was routinely tested (once per month). Only mycoplasma free cells were used in the experiments. Authentication was performed on all cell lines used in this study at the OHSU DNA Services Core facility. Primary leukemia cells were cultured in IMDM supplemented with 20% FBS, L-glutamine, IL-3 (50ng/ml), IL-6 (25ng/ml), FLT3 ligand (50ng/ml), TPO (50ng/ml) and SCF (100ng/ml). Molm13 cells were obtained from Sanger Institute Cancer cell line panel; CTS cells were provided by Dr. Jude Fitzgibbon from Barts Cancer Institute UK, and all the other cell lines were purchased from ATCC. All cytokines are purchased from Peprotech.
Mice
All animal studies were performed in accordance with protocols approved by Stanford Animal Care and Use Committees. Seven-week-old female NSG mice (#005557, The Jackson Lab) were irradiated with 200rad and intravenously injected with AML cell line (BCL2A1 overexpressing MV4-11, 0.5 million per mouse) or CD3+ cell depleted primary patient cells (SU176 harbors KRAS G12D, 3 million per mouse) as indicated in the schematic outlines for each mouse model (Figures 7D and 7H). After confirmation of engraftment, the mice were randomly assigned to four groups (n = 3 per group) and treated with vehicle, venetolcax (#V-3579, LC Laboratories, 100 mg/kg, oral gavage, per day), AZD5991 (#CT-A5991, Chemietek, 100 mg/kg intravenous, per week) or the combination. Venetoclax was prepared weekly in 0.5% Tween 80, 30% polyethyleneglycol-400, and 15% propylene glycol (18.7mg/ml). AZD5991 was formulated weekly in DMSO (200mg/ml). The leukemic burden of BCL2A1 overexpressing MV4-11 cells was monitored by bioluminescence imaging at indicated time points. Briefly, mice were anesthetized and injected intraperitoneally with firefly luciferase substrate D-luciferin and then imaged with the IVIS-100 in vivo imaging system (PerkinElmer). The leukemic burden of primary AML cells was monitored by FACS analysis of BM engraftment using anti-human-CD45 (#560367, BD Biosciences) and anti-mouse-CD45 (#355404, Biolegend,) at indicated time points or when the mice became moribund.
Lentiviral shRNA Constructs
shRNAs targeting BCL2A1 were designed using siRNA Dharmacon Design Center and cloned into pRSI9 U6-sh-UbiC-TagRFP/GFP lentiviral vector. pRSI9 U6-sh-UbiC-TagGFP was cloned from pRSI9 U6-sh-UbiC-TagRFP (#28289, Addgene). ShS: ATCTCGCTTGGGCGAGAGTAAG; Sh1: GTTTGAAGACGGCATCAT; Sh2: TTTGTAGCACTCTGGACGT; Sh3: ACCTTCAAATGCAAATATG; and Sh3UTR: AATCGTTTCCATATCAGTC.
Colony forming unit assay (CFU) assay
Mouse BM cells were harvested from WT BALB/c mice (#001026, The Jackson Lab). All mouse work was performed with approval from the OHSU Institutional Animal Care and Use Committee. For the BM transduction experiment, BM lineage negative cells were infected with retrovirus expressing KRAS or PTPN11 WT and mutants. Two thousand lineage negative cells per well were seeded into 6-well plate with 1.1 mL of methylcellulose medium (#03534, STEMCELL) for 10 days and the colony number was counted.
Fresh human umbilical cord blood cells were purchased from the New York Blood Center. MNCs from each sample were isolated by Ficoll separation, enriched for CD34 using CD34 magnetic beads (#17856, STEMCELL), transduced with lentivirus expressing sh1 or shS, and sorted by FACS. Two thousand cells were then seeded into 6-well plate with 1.1 mL of methylcellulose medium (#04434, STEMCELL) for 10 days and colony cells were counted. For each experiment, three technical replicates were performed to avoid high variability.
Virus transduction
PTPN11, KRAS, and NRAS mutations were generated using the QuikChange II XL site-directed mutagenesis kit (Agilent Technologies) on the respective pENTR or pDonor WT vectors (#GC-Z2134, GeneCopoeia; #81923, Addgene; and #82151, Addgene respectively). Gblock of the full length of BCL2A1 were purchased from IDT and cloned into a pENTR vector via TOPO TA cloning. All entry vectors were then cloned into a gateway modified MSCV-IRES-GFP (#20672, Addgene) or pLVX-EF1α-DsRed vector or a Tet-inducible lentiviral vector, pInducer21 (Addgene, #46948) via Gateway Cloning System (Invitrogen). MCL1 and a CD369 lentiviral vectors were purchased from Addgene (#117726 and #91786).
Retrovirus was produced by transfecting HEK 293T/17 cells together with an EcoPac helper plasmid). Lentivirus was produced by transfecting HEK 293T/17 cells together with psPAX2 and VSVG. After 2 days, the virus-containing supernatants were filtered and infected to cells followed by FACS sorting.
FACS
Cells were stained with antibodies for 20min at room temperature and washed twice with PBS and analyzed by FACS Aria. Primary leukemia blasts were sorted into CD369/CD14+ and CD369/CD14− cell populations using PE anti-CD369 (#355404, BioLegend) and APC-Cy7 anti-CD14 antibodies (#367108, BioLegend) by FACS. A CD40 antibody (#2204285, BioLegend) was used to detect membrane expression of CD40 in KRAS and NRAS WT and mutant cells.
Ex vivo Functional Drug Screens
10,000 primary AML cells or 1250 leukemia cell line cells per well were seeded into 384-well plates containing does gradients of indicated single agent or venetoclax combinations (equal concentration) in triplicate and cultured for 3 days. Cell viability was measured using a methanethiosulfonate (MTS)-based assay and read at 490 nm after 1-12h using a plate reader. At each condition, three technical replicates were performed to avoid high variability. The mean absorbance of the technical replicates is automatically generated by the instrument. Cell viability was determined by comparing the absorbance of drug-treated cells to that of untreated controls set at 100%. IC50 values were calculated by a regression curve fit analysis using GraphPad Prism8 software.
Immunoblotting
An equal number of cells were pelleted and lysed with the RIPA Lysis buffer solution at 4°C. Supernatants were centrifuged and the protein concentration was quantified with BCA Protein Assay. An equal amount of whole-cell lysate was mixed with 3X SDS sample buffer (75mM Tris (pH 6.8), 3% SDS, 15% glycerol, and 0.1% bromophenol blue) containing 8% β-mercaptoethanol. The mixed samples were boiled for 5min in a 95°C heat block before loading on a 4-15% Tris-HCl gradient gel. The proteins were transferred onto a nitrocellulose membrane and blocked with 5% BSA TBST buffer and incubated with antibodies against BCL2 family protein, PARP, Actin, Vinculin, etc., and HRP conjugated secondary antibodies against mouse IgG and rabbit IgG.
An NFkB pathway proteome array (#ARY029, R&D) was used to measure the activation of NFkb pathway activation according to the manufacturer’s instruction. The following antibodies were used: Rabbit polyclonal anti-PARP-1, Cell Signaling, #9542; Rabbit polyclonal anti-Bim, Cell Signaling, #2819; Rabbit monoclonal anti-BAK (clone D4E4); Rabbit polyclonal anti-BAX, Cell Signaling, #2772; Rabbit monoclonal anti-pERK (T202/Y204)(clone D13.14.4E), Cell Signaling, #4370; Pro-Survival Bcl-2 Family Antibody Sampler Kit II, Cell Signaling, #17229; Rabbit polyclonal anti- p44/42 MAPK (Erk1/2) , Cell Signaling, #9102; Rabbit anti-BCL2A1, A gift from Dr Jannie Borst; β-Actin (8H10D10) Mouse, Cell Signaling, #3700; Vinculin, Bio Rad, #MCA465GA; SHP-2 Antibody, Cell Signaling, #3752; K-Ras Monoclonal Antibody (9.13), ThermoFisher, #415700; NRAS, ThermoFisher, #PA5-28861; HRP mouse IgG, Cell Signaling, #7076.
Competitive cell growth assay
Leukemia cells, CD34+ cord blood cells or primary leukemia cells were transduced with shS, sh1 and/or sh3UTR lentiviruses. Cells were cultured and passed as normal and samples were taken for FACS analysis at day 3 and day 6. The percentage difference in growth rate between shS and sh1 cells was calculated based on the percentage change of GFP+ cells.
Apoptosis assay
The detection of apoptotic cells was performed by staining the cells with Annexin V/PI. Cells were stained with APC-labeled Annexin V and PI (#640928, Biolegend) according to the manufacturer’s instructions and analyzed by FACS. Annexin V was used as an apoptotic cell marker, whereas propidium iodide (PI) was used as a necrotic cell marker.
Real-time PCR
Total RNA was extracted using an RNA isolation kit according to the manufacturer's instructions. 200ng of total RNA was used for cDNA synthesis using high capacity reverse transcription kit. Reactions were run in duplicate. Expression of apoptotic related genes was normalized to the geometric mean of housekeeping gene GAPDH or HPRT to control the variability in expression levels and were analyzed using the 2 −ΔΔCT method. All samples within an experiment were reverse transcribed at the same time. The resulting cDNA was diluted 1:5 in nuclease-free water and stored in aliquots at −80°C until used. Primers were selected from a Human Apoptosis Primer Library (#HPA-I, Real Time Primers, LLC).
Evaluation of combinatorial effect of combination drugs
We used Excess over Bliss (EOB) independence model to quantify the synergy for venetoclax/azd5991 combination at each drug concentration. EOB evaluates if the combined effect of two compounds is significantly greater or smaller than the combination of their individual (independent) effects and is measured by calculating the difference between the observed and predicted inhibition of the drug combination. For two single compounds with inhibition effects A and B, the predicted inhibition for the drug combination is calculated as C = A + B − A*B. The two-agent combination inhibition is defined as AB. The predicted combination viability of drug A and B combination is defined as (A + B − A*B) %.
Statistics and reproducibility
Statistical analyses were performed on GraphPad Prism software 8.0. The data were expressed as the mean ± standard error of the mean (MED). Statistical significance was determined using two-tailed Student’s t-tests (Mann-Whitney test), one-way ANOVAs, and Pearson Correlation Coefficients tests as indicated. No statistical method was used to predetermine sample size and no data were excluded from the analyses. Randomization and blinding were conducted as indicated. All experiments were reproducible.
Reporting Summary.
Further information on research design is available in the Nature Research Reporting Summary linked to this article.
Data availability
Clinical information, mutation, and gene expression data for inhibitor correlation analysis were obtained from the Beat AML and CNL public Vizome interface [www.vizome.org]29,35 and expressed as log2 transformed normalized RPKM or from cBioPortal [https://www.cbioportal.org/]31,33. AML TCGA data were obtained from cBioPortal and expressed as log-transformed RNA Seq V2 RSEM. Data for CLEC7A and CD14 expression in a cohort of CML cases was mined from an internal dataset that is being prepared for publication and expressed as normalized RPKM. Figures for gene expression during normal hematopoiesis and in various leukemia were downloaded Bloodspot [http://servers.binf.ku.dk/bloodspot/]32.
The source data associated with each figure are provided with the manuscript. All other data supporting the findings of this study are available from the corresponding authors on reasonable request.
Code availability
The RNA-seq data analysis was performed in R. The pathway analyses for venetoclax correlated gene expression from Figure 1e and 1f was generated using the Reactome website overrepresentation functionality. All computer code is available upon reasonable request.
Extended Data
Extended Data Fig. 1. Factors influencing venetoclax and ABT-737 response.
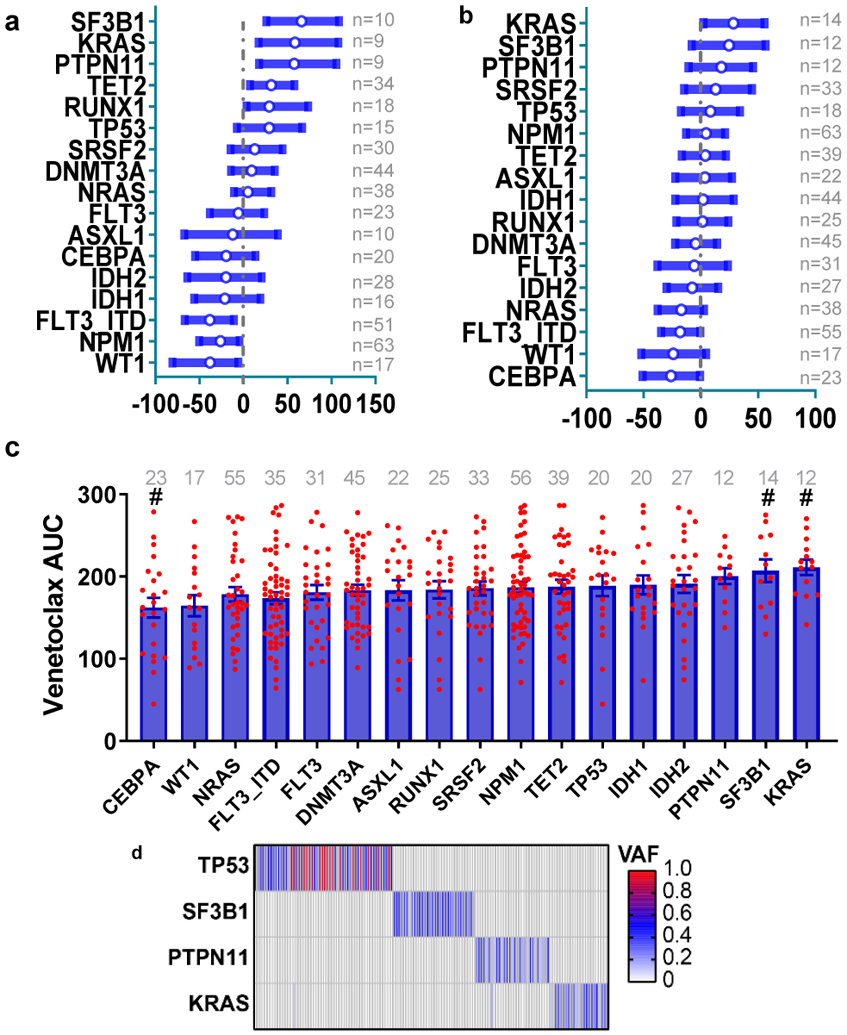
a, The graph depicts the 95% CI and Hodges-Lehmann median difference of venetoclax AUC in the presence or absence of mutations in the indicated gene calculated using two tailed Mann-Whitney tests. The case numbers are listed on the right side.
b, The graph depicts the 95% CI and Hodges-Lehmann median difference of ABT-737 AUC in the presence or absence of mutations in the indicated gene calculated using two tailed Mann-Whitney tests.
c, The ABT-737 AUC was compared among different common AML mutation groups. Briefly, we compared AUCs from all samples harboring each mutation to AUCs from all other samples WT for that mutation. Significance was determined using two tailed Kruskal-Wallis tests, and corrected for multiple comparisons (Bonferroni correction), and expressed as #<0.05 before Bonferroni correction. The case numbers are listed on the top.
d, The heatmap depicts distributions of TP53 (N=54 positive samples), SF3B1 (N=32 positive samples), PTPN11 (N=29 positive samples), and KRAS (N=26 positive samples) mutations in the Beat AML cohort (total N=622 samples). Each column displays each patient; each row denotes a specific gene. The mutation variant allelic frequency (VAF) is colored.
Extended Data Fig. 2. Overexpression of BCL2A1 confers resistance to BCL2 family inhibitors and venetoclax.
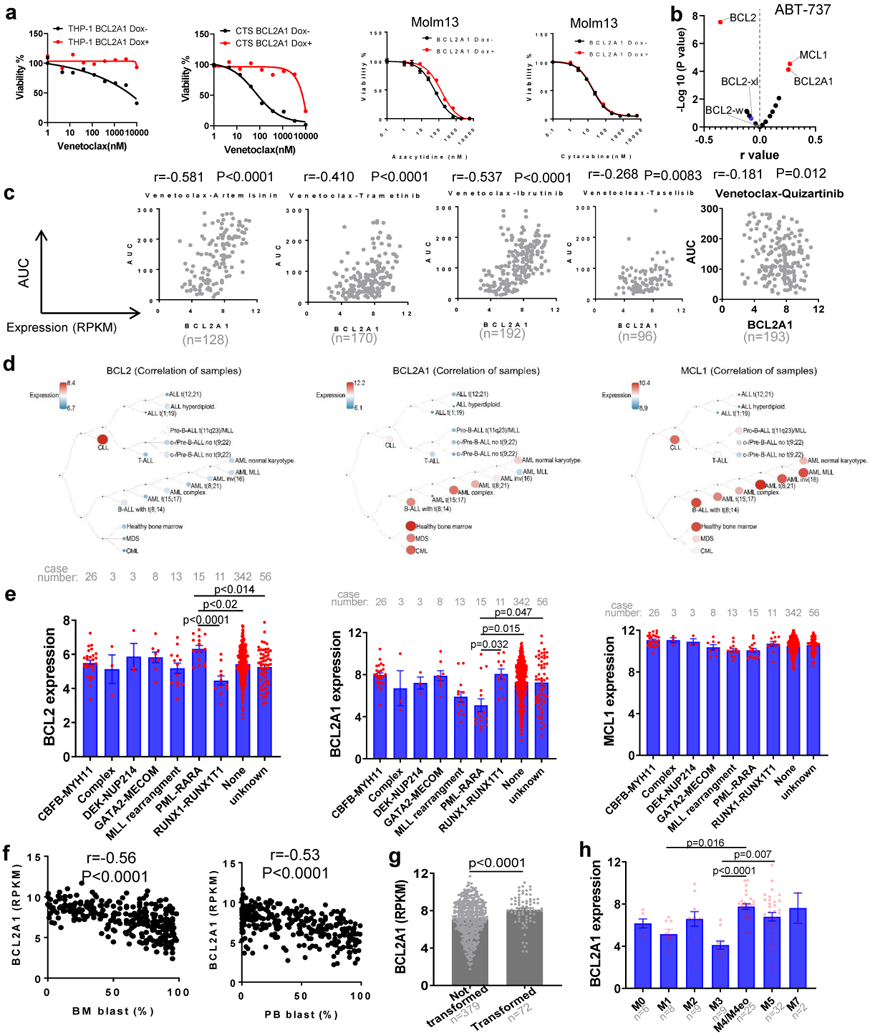
a, The graphs depict cell viabilities (mean from 3 technical replicates) of THP-1, CTS, and Molm13 cells transduced with Dox-inducible BCL2A1 virus in the absence or presence of Dox and indicated inhibitors. The graph is representative of two independent experiments with consistent results. The numerical source data have been provided as Extended Source Data_Extended Data Fig. 2a.
b, Data represent −log10(p) values vs. the Pearson r values between ABT-737 AUC and BCL2 family gene expression RPKM levels from 233 AML patient samples, determined by two tailed Pearson correlation coefficient tests and corrected for multiple comparisons using Bonferroni correction.
c, Graphs depict the correlation between BCL2A1 gene expression levels and indicated inhibitor AUC (N=186 samples) from the Beat AML patient samples determined by the Pearson correlation coefficient tests.
d, Graphs depict the expression of BCL2, BCL2A1, and MCL1 in different hematological malignancies. Graphs are generated by Bloodspot website and the gene expression data are from Microarray Innovations in LEukemia (MILE) study: Stage 1 data (GSE13159).
e, The expression of BCL2, BCL2A1, and MCL1 was compared among different chromosome translocation groups. Significance was determined using Kruskal-Wallis tests.
f, Graphs depict the correlation between BCL2A1 gene expression levels and BM or PB blast percentage from the Beat AML cohort determined by the Pearson correlation coefficient tests. N refers to number of patient samples.
g, Graphs depict the BCL2A1 gene expression levels in transformed or not transformed AML samples from the Beat AML cohort. Significance was determined using two tailed Mann-Whitney tests. N refers to number of patient samples.
h, The expression of BCL2A1 was compared among different AML FAB subgroups. Significance was determined using Kruskal-Wallis tests. The numerical source data have been provided as Extended Source Data Extended Data Fig. 2h.
Extended Data Fig. 3. Targeting BCL2A1 has antileukemic effect.
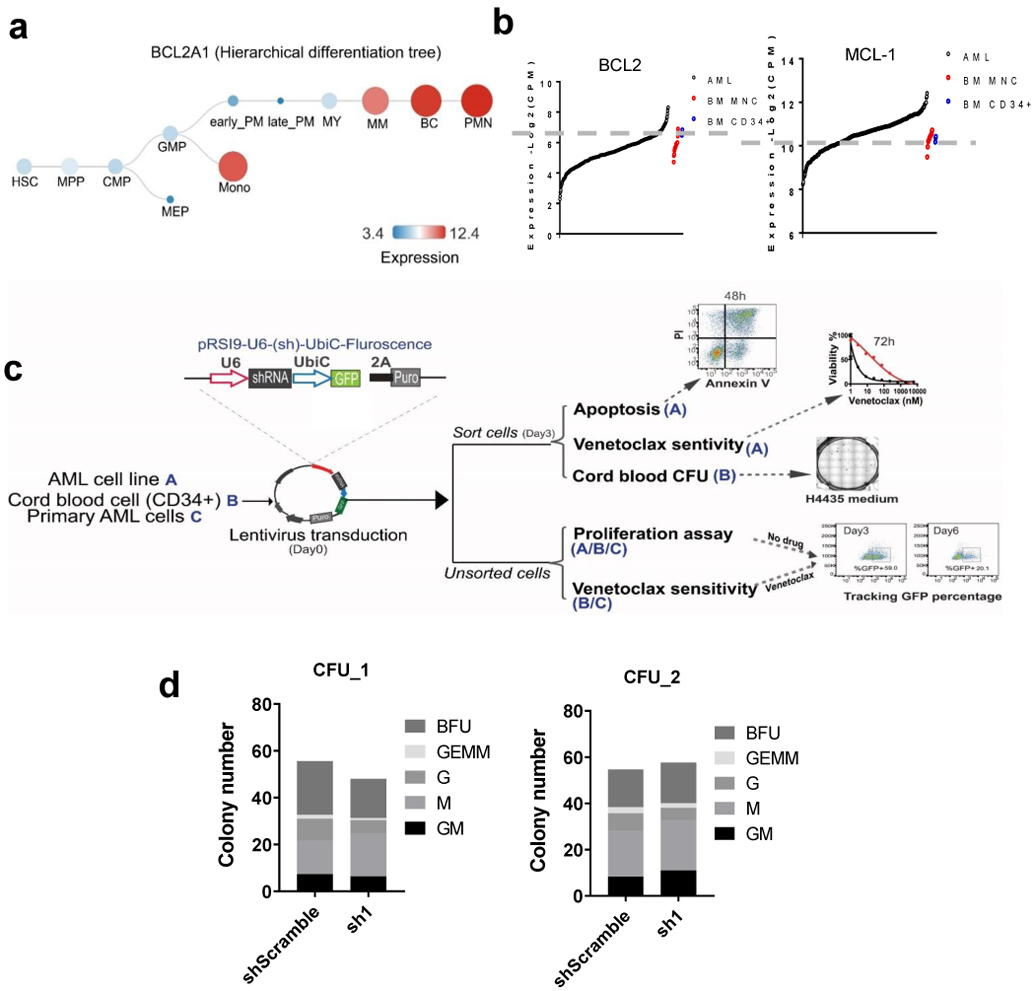
a, Graphs depict the expression of BCL2A1 during normal hematopoiesis. Graphs are generated by Bloodspot website: Normal human hematopoiesis (HemaExplorer) and the gene expression data are from GSE17054, GSE19599, GSE11864, and E-MEXP-1242.
b, Graphs depict gene expression of BCL2 and MCL1 in leukemia samples (N=453), BM MNC (N=19), and CD34+ HSC controls (N=3) from the Beat AML cohort.
c, Schematic diagram of knockdown of BCL2A1 using shRNAs and indicated functional assays.
d, Graphs depict the colony numbers (mean from 3 technical replicates) of shS or sh1 transduced cord blood HSPCs cultured in H4435 for 10 days. Data from two cord blood donors are shown. G: granulocyte colony. GM: granulocyte, macrophage. M: monocyte colony. BFU: erythroid burst-forming units. GEMM: granulocyte, erythroid, macrophage, megakaryocyte. The numerical source data have been provided as Extended Source Data_Extended Data Fig. 3d.
Extended Data Fig. 4. Expression of CLEC7A or CD14 predicts venetoclax response.
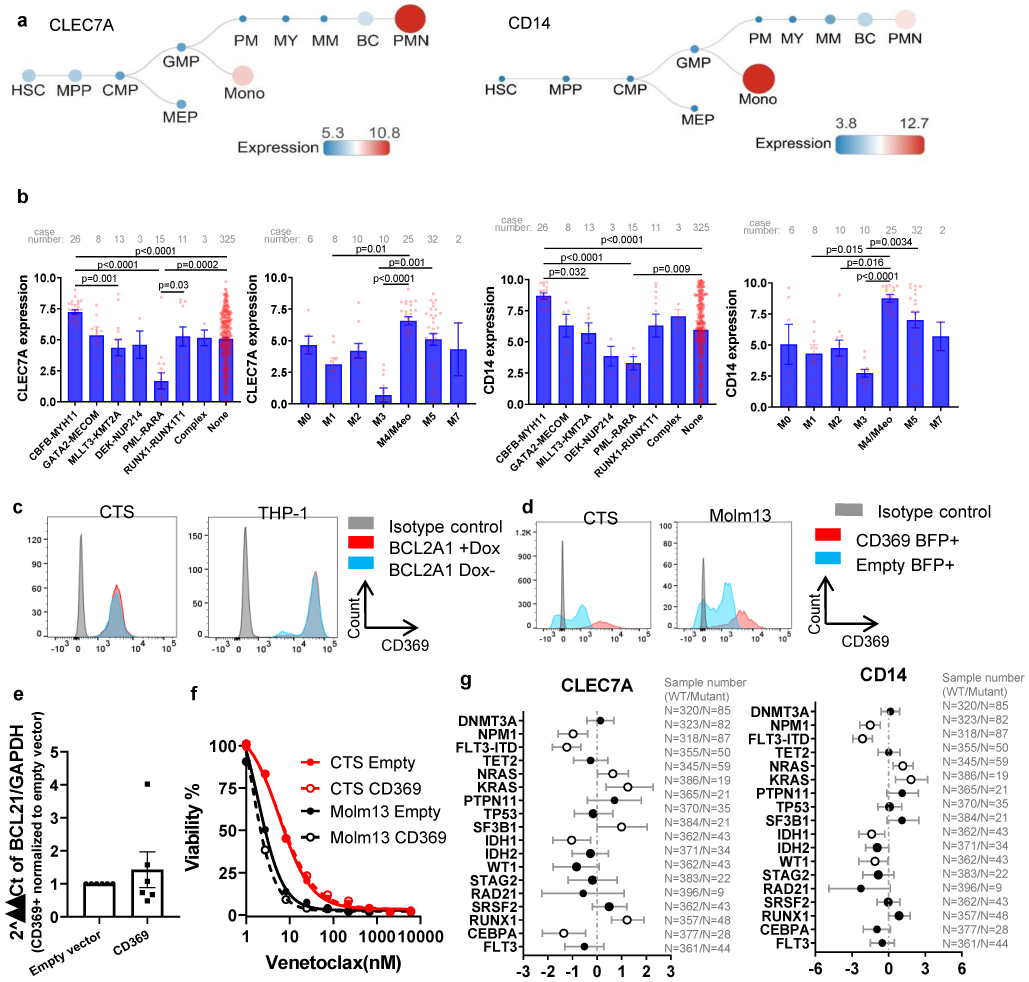
a, Graphs depict the expression of CLEC7A and CD14 during normal hematopoiesis. Graphs are generated from Bloodspot website: Normal human hematopoiesis (HemaExplorer) and the gene expression data are from GSE17054, GSE19599, GSE11864, and E-MEXP-1242.
b, Graphs depict the mean ± SEM of CLEC7A and CD14 expression among different FAB and chromosome translocation groups. N refers to number of patient samples. Significance was determined using two tailed Kruskal-Wallis tests.
c, FACS histogram plots demonstrated the expression of CD369 on CTS and THP-1 cells expressing Dox inducible BCL2A1 in the presence or absence of Dox. The experiments were performed three times independently with consistent results.
d, FACS histogram plots demonstrated the expression of CD369 in CTS and Molm13 cells transduced with lentivirus encoding an empty vector or a CD369 vector. The experiments were performed three times independently with consistent results.
e, CTS and Molm13 cells were transduced with lentivirus encoding an empty vector or a CD369 vector. The graph depicts the mean ± SEM (N=3 independent experiments) of 2^ΔΔCt of BCL2A1 in empty vector or CD369 expressing cells. GAPDH was used as a control. Significance was determined using a Mann-Whitney test. P>1. The numerical source data have been provided as Extended Source Data Extended Data Fig. 4e.
f, Graph depicts cell viabilities (mean from 3 technical replicates) of CTS and Molm13 cells expressing an empty vector or CD369 in the presence of dose gradients of venetoclax. The graph is representative of two independent experiments. The numerical source data have been provided as Extended Source Data Extended Data Fig. 4f
g, The graph depicts the 95% CI and Hodges-Lehmann median difference of CD14 and CLE7A expression in the presence or absence of mutations in the indicated gene calculated using Mann-Whitney tests. N refers to number of patient samples. The numerical source data have been provided as Extended Source Data Extended Data Fig. 4g.
Extended Data Fig. 5. KRAS, but not NRAS mutations confer venetoclax resistance.
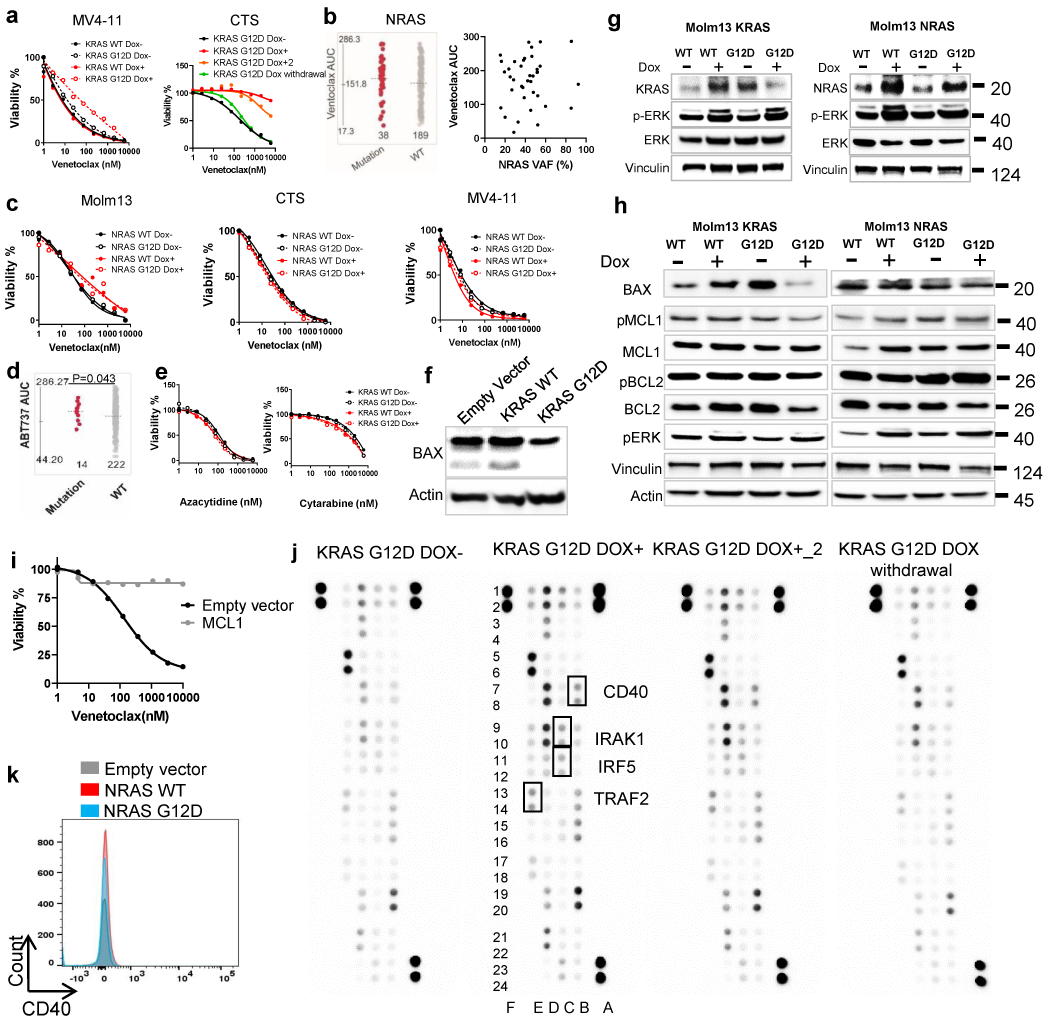
a, CTS or MV4-11 cells were transduced with Dox-inducible KRAS WT and G12D virus. KRAS G12D transduced cells were cultured in the presence of Dox (for 2 weeks), in the absence of Dox, and/or after 2 weeks of induction followed by Dox withdrawal for 3 weeks. Representative graphs depict cell viabilities (mean from 3 technical replicates) in the presence of dose gradients of venetoclax. The graph for MV4-11 is representative of two independent experiments with consistent results. For CTS, Dox conditions have two biological independently established replicates, whereas no Dox and Dox withdrawal controls were established once. The numerical source data have been provided as Extended Source Data Extended Data Fig. 5a.
b, The graph (left) demonstrates similar venetoclax AUCs in AML samples with NRAS mutations (N=38 samples) compared with NRAS WT samples (N=189 samples). Significance was determined using two tailed Mann-Whitney tests. P=0.272. The dot plot (right) depicts the correlation between NRAS mutation variant allelic frequency (VAF) and venetoclax AUC determined by two tailed Pearson correlation (N=38). No significant correlation was observed.
c, Representative graphs depict similar cell viabilities (mean from 3 technical replicates) of NRAS WT or G12D transduced cells in the presence of dose gradients of venetoclax. The graph is representative of two independent experiments with consistent results. The numerical source data have been provided as Extended Source Data_Extended Data Fig. 5c
d, The graph demonstrates higher ABT-737 AUCs in AML samples with KRAS mutations (N=14 samples) compared with KRAS WT samples (N=222). Significance was determined using two tailed Mann-Whitney tests.
e, Representative graphs depict similar cell viabilities (mean from 3 technical replicates) of KRAS WT or G12D transduced cells in the presence of dose gradients of Azacytidine or Cytarabine. The graph is representative of two independent experiments with consistent results. The numerical source data have been provided as Extended Source Data_Extended Data Fig. 5e.
f, Molm13 cells were transduced with lentiviral vectors encoding an empty, KRAS WT, or KRAS G12D construct constitutively. Western blot analyses show decreased BAX in KRAS G12D cells. Blots are representative of two independent experiments with consistent results.
g, Western blot analyses showing pERK activation in NRAS or KRAS WT and mutant transduced cells. Blots are representative of two independent experiments with consistent results. The image source data have been provided as Source Data Extended Data Fig. 5.
h, Western blot analyses showing decreased BAX and BCL2 in KRAS mutant, but not KRAS WT, NRAS WT, or NRAS mutant transduced cells. Blots are representative of two independent experiments with consistent results.
i, The graph depicts cell viabilities (mean from 3 technical replicates) of Molm13 cells expressing MCL1 or an empty control vector in the presence of dose gradients of venetoclax. The graphs are representative of two independent experiments with consistent results. The numerical source data have been provided as Extended Source Data_Extended Data Fig. 5i
j, The inducible KRAS G12D transduced cells were cultured in the presence of Dox (for 2 weeks), in the absence of Dox, or after 2 weeks of induction followed by Dox withdrawal for three weeks. Cell lysates were extracted and subjected to an NFkB pathway proteome array according to the manufacturer’s instructions. Immunoblot depicts 41 human proteins and 4 serine or tyrosine phosphorylation sites in duplicate. For CTS, Dox conditions have two biological independently established replicates, whereas no Dox and Dox withdrawal controls were established once. The image source data have been provided as Source Data Extended Data Fig. 5.
k, Representative flow cytometry overlayed histograms showing no change of CD40 expression in NRAS WT and G12D cells. The graph is representative of two independent experiments with consistent results.
Extended Data Fig. 6. PTPN11 mutations confer venetoclax resistance.
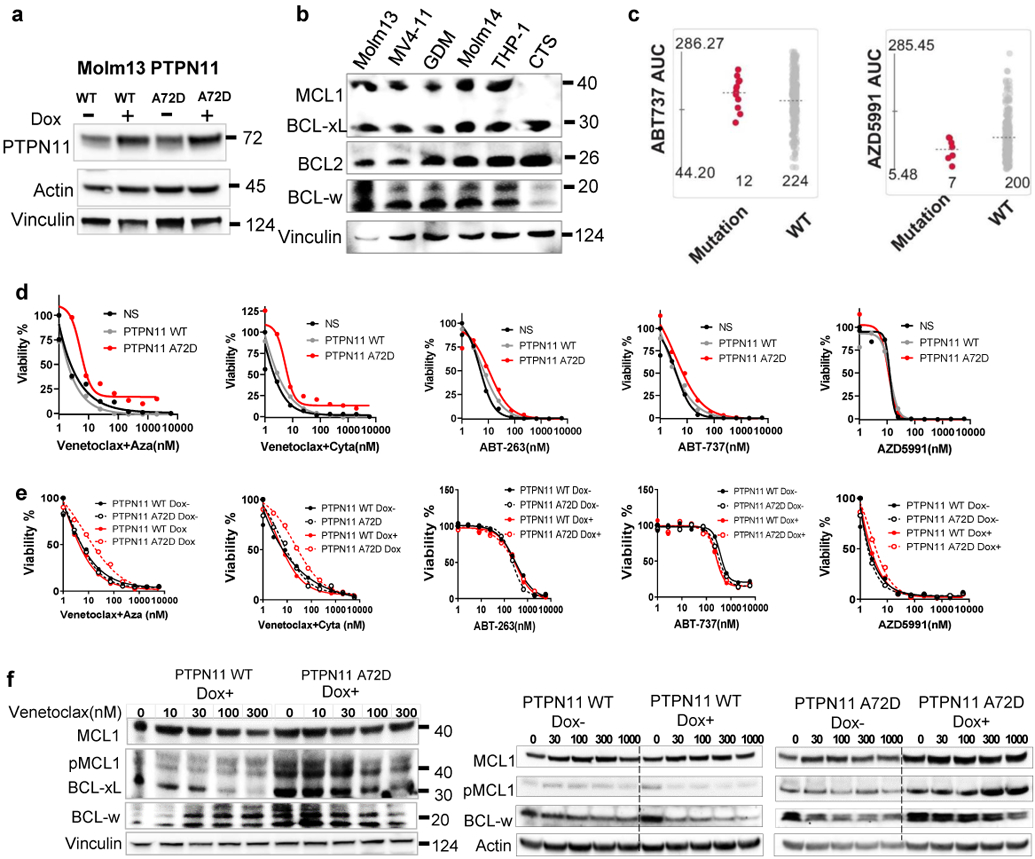
a, Representative immunoblots depict induction of PTPN11 expression in cells transduced with inducible PTPN11 WT and A72D in the presence of Dox for 72 hours. The experiments were conducted twice independently with consistent results.
b, The immunoblot shows the expression of BCL2 family pro-survival proteins in different leukemia cell lines. Blots are representative of two independent experiments with consistent results.
c, The graphs demonstrate ABT-737 and AZD5991 AUCs in AML samples harboring PTPN11 mutations (N=12 and 7 samples for ABT-737 and AZD5991, respectively) compared to samples without PTPN11 mutations (N=224 and 200 samples for ABT-737 and AZD5991, respectively).
d-e, Representative graphs depict the viabilities (mean from 3 technical replicates) of Molm13 cells expressing PTPN11 WT or A72D in the presence or absence of Dox and dose gradients of indicated drugs The upper panel d, is the constitutive transduction system, and the bottom e, is the Dox inducible transduction system. The constitutive transduction system experiment was conducted once. The Dox inducible transduction experiment was performed twice independently with consistent results. The numerical source data have been provided as Extended Source Data_ Extended Data Fig. 6d,e.
f, Western blot images showing sustained pMCL1,BCL-xL and BCL-w expression of PTPN11 A72D expressing cells in a constitutive expression system (left) or a inducible expression system (right), when treated with venetoclax. Blots are representative of two independent experiments with consistent results. The image source data for Extended Data Fig. 6f has been provided as Source Data Extended Data Fig. 6.
Extended Data Fig. 7. Venetoclax and AZD5991 combination overcomes venetoclax resistance.
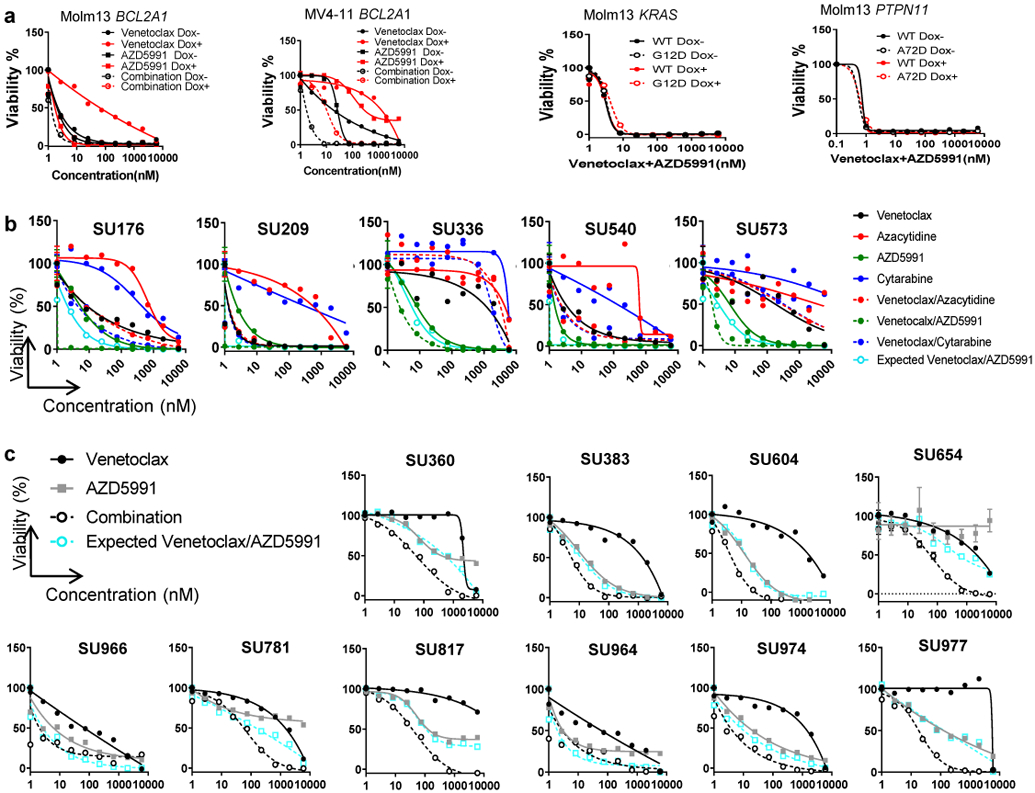
a, Graphs depict the cell viabilities (mean from 3 technical replicates) of indicated cells in the absence or presence of Dox and dose gradients of venetoclax, AZD5991, and the two drugs in combination. The graphs are representative of two independent experiments with consistent results. The numerical source data have been provided as Source Data_Figure 7a_Extended data Fig.7a
b, Graphs depict cell viabilities viabilities (mean from 3 technical replicates) of 5 different primary leukemia samples treated with indicated inhibitors. Available samples were used from adult patients with myeloid malignancies from both genders and all age groups. EOB was used to calculate the expected effect of the combination. The numerical source data have been provided as Source Data_Figure 7b_Extended Data Fig.7b.
c, Graphs depict cell viabilities viabilities (mean from 3 technical replicates) in 10 primary leukemia samples treated with indicated inhibitors. Available samples were used from adult patients (different from b) with myeloid malignancies from both genders and all age groups. EOB was used to calculate the expected effect of the combination. Source data for Extended Data Fig. 7c have been provided as Extended Source Data_Extended Data Fig. 7c.
Supplementary Material
Acknowledgments
We acknowledge the Stanford Hematology Division Tissue Bank and all of the patients who provided specimens for donating precious time and tissue. We thank Dr. Jude Fitzgibbon for providing CTS cell line, and Dr. Jannie Borst for providing the anti-BCL2A1 antibody. We thank our colleagues at the Druker, Tyner, and Majeti labs for sharing reagents and insightful discussions. We apologize to authors whose contributions have not been cited due to space limitations. This work was supported by The Leukemia & Lymphoma Society and the NCI/NIH (1U01CA217862-01, 1U54CA224019-01, 3P30CA069533-18S5, and 1R01CA188055). J.W.T. was supported by the V Foundation for Cancer Research, the Gabrielle’s Angel Foundation for Cancer Research, and the NCI/NIH (5R00CA151457-04; 1R01CA183947-01). R.M. is a Scholar of the Leukemia and Lymphoma Society. H.Z. received the Medical Research Foundation (MRF) grant, and K99 Career Transition Award (1K99CA237630-01/ 5K99CA237630-02).
Footnotes
Competing Interests
J.W.T. has received research support from Aptose, Array, AstraZeneca, Constellation, Genentech, Gilead, Incyte, Janssen, Seattle Genetics, Syros, Takeda. R.M. is a co-founder, consultant, equity holder, and serves on the Board of Directors of Forty Seven Inc.
References
- 1.Papaemmanuil E et al. Genomic Classification and Prognosis in Acute Myeloid Leukemia. N. Engl. J. Med 374, 2209–2221 (2016). [DOI] [PMC free article] [PubMed] [Google Scholar]
- 2.Patel JP et al. Prognostic Relevance of Integrated Genetic Profiling in Acute Myeloid Leukemia. N. Engl. J. Med (2012). doi: 10.1056/NEJMoa1112304 [DOI] [PMC free article] [PubMed] [Google Scholar]
- 3.Ley TJ et al. Genomic and epigenomic landscapes of adult de novo acute myeloid leukemia. N. Engl. J. Med 368, 2059–74 (2013). [DOI] [PMC free article] [PubMed] [Google Scholar]
- 4.DiNardo CD et al. Clinical experience with the BCL2-inhibitor venetoclax in combination therapy for relapsed and refractory acute myeloid leukemia and related myeloid malignancies. Am. J. Hematol (2018). doi: 10.1002/ajh.25000 [DOI] [PubMed] [Google Scholar]
- 5.Wei A et al. Phase 1/2 Study of Venetoclax with Low-Dose Cytarabine in Treatment-Naive, Elderly Patients with Acute Myeloid Leukemia Unfit for Intensive Chemotherapy: 1-Year Outcomes. Blood (2017). [Google Scholar]
- 6.Dinardo CD et al. Durable response with venetoclax in combination with decitabine or azacitadine in elderly patients with acute myeloid leukemia (AML). J. Clin. Oncol (2018). doi: 10.1200/jco.2018.36.15_suppl.7010 [DOI] [Google Scholar]
- 7.Pollyea DA et al. Venetoclax in Combination with Hypomethylating Agents Induces Rapid, Deep, and Durable Responses in Patients with AML Ineligible for Intensive Therapy. Blood (2018). doi: 10.1182/blood-2018-99-117179 [DOI] [Google Scholar]
- 8.DiNardo CD et al. Venetoclax combined with decitabine or azacitidine in treatment-naive, elderly patients with acute myeloid leukemia. Blood (2019). doi: 10.1182/blood-2018-08-868752 [DOI] [PMC free article] [PubMed] [Google Scholar]
- 9.Konopleva M et al. Efficacy and biological correlates of response in a phase II study of venetoclax monotherapy in patients with acute Myelogenous Leukemia. Cancer Discov. (2016). doi: 10.1158/2159-8290.CD-16-0313 [DOI] [PMC free article] [PubMed] [Google Scholar]
- 10.DiNardo CD et al. Safety and preliminary efficacy of venetoclax with decitabine or azacitidine in elderly patients with previously untreated acute myeloid leukaemia: a non-randomised, open-label, phase 1b study. Lancet Oncol. (2018). doi: 10.1016/S1470-2045(18)30010-X [DOI] [PubMed] [Google Scholar]
- 11.Kaufmann SH et al. Elevated expression of the apoptotic regulator Mcl-1 at the time of leukemic relapse. Blood (1998). [PubMed] [Google Scholar]
- 12.Karakas T et al. High expression of bcl-2 mRNA as a determinant of poor prognosis in acute myeloid leukemia. Ann. Oncol (1998). doi: 10.1023/A:1008255511404 [DOI] [PubMed] [Google Scholar]
- 13.Campos L et al. High expression of bcl-2 protein in acute myeloid leukemia cells is associated with poor response to chemotherapy. Blood 81, 3091–3096 (1993). [PubMed] [Google Scholar]
- 14.Stilgenbauer S et al. Venetoclax in relapsed or refractory chronic lymphocytic leukaemia with 17p deletion: a multicentre, open-label, phase 2 study. Lancet Oncol. (2016). doi: 10.1016/S1470-2045(16)30019-5 [DOI] [PubMed] [Google Scholar]
- 15.Roberts AW et al. Targeting BCL2 with Venetoclax in Relapsed Chronic Lymphocytic Leukemia. N. Engl. J. Med (2015). doi: 10.1056/nejmoa1513257 [DOI] [PMC free article] [PubMed] [Google Scholar]
- 16.Pollyea DA et al. Results of a phase 1b study of venetoclax plus decitabine or azacitidine in untreated acute myeloid leukemia patients ≥ 65 years ineligible for standard induction therapy. J. Clin. Oncol (2018). doi: 10.1200/jco.2016.34.15_suppl.7009 [DOI] [Google Scholar]
- 17.Jayappa KD et al. Microenvironmental agonists generate de novo phenotypic resistance to combined ibrutinib plus venetoclax in CLL and MCL. Blood Adv. (2017). [DOI] [PMC free article] [PubMed] [Google Scholar]
- 18.Oppermann S et al. High-content screening identifies kinase inhibitors that overcome venetoclax resistance in activated CLL cells. Blood (2016). doi: 10.1182/blood-2015-12-687814 [DOI] [PMC free article] [PubMed] [Google Scholar]
- 19.Punnoose EA et al. Expression Profile of BCL-2, BCL-XL, and MCL-1 Predicts Pharmacological Response to the BCL-2 Selective Antagonist Venetoclax in Multiple Myeloma Models. Mol. Cancer Ther (2016). doi: 10.1158/1535-7163.MCT-15-0730 [DOI] [PubMed] [Google Scholar]
- 20.Pan R et al. Synthetic Lethality of Combined Bcl-2 Inhibition and p53 Activation in AML: Mechanisms and Superior Antileukemic Efficacy. Cancer Cell (2017). doi: 10.1016/j.ccell.2017.11.003 [DOI] [PMC free article] [PubMed] [Google Scholar]
- 21.Ishizawa J et al. Mitochondrial ClpP-Mediated Proteolysis Induces Selective Cancer Cell Lethality. Cancer Cell (2019). doi: 10.1016/j.ccell.2019.03.014 [DOI] [PMC free article] [PubMed] [Google Scholar]
- 22.Kuntz EM et al. Targeting mitochondrial oxidative phosphorylation eradicates therapy-resistant chronic myeloid leukemia stem cells. Nat. Med (2017). doi: 10.1038/nm.4399 [DOI] [PMC free article] [PubMed] [Google Scholar]
- 23.Bajpai R et al. Targeting glutamine metabolism in multiple myeloma enhances BIM binding to BCL-2 eliciting synthetic lethality to venetoclax. Oncogene (2016). doi: 10.1038/onc.2015.464 [DOI] [PMC free article] [PubMed] [Google Scholar]
- 24.Chen X et al. Targeting mitochondrial structure sensitizes acute myeloid leukemia to Venetoclax treatment. Cancer Discov. (2019). doi: 10.1158/2159-8290.CD-19-0117 [DOI] [PMC free article] [PubMed] [Google Scholar]
- 25.Stevens BM et al. PTPN11 Mutations Confer Unique Metabolic Properties and Increase Resistance to Venetoclax and Azacitidine in Acute Myelogenous Leukemia. Blood (2018). doi: 10.1182/BLOOD-2018-99-119806 [DOI] [Google Scholar]
- 26.Nechiporuk T et al. The TP53 Apoptotic Network is a Primary Mediator of Resistance to BCL2 inhibition in AML Cells. Cancer Discov. (2019). doi: 10.1158/2159-8290.CD-19-0125 [DOI] [PMC free article] [PubMed] [Google Scholar]
- 27.Han L et al. Targeting MAPK Signaling Pathway with Cobimetinib (GDC-0973) Enhances Anti-Leukemia Efficacy of Venetoclax (ABT-199/GDC-0199) in Acute Myeloid Leukemia Models. Clin. Lymphoma Myeloma Leuk (2017). doi: 10.1016/j.clml.2017.07.064 [DOI] [Google Scholar]
- 28.Pham LV et al. Strategic therapeutic targeting to overcome venetoclax resistance in aggressive B-cell lymphomas. Clin. Cancer Res (2018). doi: 10.1158/1078-0432.CCR-17-3004 [DOI] [PubMed] [Google Scholar]
- 29.Tyner JW et al. Functional genomic landscape of acute myeloid leukaemia. Nature 562, 526–531 (2018). [DOI] [PMC free article] [PubMed] [Google Scholar]
- 30.Zhang H et al. Biomarkers Predicting Venetoclax Sensitivity and Strategies for Venetoclax Combination Treatment. Blood 132, 175 (2018). [Google Scholar]
- 31.Cerami E et al. The cBio Cancer Genomics Portal: An Open Platform for Exploring Multidimensional Cancer Genomics Data. Cancer Discov. 2, 401 LP–404 (2012). [DOI] [PMC free article] [PubMed] [Google Scholar]
- 32.Bagger FO, Kinalis S & Rapin N BloodSpot: a database of healthy and malignant haematopoiesis updated with purified and single cell mRNA sequencing profiles. Nucleic Acids Res. 47, D881–D885 (2018). [DOI] [PMC free article] [PubMed] [Google Scholar]
- 33.Gao J et al. Integrative analysis of complex cancer genomics and clinical profiles using the cBioPortal. Sci. Signal. 6, pl1 (2013). [DOI] [PMC free article] [PubMed] [Google Scholar]
- 34.Sochalska M et al. Conditional knockdown of BCL2A1 reveals rate-limiting roles in BCR-dependent B-cell survival. Cell Death Differ. (2016). doi: 10.1038/cdd.2015.130 [DOI] [PMC free article] [PubMed] [Google Scholar]
- 35.Zhang H et al. Genomic landscape of Neutrophilic Leukemias of Ambiguous Diagnosis. Blood (2019). doi: 10.1182/blood.2019000611 [DOI] [PMC free article] [PubMed] [Google Scholar]
- 36.Guieze R et al. Genetic Determinants of Venetoclax Resistance in Lymphoid Malignancies. Blood (2018). doi: 10.1182/BLOOD-2018-99-118604 [DOI] [Google Scholar]
- 37.Phillips DC et al. Loss in MCL-1 function sensitizes non-Hodgkin’s lymphoma cell lines to the BCL-2-selective inhibitor venetoclax (ABT-199). Blood Cancer J. (2015). doi: 10.1038/bcj.2015.88 [DOI] [PMC free article] [PubMed] [Google Scholar]
- 38.Bojarczuk K et al. BCR signaling inhibitors differ in their ability to overcome Mcl-1-mediated resistance of CLL B cells to ABT-199. Blood (2016). doi: 10.1182/blood-2015-10-675009 [DOI] [PubMed] [Google Scholar]
- 39.Peirs S et al. ABT-199 mediated inhibition of BCL-2 as a novel therapeutic strategy in T-cell acute lymphoblastic leukemia. Blood (2014). doi: 10.1182/blood-2014-05-574566 [DOI] [PubMed] [Google Scholar]
- 40.Lee HH, Dadgostar H, Cheng Q, Shu J & Cheng G NF-κB-mediated up-regulation of Bcl-x and Bfl-1/A1 is required for CD40 survival signaling in B lymphocytes. Proc. Natl. Acad. Sci 96, 9136 LP–9141 (1999). [DOI] [PMC free article] [PubMed] [Google Scholar]
- 41.Lee T et al. Discovery of Potent Myeloid Cell Leukemia-1 (Mcl-1) Inhibitors That Demonstrate in Vivo Activity in Mouse Xenograft Models of Human Cancer. J. Med. Chem 62, 3971–3988 (2019). [DOI] [PubMed] [Google Scholar]
- 42.Li Z, He S & Look AT The MCL1-specific inhibitor S63845 acts synergistically with venetoclax/ABT-199 to induce apoptosis in T-cell acute lymphoblastic leukemia cells. Leukemia (2019). doi: 10.1038/s41375-018-0201-2 [DOI] [PMC free article] [PubMed] [Google Scholar]
- 43.Moujalled DM et al. Combining BH3-mimetics to target both BCL-2 and MCL1 has potent activity in pre-clinical models of acute myeloid leukemia. Leukemia (2019). doi: 10.1038/s41375-018-0261-3 [DOI] [PMC free article] [PubMed] [Google Scholar]
- 44.Bisaillon R et al. Genetic characterization of ABT-199 sensitivity in human AML. Leukemia (2020). doi: 10.1038/s41375-019-0485-x [DOI] [PubMed] [Google Scholar]
- 45.Yecies D, Carlson NE, Deng J & Letai A Acquired resistance to ABT-737 in lymphoma cells that up-regulate MCL-1 and BFL-1. Blood (2010). doi: 10.1182/blood-2009-07-233304 [DOI] [PMC free article] [PubMed] [Google Scholar]
- 46.Cheng Q, Lee HH, Li Y, Parks TP & Cheng G Upregulation of Bcl-x an Bfl-1 as a potential mechanism of chemoresistance, which can be overcome by NF-κB inhibition. Oncogene (2000). doi: 10.1038/sj.onc.1203861 [DOI] [PubMed] [Google Scholar]
- 47.Rasooly R et al. Retinoid X Receptor Agonists Increase Bcl2a1 Expression and Decrease Apoptosis of Naive T Lymphocytes. J. Immunol (2014). doi: 10.4049/jimmunol.175.12.7916 [DOI] [PubMed] [Google Scholar]
- 48.Anderson NM et al. BCL2-specific inhibitor ABT-199 synergizes strongly with cytarabine against the early immature LOUCY cell line but not more-differentiated T-ALL cell lines. Leukemia (2014). doi: 10.1038/leu.2013.377 [DOI] [PMC free article] [PubMed] [Google Scholar]
- 49.Ni Chonghaile T et al. Maturation stage of T-cell acute lymphoblastic leukemia determines BCL-2 versus BCL-XL dependence and sensitivity to ABT-199. Cancer Discov. (2014). doi: 10.1158/2159-8290.CD-14-0353 [DOI] [PMC free article] [PubMed] [Google Scholar]
- 50.Kuusanmäki H et al. Phenotype-based drug screening reveals association between venetoclax response and differentiation stage in acute myeloid leukemia. Haematologica (2019). doi: 10.3324/haematol.2018.214882 [DOI] [PMC free article] [PubMed] [Google Scholar]
- 51.Pei S et al. Monocytic Subclones Confer Resistance to Venetoclax-Based Therapy in Acute Myeloid Leukemia Patients. Cancer Discov. (2020). doi: 10.1158/2159-8290.CD-19-0710 [DOI] [PMC free article] [PubMed] [Google Scholar]
- 52.Zaanan A et al. The mutant KRAS gene up-regulates BCL-XL protein via STAT3 to confer apoptosis resistance that is reversed by BIM protein induction and BCL-XL antagonism. J. Biol. Chem (2015). doi: 10.1074/jbc.M115.657833 [DOI] [PMC free article] [PubMed] [Google Scholar]
- 53.Corcoran RB et al. Synthetic Lethal Interaction of Combined BCL-XL and MEK Inhibition Promotes Tumor Regressions in KRAS Mutant Cancer Models. Cancer Cell (2013). doi: 10.1016/j.ccr.2012.11.007 [DOI] [PMC free article] [PubMed] [Google Scholar]
- 54.Chen L et al. Mutated Ptpn11 alters leukemic stem cell frequency and reduces the sensitivity of acute myeloid leukemia cells to Mcl1 inhibition. Leukemia (2015). doi: 10.1038/leu.2015.18 [DOI] [PMC free article] [PubMed] [Google Scholar]
- 55.Yang Z, Li Y, Yin F & Chan RJ Activating PTPN11 mutants promote hematopoietic progenitor cell-cycle progression and survival. Exp. Hematol (2008). doi: 10.1016/j.exphem.2008.04.016 [DOI] [PMC free article] [PubMed] [Google Scholar]
- 56.Lee YH, Mungunsukh O, Tutino RL, Marquez AP & Day RM Angiotensin-II-induced apoptosis requires regulation of nucleolin and Bcl-xL by SHP-2 in primary lung endothelial cells. J. Cell Sci (2010). doi: 10.1242/jcs.063545 [DOI] [PMC free article] [PubMed] [Google Scholar]
Associated Data
This section collects any data citations, data availability statements, or supplementary materials included in this article.
Supplementary Materials
Data Availability Statement
Clinical information, mutation, and gene expression data for inhibitor correlation analysis were obtained from the Beat AML and CNL public Vizome interface [www.vizome.org]29,35 and expressed as log2 transformed normalized RPKM or from cBioPortal [https://www.cbioportal.org/]31,33. AML TCGA data were obtained from cBioPortal and expressed as log-transformed RNA Seq V2 RSEM. Data for CLEC7A and CD14 expression in a cohort of CML cases was mined from an internal dataset that is being prepared for publication and expressed as normalized RPKM. Figures for gene expression during normal hematopoiesis and in various leukemia were downloaded Bloodspot [http://servers.binf.ku.dk/bloodspot/]32.
The source data associated with each figure are provided with the manuscript. All other data supporting the findings of this study are available from the corresponding authors on reasonable request.


