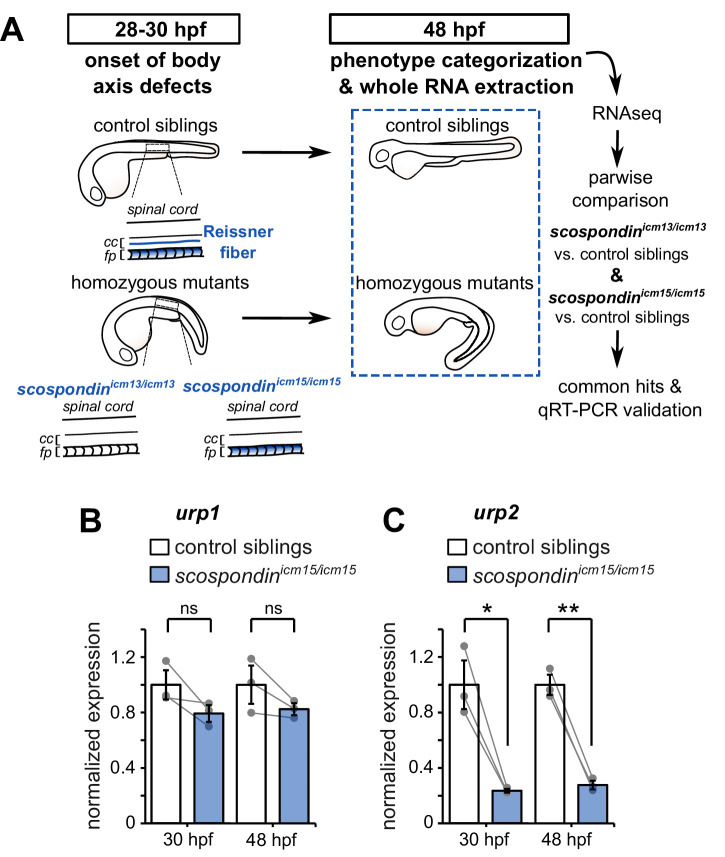
Figure 1. The Reissner fiber is required for urp2 but not urp1 gene expression.
(A) Schematic of the experimental design. Embryos obtained from scospondinicm15/+ or scospondinicm13/+ incrosses were raised until 48 hpf and categorized according to their external phenotype: straight body axis (control siblings, top) or curled-down body axis (homozygous mutants, bottom) prior to RNA extraction. RNA sequencing was performed on three independent replicates for each allele and allowed pairwise comparisons of transcriptomes to identify commonly regulated genes. qRT-PCR experiments were performed at 30 hpf to validate transcriptomic data at the onset of body axis defects induced by the loss of the Reissner fiber and at 48 hpf when the phenotype is fully developed (48 hpf). Null scospondinicm13/icm13 and hypomorphic scospondinicm15/icm15 mutant embryos share the same peculiar curled-down phenotype induced by the loss of the Reissner fiber in the central canal of spinal cord (cc). However, scospondinicm15/icm15 mutants retain SCO-spondin protein expression in secretory structures such as the floor plate (fp). (B, C) qRT-PCR analysis of mRNA levels of urp1 (B) and urp2 (C) in scospondinicm15/icm15 mutants (blue) compared to their control siblings (white) at 30 and 48 hpf. Data are represented as mean ± SEM. N = 3 independent biological replicates for each condition. Each point represents a single experimental replicate. ns p>0.05, *p<0.05, **p<0.01 (paired t-test). See also Figure 1—figure supplement 1 and Figure 1—source data 1 and 2.
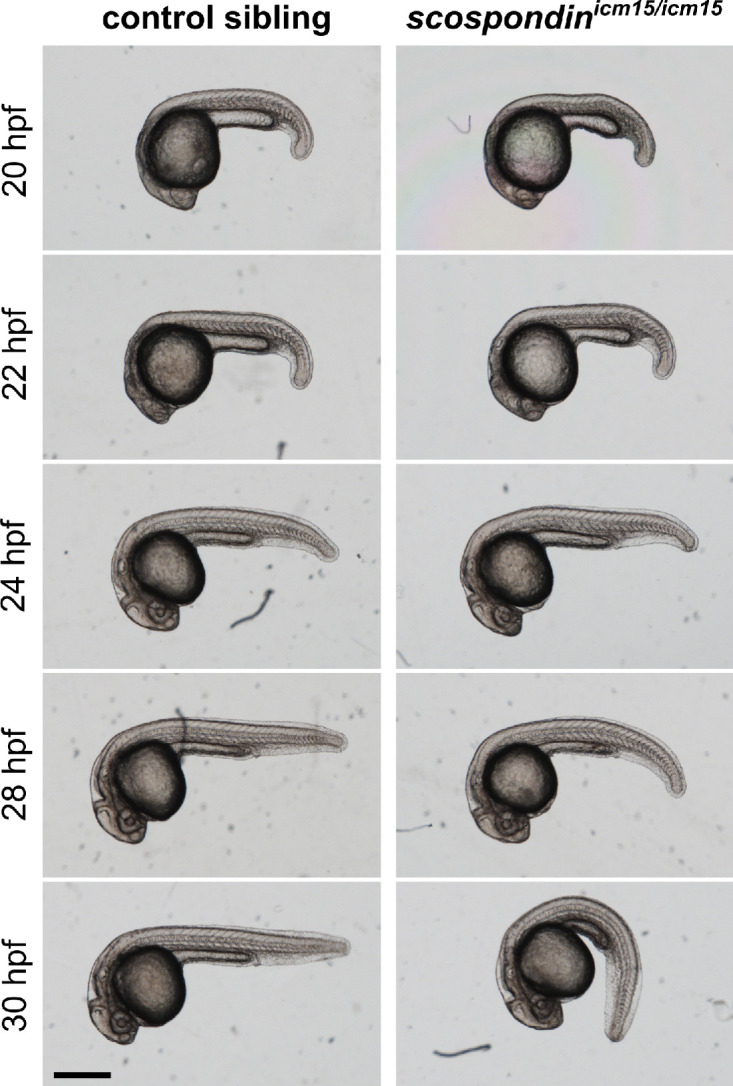
Figure 1—figure supplement 1. Time course of the evolution of body axis geometry from 20 to 30 hpf in scospondinicm15/icm15 mutants.


