Abstract
Breast cancer (BC) is currently one of the deadliest tumors worldwide. Cancer stem cells (CSCs) are a small group of tumor cells with self-renewal and differentiation abilities and high treatment resistance. One of the reasons for treatment failures is the inability to completely eliminate tumor stem cells. By using the edgeR package, we identified stemness-related differentially expressed genes in GSE69280. Via Lasso-penalized Cox regression analysis and univariate Cox regression analysis, survival genes were screened out to construct a prognostic model. Via nomograms and ROC curves, we verified the accuracy of the prognostic model. We selected 4 genes (PSMB9, CXCL13, NPR3, and CDKN2C) to establish a prognostic model from TCGA data and a validation model from GSE24450 data. We found that the low-risk score group had better OS than the high-risk score group, whether using TCGA or GSE24450 data. A prognostic model including four stemness-related genes was constructed in our study to determine targets of breast cancer stem cells (BCSCs) and improve the treatment effect.
Subject terms: Cancer, Computational biology and bioinformatics, Stem cells, Oncology
Introduction
Breast cancer (BC) is one of the most common tumors in females. In China, the number of new cases is 272,400, and the death toll is 69,500 every year1. According to immunohistochemical analysis, BC can be divided into luminal-type, Her2-positive and triple-negative breast cancer (TNBC), of which TNBC has the worst prognosis2,3. With improved treatment, the mortality rate of BC is decreasing year by year4,5, but 70% of patients have recurrence and metastasis within 5 years6.
There is a small group of stem-like cells in tumors called cancer stem cells (CSCs). CSCs have the characteristics of self-renewal and differentiation abilities and high drug resistance7–11. Previous studies have indicated that this portion of breast cancer stem cells (BCSCs) is identified by cell surface markers, such as CD44, CD24, CD133 and ALDH12,13. With changes in the tumor microenvironment, BC cells can differentiate into tumor stem-like cells14,15. In BC-resistant cell lines and tissues, the CSC population is significantly increased by chemotherapy16. Compared with other types of BC, TNBC has the highest expression of stem cell markers, which may be one of the reasons for TNBC having the worst prognosis15,17. Previous studies have shown that stemness-related-gene expression can be used as a predictive biomarker for breast cancer patients. Akbar et al. identified a novel gene list (CNCL) that can discern the stemness and EMT phenotypic statuses of breast cancer, thereby tracking tumor cells and altering the response to tumor treatment18.
Treatment for BCSCs has already emerged but is still immature. In our article, we hope to identify multiple stemness-related genes for determining BC prognosis by establishing a prognostic model. These genes may be potential targets for treating breast cancer, which may improve patient survival.
Result
Selected stemness-related differentially expressed genes (DEGs)
Via edgeR, we identified 599 stemness-related DEGs in GSE69280; among them, 255 genes were upregulated, and 344 genes were downregulated, with thresholds of |log2 FC|> 1.0 and P < 0.05 (Fig .S2).
Identification of stemness-related DEGs in the TCGA BC database
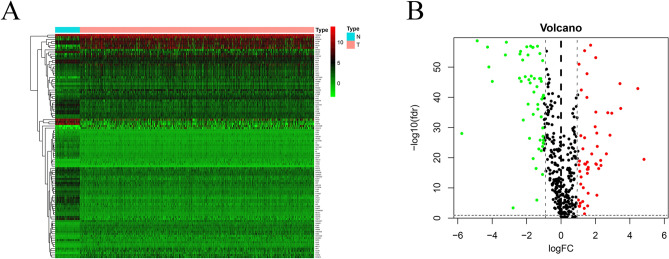
Coexpressed genes were obtained by intersection of TCGA and GSE24450 data. We obtained 566 genes by intersection the stemness-related DEGs list and TCGA data. By Using edgeR, we identified 106 stemness-related DEGs in TCGA BC patients; among them, 54 genes were downregulated, and 52 genes were upregulated, with thresholds of |log2 FC|> 1.0 and an adjusted P < 0.05 (Fig. 1A,B).
Figure 1.
The stemness-related differentially expressed genes of breast cancer patients. (A) Heatmap and (B) Volcano plot.
Construction of the stemness-related-gene prognostic model
By using univariate Cox regression analysis, we obtained the survival-associated genes shown in Fig. 2. Lasso-penalized Cox regression was performed to identify the genes in the prognostic model. We constructed a prognostic model and used GSE24450 to build a validation model. In TCGA prognostic model the expression of genes for each patient is shown in Fig. 3A, the distribution of different risk scores is shown in Fig. 3B, the distribution of different survival statuses (years) of TCGA patients is shown in Fig. 3C. In GSE24450 validation model the expression of genes for each patient is shown in Fig. 3D, the distribution of different risk scores is shown in Fig. 3E, the distribution of different survival statuses (years) of GSE24450 patients is shown in Fig. 3F. The risk score for the prognostic gene signature was calculated as follows: risk score = (expression level of PSMB9 × − 0.01623) + (expression level of CXCL13 × − 0.00335) + (expression level of NPR3 × 0.05481) + (expression level of CDKN2C × − 0.04691).
Figure 2.

The survival-associated stemness-related differentially expressed genes of breast cancer patients.
Figure 3.
Establishment of the stemness-related prognostic model. (A) Heatmap of four genes in the TCGA model. (B) Rank of risk score and distribution of groups in the TCGA data. (C) Survival status of TCGA BC patients in different groups. (D) Heatmap of four genes in the GSE24450 model. (E) Rank of risk score and distribution of groups in the GSE24450 data. (F) Survival status of GSE24450 BC patients in different groups.
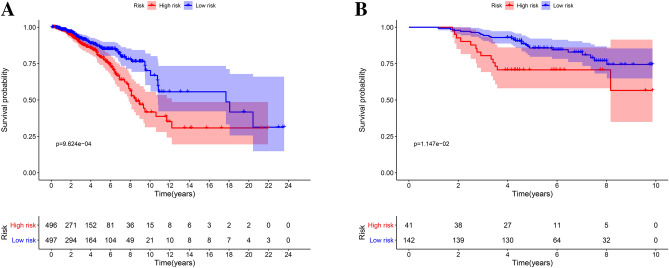
We classified patients into low- and high-risk score groups based on the median risk score as the cut-off. Survival was analyzed by a Kaplan–Meier (KM) curve, and the low-risk-score group had better overall survival (OS) than the high-risk-score group (P < 0.001) (Fig. 4A). In the validation model, the low-risk-score group had better OS than the high-risk-score group (P = 0.0115) (Fig. 4B).
Figure 4.
Survival analysis of the prognostic models. (A) The KM curve of the TCGA model. (B) The KM curve of the GSE24450 model.
The clinical utility of the prognostic model
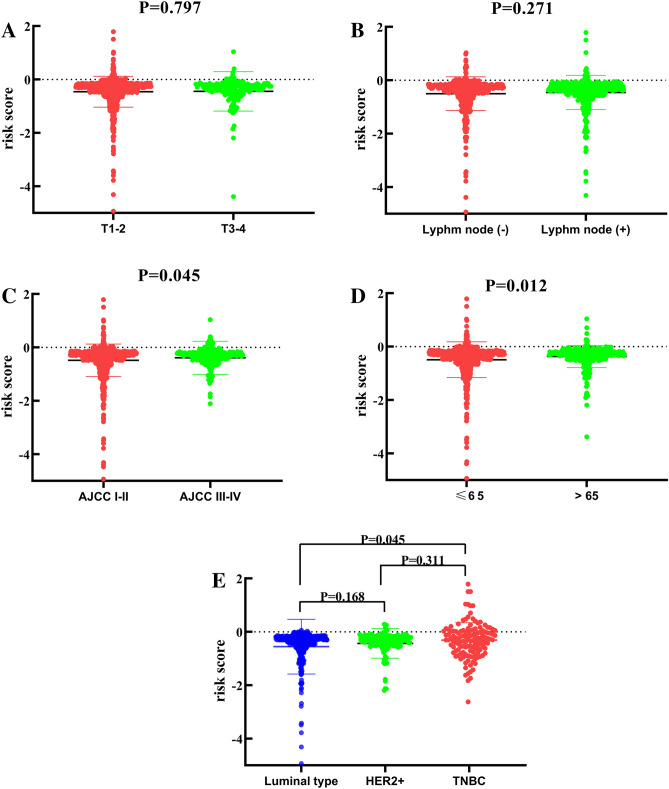
In the TCGA prognostic model, univariate Cox regression analyses (Fig. 5A) showed that older age (> 65) (hazard ratio [HR 1.532; 95% confidence interval [CI] = 1.117–2.047; P < 0.001), high American Joint Committee on Cancer (AJCC) stage (III-IV) (HR = 2.048; 95% CI = 1.603–2.616; P < 0.001), high tumor (T) stage (3–4) (HR = 1.379; 95% CI = 1.101–1.729; P = 0.005), lymph node metastasis (positive) (HR = 1.572; 95% CI = 1.300–1.900; P < 0.001), and high risk score (HR = 3.108; 95% CI = 2.049–4.715; P < 0.001) were significant risk factors for poor prognosis. In the multivariate Cox regression analysis (Fig. 5B), older age (> 65) (HR = 1.634; 95% CI = 1.319–2.048; P < 0.001), high AJCC stage (III–IV) (HR = 2.101; 95% CI = 1.244–3.549; P = 0.005) and high risk score (HR = 3.324; 95% CI = 2.010–5.497; P < 0.001) were found to be independently associated with poor OS. The risk scores were significantly higher for patients with higher AJCC stage (III-IV) (Fig. 6C) and older age (> 65) (Fig. 6D). The risk score was significantly higher in TNBC patients than in luminal-type patients (Fig. 6E). The risk scores for different T stages (Fig. 6A) and different lymph node statuses (Fig. 6B) were not statistically significantly different. The risk scores in luminal-type patients and HER2-positive patients were not statistically significantly different (Fig. 6E). The risk scores in HER2-positive patients and TNBC patients were not statistically significantly different (Fig. 6E).
Figure 5.
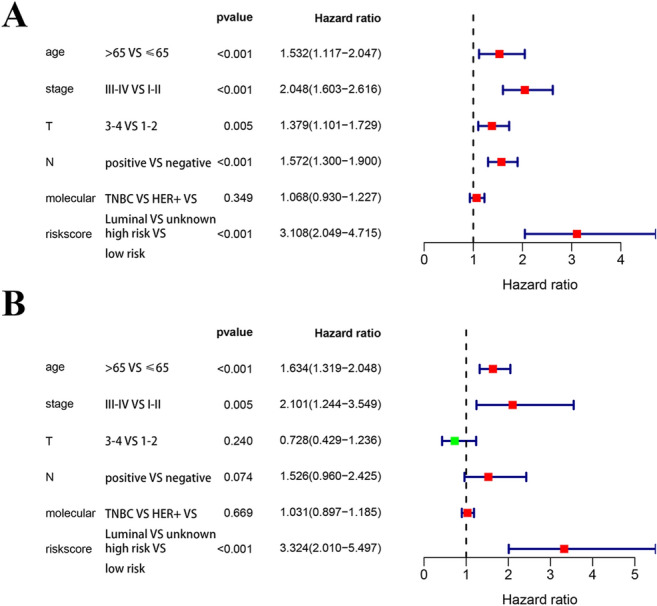
Cox regression analyses of the prognostic model and clinical features. (A) Univariate Cox analyses of the TCGA model. (B) Multivariate Cox regression analysis of the TCGA model.
Figure 6.
The relationship between risk score and clinical features. (A) The risk score in different T stage groups. (B) The risk score in different lymph node metastasis groups. (C) The risk score in different AJCC stage groups. (D) The risk score in different age groups. (E) The risk score in different molecular phenotype groups.
Verification of the accuracy of the prognostic model
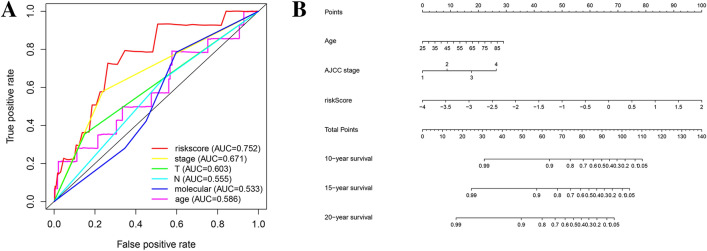
To further verify the accuracy of the prognostic model, we constructed a nomogram and ROC curve. The ROC curve analysis of the TCGA prognostic model is shown in Fig. 7A, and the area under the curve (AUC) was 0.752. The nomogram is shown in Fig. 7B, and the C-index was 0.758.
Figure 7.
Verification of the accuracy of prognostic models. (A) The ROC curve of the TCGA prognostic model. (B) The nomogram of the TCGA prognostic model.
Functional enrichment analysis of stemness-related genes
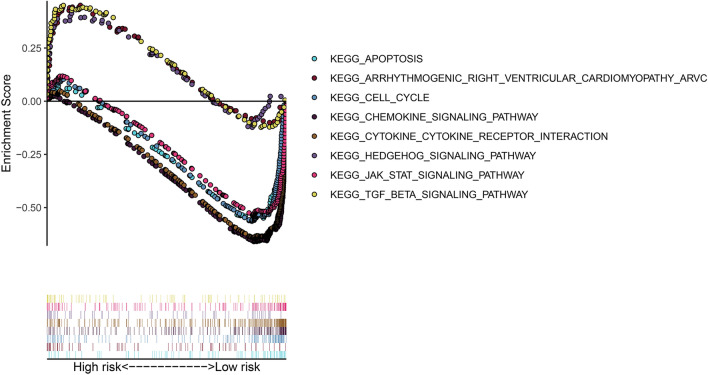
Through GSEA, we found that the high-risk-score group had enrichment in KEGG pathways related to metabolism (Fig. 8): the hedgehog signaling pathway, the TGF-β signaling pathway and a pathway related to arrhythmogenic right ventricular cardiomyopathy (ARVC). The low-risk-score group had enrichment in the following KEGG pathways (Fig. 8): the cell cycle, apoptosis, chemokine, cytokine and JAK-STAT pathways.
Figure 8.
KEGG pathway enrichment analysis.
Discussion
In this research, we identified DEGs with potential stemness characteristics by analyzing stem-like and non-stem-like cells in GSE69280. Then, the DEGs were compared with TCGA and GSE24450 data to select coexpressed genes in the two databases. Next, by using univariate Cox regression analysis and Lasso-penalized Cox regression analysis, we obtained four prognostic-related genes (PSMB9, CXCL13, NPR3, and CDKN2C) and established a prognostic model. The model was validated with GSE24450 data. We divided patients into low-risk-score and high-risk-score groups and found that the low-risk-score group had better OS than the high-risk-score group for both TCGA and GSE24450 data.
BCSCs are a small group of tumor cells that have self-renewal capacity and play an important role in tumor formation, recurrence and metastasis19. Furthermore, resistance to traditional chemoradiotherapy is a remarkable feature of BCSCs, as well as one of the culprits for treatment failure20. Recent studies have demonstrated that breast non-stem cells undergo dedifferentiation and transform into CSCs in response to treatment21. In addition, traditional treatments cannot thoroughly eliminate BCSCs, which contributes to a significant increase in the proportion of CSCs22. The main reasons for the resistance of CSCs are as follows. First, CSCs inhibit the expression of membrane-bound APC transporters, which act as efflux drug pumps to decrease intracellular drug accumulation20. In addition, CSCs also have DNA repair and antiapoptotic effects23, which are responsible for resistance to treatment. What’s more, different BC molecular subtypes, such as TNBC cells and HER-2 positive cells, has the similar stemness, but they are tow unique diseases that require different treatment strategies24. In BCSCs of different molecular subtypes, the expression and regulation of HER-2 are both different, so therapeutic repercussion and prognosis of patients will be different25. Thus, elimination of BSCSs is a potential new strategy for patients with refractory breast cancer.
Our prognostic model was constructed with a series of survival-associated DEGs, including PSMB9, CXCL13, NPR3, and CDKN2C. CDKN2C, also known as p18 or INK4C, is a member of the INKCK family and regulates the G1 phase of the cell cycle by inhibiting CDK4 or CDK626. Previous studies have reported that CDKN2C is involved in the regulation of normal stem cells and CSCs27. Yuan et al. pointed out that liver CSC counts significantly increased in the absence of CDKN2C expression, suggesting that CDKN2C strongly inhibited the self-renewal of liver CSCs28. Gain of the CCND1 and CDK4 and loss of the CDKN2A (p16) and CDKN2C (p18) genes are present in patients with luminal B breast cancer and poor prognosis of and negatively regulated by the cell cycle pathway29. Currently, inhibitors targeting CDK4/6 have been clinically approved for breast cancer patients who have failed hormone receptor-targeted treatment. CXCL13 is a member of the chemokine family and is an important component of the tumor microenvironment. In vivo, IL-30 overexpression in primary tumors facilitates the recruitment of prostate cancer stem-like cells (PCSLCs) to CXCL13, creating a microenvironment convenient for lymph node and blood metastasis30,31. Zhang found that mesenchymal stem cells (MSCs) could secrete a large amount of CXCL13 in the bone marrow microenvironment of multiple myeloma and promote the proliferation, metastasis and drug resistance of myeloma cells through a CXCL13-mediated signaling pathway32. PSMB9 is one of the genes encoding proteasome subunits in human embryonic stem cells (hESCs) and plays a key role in maintaining the pluripotency of hESCs and regulating the cell cycle33. NPR3 is enriched in bone marrow mesenchymal stem cells (BM-MSCs) and has important regulatory effects on BM-MSCs34. Therefore, considering the regulatory role of these four stemness-related genes, our prognostic signature might be a potential biomarker in breast cancer outcome prediction.
GSEA revealed that the high-risk-score group was enriched in the Hedgehog, TGF-β and cardiovascular KEGG pathways, while the low-risk-score group was enriched in the cell cycle, apoptosis, chemokine, cytokine and JAK-STAT KEGG pathways. The Hedgehog signaling pathway is essential for maintenance of BCSCs35, and inhibition of the components of the Hedgehog signaling pathway, such as Gli1, Gil2 and SHH, can reduce CSCs in breast cancer cell lines35,36. The components of the tumor microenvironment (cytokines, chemokines, and exosomes)37,38 and multiple signaling pathways, such as the apoptotic pathway39 and the cell cycle pathway27, both play an important role in maintaining the phenotype and function of CSCs. The JAK2-STAT pathway mediates BCSC resistance40, while JAK1-STAT may participate in non-CSC transformation into BCSCs41. Thus, the KEGG pathways involved in both groups are closely related to maintaining stemness, which may provide strategies for BC treatment. There are already some clinical trials that act directly on the hedgehog, Notch and Wnt signaling pathways and have some effects on CSC suppression42–44. However, unfortunately, although there are treatment strategies for CSCs, the translational of these treatments into the clinic for BC patients has been unsatisfactory.
There are some limitations in our present study. For example, the selected genes have been demonstrated to play an important role in maintaining CSCs or other SCs (BM-MSCs and hESCs), some of which have different roles in breast cancer, but few studies have involved the relationship of these genes with BCSCs. This requires further research in the future.
A prognostic model consisting of stem cell-associated genes was constructed in our study. In data from both TCGA and GSE24450, the low-risk-score group had worse outcomes than the high-risk-score group. Although BCSCs account for only a small proportion of all breast cancer cells, these cells play an important role in the recurrence and metastasis of the disease, and traditional treatment cannot thoroughly eliminate them. To the best of our knowledge, this is the first study to build a stemness-related prognostic signature in BC. It is hoped that our present study can provide potential biomarkers for BC outcome prediction and targets for therapies.
Material and methods
Selected stemness-related DEGs
Via the edgeR package (v3.53) (https://bioconductor.org/packages/edgeR/) (R Development Core Team, Vienna, Austria), we analyzed the GSE69280 data in cells with stemness characteristics and cells without stemness characteristics and identified the stemness-related DEGs (with thresholds of |log2 fold change [FC]|> 1.0 and false discovery rate [FDR] adjusted to P < 0.05).
Data collection
Patient clinical information and mRNA sequencing data were obtained from The Cancer Genome Atlas (TCGA) and GSE24450. The TCGA database contains 1066 BC tissues and 112 adjacent normal tissues, the clinical features of patients were showed in Table 1. GSE24450 included 183 breast cancer patients. All patients had complete survival information, and the follow-up time was more than 10 years; the validation data set had similar characteristics. The DEGs were identified as follows: (A) First, the coexpressed genes were obtained by intersecting TCGA and GSE24450 genes. (B) Second, a stemness-related gene list was obtained from GSE69280. (C) Next, the DEGs in BC samples from TCGA were identified. (D) Finally, we compared the stemness-related gene list and TCGA DEGs to obtain eligible stemness-related DEGs. The flow chart is shown in Fig S1.
Table 1.
The clinical features of TCGA breast cancer patients.
| Clinical features | ||
|---|---|---|
| Age (years) | Media | 58 |
| Rage | 26–89 | |
| Numbers of patients (n = 1066) | Numbers of patients (%) | |
| Gender | Female | 1055 (98.97) |
| Male | 11 (1.03) | |
| T stage | T1 | 280 (26.27) |
| T2 | 617 (57.88) | |
| T3 | 131 (12.29) | |
| T4 | 36 (3.38) | |
| Unknown | 2 (0.18) | |
| N stage | 0 | 501 (47.00) |
| 1 | 358 (33.58) | |
| 2 | 118 (11.69) | |
| 3 | 74 (6.94) | |
| Unknown | 15 (0.79) | |
| M stage | 0 | 888 (83.80) |
| 1 | 19 (1.78) | |
| Unknown | 159 (14.42) | |
| AJCC stage | I | 183 (17.17) |
| II | 602 (56.47) | |
| III | 240 (22.51) | |
| IV | 19 (1.78) | |
| Unknown | 20 (2.07) | |
| HER-2 status | Positive | 156 (14.63) |
| Negative | 560 (52.53) | |
| Unknown | 350 (32.84) | |
| Estrogen receptor status | Positive | 787 (73.83) |
| Negative | 233 (21.86) | |
| Unknown | 46 (4.31) | |
AJCC, American Joint Committee on Cancer; HER-2, human epidermal growth factor receptor-2; M, metastasis, N, node; T, tumor; TCGA, The Cancer Genome Atlas.
Identification of stemness-related differentially expressed genes (DEGs)
Through the R limma package45, we identified stemness-related DEGs for BC in the TCGA data (with thresholds of |log2 fold change (FC)|> 1.0 and false discovery rate [FDR] adjusted to P < 0.05).
Establishment of a prognostic model and validation model
Prognostic risk scores were obtained for all patients by univariate Cox regression analysis and Lasso-penalized Cox regression46. The risk score calculation formula for all patients is as follows.
In the formula, n represents the number of mRNAs, Ci represents the coefficient of the mRNA in multivariate Cox regression analysis, and Vi represents the expression level of the mRNA.
Patients were classified into a high-risk-score group and a low-risk-score group by median risk score. To further verify the feasibility of the prognostic model, we also divided GSE24450 patients into two groups according to the median risk score. The survival of the two groups of patients was analyzed by KM curves.
Construction of a prognosis-related nomogram and receiver operating characteristic (ROC) curves
To further verify the accuracy of the prognostic model, a nomogram and ROC curves were established by the edgeR package47,48. The C-index was used to evaluate the accuracy of the nomogram by a bootstrap method with 1000 resamples.
Functional enrichment analysis
To better understand the underlying biological mechanisms of these genes, KEGG pathway analyses were performed (gene set enrichment analysis [GSEA])49. KEGG pathway analyses were based on a threshold of P < 0.05.
Statistical analysis
Statistical analyses were performed by using GraphPad Prism (version 8.0, San Diego, USA). Independent prognostic factors were determined by using a multivariate Cox regression model. Patient survival time was analyzed using the KM curve, and the log-rank test was used for statistical analysis. P < 0.05 was considered to indicate a statistically significant difference.
Ethics declarations
Our research is in compliance with the Declaration of Helsinki.
Supplementary information
Acknowledgements
The authors thank Wei Song for his assistance in completing the statistics section.
Author contributions
J.P.S. and W.L. contributed to the conception and design of the study; H.W. and M.S.W. organized the database; Y.Q.H., Y.Y.M. and J.Q. performed the statistical analysis; W.J.W. wrote the manuscript. All authors contributed to manuscript revision and read and approved the submitted version.
Funding
The author(s) disclose receipt of the following financial support for the research, authorship, and/or publication of this article: This work was supported by the Science and Education for Health Foundation of Suzhou for Youth (Grant Number kjxw2018032), the Science and Technology Project Foundation of Suzhou (Grant Number SS201651), the Jiangsu Province Medical Key Discipline Project (Grant Number ZDXKC2016007) and the Suzhou Oncology Clinical Center (Grant Number Szzx201506).
Data availability
The datasets generated and analyzed during the current study are available in the TCGA and GEO repositories.
Competing interests
The authors declare no competing interests.
Footnotes
Publisher's note
Springer Nature remains neutral with regard to jurisdictional claims in published maps and institutional affiliations.
These authors contributed equally: Wen-Jie Wang and Han Wang.
Contributor Information
Jian-Ping Shi, Email: SLYY_drSJP@126.com.
Wei Li, Email: liwei10@suda.edu.cn.
Supplementary information
is available for this paper at 10.1038/s41598-020-73164-3.
References
- 1.Chen W, et al. Cancer statistics in China, 2015. CA Cancer J. Clin. 2016;66:115–132. doi: 10.3322/caac.21338. [DOI] [PubMed] [Google Scholar]
- 2.Prat A, Perou CM. Deconstructing the molecular portraits of breast cancer. Mol. Oncol. 2011;5:5–23. doi: 10.1016/j.molonc.2010.11.003. [DOI] [PMC free article] [PubMed] [Google Scholar]
- 3.Ovcaricek T, Frkovic SG, Matos E, Mozina B, Borstnar S. Triple negative breast cancer—prognostic factors and survival. Radiol. Oncol. 2011;45:46–52. doi: 10.2478/v10019-010-0054-4. [DOI] [PMC free article] [PubMed] [Google Scholar]
- 4.Njor S, et al. Breast cancer mortality in mammographic screening in Europe: a review of incidence-based mortality studies. J. Med. Screen. 2012;19(Suppl 1):33–41. doi: 10.1258/jms.2012.012080. [DOI] [PubMed] [Google Scholar]
- 5.Toriola AT, Colditz GA. Trends in breast cancer incidence and mortality in the United States: implications for prevention. Breast Cancer Res. Treat. 2013;138:665–673. doi: 10.1007/s10549-013-2500-7. [DOI] [PubMed] [Google Scholar]
- 6.Gupta PB, et al. Identification of selective inhibitors of cancer stem cells by high-throughput screening. Cell. 2009;138:645–659. doi: 10.1016/j.cell.2009.06.034. [DOI] [PMC free article] [PubMed] [Google Scholar]
- 7.Singh SK, et al. Identification of human brain tumour initiating cells. Nature. 2004;432:396–401. doi: 10.1038/nature03128. [DOI] [PubMed] [Google Scholar]
- 8.Kim CF, et al. Identification of bronchioalveolar stem cells in normal lung and lung cancer. Cell. 2005;121:823–835. doi: 10.1016/j.cell.2005.03.032. [DOI] [PubMed] [Google Scholar]
- 9.Chen K, Huang YH, Chen JL. Understanding and targeting cancer stem cells: therapeutic implications and challenges. Acta Pharmacol. Sin. 2013;34:732–740. doi: 10.1038/aps.2013.27. [DOI] [PMC free article] [PubMed] [Google Scholar]
- 10.Peitzsch C, Tyutyunnykova A, Pantel K, Dubrovska A. Cancer stem cells: the root of tumor recurrence and metastases. Semin. Cancer Biol. 2017;44:10–24. doi: 10.1016/j.semcancer.2017.02.011. [DOI] [PubMed] [Google Scholar]
- 11.Baccelli I, et al. Identification of a population of blood circulating tumor cells from breast cancer patients that initiates metastasis in a xenograft assay. Nat. Biotechnol. 2013;31:539–544. doi: 10.1038/nbt.2576. [DOI] [PubMed] [Google Scholar]
- 12.Ricardo S, et al. Breast cancer stem cell markers CD44, CD24 and ALDH1: expression distribution within intrinsic molecular subtype. J. Clin. Pathol. 2011;64:937–946. doi: 10.1136/jcp.2011.090456. [DOI] [PubMed] [Google Scholar]
- 13.Gourlay SG, McNeil JJ. Antismoking products. Med. J. Aust. 1990;153:699–707. doi: 10.5694/j.1326-5377.1990.tb126327.x. [DOI] [PubMed] [Google Scholar]
- 14.Chaffer CL, et al. Poised chromatin at the ZEB1 promoter enables breast cancer cell plasticity and enhances tumorigenicity. Cell. 2013;154:61–74. doi: 10.1016/j.cell.2013.06.005. [DOI] [PMC free article] [PubMed] [Google Scholar]
- 15.Koren S, et al. PIK3CA(H1047R) induces multipotency and multi-lineage mammary tumours. Nature. 2015;525:114–118. doi: 10.1038/nature14669. [DOI] [PubMed] [Google Scholar]
- 16.Phillips TM, McBride WH, Pajonk F. The response of CD24(-/low)/CD44+ breast cancer-initiating cells to radiation. J. Natl. Cancer Inst. 2006;98:1777–1785. doi: 10.1093/jnci/djj495. [DOI] [PubMed] [Google Scholar]
- 17.Liu R, et al. The prognostic role of a gene signature from tumorigenic breast-cancer cells. N. Engl. J. Med. 2007;356:217–226. doi: 10.1056/NEJMoa063994. [DOI] [PubMed] [Google Scholar]
- 18.Akbar MW, et al. A stemness and EMT based gene expression signature identifies phenotypic plasticity and is a predictive but not prognostic biomarker for breast cancer. J. Cancer. 2020;11:949–961. doi: 10.7150/jca.34649. [DOI] [PMC free article] [PubMed] [Google Scholar]
- 19.Al-Hajj M, Wicha MS, Benito-Hernandez A, Morrison SJ, Clarke MF. Prospective identification of tumorigenic breast cancer cells. Proc. Natl. Acad. Sci. USA. 2003;100:3983–3988. doi: 10.1073/pnas.0530291100. [DOI] [PMC free article] [PubMed] [Google Scholar]
- 20.Pavlopoulou A, et al. Determinants of resistance to chemotherapy and ionizing radiation in breast cancer stem cells. Cancer Lett. 2016;380:485–493. doi: 10.1016/j.canlet.2016.07.018. [DOI] [PubMed] [Google Scholar]
- 21.Lagadec C, Vlashi E, Della Donna L, Dekmezian C, Pajonk F. Radiation-induced reprogramming of breast cancer cells. Stem Cells. 2012;30:833–844. doi: 10.1002/stem.1058. [DOI] [PMC free article] [PubMed] [Google Scholar]
- 22.Wang Y, et al. Blocking the formation of radiation-induced breast cancer stem cells. Oncotarget. 2014;5:3743–3755. doi: 10.18632/oncotarget.1992. [DOI] [PMC free article] [PubMed] [Google Scholar]
- 23.Sotiropoulou PA, Christodoulou MS, Silvani A, Herold-Mende C, Passarella D. Chemical approaches to targeting drug resistance in cancer stem cells. Drug Discov. Today. 2014;19:1547–1562. doi: 10.1016/j.drudis.2014.05.002. [DOI] [PubMed] [Google Scholar]
- 24.Mei Y, Cai D, Dai X. Modulating cancer stemness provides luminal a breast cancer cells with HER2 positive-like features. J. Cancer. 2020;11:1162–1169. doi: 10.7150/jca.37117. [DOI] [PMC free article] [PubMed] [Google Scholar]
- 25.Voutsadakis IA. HER2 in stemness and epithelial-mesenchymal plasticity of breast cancer. Clin. Transl. Oncol. 2019;21:539–555. doi: 10.1007/s12094-018-1961-x. [DOI] [PubMed] [Google Scholar]
- 26.Sherr CJ, Roberts JM. Inhibitors of mammalian G1 cyclin-dependent kinases. Genes Dev. 1995;9:1149–1163. doi: 10.1101/gad.9.10.1149. [DOI] [PubMed] [Google Scholar]
- 27.Cheng T. Cell cycle inhibitors in normal and tumor stem cells. Oncogene. 2004;23:7256–7266. doi: 10.1038/sj.onc.1207945. [DOI] [PubMed] [Google Scholar]
- 28.Yuan Y, Shen H, Franklin DS, Scadden DT, Cheng T. In vivo self-renewing divisions of haematopoietic stem cells are increased in the absence of the early G1-phase inhibitor, p18INK4C. Nat. Cell Biol. 2004;6:436–442. doi: 10.1038/ncb1126. [DOI] [PubMed] [Google Scholar]
- 29.Cancer Genome Atlas Network Comprehensive molecular portraits of human breast tumours. Nature. 2012;490:61–70. doi: 10.1038/nature11412. [DOI] [PMC free article] [PubMed] [Google Scholar]
- 30.Meijer J, Zeelenberg IS, Sipos B, Roos E. The CXCR5 chemokine receptor is expressed by carcinoma cells and promotes growth of colon carcinoma in the liver. Cancer Res. 2006;66:9576–9582. doi: 10.1158/0008-5472.CAN-06-1507. [DOI] [PubMed] [Google Scholar]
- 31.Massague J, Obenauf AC. Metastatic colonization by circulating tumour cells. Nature. 2016;529:298–306. doi: 10.1038/nature17038. [DOI] [PMC free article] [PubMed] [Google Scholar]
- 32.Zhang G, Miao F, Xu J, Wang R. Mesenchymal stem cells from bone marrow regulate invasion and drug resistance of multiple myeloma cells by secreting chemokine CXCL13. Bosn. J. Basic Med. Sci. 2019 doi: 10.17305/bjbms.2019.4344. [DOI] [PMC free article] [PubMed] [Google Scholar]
- 33.Atkinson SP, et al. A putative role for the immunoproteasome in the maintenance of pluripotency in human embryonic stem cells. Stem Cells. 2012;30:1373–1384. doi: 10.1002/stem.1113. [DOI] [PubMed] [Google Scholar]
- 34.Hsieh JY, Fu YS, Chang SJ, Tsuang YH, Wang HW. Functional module analysis reveals differential osteogenic and stemness potentials in human mesenchymal stem cells from bone marrow and Wharton's jelly of umbilical cord. Stem Cells Dev. 2010;19:1895–1910. doi: 10.1089/scd.2009.0485. [DOI] [PubMed] [Google Scholar]
- 35.Koike Y, et al. Anti-cell growth and anti-cancer stem cell activities of the non-canonical hedgehog inhibitor GANT61 in triple-negative breast cancer cells. Breast Cancer. 2017;24:683–693. doi: 10.1007/s12282-017-0757-0. [DOI] [PubMed] [Google Scholar]
- 36.Arnold KM, Flynn NJ, Sims-Mourtada J. Activation of inflammatory responses correlate with hedgehog activation and precede expansion of cancer stem-like cells in an animal model of residual triple negative breast cancer after neoadjuvant chemotherapy. Cancer Stud. Mol. Med. 2015;2:80–86. doi: 10.17140/CSMMOJ-2-112. [DOI] [PMC free article] [PubMed] [Google Scholar]
- 37.Sansone P, Berishaj M, Rajasekhar VK, Ceccarelli C, Chang Q, Strillacci A. Evolution of cancer stem-like cells in endocrine-resistant metastatic breast cancers is mediated by stromal microvesicles. Cancer Res. 2017;77:5438. doi: 10.1158/0008-5472.CAN-17-2427. [DOI] [PMC free article] [PubMed] [Google Scholar]
- 38.Sansone P, et al. Self-renewal of CD133(hi) cells by IL6/Notch3 signalling regulates endocrine resistance in metastatic breast cancer. Nat. Commun. 2016;7:10442. doi: 10.1038/ncomms10442. [DOI] [PMC free article] [PubMed] [Google Scholar]
- 39.Delbridge AR, Grabow S, Strasser A, Vaux DL. Thirty years of BCL-2: translating cell death discoveries into novel cancer therapies. Nat. Rev. Cancer. 2016;16:99–109. doi: 10.1038/nrc.2015.17. [DOI] [PubMed] [Google Scholar]
- 40.Marotta LL, et al. The JAK2/STAT3 signaling pathway is required for growth of CD44(+)CD24(-) stem cell-like breast cancer cells in human tumors. J. Clin. Investig. 2011;121:2723–2735. doi: 10.1172/JCI44745. [DOI] [PMC free article] [PubMed] [Google Scholar]
- 41.Kim SY, et al. Role of the IL-6-JAK1-STAT3-Oct-4 pathway in the conversion of non-stem cancer cells into cancer stem-like cells. Cell Signal. 2013;25:961–969. doi: 10.1016/j.cellsig.2013.01.007. [DOI] [PMC free article] [PubMed] [Google Scholar]
- 42.Habib JG, O'Shaughnessy JA. The hedgehog pathway in triple-negative breast cancer. Cancer Med. 2016;5:2989–3006. doi: 10.1002/cam4.833. [DOI] [PMC free article] [PubMed] [Google Scholar]
- 43.Krishnamurthy N, Kurzrock R. Targeting the Wnt/beta-catenin pathway in cancer: update on effectors and inhibitors. Cancer Treat. Rev. 2018;62:50–60. doi: 10.1016/j.ctrv.2017.11.002. [DOI] [PMC free article] [PubMed] [Google Scholar]
- 44.Tamagnone L, Zacchigna S, Rehman M. Taming the notch transcriptional regulator for cancer therapy. Molecules. 2018 doi: 10.3390/molecules23020431. [DOI] [PMC free article] [PubMed] [Google Scholar]
- 45.Diboun I, Wernisch L, Orengo CA, Koltzenburg M. Microarray analysis after RNA amplification can detect pronounced differences in gene expression using limma. BMC Genom. 2006;7:252. doi: 10.1186/1471-2164-7-252. [DOI] [PMC free article] [PubMed] [Google Scholar]
- 46.Tibshirani R. The lasso method for variable selection in the Cox model. Stat. Med. 1997;16:385–395. doi: 10.1002/(sici)1097-0258(19970228)16:4<385::aid-sim380>3.0.co;2-3. [DOI] [PubMed] [Google Scholar]
- 47.Iasonos A, Schrag D, Raj GV, Panageas KS. How to build and interpret a nomogram for cancer prognosis. J. Clin. Oncol. 2008;26:1364–1370. doi: 10.1200/JCO.2007.12.9791. [DOI] [PubMed] [Google Scholar]
- 48.Heagerty PJ, Lumley T, Pepe MS. Time-dependent ROC curves for censored survival data and a diagnostic marker. Biometrics. 2000;56:337–344. doi: 10.1111/j.0006-341x.2000.00337.x. [DOI] [PubMed] [Google Scholar]
- 49.Subramanian A, et al. Gene set enrichment analysis: a knowledge-based approach for interpreting genome-wide expression profiles. Proc. Natl. Acad. Sci. USA. 2005;102:15545–15550. doi: 10.1073/pnas.0506580102. [DOI] [PMC free article] [PubMed] [Google Scholar]
Associated Data
This section collects any data citations, data availability statements, or supplementary materials included in this article.
Supplementary Materials
Data Availability Statement
The datasets generated and analyzed during the current study are available in the TCGA and GEO repositories.


