

Abstract
Objective
Children with sickle cell disease experience cognitive deficits even when unaffected by stroke. Using functional connectivity MRI as a potential biomarker of cognitive function, we tested our hypothesis that children with sickle cell disease would have decreased functional connectivity, and that children experiencing the greatest metabolic stress, indicated by elevated oxygen extraction fraction, would have the lowest connectivity.
Methods
We prospectively obtained brain MRIs and cognitive testing in healthy controls and children with sickle cell disease.
Results
We analyzed data from 60 participants (20 controls, 40 sickle cell disease). There was no difference in global cognition or cognitive subdomains between cohorts. However, we found decreased functional connectivity within the sensory-motor, lateral sensory-motor, auditory, salience and subcortical networks in participants with sickle cell disease compared to controls. Further, as white matter oxygen extraction fraction increased, connectivity within the visual (p = 0.008, parameter estimate [95% CI] = −0.760 [−1.297, −0.224]), default mode (p = 0.012, parameter estimate [95% CI] = −0.417 [−0.731, −0.104]), and cingulo-opercular (p = 0.009, parameter estimate [95% CI] = −0.883 [−1.517, −0.250]) networks decreased.
Interpretation
We conclude that there is diminished functional connectivity within these anatomically-contiguous networks in children with sickle cell disease compared to controls, even when differences are not seen with cognitive testing. Increased white matter oxygen extraction fraction was associated with decreased connectivity in select networks. These data suggest that elevated oxygen extraction fraction and disrupted functional connectivity are potentially pre-symptomatic neuroimaging biomarkers for cognitive decline in sickle cell disease.
Introduction
Sickle cell disease (SCD) is an inherited blood disorder caused by mutations in the beta globin gene. The resultant hemoglobin polymerizes while deoxygenated, altering the shape and rheology of the red blood cell, ultimately leading to intravascular hemolysis. There are a host of neurologic consequences secondary to the anemia, endothelial activation, vascular inflammation, and ischemia from obstruction of the microcirculation associated with the underlying disease pathophysiology.1 Historically, approximately 10% of patients with SCD suffered overt stroke (infarction seen on imaging that is associated with neurologic deficits on bedside examination) by the age of 20 years, and over one third of patients with SCD continue to suffer from silent cerebral infarcts (SCIs, infarction see on imaging that is not associated with neurologic deficits on bedside examination) by the age of 18 years with current screening and treatment algorithms.2 Furthermore, children with SCD commonly experience cognitive deficits in the absence of prior cerebral ischemia.3-5 As a result of such cognitive deficits, children with SCD face higher rates of grade retention and academic difficulties than demographically-matched peers.6, 7 Unfortunately, the cognitive dysfunction associated with SCD worsens with time as children grow and develop.8, 9
Ischemia results when the metabolic demands of the brain are not fulfilled. The cerebral metabolic rate of oxygen utilization (CMRO2) is the product of cerebral blood flow (CBF), oxygen extraction fraction (OEF) and arterial oxygen content. CBF and OEF are compensatory mechanisms in the brain that adjust to maintain CMRO2 as the oxygen supply to the brain or the metabolic demand of the brain changes. Hence, ischemia results when these compensatory mechanisms are inadequate to maintain CMRO2.10 In SCD, OEF is globally elevated to compensate for decreased arterial oxygen content in the setting of severe anemia, and the region of greatest elevation in OEF co-localizes with the borderzones of the brain in the white matter, where CBF nadirs and strokes are most likely to occur.11-14 Elevated OEF has been associated with cognitive impairment in adults without SCD who have carotid occlusive disease with no history of stroke.15 The relationship between metabolic stress, as measured by OEF, and cognitive dysfunction has not been studied among individuals with SCD.
Neurocognitive abilities emerge from functional networks ascertained using functional connectivity MRI (fcMRI),16 permitting use of fcMRI as a potential biomarker of cognitive function. fcMRI is of additional interest in SCD when considering the possible impact of chronic metabolic stress, as measured by elevated OEF, on the development of the white matter tracks, or structural connectivity, between the cortical regions that encompass these functional networks. The disparate results of prior investigations into the impact of SCD on fcMRI are challenging to interpret due to the heterogeneity in study design and approach.17-24 We aim to further our understanding of the pathophysiology of the cognitive complications of SCD using robust statistical analyses of fcMRI data, including homotopy (a global metric assessing the connectivity between the left and right hemispheres)25 and large-scale networks specific to different neurocognitive functions. Using MRI to measure OEF and functional connectivity in a single session, we prospectively enrolled children with SCD and healthy controls to test our hypothesis that children with SCD would have decreased functional connectivity, and that children experiencing the greatest metabolic stress, as measured by OEF, would have disrupted functional network connectivity.
Methods
This study was approved by the Institutional Review Board at Washington University in St. Louis. Written informed consent was obtained from the legal guardian or participants depending on participant age. Participants with hemoglobin SS (HbSS) or hemoglobin S beta thalassemia null (HbSβthal0) disease were recruited from St. Louis Children’s Hospital (SLCH). Siblings of SCD patients that are unaffected by SCD were recruited as controls (the sibling with SCD was not always eligible or concomitantly enrolled in the study) to partially account for the impact of environment on cognitive outcomes.26 Participants were excluded for a history of overt stroke, vasculopathy or stem cell transplant, current treatment with chronic transfusion therapy, history of a concomitant medical condition that could affect the imaging metrics of interest, contraindication to MRI, or inability to tolerate MRI without sedation.
Medical records were reviewed for SCD participants, extracting treatment with hydroxyurea (HU), history of stroke, vasculopathy and pain events (requiring urgent clinic visit, ED visit or admission at SLCH). The most recent clinically obtained MRI/MR angiogram (MRA) that was interpreted by a board-certified neuroradiologist was reviewed to determine SCI and vasculopathy status. Two SCD participants did not have a clinical MRI or MRA and one SCD participant did not have a MRA available to assess SCI or vasculopathy status. A SCI was defined as an infarct that is ≥ 3mm in diameter, seen on two planes, and not associated with abnormalities on the neurologic examination.27, 28 Academic history, yearly family income, laboratory evaluation (complete blood count, hemoglobin capillary gel electrophoresis and hemoglobin venous saturation) and measurement of the peripheral oxygen saturation (SpO2) were collected during the study visit. Data were not obtained for hemoglobin analysis in 2 SCD participants, hemoglobin venous saturation in 8 participants (1 control, 7 SCD), and SpO2 in 1 SCD participant.
The NIH Toolbox Cognition Battery (NIHTB-CB) and Wechsler Abbreviated Scale Intelligence, 2nd Edition (WASI-II) were used to assess cognition. The vocabulary and matrix reasoning subtests of the WASI-II were obtained, which were used to estimate a full-scale intelligence quotient (IQ).
Imaging Protocol and Analysis
A brain MRI using a Siemens 3 Tesla Prisma MRI scanner (Erlangen, Germany) with a 64-channel head coil was obtained in each participant without sedation. A magnetization-prepared rapid gradient-echo T1 weighted sequence (TE/TR=2.13/2400ms, inversion time=1000ms, flip angle=8°, acquired 1×1×1 mm voxel resolution), fluid attenuated inversion recovery (FLAIR) sequences acquired in axial and coronal planes (TE/TR=94/9000ms, inversion time=2500ms, flip angle=150°, 5mm slice thickness), and 3D-time of flight MR angiography (MRA) were obtained. For fcMRI, two 8-minute blood oxygen level dependent (BOLD) contrast-sensitive echo-planar sequences (TE/TR=33/1160ms, multi-band factor=4, flip angle=67°, whole brain coverage) were collected for a total of 16 minutes of fcMRI data. Occasionally, the second BOLD sequence was omitted due to participant intolerance or time constraints. Spin echo field maps were acquired in the AP and PA direction for distortion correction of the BOLD sequence. To measure voxel-wise OEF, we used an asymmetric spin echo (ASE) sequence.11, 12, 14, 29 A board-certified neurologist (K.P.G.) identified SCI lesions on FLAIR images, manually outlining each lesion to create individual masks of infarcts for the patients with SCD with Medical Image Processing, Analysis, and Visualization.30 A FLAIR image that was obtained clinically or within another research protocol was used to create masks in 19 SCD participants that did not have a usable FLAIR image from this protocol. Three SCD participants that were included in the analyses did not have FLAIR images available for lesion masks.
To create an infarct heatmap from individuals with infarcts identified on FLAIR, participant FLAIR images were aligned to atlas space31 via the participant’s T1 image, and this transformation from FLAIR to atlas space was applied to the participant’s lesion mask using the 4dfp suite developed at Washington University (https://readthedocs.org/projects/4dfp/). Each lesion mask was then overlaid on one another in Talairach space.31
fcMRI Pre-Processing
The first 5 volumes of BOLD sequences were discarded for signal equilibration. Remaining volumes underwent slice timing correction and compensation for even vs. odd slice intensity. Within-run motion correction was performed by aligning each BOLD volume to a reference volume via rigid body transformation. Bias field correction was performed using spin echo field maps, and images were intensity scaled to achieve a within-run mode of 1000. BOLD time series were aligned to a representative template in Talairach space 31 via a T1-weighted image.
Framewise displacement (FD) was computed,32 and motion-contaminated frames, defined as frames with FD >0.3mm, were removed from the time series. Participants with fewer than 258 frames (5 min) of data remaining were excluded. There was no difference in the percentage of retained frames (control 82.5% [63.7, 91.4] vs. SCD 77.2% [61.0, 91.0], p=0.718) or mean FD of retained frames (control 0.16mm [0.13, 0.17] vs. 0.16mm [0.13, 0.18], p=0.466) between control and SCD cohorts. Censored data were replaced via interpolation to allow for lowpass filtering (frequencies<0.1Hz) after demeaning and detrending. Nuisance-based regression of rigid body motion, CSF, white matter, and global signal were performed.32 Data were smoothed using a 6mm Gaussian blur.
Homotopy
Homotopy is a global metric of the intrinsic functional connectivity of the brain that is not specific to a large-scale network, but measures the connectivity between the left to right hemispheres. Homotopy is defined as the correlation of BOLD signal between each pair of left-right mirrored voxels.25 T1 images, aligned to the Talaraich atlas,31 from each participant were averaged to create a mean T1 template. This T1 template was averaged with its left-right mirrored image to create a symmetric T1 atlas for the cohort. Individual T1 maps were segmented into gray and white matter with FSL FMRIB’s Automated Segmentation Tools (FAST),33 and Advanced Normalization Tools (ANTs) nonlinearly registered individual T1s to the symmetric atlas.34, 35 The BOLD data were linearly transformed to Talaraich space 31 using the 4dfp suite. Using ANTs, the BOLD data were then non-linearly warped to the symmetric atlas by applying the previously calculated T1 to atlas transform.34, 35 Three mm plane of voxels at the midline were excluded to limit partial volume effects prior to homotopy computation with a Pearson’s correlation of the BOLD time course for each voxel and its symmetrical interhemispheric counterpart, which was then Fisher Z-transformed to form a normal distribution (½ ln[(1+r)/(1-r)]) . Voxel-wise homotopy values were weighted by grey matter tissue probability to further limit partial volume effects, and averaged to compute a gray matter homotopy value.25
Functional Network Analysis
Two hundred and sixty-four spherical regions of interest (ROI) were used to generate correlation matrices. The ROIs were grouped into 13 resting state networks: sensory-motor (SM), lateral sensory-motor (SM-Lat), auditory, visual, cerebellar, dorsal attention network (DAN), ventral attention network (VAN), memory, default mode network (DMN), salience, cingulo-opercular (CO), fronto-parietal (FP), and subcortical networks.36 As we investigated a pediatric population and these ROIs were defined in healthy adults,36 the ROIs were masked by each participant’s grey matter to create individual-specific ROIs.37 Additionally, voxels within individual lesions (i.e., SCIs) were removed from ROIs. Any ROI with two or fewer voxels remaining within the ROI after grey matter masking and lesion exclusion for any one participant was excluded from analysis; this resulted in the exclusion of 44 ROIs. The temporal correlation with a Pearson r was computed between the averaged signals within each ROI, and Fisher Z-transformed (½ ln[(1+r)/(1-r)]). The correlations were assembled into ROI×ROI matrices organized by network.
OEF Processing
ASE series were motion corrected via linear alignment using MCFLIRT.38 For partial volume correction, ASE data were decomposed into grey matter, white matter, and CSF signal by assuming that the measured signal is a weighted combination of tissue-specific signals.39 The grey matter and white matter ASE data were independently processed to compute voxel-wise OEF as described previously,11, 12, 14 resulting in a separate grey matter and white matter OEF image per participant. OEF values for a given tissue type were only computed in voxels for which the probability of the specified tissue type was greater than 0.1. Regions of infarction and voxels with a poor fit within the OEF model, as determined by Otsu’s method or with an extreme OEF (i.e., <0.05 or >0.95), were excluded from analyses within the tissue-specific OEF images.40
Statistical Analysis
Continuous data are described as median [interquartile range (IQR)]. Cohort comparisons were made with the Mann-Whitney U test, Fisher’s exact test and chi-squared test. Significance for p-values was specified as a p<0.05 after correction with the Benjamini-Hochberg procedure for a final false discovery rate of 0.05 for all cognitive and connectivity analyses of large-scale networks. Statistical analyses were performed with SAS (version 9.2, SAS Institute Inc., Cary, NC).
Statistical Analyses of Cognitive Testing
General linear mixed models predicting cognitive subdomains included cohort as an independent variable with family relationship treated as a random effect.
Statistical Analyses of fcMRI Cohort Comparisons
Multidimensional comparison of whole functional connectivity matrices was performed with object oriented data analysis (OODA). OODA models a population of functional connectivity graphs as a Gibbs distribution. Maximum likelihood estimation is used to determine the representative functional connectivity matrix (G*) per group. A likelihood ratio test performed via a bootstrapping procedure (N=5000) determines if the representative matrices differ between cohorts.41
Post-hoc analyses included general linear mixed models testing for cohort difference with family relationship treated as a random effect predicting the average intra-network Z-score for each of the 13 evaluated networks and homotopy.36 Additionally, block permutation testing was also performed post-hoc to identify functional connectivity networks that differed between groups. Group labels were randomly generated per matrix, creating novel “SCD” and “control” groups. The difference in average connectivity per network was computed between these novel groups 5000 times, creating an empirical distribution of difference values, which was used to compute p-values for the acquired data. The p-value was corrected for multiple comparisons using a false-discovery rate (FDR) method, requiring a p(FDR) <0.05 for significance.37
Statistical Analyses to Evaluate Relationship Between Functional Connectivity and OEF
Univariate correlations between average intra-network Z score and white matter OEF were described with a Pearson’s r. General linear mixed models predicting average intra-network average Z-score within each large-scale network and homotopy including white matter OEF, cohort, age and sex as independent variables with family relationship treated as a random effect were used to further understand the relationship between functional connectivity and OEF. The relationship between functional connectivity within the cerebellar network and OEF was not evaluated as OEF was not measured within the cerebellum.
Data Availability
For original data, please contact fields_m@wustl.edu.
Results
Data were obtained in 66 participants (22 controls, 44 SCD). Four participants failed motion criteria (1 control, 3 SCD), and two participants did not tolerate the MRI (1 control, 1 SCD). Table 1 details demographics and Figure 1 describes the data available for the remaining 60 participants (20 controls, 40 SCD). Thirty-six SCD participants (90.0%) were treated with HU at a median [IQR] dose of 29.2 [23.2, 32.8] mg/kg/day. Fifteen (39.5%) of the SCD participants with a clinical MRI prior to enrollment had a history of SCI, while none suffered an overt stroke or had vasculopathy. Figure 2 illustrates the infarct topography of the lesions identified on FLAIR images. Consistent with previous reports,11, 13, 42 infarcts are small, located in the deep white matter, and demonstrate little overlap between patients. The median infarct volume per participant with infarcts identified on FLAIR imaging was 63.0 [IQR 14.8, 154.1] mm3, with only 137 mm3 of brain where two participants and 1mm3 where 3 participants had overlapping infarcts. In the year prior to the study scan, the median [IQR] number of pain events was 1 [0,3] in the SCD cohort, with 16 (40%) not having any pain events and 12 (30.0%) having ≥ 3 pain events.
Table 1.
Cohort Demographics
| Control N = 20 |
SCD N = 40 |
P-Value | |
|---|---|---|---|
| Age, Years | 11.5 [9.5,15.0] | 10.0 [8.0,14.0] | 0.105 |
| Sex, M/F | 8/12 | 19/21 | 0.582 |
| Genotype | 11 AA / 9 AS | 35 SS / 5 Sβ0 | - |
| Total Hemoglobin, g/dL | 12.7 [12.1, 13.6] | 9.1 [7.9, 10.1] | < 0.001* |
| Hemoglobin A, % | 97.1 [60.9, 97.4] | 0.0 [0.0, 0.0] | < 0.001* |
| Hemoglobin F, % | 0.0 [0.0, 0.3] | 16.2 [9.9, 23.6] | < 0.001* |
| Hemoglobin S, % | 0.0 [0.0, 34.5] | 76.5 [69.1, 83.8] | < 0.001* |
| Carboxyhemoglobin, % | 0.5 [0.3, 0.6] | 2.1 [1.2, 2.5] | < 0.001* |
| Methemoglobin (%) | 0.9 [0.6, 1.2] | 1.6 [1.2, 1.8] | < 0.001* |
Statistically significant
Figure 1. Flow Chart of Study Population.
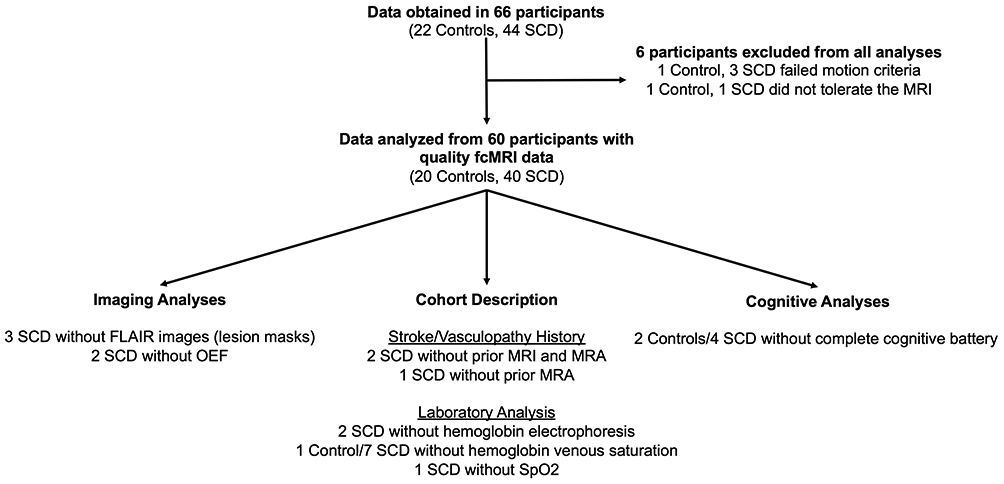
Data were obtained in 66 participants (22 controls, 44 SCD), and the flowchart details the data that are available and missing for the 60 participants (20 controls, 40 SCD) included in the final analyses.
Figure 2. Infarct Topography.
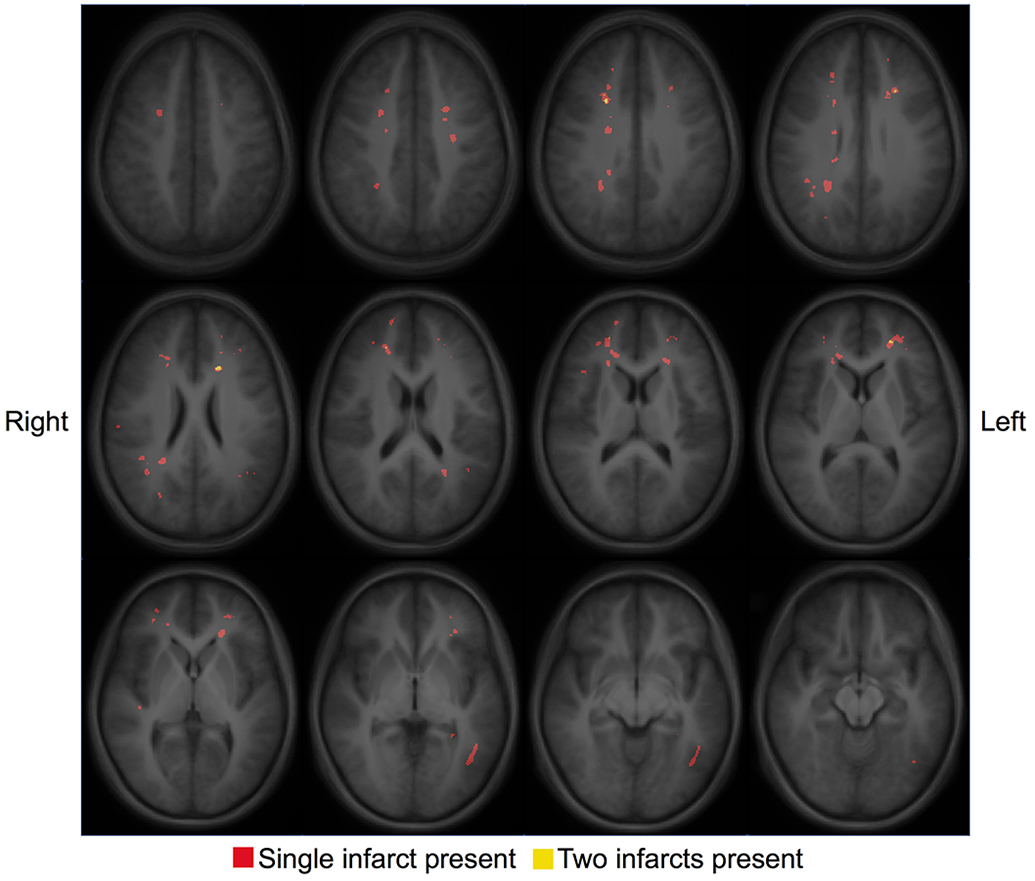
An infarct heatmap is overlaid on a T1 atlas with red voxels identifying the presence of a single infarct and yellow voxels identifying the presence of two infarcts. Infarcts are small, located in deep white matter, and show little overlap.
A complete cognitive battery was obtained in 54 participants (18 controls, 36 SCD). On average, the measures that represent fluid cognition (executive function, processing speed) of children with SCD trended lower than controls, with negative parameter estimates for the SCD cohort in all cognitive tests except the Picture Sequence Memory Test. However, there was no significant difference in these cognitive subdomains tested with the NIHTB-CB or IQ between cohorts while accounting for family relationship in a general linear mixed model after correction for multiple comparisons (Table 2). Significantly more SCD participants had a 504 plan (24 (60.0%) vs. 1 (5.0%), p<0.001) and Individualized Education Plan (16 (40.0%) vs. 2 (10.0%), p=0.017) than controls. There was no difference between cohorts in the number of participants that repeated a grade prior to study entrance (p=0.707). The median yearly household income for the control participants was $42,500.00 [$27,500.00, $62,500.00] and $30,000.00 [$20,000.00, $37,500.00] for the SCD participants (p=0.056). The median yearly household income per family member in the home did not differ between cohorts (p=0.717).
Table 2.
Cognitive Assessments of Cohorts.
| Control N = 18 |
SCD N = 36 |
P-Value | Parameter Estimate for SCD Cohort [95% Confidence Interval] |
|
|---|---|---|---|---|
| NIH Toolbox Cognition Battery (Fully corrected T-Scores) | ||||
| Dimensional Change Card Sort | 47.5 [41.0, 54.0] | 44.0 [38.5, 49.0] | 0.343 | -3.160 [−10.039, 3.719] |
| Flanker Inhibitory Control and Attention Test | 47.5 [40.0, 54.0] | 43.0 [36.5, 50.0] | 0.072 | −4.885 [−10.253, 0.483] |
| List Sorting Working Memory Test | 53.0 [47.0, 60.0] | 49.5 [42.0, 58.0] | 0.484 | −2.375 [−9.461, 4.712] |
| Picture Vocabulary | 48.0 [42.0, 58.0] | 49.0 [45.0, 53.5] | 0.413 | −1.962 [−6.934, 3.009] |
| Oral Reading | 47.5 [40.0, 55.0] | 46.5 [40.0, 53.0] | 0.100 | −4.673 [−10.362, 1.016] |
| Picture Sequence Memory Test | 48.5 [45.0, 57.0] | 50.0 [46.0, 55.0] | 0.845 | 0.499 [−4.839, 5.836] |
| Pattern Comparison Processing Speed Test | 49.5 [42.0, 59.0] | 46.5 [29.8, 58.5] | 0.297 | −4.146 [−12.352, 4.059] |
| Fluid Composite | 51.5 [36.0, 58.0] | 45.0 [36.0, 56.3] | 0.218 | −4.455 [−11.854, 2.944] |
| Crystallized composite | 48.0 [40.0, 55.0] | 45.5 [42.0, 55.0] | 0.147 | −3.851 [−9.222, 1.521] |
| Total Composite | 49.5 [41.0, 59.0] | 45.0 [36.0, 51.0] | 0.065 | −5.692 [−11.797, 0.413] |
| WASI-II | ||||
| Vocabulary Subtest | 49.5 [36.0, 57.0] | 43.0 [38.0, 51.5] | 0.115 | −4.110 [−9.340, 1.121] |
| Matrix Reasoning Subtest | 43.5 [40.0, 53.0] | 42.5 [35.5, 50.0] | 0.098 | −4.680 [−10.332, 0.972] |
| Full Scale IQ | 90.5 [81.0, 107.0] | 88.0 [78.0, 99.0] | 0.032 | −8.034 [−15.266, −0.802] |
Data presented as T-scores with a mean of 50 and a standard deviation of 10.
Raw p-values reported. Parameter estimates for the SCD cohort describe the change in T-score for SCD participants compared to controls in the general linear mixed model predicting each cognitive test while controlling for family relationship.
Statistically significant after Benjamini-Hochberg procedure.
Homotopy, a global metric of functional connectivity calculated by correlating BOLD signal between each pair of left-right mirrored voxels, was lower in the SCD cohort (Z score = 0.50 [0.45, 0.55]) compared to controls (Z score=0.55 [0.50, 0.58]) while accounting for family relationship (p=0.038 with a parameter estimate [95% Confidence interval (CI)] = −0.035 [−0.068, −0.002] for the SCD cohort). Figure 3 illustrates the functional connectivity in the control and SCD cohorts in the form of matrices.36 There was a significant difference between control and SCD matrices as a whole identified using OODA (p=0.005, see Statistical Analysis for description of OODA), with SCD selectively affecting the magnitude of connectivity within specific networks affecting both lower-level sensory-motor systems and higher-level cortical association systems in post-hoc analyses. Differences occurred between the SM, SM-Lat, auditory, salience, and subcortical networks when comparing the average intra-network Z-score between cohorts and controlling for family relationship in a general linear mixed model (Table 3), and the SM-Lat, auditory and salience networks using block permutation testing (Table 4). Examination of the location of the nodes from the disrupted functional connectivity networks in children with SCD demonstrated that the affected networks were anatomically contiguous and clustered versus a uniform distribution through the brain (Figure 4). We did not identify any difference in functional connectivity when comparing matrices between SCD participants with and without history of SCI (the two participants without a pre-study MRI were included in the cohort without infarct) with OODA (p = 0.164).
Figure 3. Functional Connectivity Matrices per Cohort.
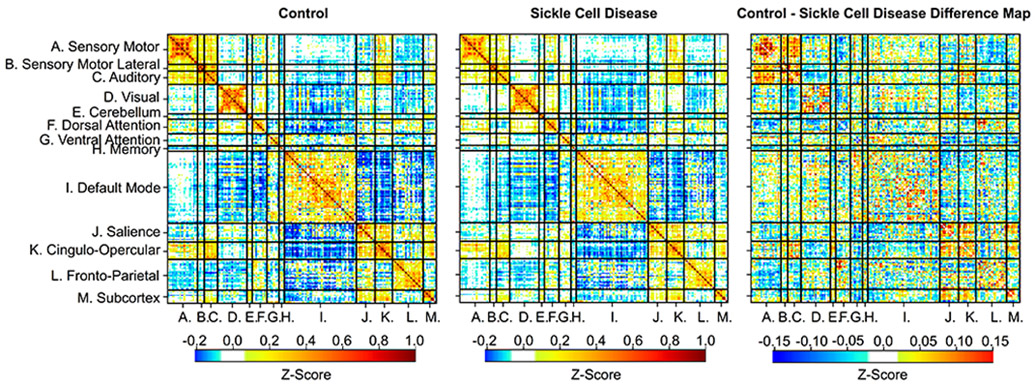
The intra-network spherical parcellations (on the diagonal) have a strong positive correlation compared to the inter-network spherical parcellations, showing that the functional network architecture is similar between the control (left) and SCD cohort (middle). However, the magnitude of connectivity differs between cohorts (p = 0.005), as illustrated in the difference matrix (right).
Table 3.
Average Connectivity Within Network.
| Network Connectivity (Z-Score) |
Control N = 20 |
SCD N = 40 |
P-Value | Parameter Estimate for SCD Cohort [95% Confidence Interval] |
|---|---|---|---|---|
| Cortical Sensory-Motor Networks | ||||
| Sensory-Motor | 0.784 [0.741, 0.869] | 0.638 [0.461, 0.798] | 0.004* | −0.177 [−0.289, −0.065] |
| Sensory-Motor Lateral | 0.313 [0.297, 0.389] | 0.284 [0.236, 0.322] | 0.014* | −0.055 [−0.097, −0.013] |
| Auditory | 0.398 [0.368, 0.444] | 0.307 [0.259, 0.399] | 0.004* | −0.084 [−0.138, −0.030] |
| Visual | 0.322 [0.283, 0.428] | 0.316 [0.254, 0.400] | 0.171 | −0.035 [−0.087, 0.017] |
| Cortical Association Networks | ||||
| Cerebellar | 0.366 [0.272, 0.390] | 0.348 [0.294, 0.438] | 0.780 | 0.009 [−0.059, 0.078] |
| Dorsal Attention | 0.248 [0.198, 0.316] | 0.275 [0.226, 0.323] | 0.394 | 0.020 [−0.027, 0.067] |
| Ventral Attention | 0.227 [0.168, 0.263] | 0.234 [0.163, 0.285] | 0.650 | 0.011 [−0.038, 0.059] |
| Memory | 0.353 [0.252, 0.549] | 0.322 [0.267, 0.451] | 0.407 | −0.037 [−0.127, 0.054] |
| Default Mode | 0.181 [0.159, 0.222] | 0.176 [0.141, 0.217] | 0.239 | −0.018 [−0.048, 0.013] |
| Salience | 0.332 [0.287, 0.399] | 0.246 [0.194, 0.332] | 0.004* | −0.074 [−0.122, −0.027] |
| Cingulo-Opercular | 0.442 [0.342, 0.542] | 0.371 [0.299, 0.455] | 0.026 | −0.074 [−0.138, −0.010] |
| Fronto-Parietal | 0.211 [0.172, 0.272] | 0.167 [0.149, 0.221] | 0.030 | −0.032 [−0.060, −0.003] |
| Subcortical Network | ||||
| Subcortical | 0.361 [0.285, 0.428] | 0.302 [0.265, 0.344] | 0.011* | −0.064 [−0.112, −0.016] |
Raw p-values reported. Parameter estimates for the SCD cohort describe the change for SCD participants compared to controls in functional connectivity (average Z-score) within each network while controlling for family relationship.
Statistically significant after Benjamini-Hochberg procedure.
Table 4.
Block Permutation Testing Between Control and SCD Cohorts.
| FDR-Corrected P-Value | STD From the Null of the Permuted Mean |
Mean FC Difference Between Block |
Networks |
|---|---|---|---|
| 0.025 | 5.46 | 0.091 | Salience – Salience |
| 0.025 | 4.79 | 0.053 | Salience – Subcortex |
| 0.025 | 4.52 | 0.086 | Auditory – Auditory |
| 0.025 | 4.21 | 0.177 | SM-Lat – SM-Lat |
| 0.025 | 4.17 | 0.065 | Salience – VAN |
| 0.025 | 4.16 | 0.056 | Subcortex – VAN |
Figure 4. Anatomic Location of Networks with Diminished Connectivity in Sickle Cell Disease.
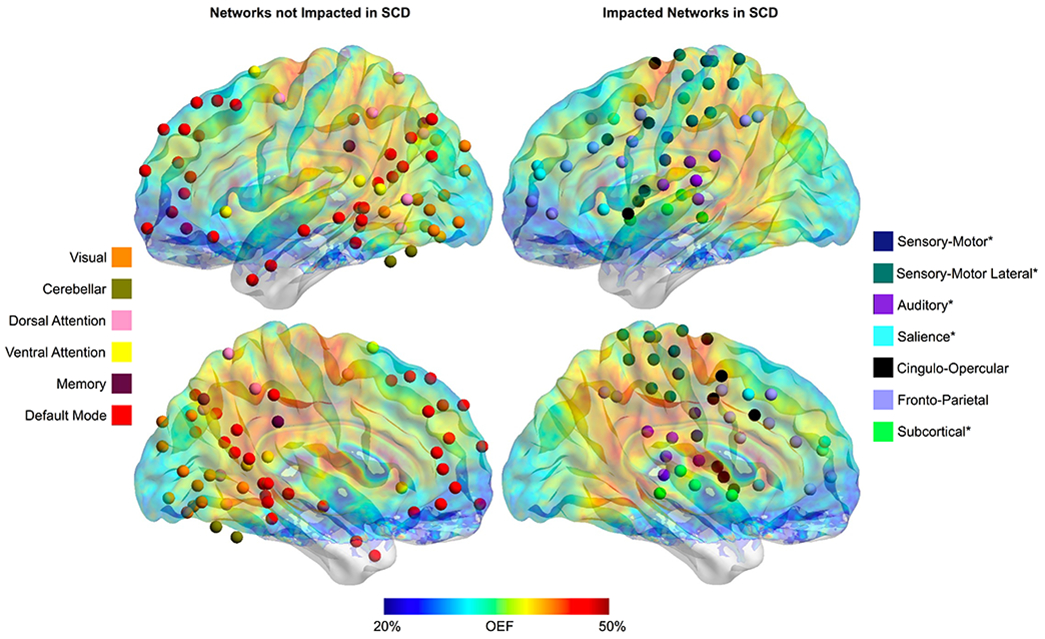
The anatomic location of the spherical regions of interest within the 13 evaluated functional connectivity networks are shown in the left hemisphere of the brain with an overlay of the average OEF map from the SCD cohort. Networks that are unaffected by SCD are illustrated on the left (visual, cerebellar, DAN, VAN, memory and DMN), while the networks with diminished connectivity in SCD when compared to controls per raw p-values are shown on the right (SM, SM-Lat, auditory, salience, CO, FP and subcortical). Asterix by the network name indicates that the connectivity in participants with SCD is significantly lower than controls after the Benjamini-Hochberg procedure.
The functional networks that are diminished in SCD anatomically align with the region of elevated OEF (Figure 4). To further evaluate the relationship between metabolic stress and functional connectivity, we correlated white matter OEF with homotopy and the intra-network average Z-score of each network. Similar to the pattern of large-scale networks impacted by SCD, we found that homotopy (r = −0.509, p < 0.001) and connectivity within the SM (r = −0.382, p = 0.003), SM-Lat (r = −0.305, p = 0.020), auditory (r = −0.487, p < 0.001), visual (r = −0.397, p = 0.002), DMN (r = −0.357, p = 0.006), salience (r = −0.457, p < 0.001), CO (r = −0.493, p < 0.001), and FP (r = −0.370, p = 0.004) networks decreased as white matter OEF increased on univariate analyses. There was no relationship between metabolic stress and connectivity within the DAN (p = 0.634), VAN (p = 0.360), memory (p = 0.354), or subcortical (p = 0.066) networks on univariate analyses. The increased dynamic range of white matter OEF with inclusion of both control and SCD participants in these univariate correlations illustrates the full range of relationships between functional connectivity in large-scale networks and white matter OEF, including those that are partly driven by the collinearity of imaging metrics between cohorts. Using mixed model linear regression to account for the impact of cohort, age, sex and family relationship, white matter OEF was a significant predictor of homotopy (p = 0.017, parameter estimate [95% CI] = −0.415 [−0.746, −0.084]), and intra-network average Z-score within the visual (p = 0.008, parameter estimate [95% CI] = −0.760 [−1.297, −0.224]), DMN (p = 0.012, parameter estimate [95% CI] = −0.417 [−0.731, −0.104]), and CO (p = 0.009, parameter estimate [95% CI] = −0.883 [−1.517, −0.250]) networks (Figure 5). These results suggest that the relationship between white matter OEF and functional connectivity within the visual, DMN and CO networks is independent of cohort differences, age and sex.
Figure 5. Relationship between Metabolic Stress and Functional Connectivity.
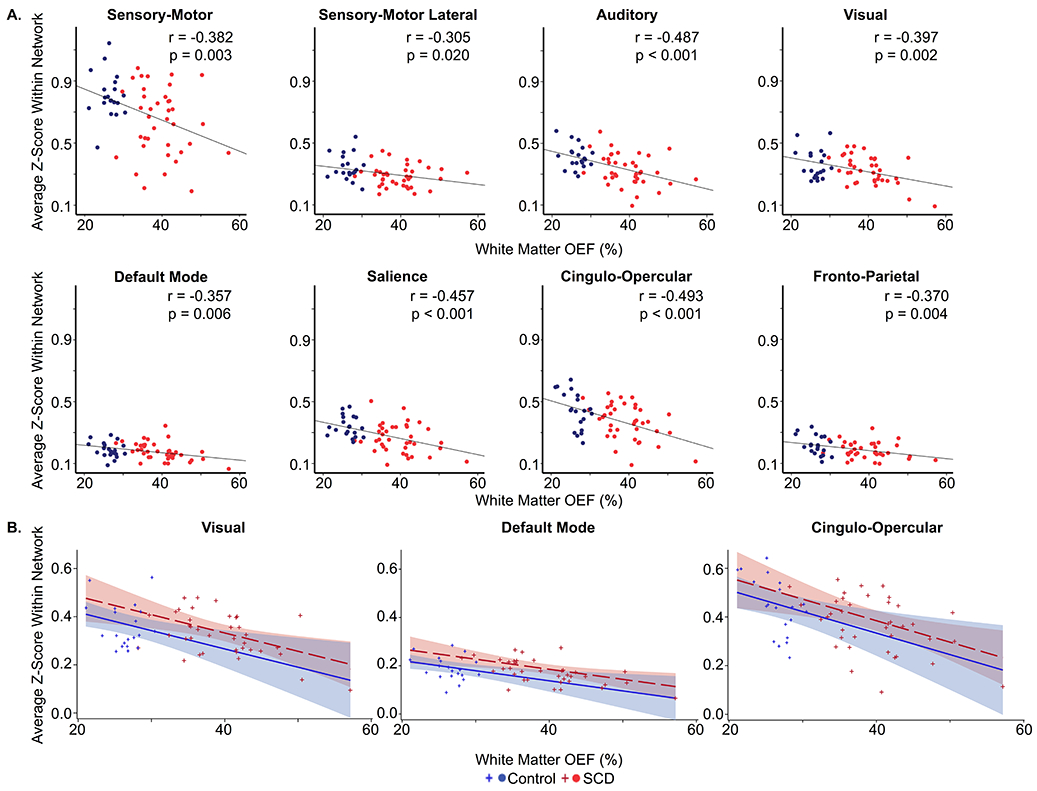
A. Univariate correlations illustrating that functional connectivity, as measured by intra-network average Z-score (y-axis), decreases within the SM (r = −0.382, p = 0.003), SM-Lat (r = −0.305, p = 0.020), auditory (r = −0.487, p < 0.001), visual (r = −0.397, p = 0.002), DMN (r = −0.357, p = 0.006), salience (r = −0.457, p < 0.001), CO (r = −0.493, p < 0.001) and FP (r = −0.370, p = 0.004) networks as white matter OEF (x-axis) increases. B. Intra-network average Z-score (y-axis) significantly decreases as metabolic stress, as measured by white matter OEF (x-axis), increases within visual (p = 0.008, parameter estimate [95% CI] = −0.760 [−1.297, −0.224]), default mode (p = 0.012, parameter estimate [95% CI] = −0.417 [−0.731, −0.104]), and cingulo-opercular (p = 0.009, parameter estimate [95% CI] = −0.883 [−1.517, −0.250]) networks while controlling for cohort, age (illustrated at 11.75 years in the model), sex (illustrated as female in the model) and family relationship. Controls are shown in blue; SCD participants are shown in red.
Discussion
We report decreased functional connectivity within select fcMRI networks compared to controls in a cohort of children with SCD that do not yet have evidence of significant dysfunction with cognitive testing. The impacted networks in participants with SCD encompass sensory-motor and higher-order cognitive functions, and nodes of the affected networks are anatomically contiguous and clustered. We also established a relationship between metabolic stress and connectivity, showing decreased homotopy and connectivity within specific large-scale networks in patients with increased white matter OEF.
While SCD affects general intelligence,3-5, 43 executive function abilities are particularly sensitive to the impact of SCD.43, 44 Executive function abilities encompass the cognitive aspects of goal-directed behavior, including the ability to sustain and shift attention, changing one’s response to boundaries (set-shifting), and manipulating information with a delayed response (working memory).45 Such complex cognitive abilities arise from functional relationships within higher-level cortical association networks.46, 47 While we did not find a significant difference in cognition between SCD participants and controls, connectivity within the salience network was decreased in the SCD cohort compared to controls. Our finding that this cortical association network has decreased connectivity in children with SCD compared to controls suggests a plausible mechanism for the cognitive impairments prevalent in SCD. Functional connectivity has been shown to predict clinical outcomes in patients with neurological disease, including stroke48 and Alzheimer’s disease.49 A sensitive pre-clinical biomarker for the cognitive complications of SCD could improve risk stratification of SCD patients for curative interventions, such as stem cell transplant or gene therapy trials.
Decreased functional connectivity was also observed in sensory-motor networks. Variability of connectivity in sensory-motor networks exists within adolescent and adult SCD cohorts,22 and our results extend this finding into pediatrics, showing aberrant connectivity within the SM and SM-Lat networks in young children with SCD, with a median age of 10 years. Intermittent vaso-occlusive pain and chronic pain syndromes could potentially contribute to the differences observed within the sensory-motor networks between children with SCD and healthy controls. There are differences in connectivity between adult SCD patients with high and low pain burdens, defined by frequency of hospitalization or occurrence of disease-related pain.17, 24 Additionally, Bhatt et al. found differences in connectivity of the locus coeruleus, a region involved in pain processing, in SCD.23 We also found decreased connectivity within the auditory network, which is supported by mounting evidence that patients with SCD suffer hearing loss. Between 13-62% of tested patients are affected by hearing loss, with 6.6-13% having a component of sensorineural hearing loss.50-52 Hearing loss has been associated with fcMRI changes,53 and undiagnosed and untreated hearing loss can potentially impact cognitive development.
Our results expand prior investigations using fcMRI in SCD. The two previously published pediatric studies differed in study design and technique, with Colombatti et al. reporting increased connectivity within regions of the DMN with resting-state fcMRI and Sun et al. reporting attenuated activation and deactivation in regions of the DMN in SCD with task-based fcMRI.18, 21 These two investigations were limited by a high prevalence of vasculopathy within the SCD cohort18 and smaller sample size.21 While it has been shown that the hemodynamic response function (HRF) does not differ in patients with SCD compared to controls,19 it remains unclear if the presence of vasculopathy affects the HRF, potentially impacting the interpretation of functional connectivity results in SCD cohorts including participants with vasculopathy. Five additional studies compared fcMRI between controls and adults with SCD.19, 20, 22-24 Interpretation and generalization of these investigations is challenging due to small sample sizes, inclusion of all SCD genotypes and/or chronically transfused participants with SCD, and a variety of analytic techniques. Using a graph-lasso based test, Coloigner et al. did not find connectivity differences in the majority of SCD patients compared to controls, however, these results are challenging to reconcile with our data as 55% of the SCD cohort in this study was receiving chronic transfusion therapy or had hemoglobin SC disease. 20 Bhatt et al. reported increased connectivity in the left locus coeruleus and dorsal prefrontal cortex in participants with SCD compared to controls unaffected by SCD using graph theory,23 and Karafin et al. reported regions with both decreased and increased connectivity with the periaqueductal gray in SCD compared to controls.24 Using independent component analysis, Case et al. reported decreased connectivity in the executive control network and increased connectivity in the salience network,19 while Zempsky et al. reported decreased connectivity in the salience network in analyses limited to 3 networks.22 Furthermore, Coloigner et al. reported differences in amplitude of low-frequency fluctuation (ALFF) in brain regions in a SCD cohort compared to controls, with a direct correlation between ALFF in the frontal lobe and cognitive measures. While this investigation did not assess functional connectivity within large-scale networks, ALFF is a measure of the power or intensity of the BOLD signal, and can be another index of disease physiology ascertained through fcMRI.54 In the largest cohort to-date, to our knowledge, that is a purely pediatric population limited to HbSS and HbSβthal0 genotypes without a history of overt stroke or vasculopathy, we expand upon these reports, identifying and characterizing differences in functional connectivity measures across 13 different functional networks using three different statistical approaches.
Critically, we established an association between ongoing metabolic stress and functional connectivity, with a decrease in homotopy and functional connectivity within select networks as white matter OEF increased. The region of greatest elevation in OEF in patients with SCD falls within the white matter,11, 12, 14 and there is evidence of aberrant white matter development in SCD. Previous studies have demonstrated a slower increase in white matter volume using longitudinal morphometry analyses of structural MRI55 and differences in the microstructure of white matter using diffusion MRI when compared to controls.56 Of note, the functional networks that are diminished in SCD are contiguous and clustered versus being uniformly distributed throughout the brain, which appears relatively unique among neurologic disorders,37, 57, 58 suggesting an anatomic basis for this disruption. While genetic and cellular factors also contribute, the development of functional network architecture is interrelated with the development of the structural connectome through white matter connections.59 Ongoing metabolic stress in the brains of children with SCD could potentially hinder microstructural white matter development, ultimately impacting functional network architecture and cognition. Alternatively, metabolic stress in the white matter could reversibly disrupt functional connectivity, as Hood et al. reported an improvement in executive function abilities immediately after transfusion of red blood cells,44 a therapeutic intervention that has been shown to decrease metabolic stress, as measured by OEF.12 Multimodal imaging techniques provide complementary information, improving our understanding of the pathophysiology of cognitive decline in SCD and potentially improving risk prediction algorithms.
Strengths of our study include our investigation into the intersection of functional connectivity, oxygen extraction and cognition in a large pediatric SCD population, limited to HbSS and HbSβthal0 genotypes without history of overt stroke or vasculopathy. However, our study has limitations. We are unable to determine if functional connectivity or OEF are predictive of cognitive dysfunction in SCD due to the cross-sectional study design. Longitudinal evaluation will permit such investigations, in addition to assessment of the impact of age and inter-network connectivity on cognitive outcomes.16 The regions of interest used to identify large-scale functional connectivity networks were defined in adult populations.36 While these regions have previously been used in pediatric populations,60-62 we ensured proper alignment to our pediatric participants with application of the individual’s gray matter mask to the regions of interest and exclusion of individual-specific regions of interest if fewer than two voxels remained after masking.37 Future investigations into the differences within the sensory-motor and auditory networks will require more in-depth evaluation of vaso-occlusive pain, chronic pain syndromes and hearing within the SCD cohort. With regards to OEF, there is consensus that SCD results in hemodynamic compromise; however, there is controversy regarding whether this compromise manifests as an increase or decrease in global OEF measurement. Our prior findings of elevated OEF in children with SCD11, 12 are in agreement with investigations using PET63 and T2 relaxation under spin tagging (TRUST) MR measurements of OEF,64 while other investigations utilizing a TRUST sequence reported lower OEF in patients with SCD.65, 66 This discrepancy is postulated to be secondary to differences in MR sequence and post-processing, combined with the possibility of regional shunting of blood flow in patients with SCD due to dysregulated cerebrovascular reserve and cerebral autoregulation.65, 67 Our cognitive evaluation was limited to the NIHTB-CB and an estimated IQ with two WASI-II subtests. Earlier cognitive testing showing differences between SCD and controls did not utilize the NIHTB-CB.3-5, 43 However, the NIHTB was developed with the goal of standardizing research-based cognitive testing, enabling better comparison across disease states,45 and the NIHTB-CB has previously been utilized in SCD.44 Additionally, 90% of our SCD cohort was receiving primary disease modifying therapy with HU, which differentiates our cohort from earlier investigations into the cognitive effects of SCD that were published prior to recommendations that all patients with HbSS and HbSβthal0 genotypes receive HU.68 Hence, a lack of difference in cognitive scores between cohorts in this study could be due to advances in the standard care for patients with SCD. Importantly, our SCD cohort receiving disease modification consistent with evidence-based guidelines improves generalizability of our results. Longitudinal follow-up of the cohort will also provide an improved understanding of cognitive decline in pediatric SCD patients during the modern treatment era. Our control population was limited in size to half of the SCD cohort, and 45% of the control participants have hemoglobin S trait. While there is currently no evidence of neurocognitive complications of hemoglobin S trait, this is an area that warrants further investigation. Lastly, future investigations utilizing diffusion tensor imaging will be necessary to better understand the impact of increased metabolic stress on the development of the structural and functional connectomes.
We conclude that there is evidence of diminished functional connectivity within selective, anatomically-contiguous networks associated with sensory-motor and executive function abilities in children with SCD, even when significant differences are not seen with standardized cognitive testing. Patients with evidence of increased metabolic stress, as measured by white matter OEF, have decreased homotopic connectivity and connectivity within specific, large-scale networks, providing possible insights into the mechanism underlying cognitive dysfunction in SCD. These data suggest that functional connectivity and OEF may provide pre-clinical neuroimaging biomarkers for cognitive decline in SCD.
Acknowledgements
We would like to acknowledge and thank Rachel Shields for her assistance with study set-up and coordination, and Dr. Abraham Snyder for his work developing the 4dfp suite used in the analyses of this work (supported by the Intellectual and Developmental Disabilities Research Center at Washington University (Eunice Kennedy Shriver National Institute of Child Health & Human Development U54HD087011) and Neuroimaging Informatics and Analysis Center at Washington University (P30NS048056).
This research was supported by National Institutes of Health, National Heart, Lung and Blood Institute (K23HL136904 [MEF], R01HL129241 [ALF]), the National Institute of Neurological Disorders and Stroke (K23NS099472 [KPG], K02 NS089852 [CDS], U24NS107230 [J-ML], R01NS085419 [J-ML]), the National Institute of Mental Health (R01MH113570 [CDS], R01MH113883 [CDS]), the National Center for Advancing Translational Sciences (UL1TR002345 [MEF]), the Eunice Kennedy Shriver National Institute of Child Health & Human Development (U54HD087011 (Intellectual and Developmental Disabilities Research Center at Washington University) [JSS, CDS]), the American Society of Hematology (MEF), the Doris Duke Charitable Foundation (MEF) and The Foundation for Barnes-Jewish Hospital (MEF). The content is solely the responsibility of the authors and does not necessarily represent the official views of the National Institutes of Health.
Footnotes
Potential Conflicts of Interest
The authors do not have any conflicts of interest or commercial relationships related to this study.
References
- 1.Ware RE, de Montalembert M, Tshilolo L, Abboud MR. Sickle cell disease. Lancet. 2017. January 31;390(10091):311–23. [DOI] [PubMed] [Google Scholar]
- 2.Hirtz D, Kirkham FJ. Sickle Cell Disease and Stroke. Pediatr Neurol. 2019. June;95:34–41. [DOI] [PubMed] [Google Scholar]
- 3.Schatz J, Finke RL, Kellett JM, Kramer JH. Cognitive functioning in children with sickle cell disease: a meta-analysis. J Pediatr Psychol. 2002. December;27(8):739–48. [DOI] [PubMed] [Google Scholar]
- 4.Steen RG, Fineberg-Buchner C, Hankins G, Weiss L, Prifitera A, Mulhern RK. Cognitive deficits in children with sickle cell disease. Journal of child neurology. 2005. February;20(2):102–7. [DOI] [PubMed] [Google Scholar]
- 5.Vichinsky EP, Neumayr LD, Gold JI, et al. Neuropsychological dysfunction and neuroimaging abnormalities in neurologically intact adults with sickle cell anemia. JAMA : the journal of the American Medical Association. 2010. May 12;303(18):1823–31. [DOI] [PMC free article] [PubMed] [Google Scholar]
- 6.Schatz J Brief report: Academic attainment in children with sickle cell disease. J Pediatr Psychol. 2004. December;29(8):627–33. [DOI] [PubMed] [Google Scholar]
- 7.King AA, Rodeghier MJ, Panepinto JA, et al. Silent cerebral infarction, income, and grade retention among students with sickle cell anemia. American journal of hematology. 2014. October;89(10):E188–92. [DOI] [PMC free article] [PubMed] [Google Scholar]
- 8.Wang W, Enos L, Gallagher D, et al. Neuropsychologic performance in school-aged children with sickle cell disease: a report from the Cooperative Study of Sickle Cell Disease. The Journal of pediatrics. 2001. September;139(3):391–7. [DOI] [PubMed] [Google Scholar]
- 9.King AA, Strouse JJ, Rodeghier MJ, et al. Parent education and biologic factors influence on cognition in sickle cell anemia. American journal of hematology. 2014. February;89(2):162–7. [DOI] [PMC free article] [PubMed] [Google Scholar]
- 10.Powers WJ, Grubb RL Jr., Darriet D, Raichle ME. Cerebral blood flow and cerebral metabolic rate of oxygen requirements for cerebral function and viability in humans. Journal of cerebral blood flow and metabolism : official journal of the International Society of Cerebral Blood Flow and Metabolism. 1985. December;5(4):600–8. [DOI] [PubMed] [Google Scholar]
- 11.Fields ME, Guilliams KP, Ragan DK, et al. Regional oxygen extraction predicts border zone vulnerability to stroke in sickle cell disease. Neurology. 2018. March 27;90(13):e1134–e42. [DOI] [PMC free article] [PubMed] [Google Scholar]
- 12.Guilliams KP, Fields ME, Ragan DK, et al. Red cell exchange transfusions lower cerebral blood flow and oxygen extraction fraction in pediatric sickle cell anemia. Blood. 2018. March 1;131(9):1012–21. [DOI] [PMC free article] [PubMed] [Google Scholar]
- 13.Ford AL, Ragan DK, Fellah S, et al. Silent infarcts in sickle cell disease occur in the border zone region and are associated with low cerebral blood flow. Blood. 2018. October 18;132(16):1714–23. [DOI] [PMC free article] [PubMed] [Google Scholar]
- 14.Fields ME, Guilliams KP, Ragan D, et al. Hydroxyurea reduces cerebral metabolic stress in patients with sickle cell anemia. Blood. 2019. May 30;133(22):2436–44. [DOI] [PMC free article] [PubMed] [Google Scholar]
- 15.Marshall RS, Festa JR, Cheung YK, et al. Cerebral hemodynamics and cognitive impairment: baseline data from the RECON trial. Neurology. 2012. January 24;78(4):250–5. [DOI] [PMC free article] [PubMed] [Google Scholar]
- 16.Gu S, Satterthwaite TD, Medaglia JD, et al. Emergence of system roles in normative neurodevelopment. Proc Natl Acad Sci U S A. 2015. November 3;112(44):13681–6. [DOI] [PMC free article] [PubMed] [Google Scholar]
- 17.Darbari DS, Hampson JP, Ichesco E, et al. Frequency of Hospitalizations for Pain and Association With Altered Brain Network Connectivity in Sickle Cell Disease. J Pain. 2015. November;16(11):1077–86. [DOI] [PMC free article] [PubMed] [Google Scholar]
- 18.Colombatti R, Lucchetta M, Montanaro M, et al. Cognition and the Default Mode Network in Children with Sickle Cell Disease: A Resting State Functional MRI Study. PLoS One. 2016;11(6):e0157090. [DOI] [PMC free article] [PubMed] [Google Scholar]
- 19.Case M, Zhang H, Mundahl J, et al. Characterization of functional brain activity and connectivity using EEG and fMRI in patients with sickle cell disease. Neuroimage Clin. 2017;14:1–17. [DOI] [PMC free article] [PubMed] [Google Scholar]
- 20.Coloigner J, Phlypo R, Coates TD, Lepore N, Wood JC. Graph Lasso-Based Test for Evaluating Functional Brain Connectivity in Sickle Cell Disease. Brain Connect. 2017. September;7(7):443–53. [DOI] [PMC free article] [PubMed] [Google Scholar]
- 21.Sun B, Brown RC, Burns TG, Murdaugh D, Palasis S, Jones RA. Differences in Activation and Deactivation in Children with Sickle Cell Disease Compared with Demographically Matched Controls. AJNR American journal of neuroradiology. 2017. June;38(6):1242–7. [DOI] [PMC free article] [PubMed] [Google Scholar]
- 22.Zempsky WT, Stevens MC, Santanelli JP, Gaynor AM, Khadka S. Altered Functional Connectivity in Sickle Cell Disease Exists at Rest and During Acute Pain Challenge. Clin J Pain. 2017. December;33(12):1060–70. [DOI] [PubMed] [Google Scholar]
- 23.Bhatt RR, Zeltzer LK, Coloigner J, Wood JC, Coates TD, Labus JS. Patients with sickle-cell disease exhibit greater functional connectivity and centrality in the locus coeruleus compared to anemic controls. Neuroimage Clin. 2019;21:101686. [DOI] [PMC free article] [PubMed] [Google Scholar]
- 24.Karafin MS, Chen G, Wandersee NJ, et al. Chronic pain in adults with sickle cell disease is associated with alterations in functional connectivity of the brain. PLoS One. 2019;14(5):e0216994. [DOI] [PMC free article] [PubMed] [Google Scholar]
- 25.Zuo XN, Kelly C, Di Martino A, et al. Growing together and growing apart: regional and sex differences in the lifespan developmental trajectories of functional homotopy. J Neurosci. 2010. November 10;30(45):15034–43. [DOI] [PMC free article] [PubMed] [Google Scholar]
- 26.Luby J, Belden A, Botteron K, et al. The effects of poverty on childhood brain development: the mediating effect of caregiving and stressful life events. JAMA Pediatr. 2013. December;167(12):1135–42. [DOI] [PMC free article] [PubMed] [Google Scholar]
- 27.Casella JF, King AA, Barton B, et al. Design of the silent cerebral infarct transfusion (SIT) trial. Pediatric hematology and oncology. 2010. March;27(2):69–89. [DOI] [PMC free article] [PubMed] [Google Scholar]
- 28.DeBaun MR, Gordon M, McKinstry RC, et al. Controlled trial of transfusions for silent cerebral infarcts in sickle cell anemia. The New England journal of medicine. 2014. August 21;371(8):699–710. [DOI] [PMC free article] [PubMed] [Google Scholar]
- 29.An H, Lin W. Impact of intravascular signal on quantitative measures of cerebral oxygen extraction and blood volume under normo- and hypercapnic conditions using an asymmetric spin echo approach. Magnetic resonance in medicine : official journal of the Society of Magnetic Resonance in Medicine / Society of Magnetic Resonance in Medicine. 2003. October;50(4):708–16. [DOI] [PubMed] [Google Scholar]
- 30.Bazin PL, Cuzzocreo JL, Yassa MA, et al. Volumetric neuroimage analysis extensions for the MIPAV software package. J Neurosci Methods. 2007. September 15;165(1):111–21. [DOI] [PMC free article] [PubMed] [Google Scholar]
- 31.Talairach J, Tournoux P. Co-Planar Stereotaxic Atlas of the Human Brain: 3-Dimensional Proportional System: An Approach to Cerebral Imaging. New York: Thieme Medical Publishers; 1988. [Google Scholar]
- 32.Power JD, Mitra A, Laumann TO, Snyder AZ, Schlaggar BL, Petersen SE. Methods to detect, characterize, and remove motion artifact in resting state fMRI. NeuroImage. 2014. January 1;84:320–41. [DOI] [PMC free article] [PubMed] [Google Scholar]
- 33.Zhang Y, Brady M, Smith S. Segmentation of brain MR images through a hidden Markov random field model and the expectation-maximization algorithm. IEEE Trans Med Imaging. 2001. January;20(1):45–57. [DOI] [PubMed] [Google Scholar]
- 34.Klein A, Andersson J, Ardekani BA, et al. Evaluation of 14 nonlinear deformation algorithms applied to human brain MRI registration. NeuroImage. 2009. July 1;46(3):786–802. [DOI] [PMC free article] [PubMed] [Google Scholar]
- 35.Tustison NJ, Cook PA, Klein A, et al. Large-scale evaluation of ANTs and FreeSurfer cortical thickness measurements. NeuroImage. 2014. October 1;99:166–79. [DOI] [PubMed] [Google Scholar]
- 36.Power JD, Cohen AL, Nelson SM, et al. Functional network organization of the human brain. Neuron. 2011. November 17;72(4):665–78. [DOI] [PMC free article] [PubMed] [Google Scholar]
- 37.Gratton C, Koller JM, Shannon W, et al. Emergent Functional Network Effects in Parkinson Disease. Cerebral cortex. 2019. April 1;29(4):1701. [DOI] [PMC free article] [PubMed] [Google Scholar]
- 38.Jenkinson M, Bannister P, Brady M, Smith S. Improved optimization for the robust and accurate linear registration and motion correction of brain images. NeuroImage. 2002. October;17(2):825–41. [DOI] [PubMed] [Google Scholar]
- 39.Asllani I, Borogovac A, Brown TR. Regression algorithm correcting for partial volume effects in arterial spin labeling MRI. Magnetic resonance in medicine : official journal of the Society of Magnetic Resonance in Medicine / Society of Magnetic Resonance in Medicine. 2008. December;60(6):1362–71. [DOI] [PubMed] [Google Scholar]
- 40.Otsu N A Threshold Selection Method from Gray-Level Histograms. IEEE Transactions on Systems, Man, and Cybernetics. 1979;9(1):62–6. [Google Scholar]
- 41.La Rosa PS, Brooks TL, Deych E, et al. Gibbs distribution for statistical analysis of graphical data with a sample application to fcMRI brain images. Stat Med. 2016. February 20;35(4):566–80. [DOI] [PubMed] [Google Scholar]
- 42.Guilliams KP, Fields ME, Ragan DK, et al. Large-Vessel Vasculopathy in Children With Sickle Cell Disease: A Magnetic Resonance Imaging Study of Infarct Topography and Focal Atrophy. Pediatr Neurol. 2017. April;69:49–57. [DOI] [PMC free article] [PubMed] [Google Scholar]
- 43.Hijmans CT, Fijnvandraat K, Grootenhuis MA, et al. Neurocognitive deficits in children with sickle cell disease: a comprehensive profile. Pediatric blood & cancer. 2011. May;56(5):783–8. [DOI] [PubMed] [Google Scholar]
- 44.Hood AM, King AA, Fields ME, et al. Higher executive abilities following a blood transfusion in children and young adults with sickle cell disease. Pediatric blood & cancer. 2019. October;66(10):e27899. [DOI] [PMC free article] [PubMed] [Google Scholar]
- 45.Weintraub S, Dikmen SS, Heaton RK, et al. Cognition assessment using the NIH Toolbox. Neurology. 2013. March 12;80(11 Suppl 3):S54–64. [DOI] [PMC free article] [PubMed] [Google Scholar]
- 46.Seeley WW, Menon V, Schatzberg AF, et al. Dissociable intrinsic connectivity networks for salience processing and executive control. J Neurosci. 2007. February 28;27(9):2349–56. [DOI] [PMC free article] [PubMed] [Google Scholar]
- 47.Dosenbach NU, Fair DA, Miezin FM, et al. Distinct brain networks for adaptive and stable task control in humans. Proc Natl Acad Sci U S A. 2007. June 26;104(26):11073–8. [DOI] [PMC free article] [PubMed] [Google Scholar]
- 48.Ktena SI, Schirmer MD, Etherton MR, et al. Brain Connectivity Measures Improve Modeling of Functional Outcome After Acute Ischemic Stroke. Stroke; a journal of cerebral circulation. 2019. October;50(10):2761–7. [DOI] [PMC free article] [PubMed] [Google Scholar]
- 49.Buckley RF, Schultz AP, Hedden T, et al. Functional network integrity presages cognitive decline in preclinical Alzheimer disease. Neurology. 2017. July 4;89(1):29–37. [DOI] [PMC free article] [PubMed] [Google Scholar]
- 50.Towerman AS, Hayashi SS, Hayashi RJ, Hulbert ML. Prevalence and nature of hearing loss in a cohort of children with sickle cell disease. Pediatric blood & cancer. 2019. January;66(1):e27457. [DOI] [PubMed] [Google Scholar]
- 51.Schopper HK, D’Esposito CF, Muus JS, Kanter J, Meyer TA. Childhood Hearing Loss in Patients With Sickle Cell Disease in the United States. Journal of pediatric hematology/oncology. 2019. March;41(2):124–8. [DOI] [PubMed] [Google Scholar]
- 52.Farrell AN, Landry AM, Yee ME, Leu RM, Goudy SL. Sensorineural hearing loss in children with sickle cell disease. Int J Pediatr Otorhinolaryngol. 2019. March;118:110–4. [DOI] [PMC free article] [PubMed] [Google Scholar]
- 53.Jung ME, Colletta M, Coalson R, Schlaggar BL, Lieu JEC. Differences in interregional brain connectivity in children with unilateral hearing loss. Laryngoscope. 2017. November;127(11):2636–45. [DOI] [PMC free article] [PubMed] [Google Scholar]
- 54.Coloigner J, Kim Y, Bush A, et al. Contrasting resting-state fMRI abnormalities from sickle and non-sickle anemia. PLoS One. 2017;12(10):e0184860. [DOI] [PMC free article] [PubMed] [Google Scholar]
- 55.Chen R, Arkuszewski M, Krejza J, Zimmerman RA, Herskovits EH, Melhem ER. A prospective longitudinal brain morphometry study of children with sickle cell disease. AJNR American journal of neuroradiology. 2015. February;36(2):403–10. [DOI] [PMC free article] [PubMed] [Google Scholar]
- 56.Stotesbury H, Kirkham FJ, Kolbel M, et al. White matter integrity and processing speed in sickle cell anemia. Neurology. 2018. June 5;90(23):e2042–e50. [DOI] [PMC free article] [PubMed] [Google Scholar]
- 57.Hawellek DJ, Hipp JF, Lewis CM, Corbetta M, Engel AK. Increased functional connectivity indicates the severity of cognitive impairment in multiple sclerosis. Proc Natl Acad Sci U S A. 2011. November 22;108(47):19066–71. [DOI] [PMC free article] [PubMed] [Google Scholar]
- 58.Badhwar A, Tam A, Dansereau C, Orban P, Hoffstaedter F, Bellec P. Resting-state network dysfunction in Alzheimer’s disease: A systematic review and meta-analysis. Alzheimers Dement (Amst). 2017;8:73–85. [DOI] [PMC free article] [PubMed] [Google Scholar]
- 59.Grayson DS, Fair DA. Development of large-scale functional networks from birth to adulthood: A guide to the neuroimaging literature. NeuroImage. 2017. October 15;160:15–31. [DOI] [PMC free article] [PubMed] [Google Scholar]
- 60.Sylvester CM, Barch DM, Corbetta M, Power JD, Schlaggar BL, Luby JL. Resting state functional connectivity of the ventral attention network in children with a history of depression or anxiety. J Am Acad Child Adolesc Psychiatry. 2013. December;52(12):1326–36 e5. [DOI] [PMC free article] [PubMed] [Google Scholar]
- 61.Nielsen AN, Greene DJ, Gratton C, Dosenbach NUF, Petersen SE, Schlaggar BL. Evaluating the Prediction of Brain Maturity From Functional Connectivity After Motion Artifact Denoising. Cerebral cortex. 2019. June 1;29(6):2455–69. [DOI] [PMC free article] [PubMed] [Google Scholar]
- 62.Sheynin J, Duval ER, Lokshina Y, et al. Altered resting-state functional connectivity in adolescents is associated with PTSD symptoms and trauma exposure. Neuroimage Clin. 2020. February 19;26:102215. [DOI] [PMC free article] [PubMed] [Google Scholar]
- 63.Herold S, Brozovic M, Gibbs J, et al. Measurement of regional cerebral blood flow, blood volume and oxygen metabolism in patients with sickle cell disease using positron emission tomography. Stroke; a journal of cerebral circulation. 1986. Jul-Aug;17(4):692–8. [DOI] [PubMed] [Google Scholar]
- 64.Jordan LC, Gindville MC, Scott AO, et al. Non-invasive imaging of oxygen extraction fraction in adults with sickle cell anaemia. Brain : a journal of neurology. 2016. March;139(Pt 3):738–50. [DOI] [PMC free article] [PubMed] [Google Scholar]
- 65.Bush AM, Coates TD, Wood JC. Diminished cerebral oxygen extraction and metabolic rate in sickle cell disease using T2 relaxation under spin tagging MRI. Magnetic resonance in medicine : official journal of the Society of Magnetic Resonance in Medicine / Society of Magnetic Resonance in Medicine. 2018. July;80(1):294–303. [DOI] [PMC free article] [PubMed] [Google Scholar]
- 66.Vaclavu L, Petr J, Petersen ET, et al. Cerebral oxygen metabolism in adults with sickle cell disease. American journal of hematology. 2019. December 20;95(4):401–12. [DOI] [PMC free article] [PubMed] [Google Scholar]
- 67.Stotesbury H, Kawadler JM, Hales PW, Saunders DE, Clark CA, Kirkham FJ. Vascular Instability and Neurological Morbidity in Sickle Cell Disease: An Integrative Framework. Front Neurol. 2019;10:871. [DOI] [PMC free article] [PubMed] [Google Scholar]
- 68.Yawn BP, Buchanan GR, Afenyi-Annan AN, et al. Management of sickle cell disease: summary of the 2014 evidence-based report by expert panel members. JAMA : the journal of the American Medical Association. 2014. September 10;312(10):1033–48. [DOI] [PubMed] [Google Scholar]
Associated Data
This section collects any data citations, data availability statements, or supplementary materials included in this article.
Data Availability Statement
For original data, please contact fields_m@wustl.edu.