

Abstract
Background:
Genome-wide polygenic scores (GPS) integrate information from many common DNA variants into a single number. Because rates of coronary artery disease (CAD) are substantially higher among South Asians, a GPS to identify high-risk individuals may be particularly useful in this population.
Objectives:
We used summary statistics from a prior genome-wide association study to derive a new GPSCAD for South Asians.
Methods:
We validated this GPSCAD in 7,244 South Asian UK Biobank participants and tested it in 491 individuals from a case-control study in Bangladesh. Next, we built a static ancestry and GPSCAD reference distribution using whole genome sequencing from 1,522 Indian individuals, and tested a framework for projecting individuals onto this static ancestry and GPSCAD reference distribution using 1,800 CAD cases and 1,163 controls newly recruited in India.
Results:
The GPSCAD, containing 6,630,150 common DNA variants, had odds ratio per standard deviation (OR/SD) of 1.58 in South Asian UK Biobank participants and 1.60 in the Bangladeshi study (p < 0.001 for each). We next projected individuals of the Indian case-control study onto static reference distributions, observing an OR/SD of 1.66 (p < 0.001). Compared to the middle quintile, risk for CAD was most pronounced for those in the top 5% of the GPSCAD distribution - ORs of 4.16, 2.46, and 3.22 in the South Asian UK Biobank, Bangladeshi, and Indian studies, respectively (p < 0.05 for each).
Conclusions:
We developed and tested a new GPSCAD using three distinct South Asian studies, and provide a generalizable framework for ancestry-specific GPS assessment.
Keywords: Coronary artery disease, polygenic score, South Asian, genomic medicine
Condensed abstract:
Genome-wide polygenic scores are a new approach to quantify inherited risk for a given disease using information from many common sites of DNA variation. The predictive capacity of a polygenic score for coronary artery disease in South Asians - a population that suffers from coronary artery disease at significantly higher rates - is largely unknown. Here, we build a polygenic score consisting of over 6.6 million common DNA variants and a workflow for ancestry-corrected risk quantification. Results confirm striking and consistent relationships with coronary artery disease in South Asian populations from the United Kingdom, Bangladesh, and India.
Introduction
Individuals of South Asian ancestry represent 23% of the global population — corresponding to 1.8 billion people — and suffer from substantially increased risk of coronary artery disease (CAD) compared to most other ethnicities (1). Practice guidelines in the U.S. now recognize South Asian ancestry as an important ‘risk-enhancing’ factor for CAD (2, 3). Because CAD has a significant inherited component (4, 5), genetic analyses to understand and predict CAD among South Asian populations are of particular interest.
The inherited risk for CAD can — for about 0.4% of the population — be driven by rare monogenic variants such as those related to familial hypercholesterolemia (6–10). However, the vast majority of individuals afflicted by CAD do not harbor any known monogenic mutation (7, 8, 10). A second mechanism of increased genetic risk for CAD is via a ‘polygenic’ model (11–13). Here, the risk is driven not by any one variant, but rather the cumulative effect of many common DNA variants scattered across the genome (11–13). We recently developed a genome-wide polygenic score for CAD (GPSCAD) that integrates information from over 6 million sites in the genome (11). Using this approach, we demonstrated that up to 8% of individuals of European ancestry are at more than triple the normal risk for CAD on the basis of a high GPS — a prevalence 20 times greater than familial hypercholesterolemia variants that confer similar risk (11).
Whether a GPSCAD can predict disease in a South Asian population is uncertain for three key reasons. First, prior genome-wide association studies — needed as input to GPS derivation to weight a given variant’s contribution to the risk of CAD — have been performed primarily in individuals of European ancestry (14). Second, a GPS derived in individuals of European ancestry may have attenuated effect when applied to other ethnicities (15, 16), given that variant frequency and correlation patterns vary across ancestral groups (15, 17). A recent study for a range of traits suggested that GPS derived from Europeans displayed somewhat lower predictive power when applied to South Asians (16). Third, cultural and environmental factors unique to South Asian populations may modulate the importance of genetic variation on the risk of CAD (1). A GPS specifically tuned to a South Asian population may thus have enhanced predictive capacity as compared to previously described scored validated in individuals of European ancestry, but this has not been adequately explored to date.
Beyond confirmation that a GPS is associated with disease, accurate and consistent GPS calculation in a clinical workflow poses unique challenges when compared to other risk biomarkers (18). First, statistical imputation is needed to ensure that - beyond the variants included on a genotyping array - an identical set of genetic variants is captured in each individual. Second, an individuals’ raw GPS scores needs to be interpreted within the context of their genetic ancestry, typically performed by projecting them into static ‘principal components of ancestry’ space. Third, a reference distribution is needed to determine whether a given individual’s GPS is high or low versus others with a similar ancestral background. Overcoming these issues is critically important prior to clinical deployment of GPS disclosure.
Here, we aim to address these areas of uncertainty by developing a new GPSCAD tuned to individuals of South Asian ancestry, confirming robust associations of the new GPSCAD with CAD in 7,244 South Asian participants of the UK Biobank and 491 participants of an independent case-control study in Bangladesh (Figure 1). Next, we build a new framework to support GPSCAD calculation by developing an ancestry-specific reference distribution from 1,522 individuals recruited in India and validate this in 2,963 newly recruited participants of a CAD case-control study in India (Central illustration).
Figure 1. Genome-wide polygenic score for individuals of South Asian ancestry - derivation, validation, and testing workflow.
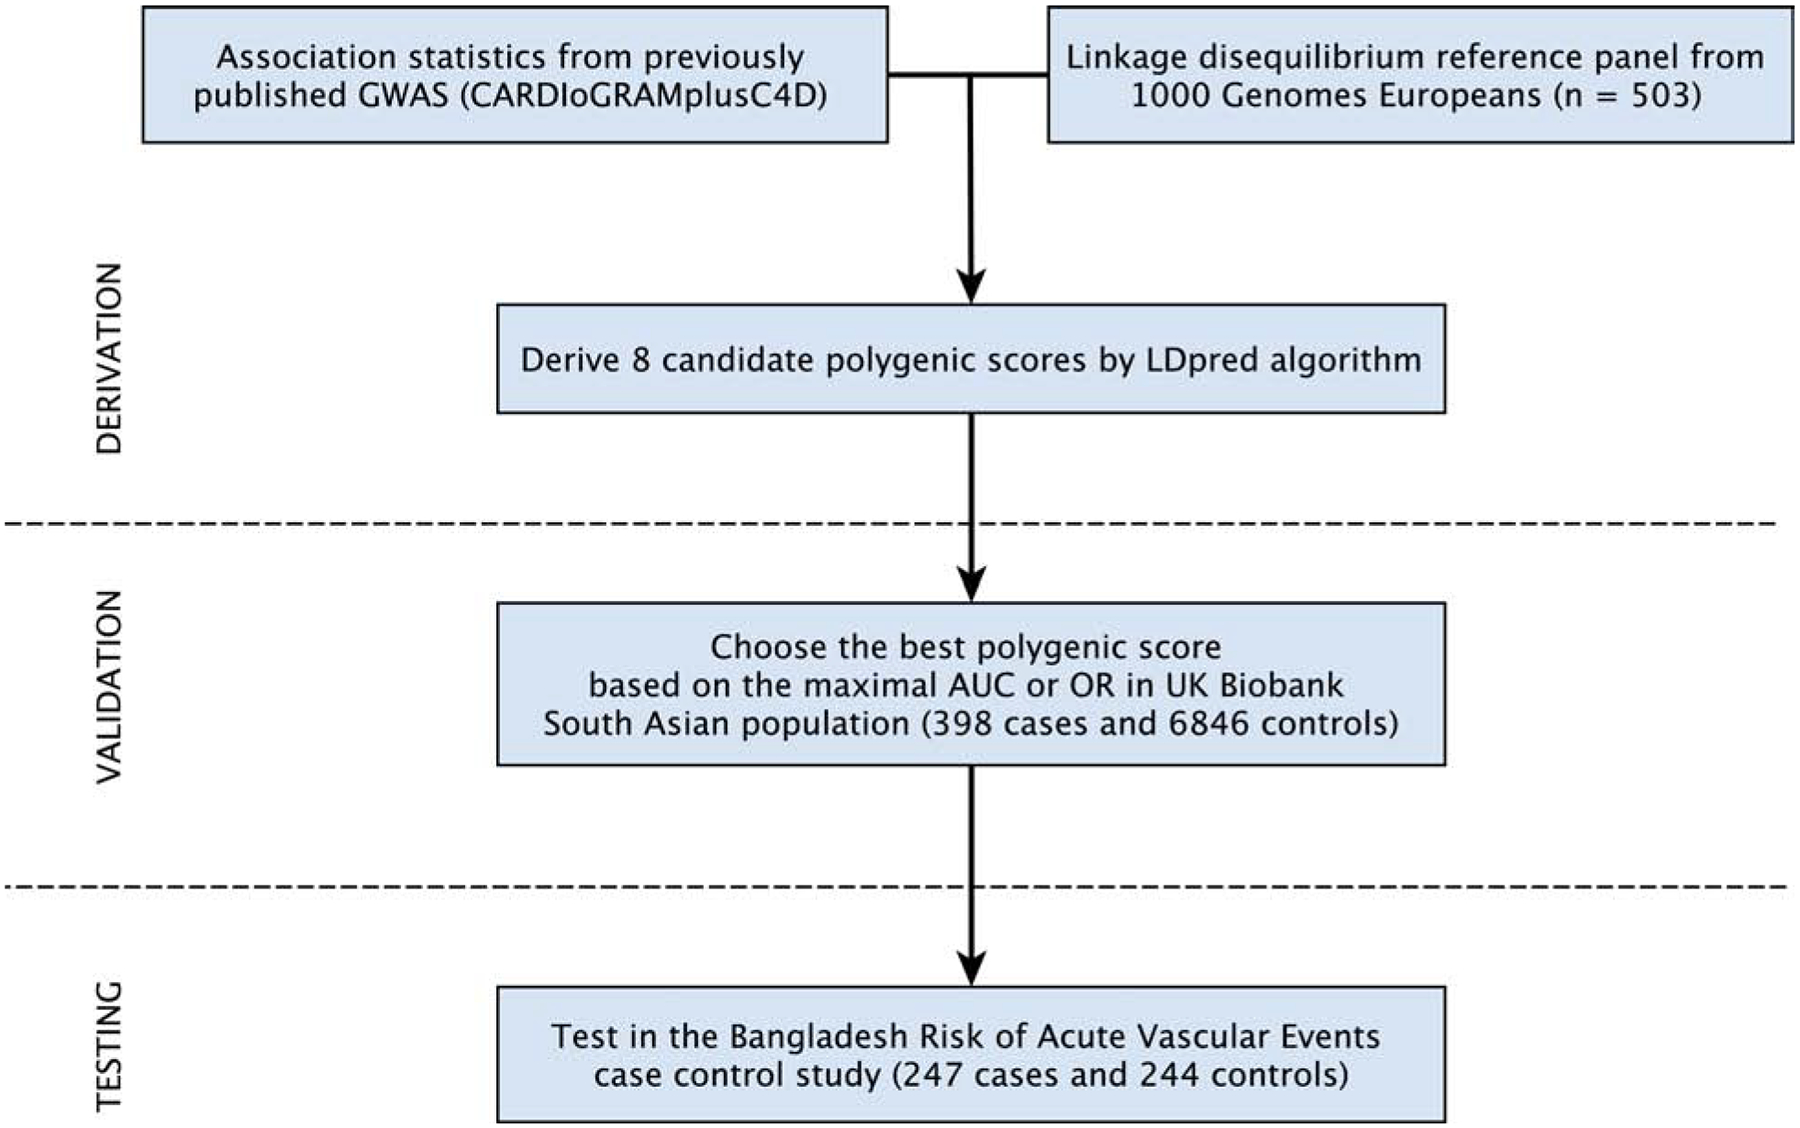
Candidate genome-wide polygenic scores for coronary artery disease (GPSCAD) were generated using summary association statistics from a large GWAS study - CARDIoGRAMplusC4D [Coronary ARtery DIsease Genome wide Replication and Meta-analysis (CARDIoGRAM) plus The Coronary Artery Disease (C4D) Genetics] - and a linkage disequilibrium reference panel of 503 Europeans from the 1000 Genomes Project (22, 24). Eight candidate GPSs were generated using the LDpred computational algorithm, a Bayesian approach to calculate a posterior mean effect for all variants based on a prior (effect size in the previous GWAS) and subsequent shrinkage based on linkage disequilibrium (23). The scores varied with respect to the tuning parameter ρ (that is, the proportion of variants assumed to be causal), as previously recommended. Of the 8 candidate GPSs, the best performing GPSCAD was chosen in a validation dataset of South Asian participants of the UK Biobank. Next, we tested this score in a newly recruited CAD case-control study - the Bangladesh Risk of Acute Vascular Events (BRAVE) Study (21).
Central illustration. Development and implementation of a framework for calculating genome-wide polygenic scores in South Asian individuals.
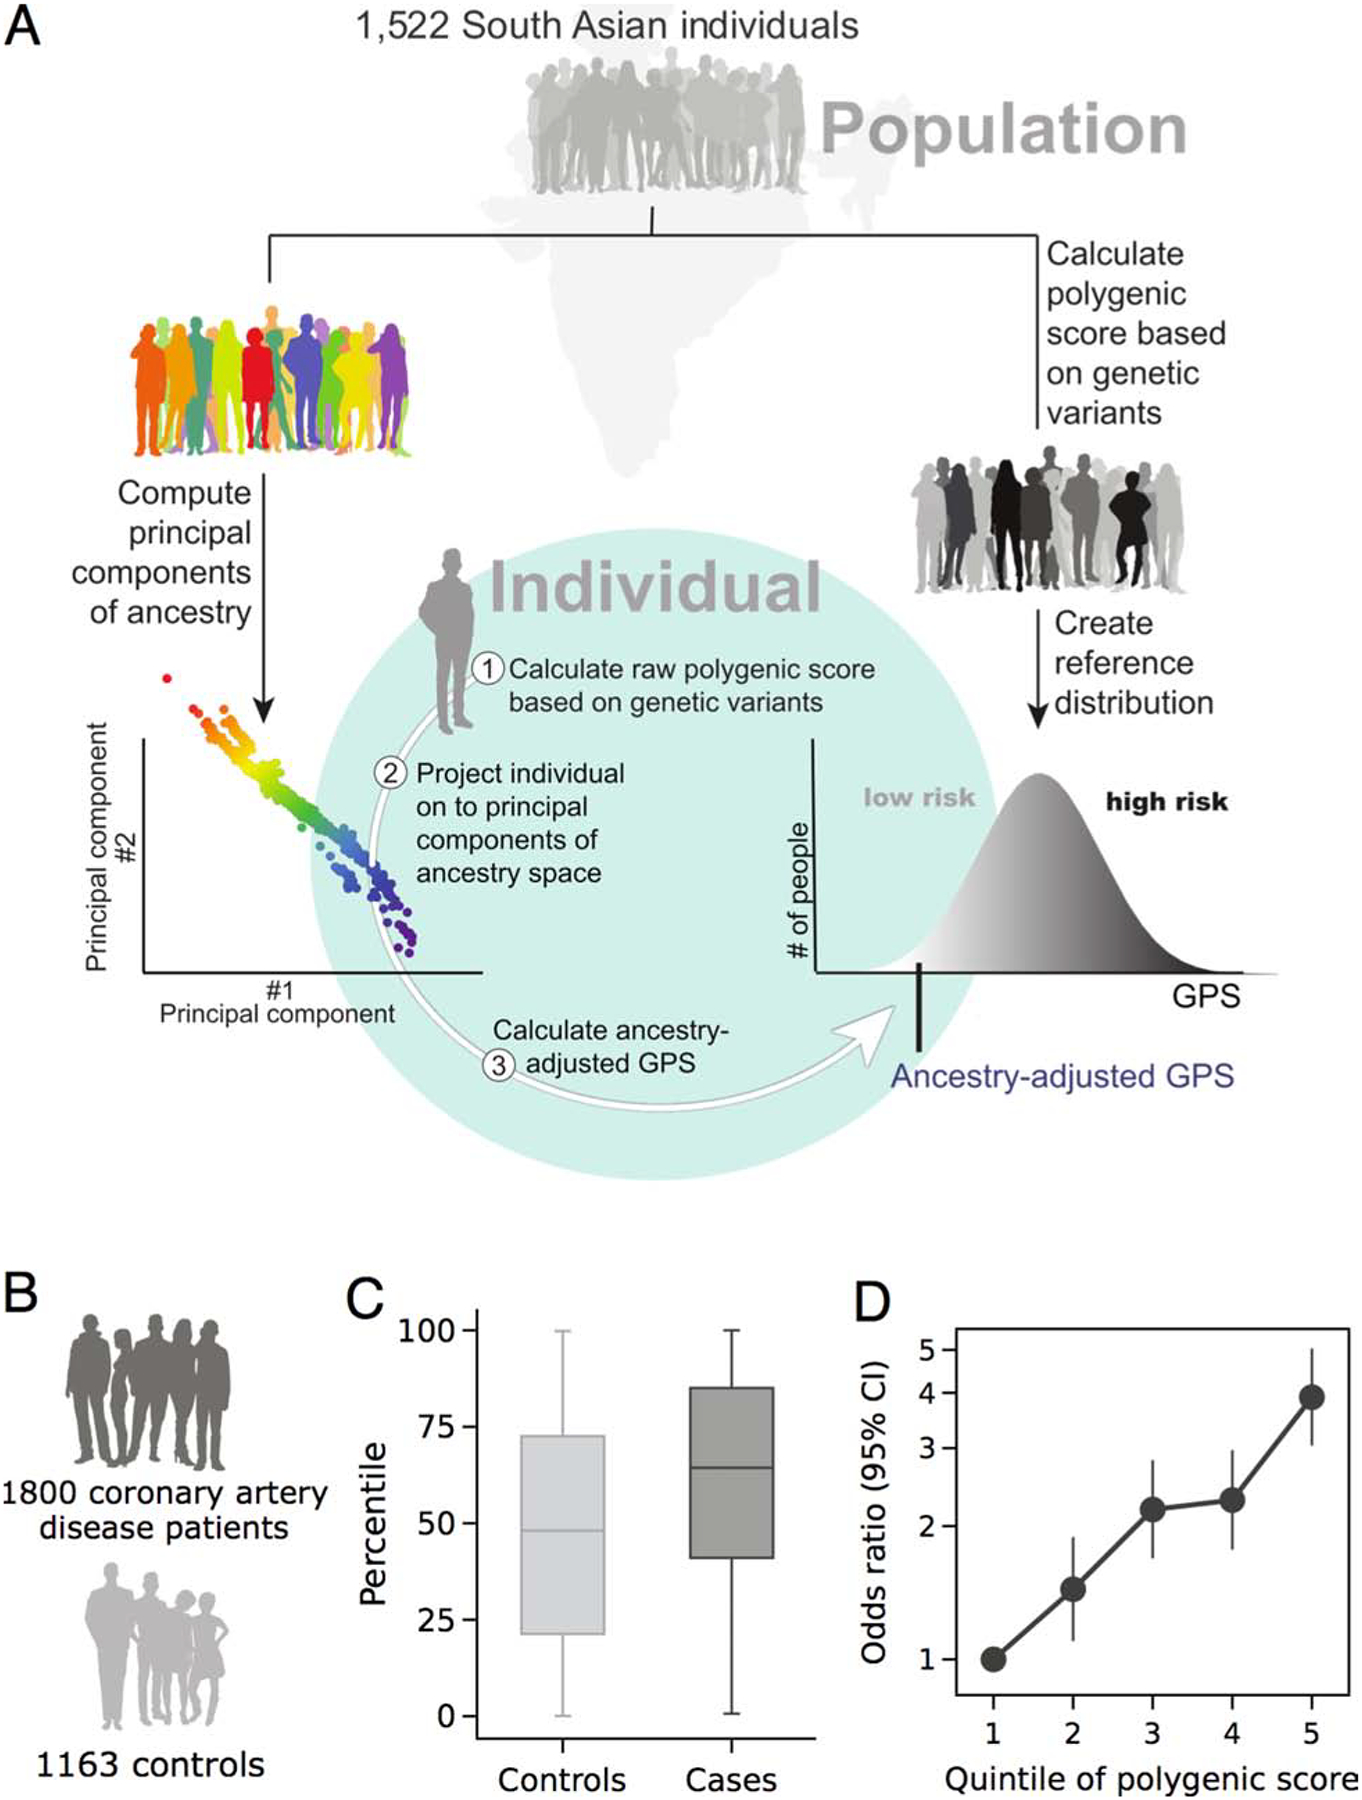
A) We performed whole-genome sequencing in 1,522 individuals from a population-based study in India, recruited without consideration of CAD status (26), to: first, compute quantitative genetic ancestry as assessed by principal components, and second, to derive an ancestry-adjusted genome-wide polygenic score (GPS) reference distribution. With these static reference resources available, subsequently recruited individuals can be projected on to the quantitative ancestry space and an ancestry-adjusted GPS calculated. The ancestry-adjusted GPS was the raw GPS adjusted by the first 5 principal components of ancestry in a linear regression model. This ancestry-adjusted GPS is converted into a percentile rank based on cutoffs derived from the reference distribution. B, C and D) The evaluation of the disease stratification performance of the proposed pipeline by 1,800 cases and 1,163 controls, C) polygenic risk score percentile distribution stratified by coronary artery disease case and control status. D) disease risk across genome-wide polygenic score quintiles, as assessed in a logistic regression model.
Methods
Study populations and quality control
UK Biobank.
The UK Biobank recruited over 500,000 participants aged 40–69 years between 2006 and 2010 (19, 20). In the present analysis, we focused on 8,025 South Asian participants based on self-report of being Pakistani, Indian, or Bangladeshi (19, 20). Self-reported race designations were highly concordant with quantitative estimates of genetic ancestry, as quantified by principal components (Supplemental Figures 1A, 1B and 2A). UK Biobank participants underwent genotyping using an array and subsequent imputation as previously reported (20). After application of genotyping and relatedness quality control parameters (Online Methods), 7,244 individuals remained for analysis. These South Asian individuals were not included in our prior report based on UK Biobank individuals, which was restricted to those of European ancestry (11). CAD ascertainment was based on a composite of myocardial infarction or coronary revascularization present at time of enrolment based on self-report, hospital admission diagnosis codes, or procedure codes coronary revascularization as described previously (Supplemental Appendix) (11).
Bangladesh Risk of Acute Vascular Events study.
We next performed whole-genome sequencing in 500 individuals recruited in Dhaka, Bangladesh, as part of the Bangladesh Risk of Acute Vascular Events (BRAVE) study, a case-control study of first-onset acute myocardial infarction (21). This analysis of newly-generated whole-genome sequencing data has not been included in any prior studies. After application of the participant, variant, and ancestry quality control filters (Supplemental Appendix), 247 CAD cases and 244 controls were available for analysis (Supplemental Figure 1A, 1C and 2B).
Polygenic score derivation, calculation, and testing
To derive a new GPSCAD, we started with summary association statistics from a prior GWAS from the CARDIoGRAMplusC4D Consortium, consisting of 60,801 cases and 123,504 controls (22). Importantly, the majority of the participants in this study were of European ancestry (77%) with a subset of individuals from South Asian ancestry (13%) (22). There was no overlap of participants in this previous GWAS with individuals assessed in the subsequent derivation and testing of the polygenic score involved in the present analysis.
To integrate information from the summary association statistics into a GPSCAD, we applied the LDpred computational algorithm, a Bayesian method that calculates the posterior mean independent effect size of each variant based on the variant’s prior joint effect size estimated from GWAS and the correlation pattern between variants (23). A linkage disequilibrium (LD) reference panel - used to compute the correlations between genetic variants - included 503 European individuals from the 1000 Genomes Project Phase 3 (24). Previous analyses have suggested that this LD reference panel mimic the primary ancestral background of the original GWAS, rather than the target population (23). Consistent with this recommendation, we observed slightly decreased performance when we instead used 489 South Asian samples from the 1000 Genomes Project as the LD reference panel (Supplemental Tables 1–3).
The LDpred computational algorithm includes a tuning parameter ρ, which represents the fraction of variants with non-zero effect size (23), with an optimal value determined by the disease genetic architecture and the sample size used in the GWAS study. Because the parameter ρ is unknown, we tested a range of values for ρ as previously recommended (23).
Polygenic scores were calculated in each individual using the plink2 software package, multiplying the effective allele dosage with its LDpred algorithm adjusted effect size and then summing across all of the variants in each individual (25).
To account for variations in allele frequency according to genetic ancestry, the polygenic score was adjusted according to the first 5 principal components of ancestry using a linear regression model (12), the residuals from the regression model were used as the ancestry-adjusted GPSCAD and normalized to have a mean of 0 and a standard deviation of 1 to facilitate interpretation as performed previously (11) (Central illustration). The best ρ parameter was chosen based on maximal area-under-the-curve (AUC) of the GPSCAD evaluated in a logistic regression model with age, sex, top 5 principal components of ancestry and ancestry adjusted GPS as covariates as performed previously (Supplemental Tables 1 and 2)(11).
Development and testing of an ancestry-specific framework to polygenic score assessment
To build a static and ancestry-specific reference distribution for the GPSCAD, we analyzed high-coverage whole genome sequencing on 1733 individuals from a population-based study in India, recruited without consideration of CAD status as part of phase 2 of the GenomeAsia 100K project (26 and A.S.P., unpublished) (Central illustration). 1,522 individuals remaining following application of quality control criteria.
To provide a set of individuals to test the framework for GPSCAD assessment, a second set of individuals −1,826 CAD cases and 1,209 controls - were recruited from outpatient clinics and hospitals at 5 cities in India -- Kochi, Jaipur, Coimbatore, Chennai and Bangalore. Participants underwent genotyping using the Illumina Global Screening Array Platform, of whom 1,800 CAD cases and 1,163 controls remained after quality control (Supplemental Appendix).
Clinical-grade GPSCAD assessment requires that an identical set of variants are assessed in individuals in both the reference distribution and newly-recruited individuals. We identified 575,778 genetic variants reliably ascertained in both the reference distribution whole-genome sequencing data and the test dataset genotyping array data, and jointly imputed them using the GenomeAsia Pilot (GAsP) project reference panel from the GenomeAsia 100K project (26, 27). This joint imputation with the reference distribution is important in preventing batch effects or artifacts from mixing samples genotyped with sequencing or genotyping array technology.
A static genetic ancestry reference distribution was produced using principal components analysis of the 1,522 individuals using FlashPCA software (28) based on independent genetic markers identified using the plink2 software package with parameters: --indep-pairwise 1000 50 0.2 --maf 0.01 --hwe 1e-10 --geno 0.05 (25, 29). The static polygenic score reference distribution was produced by adjusting the raw polygenic score values for the first 5 principal components of ancestry using a linear regression model as described previously (12) (Central illustration).
Statistical analysis and study approval
Statistical analysis and test were performed using R software, version 3.6.1 (R Project for Statistical Computing). AUC was calculated by the “pROC” R package(30). Category-free net reclassification improvement (31) was estimated by the “nricens” R package (https://cran.fiocruz.br/web/packages/nricens/index.html).
This research has been conducted using the UK Biobank Resource under Application Number 7089. Analysis of the UK Biobank as analysis of UK Biobank and BRAVE data was approved by the Partners HealthCare institutional review board (protocol 2013P001840). Analysis of MedGenome case-control study was approved by institutional review boards at each of the recruitment sites.
Results
Derivation of a genome-wide polygenic score for South Asians
We first generated 8 candidate GPSs for CAD for testing in a South Asian population, combining association statistics from a previously published genome-wide association study (22) and the LDpred computational algorithm (23) (Figure 1). The 8 scores varied in the tuning parameter (ρ) for the reflection of the proportion of variants assumed to be causal (11, 23).
In order to choose among the 8 candidate GPSs, the discriminative capacity of each GPS was tested in 7,244 South Asian participants of the UK Biobank (398 CAD cases and 6,846 controls; Supplemental Figures 1A, 1B, 2A and Online Table 4). Each of the scores was associated with CAD, with area under the receiver-operator curve (AUC) values for a logistic regression model including GPSCAD, age, sex and top 5 principal components of ancestry as covariates ranging from 0.796 to 0.805, and odds ratios per standard deviation (OR/SD) increment in the GPSCAD ranging from 1.38 to 1.58 (Supplemental Tables 1 and 2). The maximally performing score - with the ρ value of 0.003 - was taken forward into subsequent analyses.
This newly developed GPSCAD had improved performance compared to a score our group previously published based on validation and testing in individuals of European ancestry (11), which had OR/SD 1.53 and AUC 0.802 when applied to the UK Biobank South Asian participants (Supplemental Table 5).
When using our new South Asian GPSCAD as a predictor of CAD in South Asian UK Biobank participants, the median GPSCAD was in the 66th percentile for CAD cases and in the 49th percentile for controls, OR/SD was 1.58 (95% CI 1.42 – 1.76), and a 3.22-fold increase in disease risk was noted in comparing the top versus bottom GPS quintiles (95% CI 2.25 – 4.70), Figure 2A–B and Supplemental Figure 3A.
Figure 2. Genome-wide polygenic risk scores in coronary artery disease cases and controls.
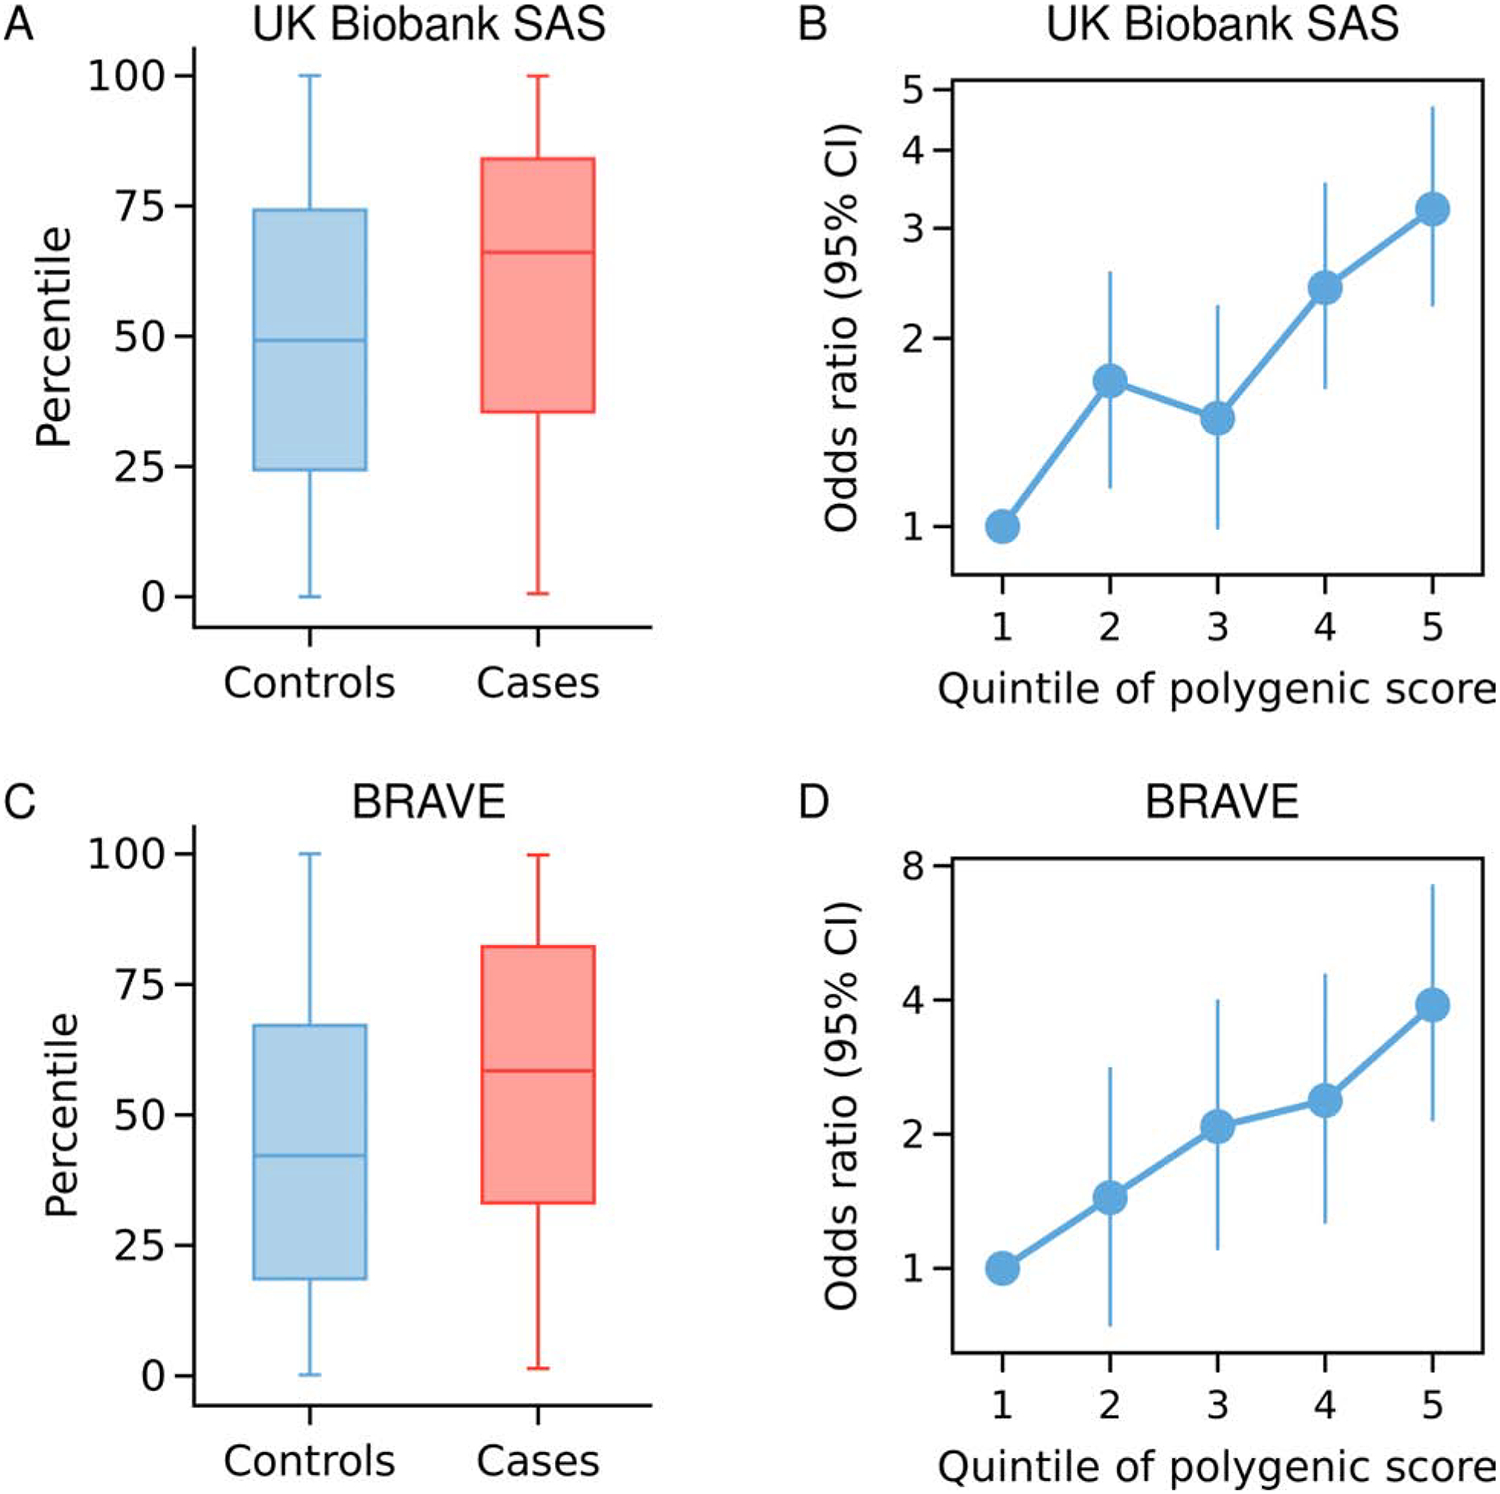
Polygenic risk score percentile distributions in each cohort stratified by CAD case and control status (A, C). Disease risk across GPSCAD quintiles, as assessed in a logistic regression model (B, D). The quintile bin boundary was estimated from the distribution of control samples within each cohort (B, D). BRAVE, the Bangladesh Risk of Acute Vascular Events study.
In order to assess the clinical importance of a high GPSCAD, we next compared the risk of progressively more extreme cut-points of the polygenic score distribution versus those with a polygenic score in the middle quintile. Those in the top quintile of the GPSCAD distribution had 2.16 (95% CI 1.56 – 3.03) increased odds of CAD versus those in the middle quintile, with a risk estimate that continued to increase when modeled as the top 5% (OR 4.16, 95% CI 2.75 – 6.28) or the top 2.5% (OR 5.56, 95% CI 3.40 – 8.98) (Figure 3).
Figure 3. Risk associated with high genome-wide polygenic risk scores for coronary artery disease according to various cutoffs in the UK Biobank and BRAVE studies.
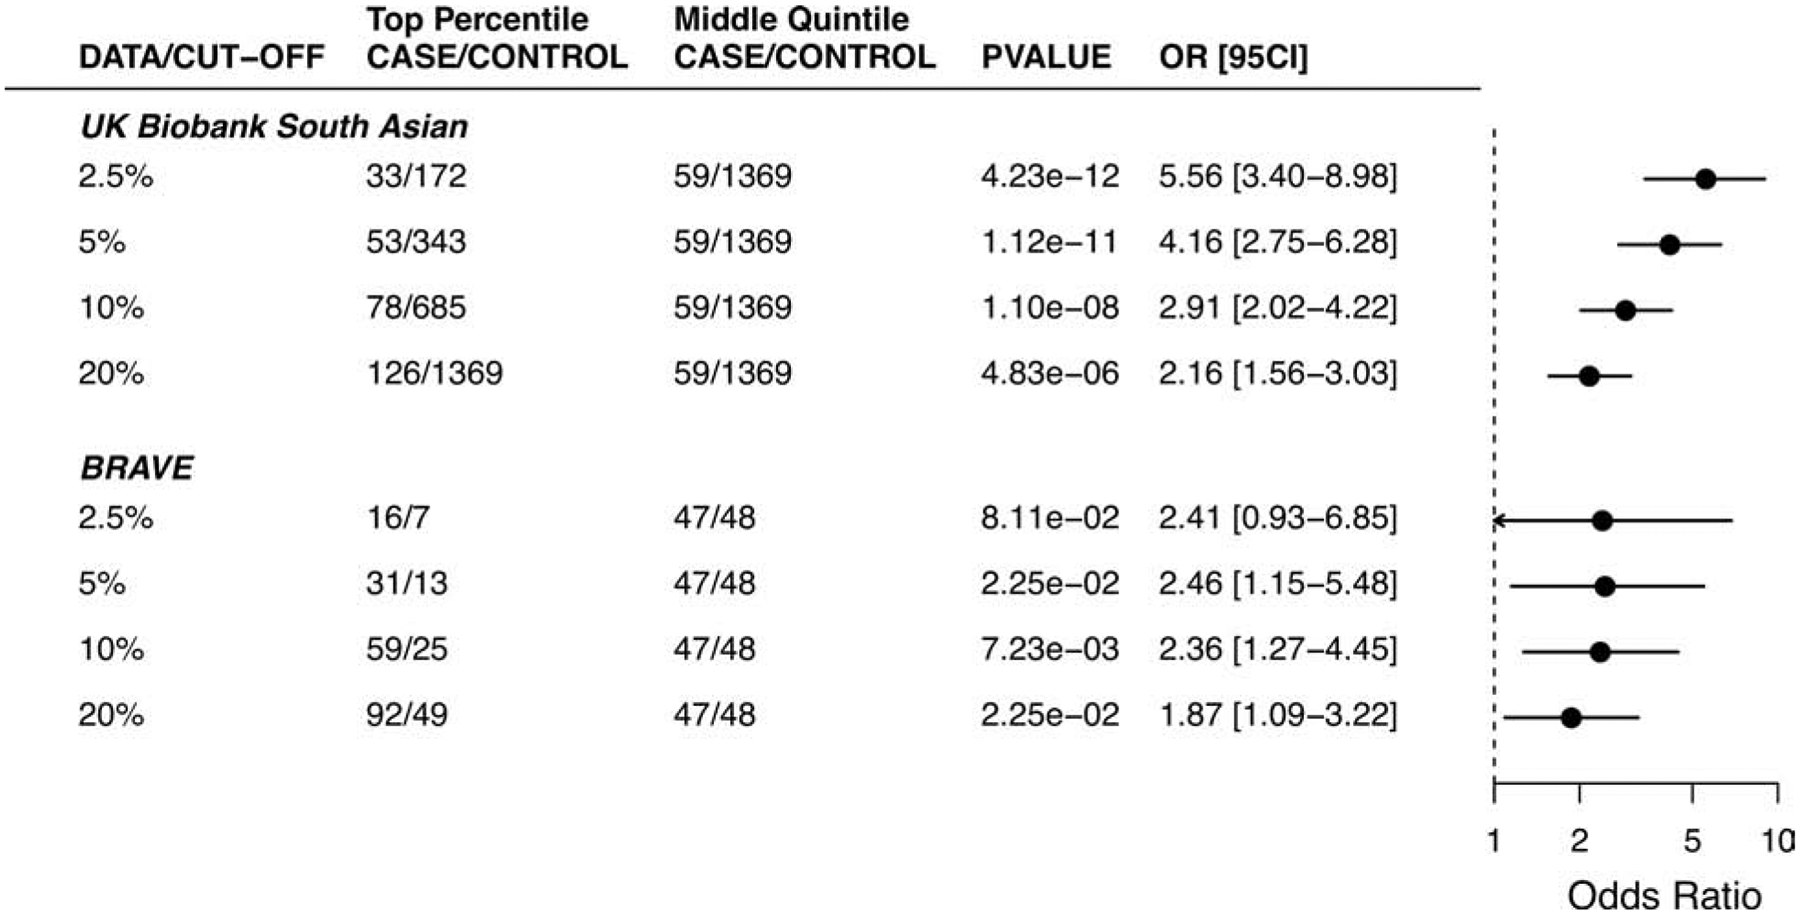
The GPSCAD percentile cut-off was estimated from the score distribution of control samples within each cohort. The number of cases and controls in the top bin was compared to the number of the middle quintile bin. A logistic regression model was used to estimate the odds ratio between GPS subgroups, with age, sex, and genetic ancestry as covariates.
As in previous studies, the risk conferred by a high GPSCAD was largely independent of traditional risk factors(11, 32–34). Within the UK Biobank South Asian dataset, a modest decrement in OR/SD from 1.58 to 1.46 (95% CI 1.29 – 1.65) was noted after additional adjustment for diabetes, hypertension, hypercholesterolemia, family history of heart disease, current smoking, BMI and use of lipid-lowering therapy (Online Table 4). Similarly, odds ratio for the top 5% of the GPS distribution versus the middle quintile decreased from 4.16 to 3.68 (95% CI 2.28 – 5.94) after additional adjustment for these risk factors (Online Table 6). Additional of the GPSCAD to logistic regression models with or without clinical risk factors included was associated with improvements in category-free net reclassification of 38.0% and 33.5% respectively (P < 0.001 for each; Table 1).
Table 1.
Net reclassification parameters based on the addition of the genome-wide polygenic score.
| Baseline Model | ||||||||
|---|---|---|---|---|---|---|---|---|
| Study | Age, sex, principal components of ancestry | Age, sex, principal components of ancestry, and clinical risk factors | ||||||
| DATA | NRI | NRI+ | NRI− | Pvalue | NRI | NRI+ | NRI− | Pvalue |
| GPS validation datasets | ||||||||
| UK Biobank South Asians | 0.3804 | 0.1759 | 0.2045 | 4.59E-11 | 0.3345 | 0.1383 | 0.1962 | 2.76E-06 |
| GPS Testing datasets | ||||||||
| BRAVE | 0.3546 | 0.1579 | 0.1967 | 5.75E-05 | 0.3271 | 0.1404 | 0.1867 | 3.93E-03 |
| MedGenome | 0.3539 | 0.1862 | 0.1677 | 1.48E-22 | 0.3218 | 0.166 | 0.1558 | 7.42E-12 |
The category-free net reclassification improvement was calculated by additionally adding genome-wide polygenic score to a baseline logistic regression model of age, sex and top 5 principal components of ancestry as predictors or age, sex, top 5 principal components of ancestry and clinical risk factors as predictors. The risk factors adjusted were listed in Online Table 4, 7 and 8.
Testing the South Asian genome-wide polygenic score in a Bangladeshi study
To test this score in an independent dataset, we studied the performance of the South Asian GPS in 247 cases and 244 controls of the BRAVE study of first-ever myocardial infarction in Bangladesh (Supplemental Figure 1A, 1C and 2B). Cases had median age of 34 years, reflective of selection based on premature disease onset, and 91% were male. Controls similarly had median age of 33 years and 90% were male (Online Table 7). The GPS was associated with an OR/SD increment of 1.60 (95% CI 1.32 – 1.94), evaluated in a logistic regression model adjusted for age, sex, and top 5 PCs. Moreover, the median GPS was in the 58th percentile among CAD cases and in the 42nd percentile in controls, and a 3.90-fold increase in disease risk was noted in comparing the top versus bottom GPS quintiles (95% CI 2.14 – 7.26), Figure 2C–D and Supplemental Figure 3B. As in prior studies, the risk was substantially increased for those in the extreme tails of the GPS distribution, OR 2.46 (95% CI 1.15 – 5.48; P = 0.02) for those in the top 5% compared to those in the middle quintile, Figure 3. Additional adjustment for diabetes, hypertension, hypercholesterolemia, family history of heart disease, current smoking, and family history of myocardial infarction led to a modest decrement in OR/SD from 1.60 to 1.51 (95% CI 1.22 – 1.88). Consistent with our observations in the UK Biobank study, the GPSCAD led to an improvement in net reclassification of 35.5% and 32.7% for models with and without clinical risk factors respectively (Table 1).
A scalable framework for GPS assessment in South Asian individuals
Encouraged by the strength of association with CAD, we next developed a scalable framework to operationalize GPS assessment. We first analyzed whole-genome sequencing data of 1,522 India individuals from Phase 2 of the GenomeAsia 100K project (26). These data were used in two ways: first, to generate a static ancestry-specific genetic ancestry space; and second, to generate a fixed GPS reference distribution for subsequently recruited individuals seeking GPSCAD (Central illustration).
To generate a static genetic ancestry panel, we quantified the PCs of ancestry in each of the 1,522 individuals and saved the variant loading coefficients. This allows subsequently recruited participants to be ‘projected’ onto this fixed ancestral space. To generate a fixed GPSCAD reference distribution, we computed the South Asian GPSCAD in each of the 1,522 individuals and adjusted the raw GPSCAD values by the first five PCs of ancestry (Central illustration).
Testing of the bioinformatics framework in newly-recruited participants in India
Using the newly-developed GPSCAD and bioinformatics framework, we next studied 1,800 CAD cases and 1,163 control individuals newly-recruited in India as part of a MedGenome study. Median age of cases and controls was 54 and 55 years, and 90% and 76% were male, respectively (Figure 4, Supplemental Figure 1A, 1D and Supplemental Table 8). By projecting each of the CAD cases and controls onto the principal components of ancestry derived from the reference population, we confirmed nearly superimposable distributions of the fixed reference population individuals and the newly-recruited CAD cases and controls (Figure 4).
Figure 4. Principal components of ancestry for individuals recruited as part of the MedGenome study.
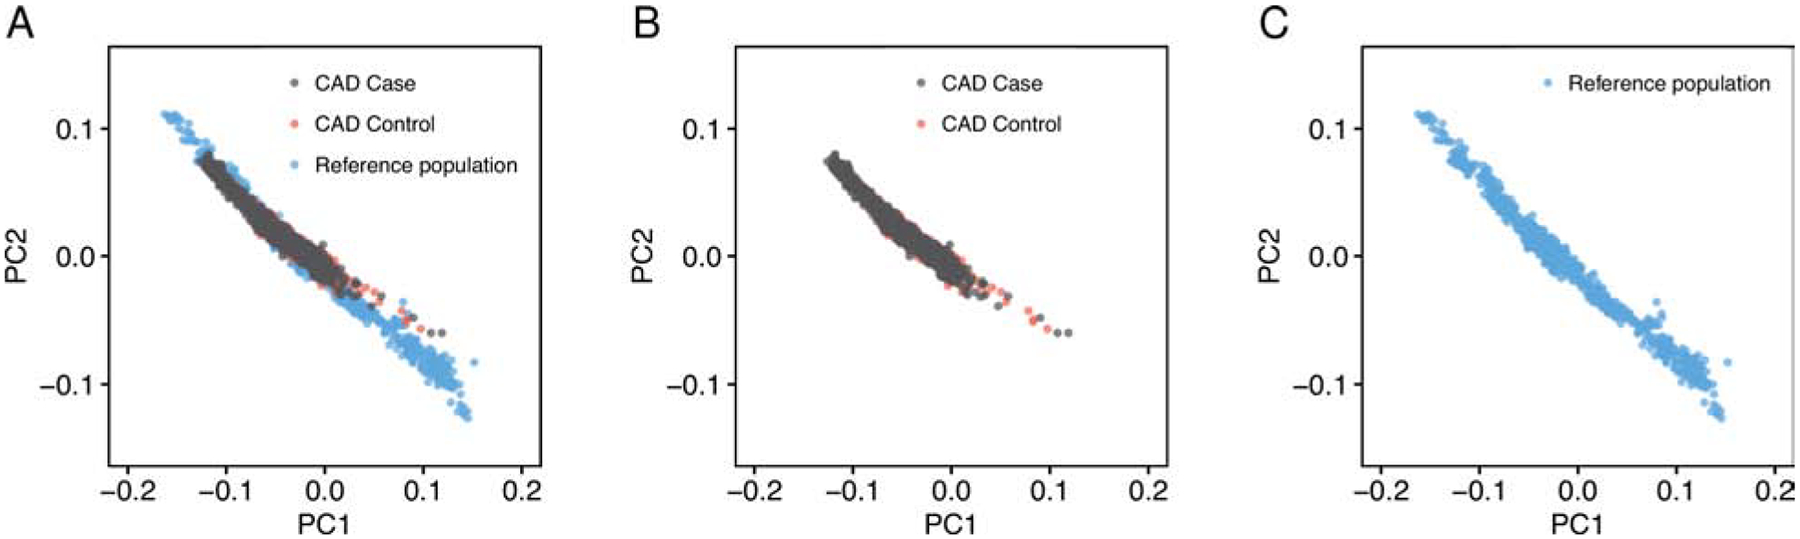
Principal components of ancestry were estimated in 1,522 individuals from Phase 2 of the GenomeAsia project, unascertained for disease status, who underwent whole genome sequencing and served as a static genetic ancestry reference distribution. Subsequently, 1,800 CAD cases and 1,163 controls of the MedGenome cohort were projected onto these static principal components of ancestry space. The first two principal components of ancestry are plotted, with Panel A including all individuals, Panel B only participants of the MedGenome CAD case-control study, and Panel C only the participants of the reference distribution.
We next computed the GPSCAD in each of the participants of the MedGenome case-control study. Consistent with our expectation, median GPS percentile in the controls - who remained free of CAD into middle age - was minimally reduced compared to the reference distribution, in the 48th percentile, Central illustration C. By contrast, the CAD cases had a median GPSCAD in the 64th percentile, Central illustration C and Supplemental Figure 3C.
We studied the relationship of the GPSCAD with CAD in this cohort, noting an OR/SD increment of 1.66 (95% CI 1.53 – 1.81) and 3.91-fold (95% CI 3.04 to 5.04; P = 2.96−10) increase in disease risk comparing the top versus bottom GPS quintiles, Central illustration D. Using the top 5% threshold described above, we observe a 3.22-fold (95% CI 2.23 – 4.74) increased risk when compared to those in the middle quintile, Figure 5. Additional adjustment for diabetes, hypertension, hypercholesterolemia, smoking, and body mass index led to minimal effect attenuation, OR/SD decreased from 1.66 to 1.58 (95% CI 1.42 – 1.75) (Online Table 8). The GPSCAD led to an improvement in net reclassification of 35.4% and 32.2% for models with and without clinical risk factors respectively, Table 1.
Figure 5. Evaluating the performance of the framework for calculating genome-wide polygenic scores.
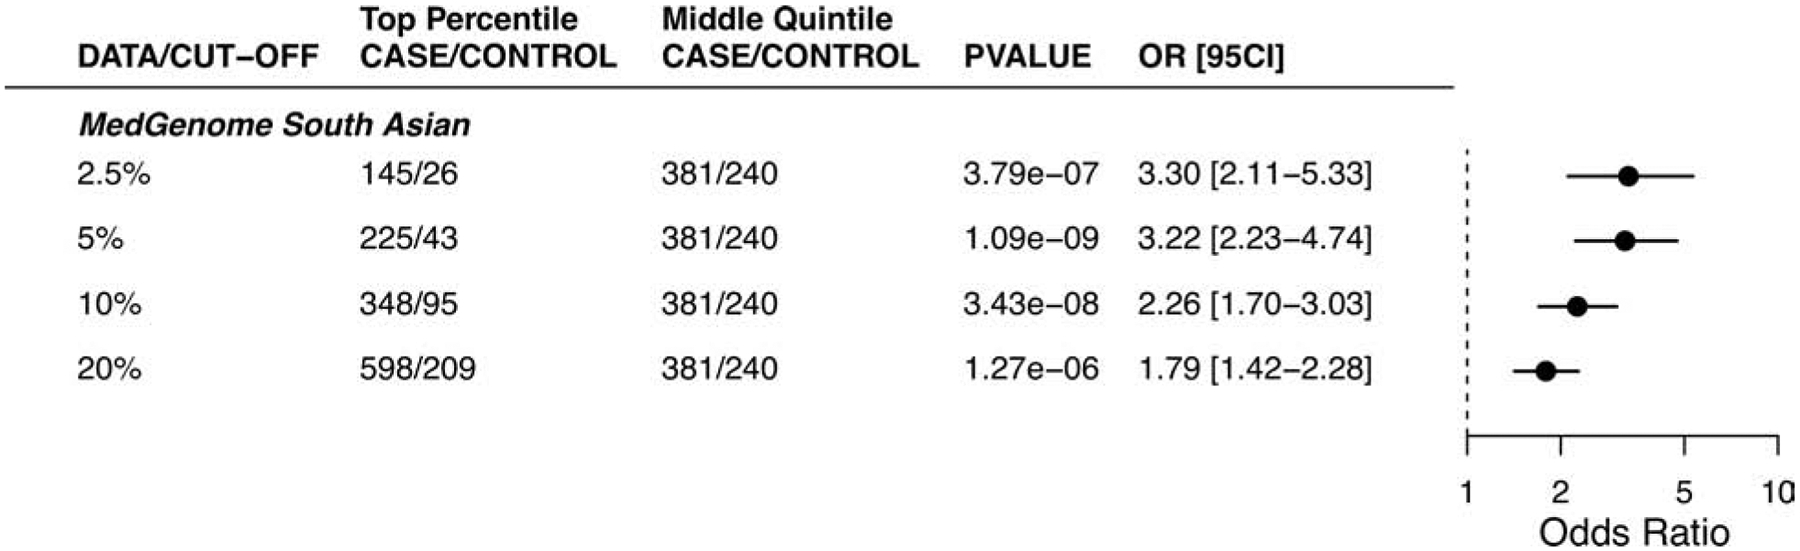
The risk associated with high genome-wide polygenic scores for coronary artery disease according to various cutoffs in the MedGenome evaluation data set, a comparison between samples in the top percentiles to the middle quantile.
Discussion
After deriving a GPSCAD tuned to individuals of South Asian ancestry, our series of analyses confirmed robust associations of this score with CAD in South Asian individuals involved in the UK Biobank and in a separate case-control study based in Bangladesh. Furthermore, we validated a generalizable framework to assess polygenic scores - including the use of an ancestry-specific imputation panel and a static reference distribution - and validated this framework by confirming robust associations of GPSCAD with CAD in an independent study of South Asians based in India.
These results indicate that the cumulative impact of common DNA variants - now possible to quantify using a GPS - is an important driver of risk for CAD, even among individuals of South Asian ancestry. By optimizing a polygenic score for CAD in South Asians, we note a 3.22- to 3.91- fold increase in risk when comparing the highest to lowest quintiles across three independent study samples. Moreover, the pattern of disease associations was strikingly concordant across individuals of South Asian ancestry living in the United Kingdom, Bangladesh, and India, with OR/SD increment ranging from 1.58 to 1.66 across the three studies. These results suggest feasibility for the transfer of polygenic scores across varying environmental exposures.
We note robust associations with CAD in South Asians, despite using summary statistics from a genome-wide association study conducted primarily in individuals of European ancestry − 77% European ancestry and only 13% South Asian ancestry (22). This results observed in our South Asian datasets were broadly comparable but somewhat attenuated when compared to our previous analysis of participants of European ancestry in the UK Biobank, where OR/SD increment was 1.72 as compared to 1.58 to 1.66 observed in the present analysis of South Asian datasets (11). Although we confirm that the newly-derived score outperformed - albeit modestly - our previously published score based on tuning in individuals of European ancestry individuals(11) in all three studies (Online Table 5), the performance of a GPSCAD is likely to improve further if summary statistics from a large genome-wide association study performed specifically in South Asians becomes available for use as input to future GPSs (15, 16, 35).
Beyond validation that the GPSCAD associated with disease in South Asians, we describe a new and generalizable framework necessary for deployment of polygenic score assessment within a clinical workflow. We used high-coverage whole-genome sequencing of 1,522 Indian individuals from the Phase 2 of the GenomeAsia 100K project (26) to generate a fixed and ancestry-matched reference distribution for the GPSCAD. We next recruited an additional 1,800 CAD cases and 1,163 controls and projected them onto the genetic ancestry and GPSCAD reference distribution, confirming expected associations with CAD. Ongoing efforts to generate whole genome sequencing data needed to enhance imputation and genotyping array data needed to develop and validate polygenic in diverse individuals are likely to enable use of this framework in additional ancestry groups in future studies(17, 36–38).
The utility of GPSCAD assessment is likely to be most pronounced among those with extremely high GPSCAD, such as the ~5% of the Indian population cohort that inherited about triple the normal risk on the basis of polygenic variation. These individuals cannot be reliably identified from the remainder of the population without direct access to genotyping data (Online Table 6) (11, 32–34), and is associated with significant improvements in net reclassification indices across all three studies (Table 1). We and others have previously demonstrated that individuals with high polygenic scores derive the greatest benefit from both adherence to a healthy lifestyle as well as pharmacologic interventions - including both statins and PCSK9 inhibitors (39–42). Previous work has suggested that knowledge of a high polygenic score may enhance motivation to initiate or adhere to risk-reducing interventions (43). Successful generalization of this result to South Asians may thus represent an important public health opportunity, particularly given the increased rates of a sedentary lifestyle and reluctance to take medicines frequently encountered in South Asian individuals(1).
These results should be interpreted in the context of several limitations. First, the case-control study design used in the Bangladeshi and Indian studies we analyzed enabled confirmation of relative risk associations but did not allow for calculation of absolute risk of future CAD events. Second, our current efforts focused on CAD. Although this specific disease has particular importance for South Asian individuals, future efforts may allow for an extension of these findings to additional important diseases for this population, including diabetes or central adiposity. Third, additional evidence is needed to confirm that polygenic score disclosure - when integrated into clinical practice in a South Asian population - can improve adherence to a healthy lifestyle or more efficient use of preventive medications. Fourth, our analysis was based on overall genetic ancestry as assessed by principal components. Although this is the current standard, future studies that account for local ancestry - which can vary across chromosomes even in individuals with similar overall genetic ancestry - using new local ancestry inference based approaches may prove useful, especially in populations with recent admixture such as African American or Hispanic individuals (44).
In conclusion, we confirm that a newly-derived GPSCAD for South Asians - which can be calculated from the time of birth - enables striking stratification of disease risk in middle-age. Second, we validate a scalable polygenic score framework in India, laying the scientific and operational foundation for clinical implementation.
Supplementary Material
Clinical Perspectives.
Competency in Medical Knowledge:
A genome-wide polygenic score to identify patients at risk of coronary artery disease integrates information from common DNA variants into a single measure of inherited risk that is available from birth. Because these vary with race and ethnicity, adjustment based on data from ancestry-matched individuals is needed to improve predictive accuracy.
Translational Outlook:
Additional research is needed to improve the transferability of genome-wide polygenic scores across various racial and ethnic groups, and facilitate their integration into clinical practice.
Acknowledgments:
We gratefully acknowledge members of the Broad Institute’s Pattern data visualization team — Mary O’Reilly and Andrew Tang — for assistance in graphic and visual design assistance. We thank the participants who contributed their data in the UK Biobank study, the Bangladesh Risk of Acute Vascular Events (BRAVE) Study and the MedGenome study.
Sources of Funding: Dr. Patel is supported by grant T32HL007208 from the National Heart, Lung, and Blood Institute; Dr. Kathiresan is supported by the Ofer and Shelly Nemirovsky Research Scholar Award from Massachusetts General Hospital and the National Human Genome Research Institute under award number 5UM1HG008895; Dr. Khera is supported by an institutional grant from the Broad Institute of MIT and Harvard (BroadIgnite), award numbers 1K08HG010155 and 5UM1HG008895 from the National Human Genome Research Institute, a Hassenfeld Scholar Award from Massachusetts General Hospital, and a sponsored research agreement from IBM Research.
Abbreviations
- GPS
Genome-wide polygenic score
- CAD
coronary artery disease
- AUC
area under the receiver-operator curve
- CI
Confidence interval
- OR/SD
Odds ratios per standard deviation
- PCs
principal components
Footnotes
Publisher's Disclaimer: This is a PDF file of an unedited manuscript that has been accepted for publication. As a service to our customers we are providing this early version of the manuscript. The manuscript will undergo copyediting, typesetting, and review of the resulting proof before it is published in its final form. Please note that during the production process errors may be discovered which could affect the content, and all legal disclaimers that apply to the journal pertain.
Disclosures: Dr. Kathiresan is an employee of Verve Therapeutics; holds equity in Verve Therapeutics, Maze Therapeutics, Catabasis, and San Therapeutics; has served on scientific advisory boards for Regeneron Genetics Center and Corvidia Therapeutics; has served as a consultant for Acceleron, Eli Lilly, Novartis, Merck, Novo Nordisk, Novo Ventures, Ionis, Alnylam, Aegerion, Haug Partners, Noble Insights, Leerink Partners, Bayer Healthcare, Illumina, Color Genomics, MedGenome, Quest, Pfizer, and Medscape; and has patents related to a method of identifying and treating a person having a pre-disposition to or afflicted with cardiometabolic disease (20180010185) and a genetics risk predictor (20190017119). Dr. Khera has served as a consultant to or received honoraria from Color Genomics, Illumina, Novartis, Maze Therapeutics, and Navitor Pharmaceuticals; has received grant support from the Novartis Institute for Biomedical Research; and has a patent related to a genetic risk predictor (20190017119). Dr. Menon, Dr. Mishra, Dr. Deepak, Dr. Deshmukh, Dr. Mathew, Dr. Apte, Dr. Devanboo, Dr. Sundaram, Dr. Samson, Dr. Murugan, Dr. Santhosh, Dr. Vedam L, Dr. Gupta are employees of MedGenome (Bangalore, India). All other authors have reported that they have no relationships relevant to the contents of this paper to disclose.
References
- 1.Volgman AS, Palaniappan LS, Aggarwal NT, et al. Atherosclerotic Cardiovascular Disease in South Asians in the United States: Epidemiology, Risk Factors, and Treatments: A Scientific Statement From the American Heart Association. Circulation 2018;138 Available at: https://www.ahajournals.org/doi/10.1161/CIR.0000000000000580. Accessed January 26, 2020. [DOI] [PubMed] [Google Scholar]
- 2.Arnett DK, Blumenthal RS, Albert MA, et al. 2019 ACC/AHA Guideline on the Primary Prevention of Cardiovascular Disease A Report of the American College of Cardiology/American Heart Association Task Force on Clinical Practice Guidelines 2019:17. [DOI] [PMC free article] [PubMed] [Google Scholar]
- 3.Grundy SM, Stone NJ, Bailey AL, et al. 2018 Guideline on the Management of Blood Cholesterol. J. Am. Coll. Cardiol 2019;73:e285–e350. [DOI] [PubMed] [Google Scholar]
- 4.Gertler MM. YOUNG CANDIDATES FOR CORONARY HEART DISEASE. J. Am. Med. Assoc 1951;147:621. [DOI] [PubMed] [Google Scholar]
- 5.Marenberg ME, Risch N, Berkman LF, Floderus B, de Faire U. Genetic Susceptibility to Death from Coronary Heart Disease in a Study of Twins. N. Engl. J. Med 1994;330:1041–1046. [DOI] [PubMed] [Google Scholar]
- 6.Nordestgaard BG, Chapman MJ, Humphries SE, et al. Familial hypercholesterolaemia is underdiagnosed and undertreated in the general population: guidance for clinicians to prevent coronary heart disease: Consensus Statement of the European Atherosclerosis Society. Eur. Heart J 2013;34:3478–3490. [DOI] [PMC free article] [PubMed] [Google Scholar]
- 7.Khera AV, Won H-H, Peloso GM, et al. Diagnostic Yield and Clinical Utility of Sequencing Familial Hypercholesterolemia Genes in Patients With Severe Hypercholesterolemia. J. Am. Coll. Cardiol 2016;67:2578–2589. [DOI] [PMC free article] [PubMed] [Google Scholar]
- 8.Abul-Husn NS, Manickam K, Jones LK, et al. Genetic identification of familial hypercholesterolemia within a single U.S. health care system. Science 2016;354:aaf7000. [DOI] [PubMed] [Google Scholar]
- 9.Benn M, Watts GF, Tybjærg-Hansen A, Nordestgaard BG. Mutations causative of familial hypercholesterolaemia: screening of 98 098 individuals from the Copenhagen General Population Study estimated a prevalence of 1 in 217. Eur. Heart J 2016;37:1384–1394. [DOI] [PubMed] [Google Scholar]
- 10.Patel AP, Wang M, Fahed AC, et al. Association of Rare Pathogenic DNA Variants for Familial Hypercholesterolemia, Hereditary Breast and Ovarian Cancer Syndrome, and Lynch Syndrome With Disease Risk in Adults According to Family History. JAMA Netw. Open 2020;3:e203959. [DOI] [PMC free article] [PubMed] [Google Scholar]
- 11.Khera AV, Chaffin M, Aragam KG, et al. Genome-wide polygenic scores for common diseases identify individuals with risk equivalent to monogenic mutations. Nat. Genet 2018;50:1219–1224. [DOI] [PMC free article] [PubMed] [Google Scholar]
- 12.Khera AV, Chaffin M, Zekavat SM, et al. Whole-Genome Sequencing to Characterize Monogenic and Polygenic Contributions in Patients Hospitalized With Early-Onset Myocardial Infarction. Circulation 2019;139:1593–1602. [DOI] [PMC free article] [PubMed] [Google Scholar]
- 13.Inouye M, Abraham G, Nelson CP, et al. Genomic Risk Prediction of Coronary Artery Disease in 480,000 Adults. J. Am. Coll. Cardiol 2018;72:1883–1893. [DOI] [PMC free article] [PubMed] [Google Scholar]
- 14.Sirugo G, Williams SM, Tishkoff SA. The Missing Diversity in Human Genetic Studies. Cell 2019;177:26–31. [DOI] [PMC free article] [PubMed] [Google Scholar]
- 15.Martin AR, Gignoux CR, Walters RK, et al. Human Demographic History Impacts Genetic Risk Prediction across Diverse Populations. Am. J. Hum. Genet 2017;100:635–649. [DOI] [PMC free article] [PubMed] [Google Scholar]
- 16.Martin AR, Kanai M, Kamatani Y, Okada Y, Neale BM, Daly MJ. Clinical use of current polygenic risk scores may exacerbate health disparities. Nat. Genet 2019;51:584–591. [DOI] [PMC free article] [PubMed] [Google Scholar]
- 17.Wojcik GL, Graff M, Nishimura KK, et al. Genetic analyses of diverse populations improves discovery for complex traits. Nature 2019;570:514–518. [DOI] [PMC free article] [PubMed] [Google Scholar]
- 18.Homburger JR, Neben CL, Mishne G, Zhou AY, Kathiresan S, Khera AV. Low coverage whole genome sequencing enables accurate assessment of common variants and calculation of genome-wide polygenic scores. Genome Med 2019;11 Available at: https://genomemedicine.biomedcentral.com/articles/10.1186/s13073-019-0682-2. Accessed January 27, 2020. [DOI] [PMC free article] [PubMed] [Google Scholar]
- 19.Sudlow C, Gallacher J, Allen N, et al. UK Biobank: An Open Access Resource for Identifying the Causes of a Wide Range of Complex Diseases of Middle and Old Age. PLOS Med 2015;12:e1001779. [DOI] [PMC free article] [PubMed] [Google Scholar]
- 20.Bycroft C, Freeman C, Petkova D, et al. The UK Biobank resource with deep phenotyping and genomic data. Nature 2018;562:203–209. [DOI] [PMC free article] [PubMed] [Google Scholar]
- 21.Cardiology Research Group, Chowdhury R, Alam DS, et al. The Bangladesh Risk of Acute Vascular Events (BRAVE) Study: objectives and design. Eur. J. Epidemiol 2015;30:577–587. [DOI] [PMC free article] [PubMed] [Google Scholar]
- 22.the CARDIoGRAMplusC4D Consortium, Nikpay M, Goel A, et al. A comprehensive 1000 Genomes–based genome-wide association meta-analysis of coronary artery disease. Nat. Genet 2015;47:1121–1130. [DOI] [PMC free article] [PubMed] [Google Scholar]
- 23.Vilhjálmsson BJ, Yang J, Finucane HK, et al. Modeling Linkage Disequilibrium Increases Accuracy of Polygenic Risk Scores. Am. J. Hum. Genet 2015;97:576–592. [DOI] [PMC free article] [PubMed] [Google Scholar]
- 24.The 1000 Genomes Project Consortium. A global reference for human genetic variation. Nature 2015;526:68–74. [DOI] [PMC free article] [PubMed] [Google Scholar]
- 25.Chang CC, Chow CC, Tellier LC, Vattikuti S, Purcell SM, Lee JJ. Second-generation PLINK: rising to the challenge of larger and richer datasets. GigaScience 2015;4:7. [DOI] [PMC free article] [PubMed] [Google Scholar]
- 26.GenomeAsia100K Consortium. The GenomeAsia 100K Project enables genetic discoveries across Asia. Nature 2019;576:106–111. [DOI] [PMC free article] [PubMed] [Google Scholar]
- 27.Browning BL, Zhou Y, Browning SR. A One-Penny Imputed Genome from Next-Generation Reference Panels. Am. J. Hum. Genet 2018;103:338–348. [DOI] [PMC free article] [PubMed] [Google Scholar]
- 28.Abraham G, Qiu Y, Inouye M. FlashPCA2: principal component analysis of Biobank-scale genotype datasets Stegle O, editor. Bioinformatics 2017;33:2776–2778. [DOI] [PubMed] [Google Scholar]
- 29.the Haplotype Reference Consortium. A reference panel of 64,976 haplotypes for genotype imputation. Nat. Genet 2016;48:1279–1283. [DOI] [PMC free article] [PubMed] [Google Scholar]
- 30.Robin X, Turck N, Hainard A, et al. pROC: an open-source package for R and S+ to analyze and compare ROC curves. BMC Bioinformatics 2011;12 Available at: https://bmcbioinformatics.biomedcentral.com/articles/10.1186/1471-2105-12-77. Accessed May 21, 2020. [DOI] [PMC free article] [PubMed] [Google Scholar]
- 31.Pencina MJ, D’Agostino RB, Steyerberg EW. Extensions of net reclassification improvement calculations to measure usefulness of new biomarkers. Stat. Med 2011;30:11–21. [DOI] [PMC free article] [PubMed] [Google Scholar]
- 32.Pereira A, Mendonca MI, Borges S, et al. Additional value of a combined genetic risk score to standard cardiovascular stratification. Genet. Mol. Biol 2018;41:766–774. [DOI] [PMC free article] [PubMed] [Google Scholar]
- 33.Natarajan P Polygenic Risk Scoring for Coronary Heart Disease. J. Am. Coll. Cardiol 2018;72:1894–1897. [DOI] [PMC free article] [PubMed] [Google Scholar]
- 34.Torkamani A, Wineinger NE, Topol EJ. The personal and clinical utility of polygenic risk scores. Nat. Rev. Genet 2018;19:581–590. [DOI] [PubMed] [Google Scholar]
- 35.Duncan L, Shen H, Gelaye B, et al. Analysis of polygenic risk score usage and performance in diverse human populations. Nat. Commun 2019;10:3328. [DOI] [PMC free article] [PubMed] [Google Scholar]
- 36.Gurdasani D, Carstensen T, Fatumo S, et al. Uganda Genome Resource Enables Insights into Population History and Genomic Discovery in Africa. Cell 2019;179:984–1002.e36. [DOI] [PMC free article] [PubMed] [Google Scholar]
- 37.Kowalski MH, Qian H, Hou Z, et al. Use of >100,000 NHLBI Trans-Omics for Precision Medicine (TOPMed) Consortium whole genome sequences improves imputation quality and detection of rare variant associations in admixed African and Hispanic/Latino populations Barsh GS, editor. PLOS Genet 2019;15:e1008500. [DOI] [PMC free article] [PubMed] [Google Scholar]
- 38.Taliun D, Harris DN, Kessler MD, et al. Sequencing of 53,831 diverse genomes from the NHLBI TOPMed Program. Genomics; 2019. Available at: http://biorxiv.org/lookup/doi/10.1101/563866. Accessed May 24, 2020. [DOI] [PMC free article] [PubMed] [Google Scholar]
- 39.Khera AV, Emdin CA, Drake I, et al. Genetic Risk, Adherence to a Healthy Lifestyle, and Coronary Disease. N. Engl. J. Med 2016;375:2349–2358. [DOI] [PMC free article] [PubMed] [Google Scholar]
- 40.Natarajan P, Young R, Stitziel NO, et al. Polygenic Risk Score Identifies Subgroup With Higher Burden of Atherosclerosis and Greater Relative Benefit From Statin Therapy in the Primary Prevention Setting. Circulation 2017;135:2091–2101. [DOI] [PMC free article] [PubMed] [Google Scholar]
- 41.Damask A, Steg PG, Schwartz GG, et al. Patients with High Genome-Wide Polygenic Risk Scores for Coronary Artery Disease May Receive Greater Clinical Benefit from Alirocumab Treatment in the Odyssey Outcomes Trial. Circulation 2019:CIRCULATIONAHA.119.044434. [DOI] [PubMed] [Google Scholar]
- 42.Marston NA, Kamanu FK, Nordio F, et al. Predicting Benefit From Evolocumab Therapy in Patients With Atherosclerotic Disease Using a Genetic Risk Score: Results From the FOURIER Trial. Circulation 2019:CIRCULATIONAHA.119.043805. [DOI] [PMC free article] [PubMed] [Google Scholar]
- 43.Kullo IJ, Jouni H, Austin EE, et al. Incorporating a Genetic Risk Score Into Coronary Heart Disease Risk Estimates: Effect on Low-Density Lipoprotein Cholesterol Levels (the MI-GENES Clinical Trial). Circulation 2016;133:1181–1188. [DOI] [PMC free article] [PubMed] [Google Scholar]
- 44.Marnetto D, Pärna K, Läll K, et al. Ancestry deconvolution and partial polygenic score can improve susceptibility predictions in recently admixed individuals. Nat. Commun 2020;11 Available at: http://www.nature.com/articles/s41467-020-15464-w. Accessed April 7, 2020. [DOI] [PMC free article] [PubMed] [Google Scholar]
Associated Data
This section collects any data citations, data availability statements, or supplementary materials included in this article.