Abstract
BACKGROUND:
Checkpoint inhibitors have shown modest activity in patients with advanced hepatocellular carcinoma (HCC). Herein, the authors report a prospective single-institution clinical/translational phase 2 study of pembrolizumab in patients with advanced HCC and circulating biomarkers closely related to response.
METHODS:
Pembrolizumab was administered at a dose of 200 mg intravenously every 3 weeks among patients who may have developed disease progression while receiving, were intolerant of, or refused sorafenib. The circulating levels of cytokines, chemokines, programmed cell death protein 1 (PD-1), programmed death–ligand 1 (PD-L1), and PD-L2 were correlated with response, tumor PD-L1 expression, and other clinicopathological features.
RESULTS:
A total of 29 patients were treated and 28 patients were evaluable for response. The most common laboratory grade 3/4 adverse events were increases in aspartate aminotransferase and/or alanine aminotransferase and serum bilirubin, which for the most part were reversible. In terms of efficacy, one patient achieved a complete response and 8 patients achieved partial responses for an overall response rate of 32%. Four other patients had stable disease. The median progression-free survival was 4.5 months and the median overall survival was 13 months. Response did not correlate with prior sorafenib therapy, PD-L1 tumor staining, or a prior history of hepatitis. Correlative studies revealed that high baseline plasma TGF-β levels (≥200 pg/mL) significantly correlated with poor treatment outcomes after pembrolizumab. Tumor PD-L1 and plasma PD-L1/PD-1 levels were associated with plasma IFN-γ or IL-10.
CONCLUSIONS:
Pembrolizumab was found to demonstrate activity in patients with advanced HCC. Toxicity generally was tolerable and reversible. A set of immunological markers in blood plasma as well as PD-L1 staining indicated that baseline TGF-β could be a predictive biomarker for response to pembrolizumab.
Keywords: circulating biomarkers, clinical trial, hepatocellular carcinoma, pembrolizumab, programmed death–ligand 1 (PD-L1) expression, sorafenib
INTRODUCTION
Hepatocellular carcinoma (HCC) remains one of the most common cancers worldwide.1 Its incidence has been increasing in the United States.2 Immunotherapy has shown promising activity in patients with HCC. Tremelimumab, an immunoglobulin (Ig) 2 monoclonal antibody that blocks the binding of CTLA-4, has demonstrated antitumor activity in patients with HCC with chronic hepatitis C virus (HCV).3 Nivolumab, a fully humanized Ig4 monoclonal antibody against programmed cell death protein 1 (PD-1), and pembrolizumab, a potent and highly selective humanized monoclonal antibody of the IgG4/kappa isotype designed to directly block the interaction between PD-1 and its ligands, programmed death–ligand 1 (PD-L1) and PD-L2, were given accelerated approval recently as second-line treatment of patients with HCC who had received prior sorafenib.4
Currently, tumor PD-L1 expression identified by immunohistochemistry (IHC) has been proposed as a biomarker for response to PD-1/PD-L1 blockade in patients with melanoma because patients with high tumor PD-L1 expression had a better outcome.5,6 However, not all PD-L1–positive tumors respond to PD-1/PD-L1 inhibition. In patients with non–small cell lung cancer (NSCLC), the correlation between PD-L1 expression and response to PD-1/PD-L1 blockade is controversial, and tumor PD-L2 expression was suggested as a potential biomarker for predicting response to drugs against PD-1/PD-L1.7 These diverse results may be explained by dynamic or heterogeneous PD-L1 expression, and the availability of tumor specimens for PD-L1 classification. To overcome these disadvantages, the current study examined circulating biomarkers. Proinflammatory cytokines such as IL-1β, IL-6, IL-8, IL-12, IL-18, and IFN-γ have been shown to enhance T-cell response. Antiinflammatory cytokines, such as TGF-β and IL-10, promote T-cell exhaustion and infiltration in tumors.8 Proinflammatory chemokines, such as CCL4, CCL5, and CXCL9, are involved in hepatic fibrosis and HCV infection.9 Among these cytokines/chemokines, IL-10, IFN-γ, and CXCL9 have been reported to upregulate PD-L1 expression in some cancer types.10,11 In the current study, we have presented what to our knowledge is the first phase 2 trial performed strictly in the United States using pembrolizumab in patients with advanced HCC who developed disease progression while receiving, were intolerant of, or refused sorafenib, and correlated tumor response with these circulating biomarkers.
MATERIALS AND METHODS
Study Design and Participants
The current study was a single-institutional trial (ClinicalTrials.gov identifier NCT02658019) that was conducted at the Sylvester Comprehensive Cancer Center at the University of Miami. To be eligible, patients must have had a diagnosis of advanced HCC made based on one of the following criteria: histopathology, elevated serum α-fetoprotein >400 μg/L, and findings on magnetic resonance imaging (MRI) or computed tomography (CT) scans characteristic of HCC or findings on triple-phase MRI or CT scans characteristic of HCC in patients with cirrhosis and tumors measuring ≥1 cm. Patients had to have measurable disease as defined by the Response Evaluation Criteria in Solid Tumors (version 1.1; RECIST v1.1) and radiographic progression on previously treated areas (as defined by RECIST v1.1).
Patients may have developed disease progression while receiving, been intolerant of, or refused sorafenib. Other eligibility criteria included a Child-Pugh score ≤7 points, estimated life expectancy of at least ≥12 weeks, an Eastern Cooperative Oncology Group performance status of 0 or 1, an absolute neutrophil count ≥1.2 × 10⁹/L, a platelet count ≥50 × 109/L, serum bilirubin <2 mg/dL, aspartate aminotransferase (AST) ≤5 times the upper limit of normal (ULN), alanine aminotransferase (ALT) ≤5 times the ULN, serum prothrombin time ≤16 seconds, and serum creatinine ≤1.5 times the ULN or measured or calculated creatinine clearance ≥60 mL/minute. Barcelona Clinic Liver Cancer staging was not required for this trial. Exclusion criteria included active autoimmune disease that required systemic treatment within the past 2 years (ie, with the use of disease modifying agents, corticosteroids, or immunosuppressive drugs); a diagnosis of immunodeficiency or receipt of systemic steroid therapy or any other form of immunosuppressive therapy within 2 years prior to the first dose of study therapy; or prior therapy with an anti–PD-1, anti–PD-L1, or anti–PD-L2 agent. Treatment of active HCV was administered within 60 days of study entry. Untreated HCV-positive patients were eligible. Patients with HCC with evidence of prior hepatitis B virus (HBV) infection had to fulfill the following criteria to be eligible for the study: HBV viral load <100 IU/mL before study enrollment and subjects with active HBV had to be receiving anti-HBV suppression for ≥3 months, throughout treatment, and for at least 6 months after the completion of therapy. The rationale was that the drug potentially could worsen HBV infection. All subjects provided the institutional review board–approved informed consent.
Procedures
Pembrolizumab was administered at a fixed dose of 200 mg intravenously every 3 weeks. CT or MRI scans were performed after every 3 doses (every 9 weeks ± 9 days). RECIST v1.1 was used to assess response. Progression-free survival (PFS) and overall survival (OS) were estimated using the Kaplan-Meier method. The median PFS and median OS were estimated along with the corresponding 95% CIs. Correlative studies included various plasma cytokine and chemokine levels. If available, tumor tissue either at the time of diagnosis or archived tumor was examined for PD-L1 expression using the clone 22C3 (Dako) and histopathological grading. PD-L1 expression >1% was considered as positive. Patients with HBV and/or HCV underwent viral load testing with each treatment. Treatment for active HCV was administered within 60 days of study entry.
Measurements of Plasma Biomarkers by Enzyme-Linked Immunoadsorbent Assay
In a planned exploratory analysis, we sought to analyze several representative circulating biomarkers before treatment and after 60 to 90 days of treatment with pembrolizumab and at the time of tumor response or disease progression. These correlative studies were optional and blood samples from 24 patients at these 2 time points were available for analysis.
Whole blood was collected in a heparinized tube followed by centrifugation at 1000 × g for 30 minutes; plasma was separated and stored at −80°C until analysis. Enzyme-linked immunoadsorbent assay (ELISA) kits for the detection of plasma IL-1β, IL-6, IL-8, IL-12, IL-18, IFN-γ, TGF-β, IL-10, CXCL9, CCL4, CCL5, PD-L1, and PD-L2 were purchased from R&D Systems (Minneapolis, Minnesota). The ELISA kit for plasma PD-1 detection was purchased from BioVision (Milpitas, California).
Statistical Analysis
The primary endpoint was the disease control rate (DCR), defined as the percentage of patients achieving a best overall response of either a complete response (CR), partial response (PR), or stable disease (SD) (maintained for at least 8 weeks). Secondary endpoints included PFS, OS, objective response rate (ORR), duration of response, and toxicity profile of pembrolizumab.
The DCR and ORR were estimated by the percentage of patients achieving these criteria and the corresponding 95% CIs using the exact binomial method.
The Kaplan-Meier method was used to estimate rates of PFS and OS. PFS was measured from the start date of treatment to the date of documented disease progression or death from any cause, whichever occurred first. To the extent possible with 28 patients, the effect of baseline characteristics on PFS and OS was examined using Cox regression.
Examinations of correlations between clinical response, plasma cytokines, plasma chemokines, plasma PD-1, plasma PD-L1/PD-L2, and other clinicopathological features were performed using the 2-tailed Fisher exact test and the Student t test. Linear correlations between plasma IL-10, plasma IFN-γ, plasma CXCL9, plasma PD-L1/PD-L2, and plasma PD-1 were based on the Pearson correlation coefficient. To further verify whether plasma TGF-β was a prospective biomarker indicating clinical response to pembrolizumab, 200 pg/mL of plasma TGF-β was determined as a cutoff value and subsequently subjected to Kaplan-Meier analysis for estimating PFS and OS rates. These statistical analyses were performed using GraphPad Prism and SPSS statistical software (version 13.0). A P value <.05 was considered to be statistically significant.
RESULTS
Patients and Toxicity
The patient characteristics are shown in Table 1. Ten patients had adequate tumor tissue available for PD-L1 staining. Toxicity data are shown in Table 2. Treatment-related adverse events (AEs using CTCAE-4 criteria) occurred in 22 of 29 patients (76%). Treatment-related serious AEs occurred in 3 patients (10%). One patient with a prior history of myelodysplastic syndrome developed grade 4 neutropenia and gram-negative bacteremia. The patient eventually died due to aspiration pneumonia. A second patient with myositis developed atrial fibrillation and died with evidence of Legionella and pneumocystis pneumonia. A third patient developed hyperbilirubinemia and bacterial peritonitis. Three other patients initially experienced possible treatment-related serious AEs, including fatigue (1 patient), hemoptysis (1 patient), and increased transaminases (1 patient). However, follow-up scans performed a few days later demonstrated marked tumor progression in liver lesions and lung metastases in 2 patients, respectively. The third patient experienced increases in transaminases with the initiation of radiotherapy to the liver, which resolved to baseline after therapy was completed. Treatment-related AEs of grade 3/4 included arthralgia in 2 patients and rhabdomyolysis in 1 patient. This resolved in 2 patients after treatment with steroids and persisted in another patient leading to the discontinuation of study therapy.
TABLE 1.
Clinicopathologic Features in 29 Patients With HCC
| Patient Characteristics | N = 29 |
|---|---|
| Median age (range), y | 67 (28-89) |
| No. aged >65 y | 22 |
| Female/male sex | 4/25 |
| Race | |
| White | 16 |
| Asian | 1 |
| Hispanic | 10 |
| Black | 2 |
| ECOG performance status | |
| 0 | 15 |
| 1 | 14 |
| Extra hepatic metastases | 21 |
| Vascular invasion | 9 |
| Child-Pugh A | 28 |
| Child-Pugh B | 1 |
| Hepatitis B virus | 5 |
| Hepatitis C virus | 9 |
| AFP >400 μg/L | 9 |
| PD-L1–positive tissue | 4 |
| PD-L1–negative tissue | 6 |
| Failed sorafenib | 4 |
| Intolerant to sorafenib | 6 |
| Refused sorafenib | 19 |
Abbreviations: AFP, α-fetoprotein; ECOG, Eastern Cooperative Oncology Group; HCC, hepatocellular carcinoma; PD-L1, programmed death–ligand 1.
TABLE 2.
Pembrolizumab Toxicity in 29 Patients With HCC
| No. of Patients (%) |
||
|---|---|---|
| Any Grade | Grade 3/4 | |
| Treatment-related SAEs | 3 (10) | 3 (10) |
| AEs leading to discontinuation | 1 (3) | 1 (3) |
| Treatment-related AEs | ||
| Rash | 11 (38) | 1 (3) |
| Pruritus | 2 (7) | |
| Diarrhea | 8 (28) | |
| Appetite decreased | 2 (7) | |
| Fatigue | 11 (38) | 1 (3) |
| Nausea | 4 (14) | |
| Arthralgia | 3 (10) | 2 (7) |
| Fever | 4 (14) | |
| Chills | 1 (3) | |
| Myalgia | 3 (10) | |
| Acute kidney injury | 1 (3) | |
| Ascites | 1 (3) | |
| Abdominal pain | 2 (7) | |
| Abdominal distention | 1 (3) | |
| Psoriasis | 1 (3) | |
| Laboratory Treatment-Related AEs | ||
| AST increase | 8 (28) | 5 (17) |
| ALT increase | 10 (34) | 2 (7) |
| Anemia | 2 (7) | 1 (3) |
| Bilirubin increase | 10 (34) | 2 (7) |
| Neutropenia | 4 (14) | 1 (3) |
| Platelet count decrease | 4 (14) | 2 (7) |
| Rhabdomyolysis | 1 (3) | |
| Creatinine increase | 1 (3) | |
| Hypothyroidism | 4 (14) | |
| WBC decrease | 4 (14) | 1 (3) |
| Atrial fibrillation | 1 (3) | 1 (3) |
| Alkaline phosphatase increase | 1 (3) | |
| CPK increase | 1 (3) | |
| Hyponatremia | 1 (3) | |
| Hyperthyroidism | 3 (10) | |
| Hypoalbuminemia | 2 (7) | |
Abbreviations: AE, adverse event; ALT, alanine aminotransferase; AST, aspartate aminotransferase; CPK, creatine phosphokinase; HCC, hepatocellular carcinoma; SAE, serious adverse event; WBC, white blood cell count.
The most common treatment-related AEs were skin rash, fatigue, and diarrhea, which were usually grade 1/2. The most common laboratory AEs (grade 1/2) were increased AST and/or ALT and serum bilirubin. The most common grade 3/4 laboratory AEs also were increased AST and/or ALT and serum bilirubin. These AEs were treated with high-dose prednisone (1-2 mg/kg/day) and resolved to baseline values, except in one patient with SD who took >12 weeks to return to baseline, leading to drug discontinuation as per protocol.
Clinical Activity
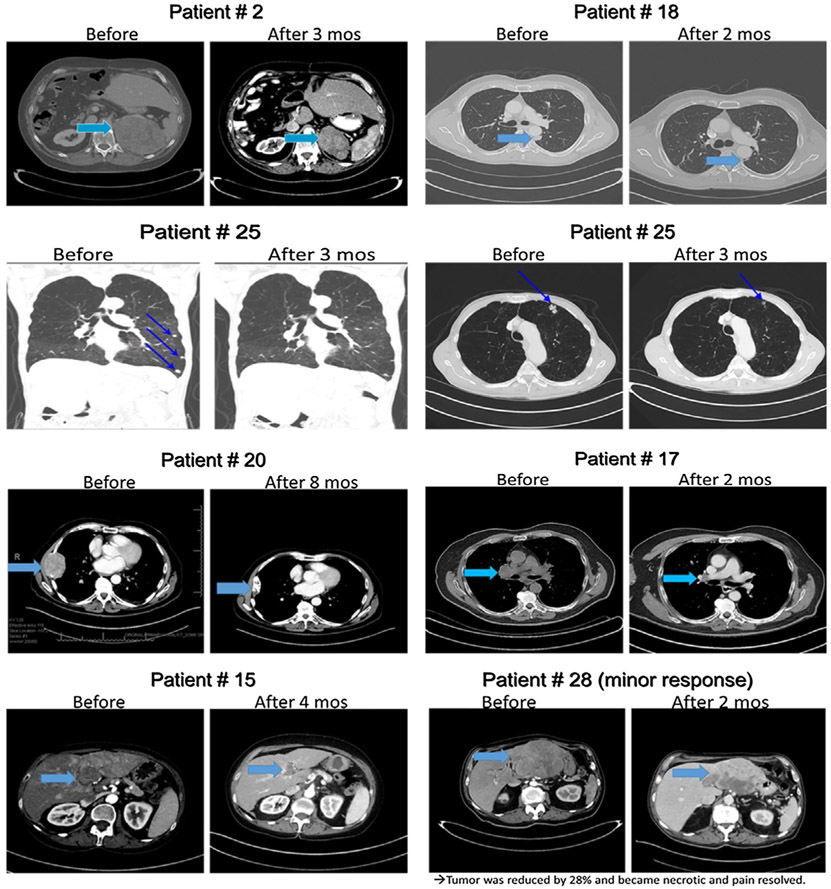
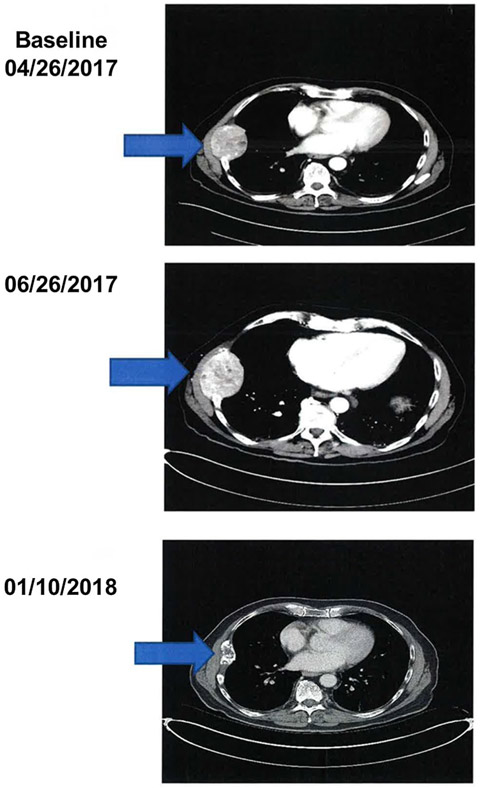
Of the 29 patients who were treated with pembrolizumab, 28 were evaluable for response. One patient received 1 dose of pembrolizumab and 1 week later developed rectal bleeding from HCC invading the colon that required radiotherapy. Because radiotherapy was not allowed during treatment, this patient was considered evaluable for toxicity only. In terms of response among the remaining 28 patients, one patient achieved a CR and 8 patients achieved PRs for an ORR of 32% (95% CI, 15.9-52.4%). Four additional patients had SD, with 3 of these 4 individuals demonstrating evidence of antitumor effect with tumor regression <30% (Fig. 1). The DCR (CR, PR, and SD) was 46%. One patient had a mixed response with the remaining 14 patients demonstrating no response. The duration of response for responding patients was ≥4 months, 7 months, 8 months, ≥8 months, 9 months, ≥12 months, ≥13 months, ≥17 months, and ≥20 months (median duration not achieved). One patient demonstrated pseudoprogression (Fig. 2). This individual had a large chest wall mass measuring 6.5 cm × 5.2 cm, which was biopsied and proven to be HCC. After 2 months of treatment, the mass increased to 7.8 cm × 5.9 cm, and then slowly decreased and 9 months later had decreased to 4.9 cm × 2.2 cm.
Figure 1.
Computed tomography scans demonstrating response to pembrolizumab.
Figure 2.
Computed tomography scans demonstrating pseudoprogression.
The median follow-up was 17 months (95% CI, 8-22 months). The median OS was 13 months (95% CI, 7 months to not estimable), and the median PFS was 4.5 months (95% CI, 2-7 months) (Fig. 3A). At the time of last follow-up, 9 of the 28 patients were alive and still under follow-up, including one patient who completed 2 years of treatment and was being followed off therapy.
Figure 3.
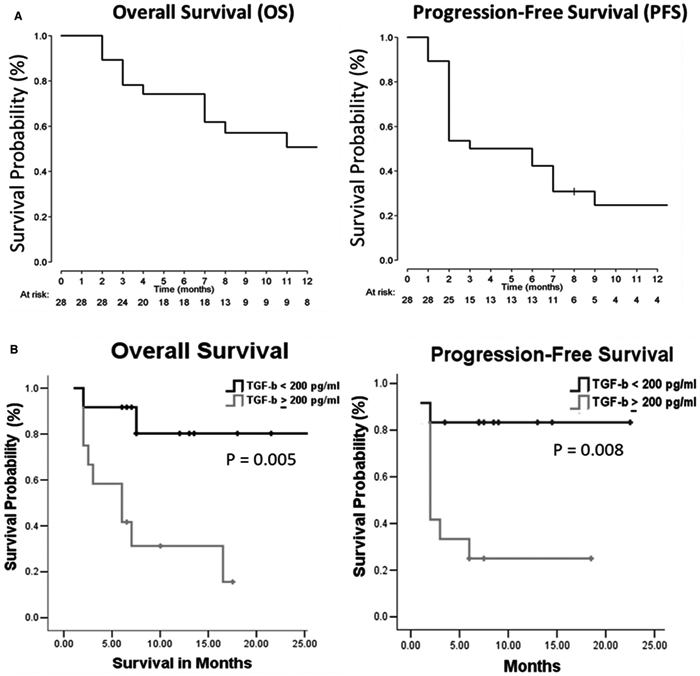
Pembrolizumab benefits both overall survival (OS) and progression-free survival (PFS) rates in patients with hepatocellular carcinoma (HCC) with low baseline levels of TGF-β. (A) OS and PFS rates in patients with HCC receiving pembrolizumab. (B) Twenty-four patients with HCC were divided based on the cutoff value of baseline plasma TGF-β (200 pg/mL).
Responses were observed both in patients who received prior sorafenib and in patients who did not. In 10 patients who had received prior sorafenib, 4 responses were observed. In 18 patients who had received no prior sorafenib, there were 5 responders. There appeared to be no correlation with hepatitis and response to therapy. Of the 3 patients with HBV, 2 achieved a response. Of the 6 evaluable patients with HCV, there was 1 response (another patient was not evaluable for response). Two patients who had both HCV and HBV responded to pembrolizumab. HCV RNA levels were assessed over time in all patients infected with HCV. No virological response was observed. One patient had a rising HCV RNA blood level during treatment that resolved after antiviral therapy. No patient experienced reactivation of HBV or any anti-hepatitis B surface antigen seroconversion. Ten patients had tumor tissues available that were sufficient for PD-L1 staining. Six patients were negative for PD-L1 staining, 2 of whom demonstrated a PR to therapy. Four patients were positive for PD-L1 expression, 1 of whom demonstrated a PR. No obvious correlation was observed between positive PD-L1 IHC and response to treatment, but the number of evaluable patients was limited.
Correlations Between Response to Pembrolizumab, Plasma Biomarkers, and Clinicopathological Features
Correlative studies were performed to investigate the correlation between putative circulating biomarkers and response to pembrolizumab. Of the 29 patients, 24 patients provided plasma samples at baseline and after pembrolizumab treatment up to 60 to 90 days. These patients were divided further into 2 groups: responders (those with CRs, PRs, or SD) and nonresponders. The baseline levels of plasma biomarkers including IL-1β, IL-6, IL-8, IL-12, IL-18, IFN-γ, TGF-β, IL-10, CXCL9, CCL4, CCL5, PD-L1, PD-1, and PD-L2 were detected by ELISA. As shown in Table 3, the mean plasma TGF-β levels in responders were lower than noted in nonresponders (141.9 pg/mL vs 1071.8 pg/mL). There was no statistical significance noted between other biomarkers and clinical response. The cutoff values of these biomarkers were determined based on the near medians (see Supporting Table S1). The plasma concentration of TGF-β ≥ 200 pg/mL was an index of poor response to pembrolizumab (P = .003). Response to pembrolizumab did not correlate with clinicopathological features and other putative biomarkers.
TABLE 3.
Correlations Between Baseline Levels of Plasma Cytokines/Chemokines and Response to Pembrolizumab in 24 Patients With HCC
| Cytokines/ Chemokinesa |
Responders N = 12 |
Nonresponders N = 12 |
P |
|---|---|---|---|
| 1L-1β, pg/mL | 2.42 ± 0.39 | 2.66 ± 0.73 | .777 |
| IL-12, pg/mL | 387.3 ± 49.50 | 417.8 ± 55.64 | .686 |
| IL-18, pg/mL | 102.1 ± 9.48 | 95.85 ± 16.59 | .746 |
| IFN-γ, pg/mL | 150.8 ± 98.28 | 112.6 ± 99.6 | .787 |
| IL-6, pg/mL | 77.9 ± 50.18 | 34.4 ± 7.61 | .400 |
| IL-8, pg/mL | 33.8 ± 12.03 | 44.5 ± 10.11 | .504 |
| IL-10, pg/mL | 56.4 ± 40.56 | 31.9 ± 20.65 | .594 |
| TGF-β, pg/mL | 141.9 ± 60.21 | 1071.8 ± 284.63 | .004 |
| CXCL9, pg/mL | 678.9 ± 186.40 | 485.1 ± 119.09 | .390 |
| CCL4, pg/mL | 68.8 ± 8.63 | 68.2 ± 11.83 | .972 |
| CCL5, pg/mL | 876.1 ± 36.84 | 907.4 ± 49.43 | .617 |
| PD-1, pg/mL | 353.8 ± 191.42 | 192.3 ± 37.00 | .416 |
| PD-L1, pg/mL | 181.6 ± 30.99 | 226.0 ± 63.18 | .534 |
| PD-L2, ng/mL | 6.05 ± 0.51 | 5.45 ± 0.45 | .392 |
Abbreviations: HCC, hepatocellular carcinoma; PD-1, programmed cell death protein 1; PD-L1, programmed death–ligand 1; PD-L2, programmed death–ligand 2.
Cytokine/chemokine levels in plasma were detected using an enzyme-linked immunoadsorbent assay (R&D Systems). The correlation was examined using the 2-tailed Student t test. A P value <.05 was regarded as a significant correlation.
Bold values indicates statistically significant difference.
To examine whether baseline levels of TGF-β in plasma are associated with rates of OS and PFS, clinicopathological features, and other biomarkers, patients were stratified further according to TGF-β concentration (≥200 pg/mL and <200 pg/mL). Kaplan-Meier analysis demonstrated that the median OS and PFS in patients with HCC with a TGF-β level ≥200 pg/mL were 7 months (95% CI, 2-12 months) and 2 months (95% CI, 1.3-2.6 months), respectively, and both the median OS and median PFS were >25 months in patients with TGF-β levels <200 pg/mL (Fig. 3B). These results indicated that low levels of baseline plasma TGF-β were significantly associated with improved OS and PFS after treatment with pembrolizumab. Nevertheless, the levels of TGF-β had no correlation with clinicopathological parameters and other putative biomarkers (see Supporting Table S2).
Alterations in Plasma Biomarkers and Correlations Between Their Baseline Levels and Tumor PD-L1 Expression
Tumor PD-L1 is up regulated by CXCL9, IFN-γ, and IL-10, and then interacts with PD-1 to suppress T-cell activation8. PD-L2, a second ligand of PD-1, has been demonstrated to be a predictive biomarker for response to anti–PD-1 antibodies in patients with NSCLC.7 The results of the current study indicated that plasma IFN-γ or IL-10 levels positively correlated with plasma PD-1/PD-L1 levels (P < .05), but no significant linear correlations were observed (Fig. 4, top row). There were no correlations noted between plasma PD-1/PD-L1, PD-L2, and CXCL9. Due to the limited number of tumor samples available, 9 of these 24 patients had tumor PD-L1 scoring (3 PD-L1–positive patients and 6 PD-L1–negative patients) and the findings further correlated with plasma biomarkers. Patients with PD-L1–positive tumors had high levels of plasma IFN-γ or IL-10 (P < .05) (Fig. 5). However, the plasma PD-L1 concentration did not correlate with tumor PD-L1 expression. Altogether, these results suggested that circulating IFN-γ and IL-10 may be implicated in tumor and blood PD-L1 elevation.
Figure 4.
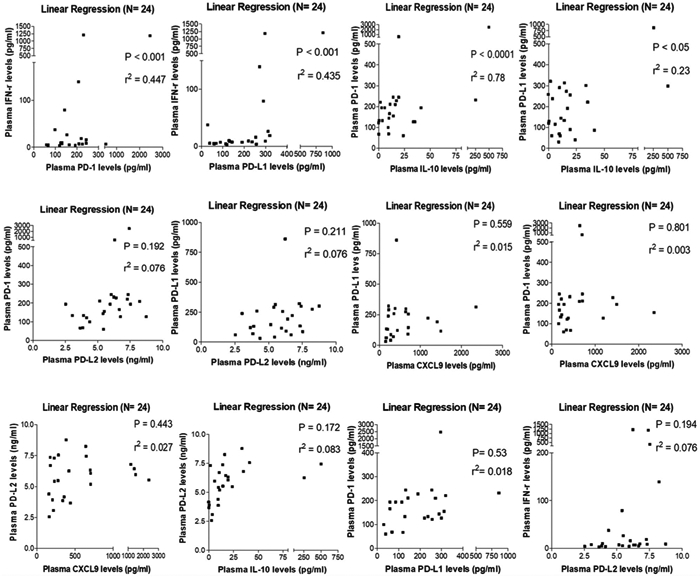
Baseline IFN-γ or IL-10 levels were found to correlate with plasma programmed cell death protein 1 (PD-1)/programmed death–ligand 1 (PD-L1) levels in patients with hepatocellular carcinoma. Correlations between CXCL9, IFN-γ, IL-10, PD-1, PD-L1, and programmed death–ligand 2 (PD-L2) were analyzed using linear regression. r2 indicates correlation coefficient.
Figure 5.
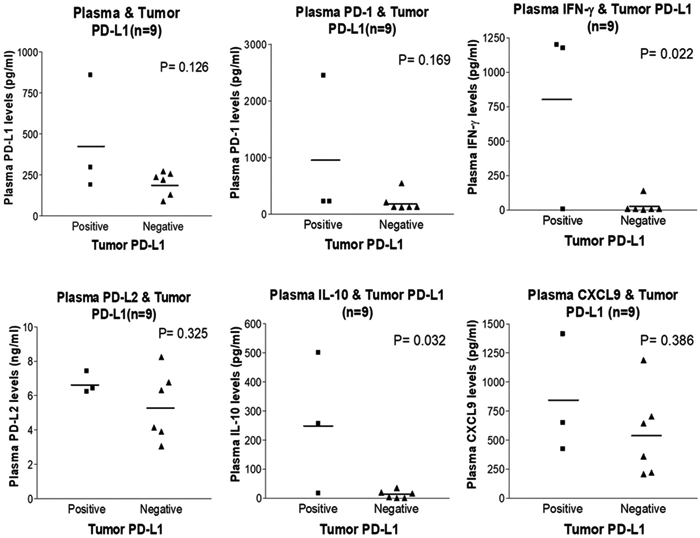
Baseline plasma IFN-γ or IL-10 levels were found to be associated with tumor programmed death–ligand 1 (PD-L1) expression. Correlations between plasma biomarkers and tumor PD-L1 expression in 9 patients with hepatocellular carcinoma were analyzed using the 2-tailed Student t test. PD-1, programmed cell death protein 1; PD-L2, programmed death–ligand 2.
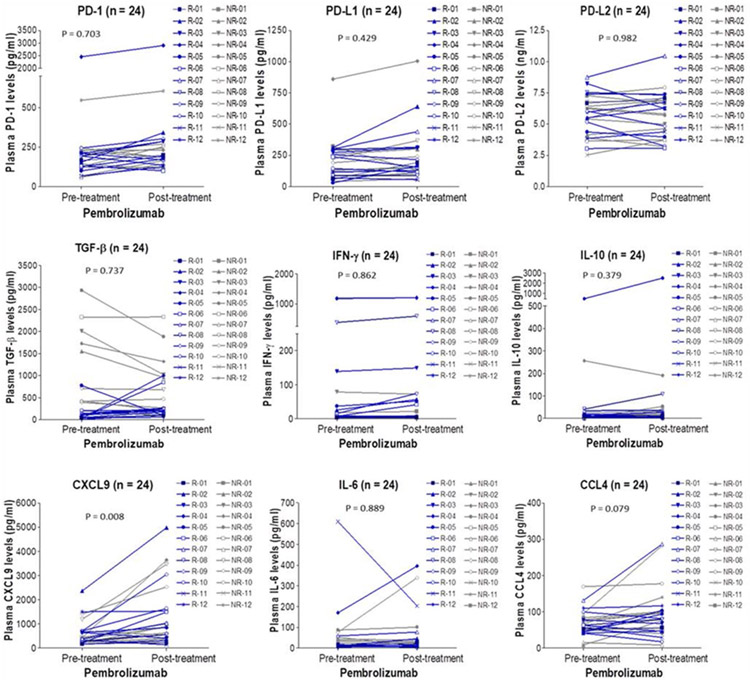
Changes in plasma biomarkers before and after treatment were observed in 24 patients with HCC (Fig. 6). Of these biomarkers, only CXCL9 increased after treatment with pembrolizumab regardless of response status (P = .008). Although it is known that T-helper 1 cells could secrete IFN-γ and thereby induce CXCL9 to enhance recruitment of CD8-positive T cells and natural killer (NK) cells to the local environment,12 unlike plasma CXCL9, IFN-γ did not increase after treatment.
Figure 6.
Alterations in plasma biomarker levels over time in 24 patients with hepatocellular carcinoma. Plasma biomarker levels detected at pretreatment (baseline) and posttreatment (on day 60-day 90) were shown. Blue lines represented responders (R) and gray lines represented nonresponders (NR). PD-1, programmed cell death protein 1; PD-L1, programmed death–ligand 1; PD-L2, programmed death–ligand 2.
DISCUSSION
In this investigator-initiated, phase 2 trial in patients with HCC, pembrolizumab was shown to be active in this disease and the side effects were manageable. This adds to the growing body of evidence demonstrating that patients with advanced HCC can benefit from immune checkpoint inhibitors with durable objective responses.4,13 Both nivolumab and pembrolizumab recently were given accelerated but not full approval for the treatment of HCC.
Despite the response rate and durable responses, the majority of patients with HCC in the current study did not respond to therapy. It appears reasonable to combine other treatments with pembrolizumab to improve response. Radiofrequency ablation has been shown to increase the frequency of tumor-reactive circulating T cells and T cells specific for recall antigens and autologous NK cell response.14,15 A clinical trial of tremelimumab in combination with ablation demonstrated positive clinical activity and an accumulation of intratumoral CD8-positive T cells. Transarterial chemoembolization can induce α-fetoprotein–specific, CD4-positive T-cell responses and combination clinical trials currently are underway.16 Yttrium-90 (Y90) radioembolization can augment the immune activation in patients with HCC with tumor-infiltrating lymphocytes demonstrating signs of local immune activation with higher expression of granzyme B and infiltration of CD8-positive T cells, CD56-positive NK cells, and CD8-positive/CD56-positive NK T cells.17 Peripheral blood samples before and after treatment demonstrated an increase in tumor necrosis factor (TNF)-α on both CD8-positive and CD4-positive T cells.
The results of the current study indicate that pseudoprogression can occur in patients with HCC who are treated with checkpoint inhibitors (Fig. 2). To the best of our knowledge, this was not mentioned in previous studies with nivolumab or pembrolizumab.4,13 This phenomenon first was reported in patients with melanoma who were treated with anti–CTLA-4 antibodies and subsequently treated with anti–PD-1 antibodies.18 It was noted that isolated occurrences of immune response not captured by RECIST have been reported in patients with bladder cancer (1.5%; 1 of 65 patients), renal cell cancer (1.8%; 3 of 168 patients), and NSCLC (unquantified; reported in a study with multiple malignancies).18 The current trial was not performed to include immune-related RECIST for evaluation, but another trial with pembrolizumab found similar percentages of patients achieved an objective response according to immune-related RECIST and modified RECIST criteria.13
One limitation of the current study was that research biopsy was not mandated and archival tissue was used. Because of the limited availability of tumor tissues for PD-L1 identification, the current study sought potential circulating biomarkers. It is interesting to note that baseline plasma TGF-β levels were closely linked with response status (Table 3). Patients with HCC with baseline TGF-β levels <200 pg/mL responded to pembrolizumab as evidenced by high OS and PFS rates (Fig. 3B). Conversely, patients with a baseline TGF-β level ≥200 pg/mL demonstrated reduced response, OS, and PFS. This result supports a study illustrating that TGF-β signaling diminishes tumor response to PD-1/PD-L1 blockade by excluding CD8-positive effector T cells from the tumor parenchyma.19 Furthermore, in a mouse model of urothelial cancer, coadministration of anti–TGF-β antibody and anti–PD-L1 antibody was found to reduce TGF-β signaling in stromal cells and facilitate T-cell infiltration into tumors, resulting in tumor regression. Hence, TGF-β is a potential biomarker for response to PD-1/PD-L1 blockade and may be a crucial contributor leading to attenuated T-cell infiltration in tumors in patients with HCC who do not respond to PD-1/PD-L1 inhibition. A TGF-β receptor I (TGFβRI) kinase inhibitor, galunisertib, has been administered in combination with PD-1/PD-L1 blockade in phase 1/2 clinical trials of patients with refractory solid tumors (eg, NSCLC and HCC) and metastatic pancreatic cancer (ClinicalTrials.gov identifiers NCT02734160 and NCT02734160). There are active clinical trials for patients with solid tumors including HER2/neu-positive breast cancer using a bifunctional fusion protein (M7824) that combines the anti–PD-L1 antibody with the soluble extracellular domain of TGF-β receptor type II as a TGF-β–neutralizing “trap” (ClinicalTrials.gov identifiers NCT02517398, NCT02699515, and NCT03620201). Although these clinical trials still are ongoing and treatment outcome remains unclear, preclinical studies have demonstrated that galunisertib can increase anti–PD-L1 monotherapy-elicited intratumor immune-associated gene expression.20. Murine colon carcinoma and breast cancer models further illustrated that M7824 attenuates tumor burden and enhances OS compared with TGF-β blockade alone, as evidenced by elevated CD8-positive T-cell and NK cell activation.21
In the current study, we did not observe any obvious correlation between PD-L1–positive tumors and response to PD-1/PD-L1 blockade,4,13 yet early results have suggested that PD-L1 expression in immune and tumor cells was associated with response to pembrolizumab in a subset of patients with HCC.13 High levels of IFN-γ, IL-10, and CXCL9 have been reported to correspond to PD-L1 elevation in cancer cells and cells from the lymphoid and endothelial lineages.10,22 Similarly, the results of the current study demonstrated that plasma IFN-γ and IL-10 had a positive correlation with both plasma and tumor PD-L1 (Figs. 4 and 5). In a time-lapse study, plasma CXCL9 levels after treatment were higher than those before treatment in both responders and nonresponders (Fig. 6), which is consistent with the results of another study demonstrating increased serum CXCL9 levels in patients with advanced melanoma after treatment with nivolumab.23. Although CXCL9 that was upregulated by PD-1/PD-L1 blockade was speculated to be driven by IFN-γ in melanoma, the results of the current study demonstrated no correlation between plasma CXCL9 and IFN-γ in patients with HCC as evidenced by no significant change in IFN-γ levels noted before and after treatment. Therefore, the plasma CXCL9 concentration may be altered by other cytokines, including IL-27, which has been reported to regulate CXCL9 expression in patients with hepatitis.24
Pembrolizumab received accelerated approval as a second-line therapy for patients with HCC who developed disease progression while receiving sorafenib based on an international trial with a low percentage of patients from North America (19 of 105 patients).13 The current US-based trial supports pembrolizumab as an active agent with manageable toxicity for patients with advanced/metastatic HCC. The preliminary findings of the current study indicating that baseline TGF-β plasma levels may be a predictor of response are promising and require a larger number of patients in a prospective trial for confirmation.
Supplementary Material
Acknowledgments
FUNDING SUPPORT
Supported by Merck and Company Inc.
Footnotes
CONFLICT OF INTEREST DISCLOSURES
Paul Martin has received research support and acted as a paid consultant for AbbVie, Merck, and Gilead for work performed outside of the current study. The other authors made no disclosures.
Additional supporting information may be found in the online version of this article.
REFERENCES
- 1.Bruix J, Boix L, Sala M, Llovet JM. Focus on hepatocellular carcinoma. Cancer Cell. 2004;5:215–219. [DOI] [PubMed] [Google Scholar]
- 2.Petrick JL, Kelly SP, Altekruse SF, McGlynn KA, Rosenberg PS. Future of hepatocellular carcinoma incidence in the United States forecast through 2030. J Clin Oncol. 2016;34:1787–1794. [DOI] [PMC free article] [PubMed] [Google Scholar]
- 3.Sangro B, Gomez-Martin C, de la Mata M, et al. A clinical trial of CTLA-4 blockade with tremelimumab in patients with hepatocellular carcinoma and chronic hepatitis C. J Hepatol. 2013;59:81–88. [DOI] [PubMed] [Google Scholar]
- 4.El-Khoueiry AB, Sangro B, Yau T, et al. Nivolumab in patients with advanced hepatocellular carcinoma (CheckMate 040): an open-label, non-comparative, phase 1/2 dose escalation and expansion trial. Lancet. 2017;389:2492–2502. [DOI] [PMC free article] [PubMed] [Google Scholar]
- 5.Abdel-Rahman O PD-L1 expression and outcome of advanced melanoma patients treated with anti–PD-1/PD-L1 agents: a meta-analysis. Immunotherapy. 2016;8:1081–1089. [DOI] [PubMed] [Google Scholar]
- 6.Simeone E, Ascierto PA. Anti–PD-1 and PD-L1 antibodies in metastatic melanoma. Melanoma Manag. 2017;4:175–178. [DOI] [PMC free article] [PubMed] [Google Scholar]
- 7.Takamori S, Takada K, Toyokawa G, et al. PD-L2 expression as a potential predictive biomarker for the response to anti–PD-1 drugs in patients with non–small cell lung cancer. Anticancer Res. 2018;38:5897–5901. [DOI] [PubMed] [Google Scholar]
- 8.Yi JS, Cox MA, Zajac AJ. T-cell exhaustion: characteristics, causes and conversion. Immunology. 2010;129:474–481. [DOI] [PMC free article] [PubMed] [Google Scholar]
- 9.Marra F, Tacke F. Roles for chemokines in liver disease. Gastroenterology. 2014;147:577–594.e1. [DOI] [PubMed] [Google Scholar]
- 10.Zhang C, Li Z, Xu L, et al. CXCL9/10/11, a regulator of PD-L1 expression in gastric cancer. BMC Cancer. 2018;18:462. [DOI] [PMC free article] [PubMed] [Google Scholar]
- 11.Sznol M, Chen L. Antagonist antibodies to PD-1 and B7-H1 (PD-L1) in the treatment of advanced human cancer. Clin Cancer Res. 2013;19:1021–1034. [DOI] [PMC free article] [PubMed] [Google Scholar]
- 12.Guirnalda P, Wood L, Goenka R, Crespo J, Paterson Y. Interferon γ–induced intratumoral expression of CXCL9 alters the local distribution of T cells following immunotherapy with Listeria monocytogenes. Oncoimmunology. 2013;2:e25752. [DOI] [PMC free article] [PubMed] [Google Scholar]
- 13.Zhu AX, Finn RS, Edeline J, et al. ; KEYNOTE-224 investigators. Pembrolizumab in patients with advanced hepatocellular carcinoma previously treated with sorafenib (KEYNOTE-224): a non-randomised, open-label phase 2 trial. Lancet Oncol. 2018;19:940–952. [DOI] [PubMed] [Google Scholar]
- 14.Zerbini A, Pilli M, Penna A, et al. Radiofrequency thermal ablation of hepatocellular carcinoma liver nodules can activate and enhance tumor-specific T-cell responses. Cancer Res. 2006;66:1139–1146. [DOI] [PubMed] [Google Scholar]
- 15.Zerbini A, Pilli M, Laccabue D, et al. Radiofrequency thermal ablation for hepatocellular carcinoma stimulates autologous NK-cell response. Gastroenterology. 2010;138:1931–1942. [DOI] [PubMed] [Google Scholar]
- 16.Ayaru L, Pereira SP, Alisa A, et al. Unmasking of alpha-fetoprotein–specific CD4(+) T cell responses in hepatocellular carcinoma patients undergoing embolization. J Immunol. 2007;178:1914–1922. [DOI] [PubMed] [Google Scholar]
- 17.Chew V, Lee YH, Pan L, et al. Immune activation underlies a sustained clinical response to Yttrium-90 radioembolisation in hepatocellular carcinoma. Gut. 2019;68:335–346. [DOI] [PMC free article] [PubMed] [Google Scholar]
- 18.Chiou VL, Burotto M. Pseudoprogression and immune-related response in solid tumors. J Clin Oncol. 2015;33:3541–3543. [DOI] [PMC free article] [PubMed] [Google Scholar]
- 19.Mariathasan S, Turley SJ, Nickles D, et al. TGFβ attenuates tumour response to PD-L1 blockade by contributing to exclusion of T cells. Nature. 2018;554:544–548. [DOI] [PMC free article] [PubMed] [Google Scholar]
- 20.Holmgaard RB, Schaer DA, Li Y, et al. Targeting the TGFβ pathway with galunisertib, a TGFβRI small molecule inhibitor, promotes anti-tumor immunity leading to durable, complete responses, as monotherapy and in combination with checkpoint blockade. J Immunother Cancer. 2018;6:47. [DOI] [PMC free article] [PubMed] [Google Scholar]
- 21.Knudson KM, Hicks KC, Luo X, Chen JQ, Schlom J, Gameiro SR. M7824, a novel bifunctional anti–PD-L1/TGFβ Trap fusion protein, promotes anti-tumor efficacy as monotherapy and in combination with vaccine. Oncoimmunology. 2018;7:e1426519. [DOI] [PMC free article] [PubMed] [Google Scholar]
- 22.Gibbons Johnson RM, Dong H. Functional expression of programmed death–ligand 1 (B7-H1) by immune cells and tumor cells. Front Immunol. 2017;8:961. [DOI] [PMC free article] [PubMed] [Google Scholar]
- 23.Yamazaki N, Kiyohara Y, Uhara H, et al. Cytokine biomarkers to predict antitumor responses to nivolumab suggested in a phase 2 study for advanced melanoma. Cancer Sci. 2017;108:1022–1031. [DOI] [PMC free article] [PubMed] [Google Scholar]
- 24.Basset L, Chevalier S, Danger Y, et al. Interleukin-27 and IFNγ regulate the expression of CXCL9, CXCL10, and CXCL11 in hepatitis. J Mol Med (Berl). 2015;93:1355–1367. [DOI] [PubMed] [Google Scholar]
Associated Data
This section collects any data citations, data availability statements, or supplementary materials included in this article.


