Supplemental Digital Content is available in the text
Keywords: hub gene, KRAS mutant lung adenocarcinoma, prognosis, The Cancer Genome Atlas, Weighted Gene Coexpression Network Analysis
Abstract
The aim of current study was to use Weighted Gene Coexpression Network Analysis (WGCNA) to identify hub genes related to the incidence and prognosis of KRAS mutant (MT) lung adenocarcinoma (LUAD).
We involved 184 stage IIB to IV LUAD samples and 59 normal lung tissue samples from The Cancer Genome Atlas (TCGA) database. The R package “limma” was used to identify differentially expressed genes (DEGs). WGCNA and survival analyses were performed by R packages “WGCNA” and “survival,” respectively. The functional analyses were performed by R package “clusterProfiler” and GSEA software. Network construction and MCODE analysis were performed by Cytoscape_v3.6.1.
Totally 2590 KRAS MT specific DEGs were found between LUAD and normal lung tissues, and 10 WGCNA modules were identified. Functional analysis of the key module showed the ribosome biogenesis related terms were enriched. We observed the expression of 8 genes were positively correlated to the worse survival of KRAS MT LUAD patients, the 7 of them were validated by Kaplan–Meier plotter database (kmplot.com/) (thymosin Beta 10 [TMSB10], ribosomal Protein S16 [RPS16], mitochondrial ribosomal protein L27 [MRPL27], cytochrome c oxidase subunit 6A1 [COX6A1], HCLS1-associated protein X-1 [HAX1], ribosomal protein L38 [RPL38], and ATP Synthase Membrane Subunit DAPIT [ATP5MD]). The GSEA analysis found mTOR and STK33 pathways were upregulated in KRAS MT LUAD (P < .05, false discovery rate [FDR] < 0.25).
In summary, our study firstly used WGCNA to identify hub genes in the development of KRAS MT LUAD. The identified prognostic factors would be potential biomarkers in clinical use. Further molecular studies are required to confirm the mechanism of those genes in KRAS MT LUAD.
1. Introduction
Lung cancer is the leading cause of cancer related deaths worldwide.[1] Non-small-cell lung cancer (NSCLC) accounts for 80% of all lung cancer and is often diagnosed at an advanced stage, which lead to a poor prognosis.[2] The main type of NSCLC is lung adenocarcinoma (LUAD).[3]
The RAS gene family includes KRAS, NRAS, and HRAS, which encodes for plasma membrane-localized transduction proteins with intrinsic GTPase activity. Normally, the intrinsic GTPase activity of RAS proteins is accelerated by GTPase activating proteins (GAPs), which attenuate GTPase signaling by accelerating the conversion of KRAS-GTP bound status to KRAS-GDP bound status. However, the mutation of RAS gene leads to deficiency of GTPase degradation which results in a constitutively KRAS-GTP bound state and in turn actives the downstream pathways to promote cell proliferation.[4] The mutation of RAS gene was found in approximately 30% of human cancers.[5] RAS mutation was observed to promote many types of cancers.[5] RAS mutation is implicated with the cancer development and the resistance to cancer therapies, such as EGFR inhibitors treatment and chemotherapy.[6] KRAS was identified as an outstanding predictive biomarker for LUAD, which generally associated with worse progression-free survival (PFS) and overall survival (OS).[7]
RAS protein is famous for its “undruggable.” No effective direct RAS inhibitor has been approved.[8] In KRAS mutant (KRAS MT) LUAD, many indirect strategies were developed to target the downstream pathways of KRAS such as RAF/MAPK/ERK pathway, PI3K/AKT/mTOR pathway, and RHO-FAK pathway.[9] The KRAS downstream targets remain worth to be discovered. Weighted Gene Coexpression Network Analysis (WGCNA) is a valuable modular biological analysis methodology, which could identify and screen co-expressed gene modules and key biomarkers.[10] The WGCNA is a suitable tool for identifying new hub genes and pathways in the downstream of KRAS pathway. To our best knowledge, this approach has not been applied in KRAS MT LUAD. The aim of our study was to identify novel coexpression gene network modules associated with KRAS MT LUAD by WGCNA, and in turn to find potential signal pathways and genes that involved in the pathogenesis and prognosis of KRAS MT LUAD.
2. Methods
2.1. Data collection
We downloaded our data from The Cancer Genome Atlas (TCGA) database.[11] As the 5-year survival rate dropped sharply in higher stage lung cancer patients,[12] we included 184 stage IIB to IV LUAD samples and 59 normal lung tissue samples with clinical information and RNA-sequencing (RNA-seq) data. The read counts and Fragments per Kilobase Million (FPKM) data were both collected. Ethical approval was not available for the study as our data were revealed from public database.
2.2. Differentially expressed genes (DEGs) screening
The read counts data were used to screen the DEGs between LUAD samples and normal tissues by using R package “limma.” The genes with false discovery rate (FDR) < 0.05 and |log2 fold change (FC)| ≥ 0.585 were selected for further analysis. As shown in Fig. 1, we first screened DEGs between KRAS wild type LUAD or KRAS MT LUAD samples and normal tissues, respectively. Next, we selected KRAS MT specific DEGs by removing the intersect DEGs of these 2 groups in the KRAS MT group. The FPKM data of these genes were further analyzed by WGCNA.
Figure 1.
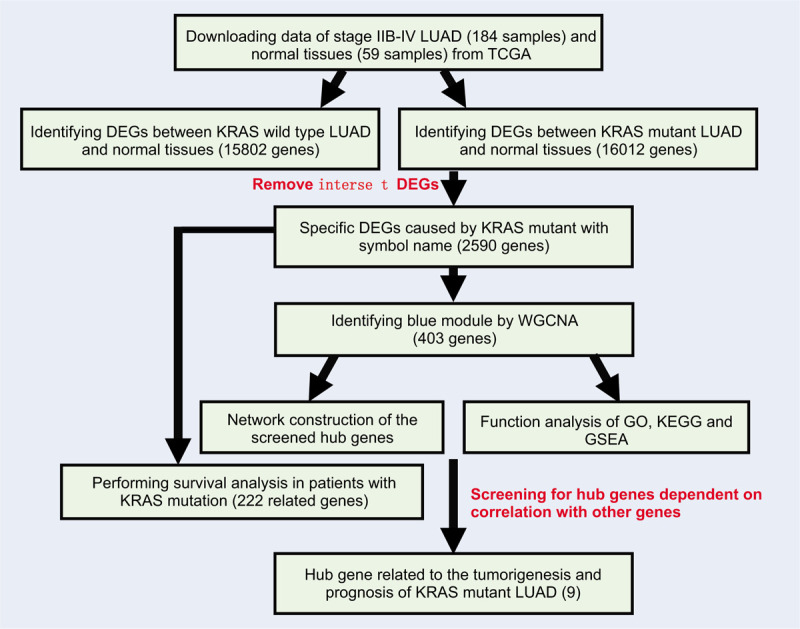
The workflow of current study. Legends: Gene dendrogram was obtained by average linkage hierarchical clustering. The color row underneath the dendrogram indicates module membership.
2.3. Weighted gene coexpression networks construction and module selection
WGCNA was performed by R package “WGCNA.”[10] The KRAS MT LUAD samples (N = 56) and the normal tissue (N = 59) samples were included in the WGCNA analysis. Pearson's correlation matrices were constructed for pair-wise genes. A weighted adjacency matrix of genes using a power function amn = |cmn|β (cmn = Pearson correlation between gene m and gene n; amn = adjacency between gene m and gene n) was built. The β was a softthresholding-power parameter which could strengthen strong correlations and penalize the weak correlation. The best β here was 7, with a scale free R2 = 0.82 (Supplemental Digital Content [Figure S1]). Next, the adjacency was transformed into topological overlap matrix (TOM) to measure the network connectivity of single gene, which was defined as the sum of its adjacency with all other genes for network generation. Then, an average linkage hierarchical clustering was built to find modules with genes of similar expression profile by using the TOM-based dissimilarity measure with a minimum group size of 40 genes for dendrogram.
2.4. Identification of significant modules related to KRAS MT LUAD
The module eigengene (ME) was calculated for representing and summarizing each module. The ME was defined as the first principal component of a given module, which could be representative of the gene expression profile in a module. The correlation between KRAS MT LUAD and MEs was calculated to identify the key module related to KRAS MT LUAD. Gene significance (GS) represents the absolute value of the correlation between a specific gene and the KRAS MT LUAD. Module significance (MS) was defined as the average GS for all genes in a module. The module with the highest MS was considered as the key module related with KRAS MT LUAD.
2.5. Analysis of hub genes in the most significant module
Hub genes are the highly connected nodes with more interaction than other genes in a module. For intramodular analysis, the GS and module membership (MM, which is also known as eigengene-based connectivity kME) were calculated. Genes with higher MM and GS in the key module would be defined as hub genes. Here we selected the hub gene by external traits based |GS| > 0.2 and |MM| > 0.7 with a threshold of P-value <.05. MCODE (molecular complex detection) analysis was performed to select the sub-module, the parameters were set as the follows: degree cut-of = 2, node score cut-of = 0.2, k-core = 2, and max. depth = 100. The hub genes interaction network and MCODE analysis were performed by Cytoscape_v3.6.1.
2.6. Functional enrichment analysis
The functional analysis was performed by Kyoto Encyclopedia of Genes and Genomes (KEGG), Gene Ontology (GO) analyses, and gene set enrichment analysis (GSEA). The KEGG and GO analyses were conducted by R package “clusterProfiler.”[13] The GSEA was performed by the GSEA software from Broad Institute (http://software.broadinstitute.org/gsea/downloads.jsp). The P < .05 and FDR < 0.25 were set as the cut-off criterion.
2.7. Survival analysis of DEGs in KRAS mutation patients
We performed survival analysis of each KRAS MT specific DEGs by using R package “survival.” The patients were divided into 2 groups based on whether its expression was over the median value of all samples. The univariate Cox proportional hazards regression model was used to find survival related genes. The screened survival related genes overlapped with the hub genes of MCODE analysis were considered as hub survival genes. The Kaplan–Meier (KM) method was applied to draw survival curve. Log-rank P-value was calculated for KM plot. The validation of the hub survival genes was performed using the Kaplan–Meier plotter database (KMPLOT) (http://kmplot.com/analysis/).
3. Results
3.1. Screening the mRNA modules
As shown in Fig. 1, we identified 15,802 DEGs between KRAS wild type LUAD and normal lung tissues and 16,012 DEGs between KRAS MT LUAD and normal lung tissues, respectively. After removing the intersect DEGs, we involved 2590 genes into the WGCNA (1606 upregulated genes and 984 downregulated genes in KRAS MT LUAD tissue, Supplemental Digital Content [Table S1]). After WGCNA analysis, we revealed 10 modules (“MEmagenta,” “MEbrown,” “MEpink,” “MEblack,” “MEblue,” “MEturquoise,” “MEyellow,” “MEgreen,” “MEred,” “MEgrey,” Table 1, Supplemental Digital Content [Figure S2]). The heatmap of the correlation between MEs and KRAS MT LUAD showed that module blue had the strongest correlation with KRAS MT LUAD (Fig. 2A). We found module blue also had the highest MS score (Fig. 2B). A scatterplot found GS and MM exhibited a very significant correlation between module blue and KRAS MT LUAD (Fig. 2C, Table 1). Furthermore, hierarchical clustering dendrogram showed the KRAS MT LUAD was highly related to module blue, as evidenced by their low merging height (Fig. 2D). Those results implied that module blue was the key module in the KRAS MT LUAD.
Table 1.
The modules identified from WGCNA for KRAS MT LUAD.
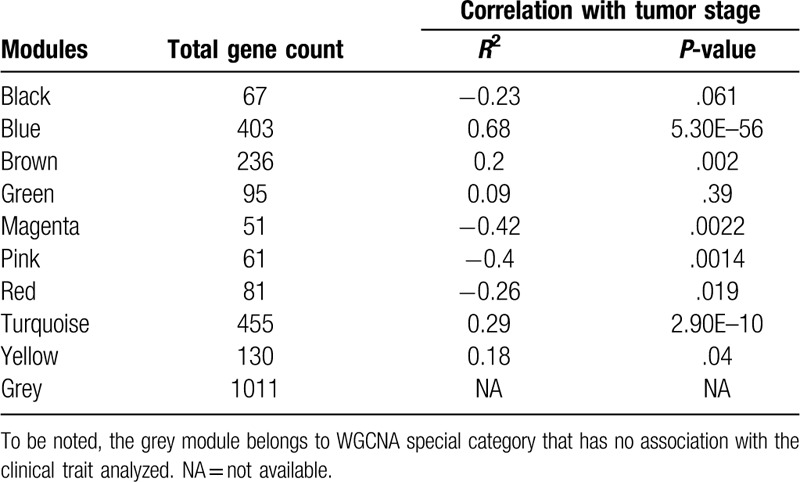
Figure 2.
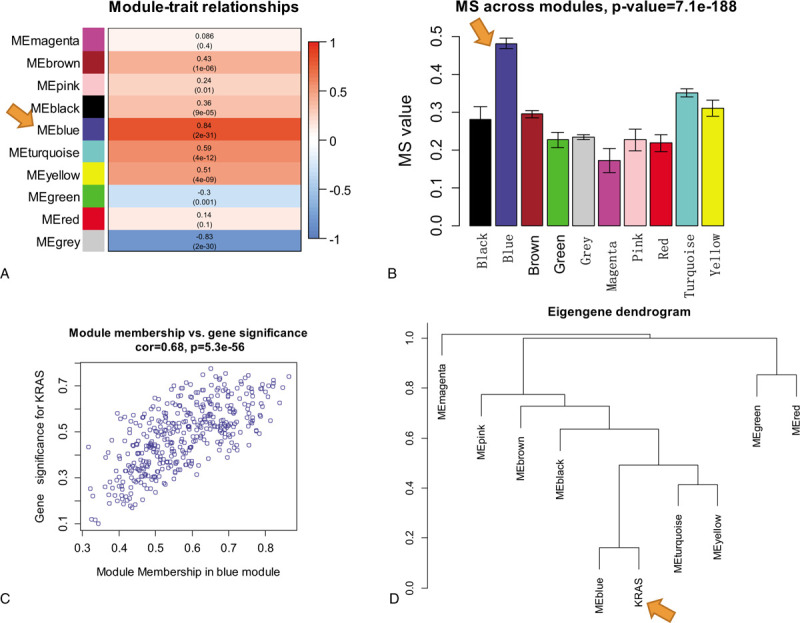
The identification of key module related to KRAS MT LUAD. Legends: A, Heatmap of the correlation between module eigengenes and KRAS MT LUAD; B, MS values of each module associated with KRAS MT LUAD; C, A scatterplot of gene significance for KRAS MT LUAD versus module membership in module blue. GS and MM exhibit a very significant correlation, implying that hub genes of the module blue also tend to be highly correlated with KRAS MT LUAD incidence; D, Hierarchical clustering dendrogram of module eigengenes. The KRAS MT LUAD and module blue eigengenes are highly related, as evidenced by their low merging height. KRAS MT = KRAS mutant, LUAD = lung adenocarcinoma.
3.2. Functional analysis of blue module
Functional analyses were performed for genes in module blue to clarify its biological meaning. GO analysis was applied from 3 aspects: biological process (BP), cellular component (CC), and molecular function (MF). Both the GO and KEGG analyses showed the proportion of genes increased significantly in ribosome and translation terms (Fig. 3, Supplemental Digital Content [Table S2, S3, S4, and S5]). Further GSEA analysis of GO terms showed the ribosome related gene sets were enriched in KRAS MT LUAD tissues (Supplemental Digital Content [Table S6]). Besides, GSEA analysis of oncogenic signatures showed mTOR[14] and STK33[15] pathways were enriched in KRAS MT LUAD tissues (Supplemental Digital Content [Table S7]).
Figure 3.
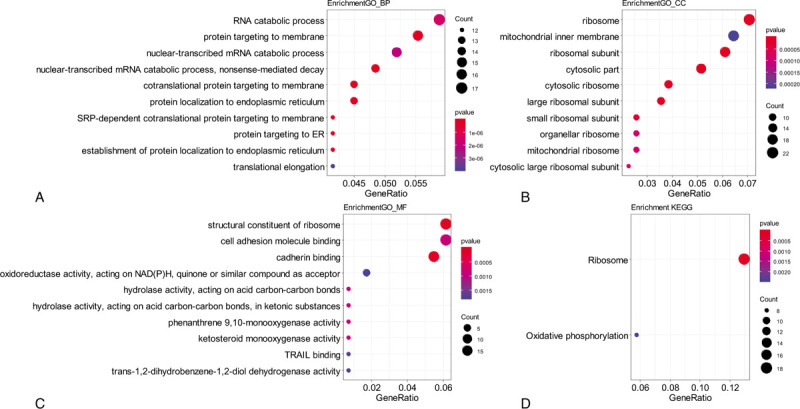
Functional analysis of module blue. Legends: A–C, Gene ontology enrichment analysis for biological process (BP). A, cellular component (CC) B, and molecular function (MF) C, of genes in module blue; D, KEGG pathway enrichment analysis of genes in module blue; The size of the bubble indicated the counts of genes, and the color indicated the P-value. KEGG = Kyoto Encyclopedia of Genes and Genomes.
3.3. Detection of hub gene and their functional annotations
Hub genes selection was performed by the criteria mentioned in method section. There were 64 significant genes with |GS| > 0.2 and |MM| > 0.7. After MCODE analysis, a network of 57 genes was constructed (Supplemental Digital Content [Figure S3], Table 2). Furthermore, as KRAS was identified as a poor prognostic predictor in lung cancer,[16] we performed survival analysis between each gene of the KRAS MT specific DEGs in KRAS MT LUAD patients. There were 222 survival related genes screened (70 genes positively correlated and 152 genes negatively correlated with worse KRAS MT LUAD prognosis, respectively, Supplemental Digital Content [Table S8]). Among them, we found 8 genes, including thymosin Beta 10 (TMSB10), ribosomal protein L26 like 1 (RPL26L1), ribosomal Protein S16 (RPS16), mitochondrial ribosomal protein L27 (MRPL27), cytochrome c oxidase subunit 6A1 (COX6A1), HCLS1-associated protein X-1 (HAX1), ribosomal protein L38 (RPL38), and ATP Synthase Membrane Subunit DAPIT (ATP5MD), were overlapped with the hub genes in MCODE module and were positively correlated with worse prognosis of KRAS MT LUAD (Fig. 4). The expression of these 8 genes were observed to be higher in KRAS MT LUAD tissues (Supplemental Digital Content [Figure S4]). Moreover, the validation of those prognostic genes by KMPLOT showed consistent results except for RPL26L1 (Supplemental Digital Content [Figure S5]).
Table 2.
The hub genes selected after MCODE analysis.
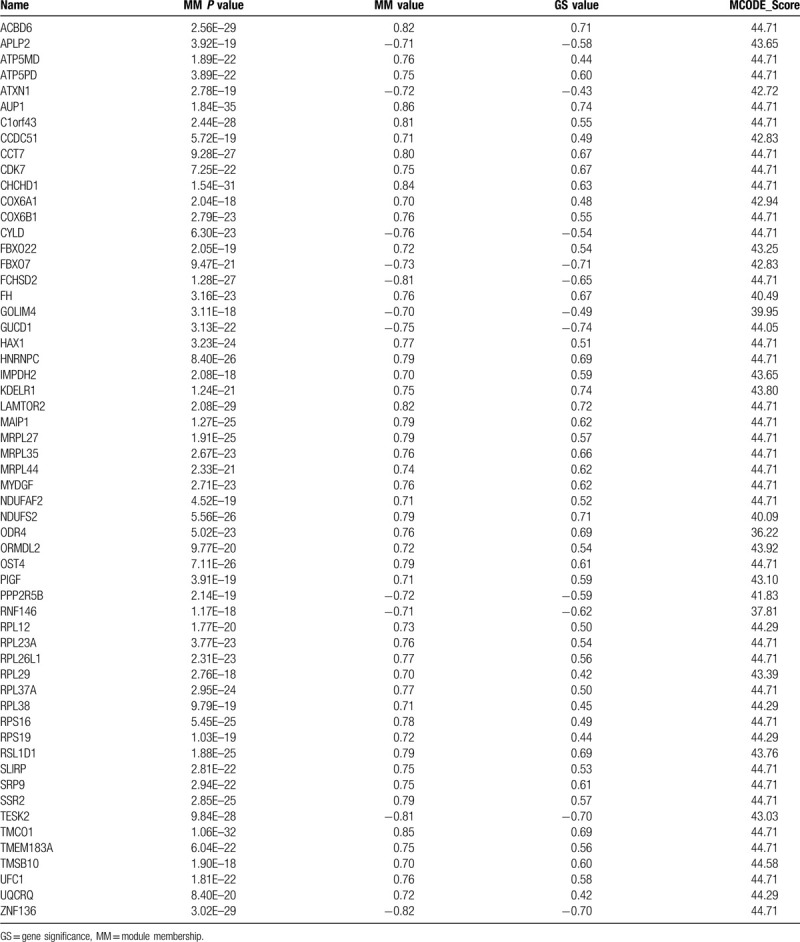
Figure 4.
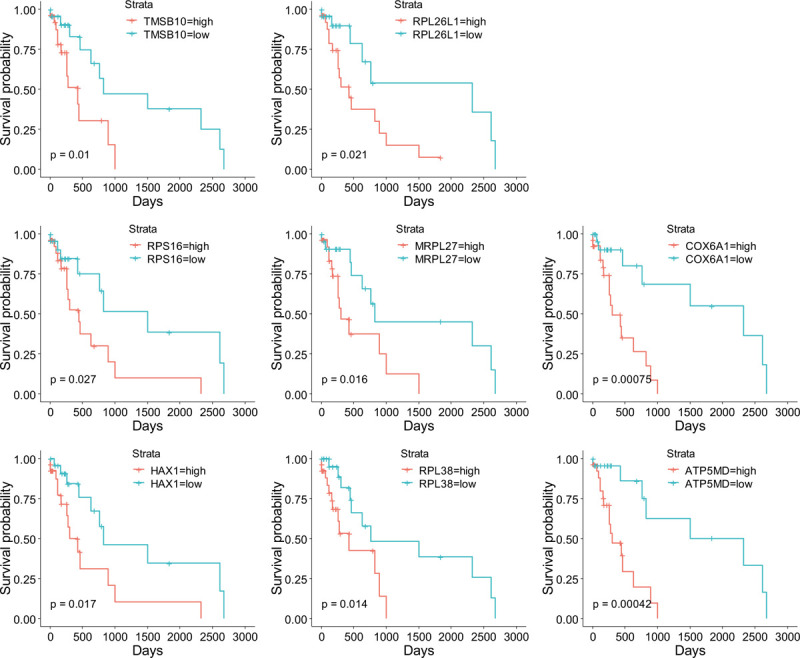
The KM plots of hub genes related to survival of KRAS MT LUAD patients. KM = Kaplan–Meier, KRAS MT = KRAS mutant, LUAD = lung adenocarcinoma.
4. Discussion
The WGCNA is a useful tool to find modules of highly correlated genes. The intramodular hub genes of the key module could be used for the diagnostic and prognostic prediction of disease such as cancer.[17] We performed WGCNA for stage IIB to IV KRAS MT LUAD and normal lung samples using specific DEGs caused by KRAS mutation. The calculation of correlation between coexpression module and KRAS MT LUAD identified module blue as the key module of tumorigenesis of KRAS MT LUAD. Functional analyses found ribosome related terms, mTOR and STK33 pathways were enriched in KRAS MT LUAD. We further determined hub genes in module blue which were related to KRAS MT LUAD. Moreover, there were 8 hub genes correlated with the prognosis of KRAS MT LUAD patients.
The hyperactivation of ribosome biogenesis has a critical role in the initiation and progression of cancers.[18] The alteration of ribosome biogenesis influences the translation of cancer genome. Major cancer related signaling pathways, such as MYC, RAS–MAPK, PI3K–AKT–mTOR, and WNT–β-catenin, were found to be involved in the aberrant activation of mRNA translation at the initiation and elongation steps.[18] Drugs had been discovered to inhibit ribosome biogenesis to offer a viable therapeutic approach for cancer treatment.[19] In our study, ribosome biogenesis related gene sets were found to be upregulated in KRAS MT LUAD tissues. In addition, we also identified ribosome related genes RPS16, RPL26L1, MRPL27, and RPL38 as hub genes and prognostic markers in KRAS MT LUAD. The mRNA expression of those genes were also proved to be upregulated in cancers by previous studies.[20–23] Furthermore, PI3K–AKT–mTOR pathway could cause hyperactivation of RNA polymerase I-dependent transcription and ribosome biogenesis, which would lead to sustain proliferation of cancer cells through the upregulation of global protein synthesis.[24] Our GSEA analysis found mTOR pathway was enriched in KRAS MT LUAD tissues. The current WGCNA study proved new hint to the relationship between ribosome/translation and the LUAD.
Multiple KRAS MT cancer cell lines were found to be sensitive to the suppression of STK33. The STK33 could suppress the mitochondrial apoptosis in KRAS MT cell by Ribosomal protein S6 kinase beta-1 (S6K1)-induced inactivation of the death agonist BAD. The STK33 was identified as a drug target for the treatment of KRAS MT cancer cell.[15] S6K1 is a serine/threonine kinase in the downstream of mTOR pathway. The target substrate of S6K1 is the S6 ribosomal protein.[25] The phosphorylation of S6 ribosomal protein induces protein synthesis at the ribosome, which is consistent with our findings that the mTOR pathway and the ribosome related pathway were upregulated in KRAS MT LUAD.
TMSB10 is a monomeric actin sequestering protein, which is involved in cell motility. The TMSB10 protein was found to be highly expressed in most of the cancer types including the lung cancer.[26] TMSB10 could inhibit the apoptosis and promote the proliferation of lung cancer.[27] However, controversial results also exist in the expression of TMSB10 in lung cancer tissue.[26] Our results showed TMSB10 was upregulated in KRAS MT LUAD tissues and promoted the tumor progression of KRAS MT LUAD patients, which provided new evidence for the relationship between TMSB10 and lung cancer.
HAX1 is located mainly in mitochondria and acts as an anti-apoptosis factor in cells.[28] HAX1 was observed to inhibit the apoptosis of prostate cancer through the suppression of caspase-9 activation.[29] HAX1 also promoted the carcinogenesis of colorectal cancer.[30] HAX1 overexpression was observed in lung cancer.[28] ATP5MD is a component of the Fo subunit of the mitochondrial H+-ATP synthase (F-ATPase)[19] and vacuolar proton pump (V-ATPase).[31] The H+-ATP synthase and F-ATPase were identified to promote cancer progression.[32] ATP5MD is highly expressed in various cancer types.[33] Cytochrome oxidase (COX) activity was identified to be critical for the cell proliferation of lung cancer by favoring metabolic reprograming required for cell proliferation.[34] Overexpression of COX6A1 significantly suppressed Bax- and N-(4-hydroxyphenyl) retinamide (4-HPR)-induced apoptosis in glioblastoma cell. The 4-HPR-induced mitochondrial translocation of Bax, release of mitochondrial cytochrome c, and activation of caspase-3 were attenuated under the overexpression of COX6A1 in cancer cell.[35] Current study identified HAX1, ATP5MD, and COX6A1 as hub genes and prognostic markers of KRAS MT LUAD. Besides, those 3 genes were mitochondrial related, and our GSEA analysis also found the mitochondrial related terms were enriched in KRAS MT LUAD (Supplemental Digital Content [Table S6]).
Our study had potential limitations. First, there was no validation performance of KRAS MT LUAD and normal tissues since the lack of KRAS MT LUAD related studies. Second, the validation of the survival hub genes in KRAS MT LUAD patients by KMPLOT was limited by the fact that there was no KRAS information in this website tool. Nevertheless, our study proved those LUAD prognostic factors might be caused by KRAS mutation.
In conclusion, our study firstly used WGCNA technique to identify KRAS MT LUAD related gene modules. The function analyses found the ribosome related terms were enriched in KRAS MT LUAD. We also identified 8 hub genes whose mRNA expression was correlated with the prognosis of KRAS MT LUAD patients. The 7 of them were validated by KMPLOT (TMSB10, RPS16, MRPL27, COX6A1, HAX1, RPL38, and ATP5MD). Further molecular biological experiments are required to explore the deep mechanism between those genes and KRAS MT LUAD.
Author contributions
Administrative support: Xian Wang.
Collection and assembly of data: Rongkai Shi and Shuting Han.
Conception and design: Dongjun Dai and Xian Wang.
Data analysis and interpretation: Dongjun Dai and Rongkai Shi.
Final approval of manuscript: Dongjun Dai, Rongkai Shi, Shuting Han, Hongchuan Jin, Xian Wang.
Manuscript writing: Dongjun Dai, Rongkai Shi, Shuting Han, Hongchuan Jin, Xian Wang.
Provision of study materials or patients: Rongkai Shi.
Supplementary Material
Supplementary Material
Supplementary Material
Supplementary Material
Supplementary Material
Supplementary Material
Supplementary Material
Supplementary Material
Supplementary Material
Supplementary Material
Supplementary Material
Supplementary Material
Supplementary Material
Footnotes
Abbreviations: 4-HPR = N-(4-hydroxyphenyl) retinamide, COX = Cytochrome oxidase, DEGs = differentially expressed genes, F-ATPase = Fo subunit of the mitochondrial H+-ATP synthase, FDR = false discovery rate, FC = fold change, FPKM = Fragments per Kilobase Million, GAPs = GTPase activating proteins, GO = Gene Ontology, GS = gene significance, GSEA = gene set enrichment analysis, KEGG = Kyoto Encyclopedia of Genes and Genomes (KEGG), KM = Kaplan–Meier, KMPLOT = Kaplan–Meier plotter database, KRAS MT = KRAS mutant, LUAD = lung adenocarcinoma, MCODE = molecular complex detection, ME = module eigengene, MM = Module Membership, MS = module significance, NSCLC = non-small-cell lung cancer, OS = overall survival, PFS = progression-free survival, RNA-seq = RNA-sequencing, TCGA = The Cancer Genome Atlas, TOM = topological overlap matrix, V-ATPase = Vacuolar proton pump, WGCNA = Weighted Gene Coexpression Network Analysis.
How to cite this article: Dai D, Shi R, Han S, Jin H, Wang X. Weighted gene co-expression network analysis identifies hub genes related to KRAS mutant lung adenocarcinoma. Medicine. 2020;99:32(e21478).
This work was supported by National Natural Science Foundation Of China (81502386; 81772944) and Zhejiang Provincial Program for High-level Innovative Healthcare talents.
The authors have no conflicts of interest to disclose.
Supplemental Digital Content is available for this article.
All data generated or analyzed during this study are included in this published article [and its supplementary information files].
References
- [1].Bray F, Ferlay J, Soerjomataram I, et al. Global cancer statistics 2018: GLOBOCAN estimates of incidence and mortality worldwide for 36 cancers in 185 countries. CA Cancer J Clin 2018;68:394–424. [DOI] [PubMed] [Google Scholar]
- [2].Zarogoulidis K, Zarogoulidis P, Darwiche K, et al. Treatment of non-small cell lung cancer (NSCLC). J Thorac Dis 2013;5: suppl: S389–96. [DOI] [PMC free article] [PubMed] [Google Scholar]
- [3].Meza R, Meernik C, Jeon J, et al. Lung cancer incidence trends by gender, race and histology in the United States, 1973-2010. PLoS One 2015;10:e0121323. [DOI] [PMC free article] [PubMed] [Google Scholar]
- [4].Cox AD, Der CJ. Ras history: the saga continues. Small GTPases 2010;1:2–7. [DOI] [PMC free article] [PubMed] [Google Scholar]
- [5].Adjei AA. Blocking oncogenic Ras signaling for cancer therapy. J Natl Cancer Inst 2001;93:1062–74. [DOI] [PubMed] [Google Scholar]
- [6].Mao C, Qiu LX, Liao RY, et al. KRAS mutations and resistance to EGFR-TKIs treatment in patients with non-small cell lung cancer: a meta-analysis of 22 studies. Lung Cancer 2010;69:272–8. [DOI] [PubMed] [Google Scholar]
- [7].Guibert N, Ilie M, Long E, et al. KRAS mutations in lung adenocarcinoma: molecular and epidemiological characteristics, methods for detection, and therapeutic strategy perspectives. Curr Mol Med 2015;15:418–32. [DOI] [PubMed] [Google Scholar]
- [8].Cox AD, Fesik SW, Kimmelman AC, et al. Drugging the undruggable RAS: mission possible? Nat Rev Drug Discov 2014;13:828–51. [DOI] [PMC free article] [PubMed] [Google Scholar]
- [9].Roman M, Baraibar I, Lopez I, et al. KRAS oncogene in non-small cell lung cancer: clinical perspectives on the treatment of an old target. Mol Cancer 2018;17:33. [DOI] [PMC free article] [PubMed] [Google Scholar]
- [10].Langfelder P, Horvath S. WGCNA: an R package for weighted correlation network analysis. BMC Bioinformatics 2008;9:559. [DOI] [PMC free article] [PubMed] [Google Scholar]
- [11].Cancer Genome Atlas Research N, Weinstein JN, Collisson EA, et al. The Cancer Genome Atlas Pan-Cancer analysis project. Nat Genet 2013;45:1113–20. [DOI] [PMC free article] [PubMed] [Google Scholar]
- [12].Siegel RL, Miller KD, Jemal A. Cancer statistics, 2018. CA Cancer J Clin 2018;68:7–30. [DOI] [PubMed] [Google Scholar]
- [13].Yu G, Wang LG, Han Y, et al. clusterProfiler: an R package for comparing biological themes among gene clusters. OMICS 2012;16:284–7. [DOI] [PMC free article] [PubMed] [Google Scholar]
- [14].Majumder PK, Febbo PG, Bikoff R, et al. mTOR inhibition reverses Akt-dependent prostate intraepithelial neoplasia through regulation of apoptotic and HIF-1-dependent pathways. Nat Med 2004;10:594–601. [DOI] [PubMed] [Google Scholar]
- [15].Scholl C, Frohling S, Dunn IF, et al. Synthetic lethal interaction between oncogenic KRAS dependency and STK33 suppression in human cancer cells. Cell 2009;137:821–34. [DOI] [PubMed] [Google Scholar]
- [16].Sun JM, Hwang DW, Ahn JS, et al. Prognostic and predictive value of KRAS mutations in advanced non-small cell lung cancer. PLoS One 2013;8:e64816. [DOI] [PMC free article] [PubMed] [Google Scholar]
- [17].Zhang B, Horvath S. A general framework for weighted gene co-expression network analysis. Stat Appl Genet Mol Biol 2005;4: Article17. [DOI] [PubMed] [Google Scholar]
- [18].Truitt ML, Ruggero D. New frontiers in translational control of the cancer genome. Nat Rev Cancer 2016;16:288–304. [DOI] [PMC free article] [PubMed] [Google Scholar]
- [19].Meyer B, Wittig I, Trifilieff E, et al. Identification of two proteins associated with mammalian ATP synthase. Mol Cell Proteomics 2007;6:1690–9. [DOI] [PubMed] [Google Scholar]
- [20].Bastide A, David A. The ribosome, (slow) beating heart of cancer (stem) cell. Oncogenesis 2018;7:34. [DOI] [PMC free article] [PubMed] [Google Scholar]
- [21].Guimaraes JC, Zavolan M. Patterns of ribosomal protein expression specify normal and malignant human cells. Genome Biol 2016;17:236. [DOI] [PMC free article] [PubMed] [Google Scholar]
- [22].Fonseca A, Gubitoso MD, Reis MS, et al. A new approach for identification of cancer-related pathways using protein networks and genomic data. Cancer Inform 2015;14: suppl: 139–49. [DOI] [PMC free article] [PubMed] [Google Scholar]
- [23].Karan D, Kelly DL, Rizzino A, et al. Expression profile of differentially-regulated genes during progression of androgen-independent growth in human prostate cancer cells. Carcinogenesis 2002;23:967–75. [DOI] [PubMed] [Google Scholar]
- [24].Gentilella A, Kozma SC, Thomas G. A liaison between mTOR signaling, ribosome biogenesis and cancer. Biochim Biophys Acta 2015;1849:812–20. [DOI] [PMC free article] [PubMed] [Google Scholar]
- [25].Chung J, Kuo CJ, Crabtree GR, et al. Rapamycin-FKBP specifically blocks growth-dependent activation of and signaling by the 70 kd S6 protein kinases. Cell 1992;69:1227–36. [DOI] [PubMed] [Google Scholar]
- [26].Sribenja S, Li M, Wongkham S, et al. Advances in thymosin β10 research: differential expression, molecular mechanisms, and clinical implications in cancer and other conditions. Cancer Invest 2009;27:1016–22. [DOI] [PubMed] [Google Scholar]
- [27].Li Z, Qu L, Zhong H, et al. [Mechanism of thymosin beta 10 inhibiting the apoptosis and prompting proliferation in A549 cells]. Zhongguo Fei Ai Za Zhi 2014;17:783–8. [DOI] [PMC free article] [PubMed] [Google Scholar]
- [28].Trebinska A, Rembiszewska A, Ciosek K, et al. HAX-1 overexpression, splicing and cellular localization in tumors. BMC Cancer 2010;10:76. [DOI] [PMC free article] [PubMed] [Google Scholar]
- [29].Yan J, Ma C, Cheng J, et al. HAX-1 inhibits apoptosis in prostate cancer through the suppression of caspase-9 activation. Oncol Rep 2015;34:2776–81. [DOI] [PubMed] [Google Scholar]
- [30].Li X, Jiang J, Yang R, et al. Expression of HAX-1 in colorectal cancer and its role in cancer cell growth. Mol Med Rep 2015;12:4071–8. [DOI] [PMC free article] [PubMed] [Google Scholar]
- [31].Kontro H, Hulmi JJ, Rahkila P, et al. Cellular and tissue expression of DAPIT, a phylogenetically conserved peptide. Eur J Histochem 2012;56:e18. [DOI] [PMC free article] [PubMed] [Google Scholar]
- [32].Esparza-Molto PB, Cuezva JM. The role of mitochondrial H (+)-ATP synthase in cancer. Front Oncol 2018;8:53. [DOI] [PMC free article] [PubMed] [Google Scholar]
- [33].Kontro H, Cannino G, Rustin P, et al. DAPIT over-expression modulates glucose metabolism and cell behaviour in HEK293T cells. PLoS One 2015;10:e0131990. [DOI] [PMC free article] [PubMed] [Google Scholar]
- [34].Rak M, Benit P, Chretien D, et al. Mitochondrial cytochrome c oxidase deficiency. Clin Sci (Lond) 2016;130:393–407. [DOI] [PMC free article] [PubMed] [Google Scholar]
- [35].Eun SY, Woo IS, Jang HS, et al. Identification of cytochrome c oxidase subunit 6A1 as a suppressor of Bax-induced cell death by yeast-based functional screening. Biochem Biophys Res Commun 2008;373:58–63. [DOI] [PubMed] [Google Scholar]
Associated Data
This section collects any data citations, data availability statements, or supplementary materials included in this article.


