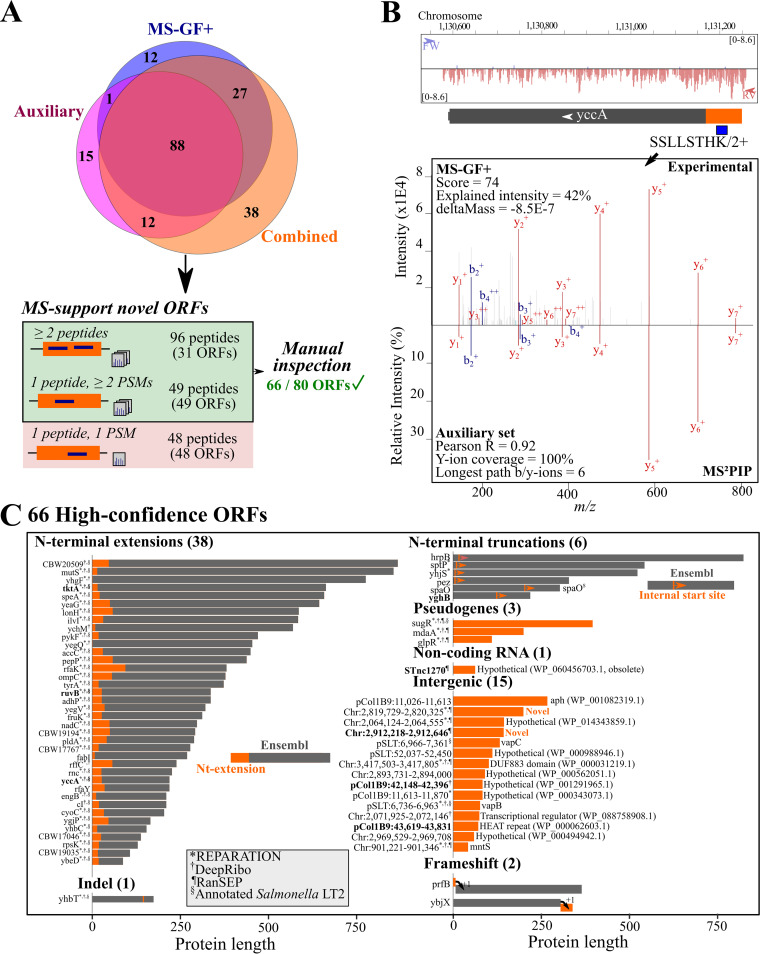
FIG 5.
S. Typhimurium unannotated protein-coding regions. (A) (Top) Venn diagram of unannotated peptides identified at a peptide Q value of ≤0.05 after Percolator processing using the MS-GF+, auxiliary, or combined feature sets. (Bottom) Peptide-to-ORF assignment, resulting in 66 high-confidence ORFs after manual inspection (see Materials and Methods). (B) (Top) Annotated MS/MS spectrum of the doubly charged SSLLSTHK; (bottom) MS2PIP-predicted MS/MS spectrum. Features used for Percolator postprocessing are displayed. (C) Overview of 66 high-confidence unannotated protein-coding regions. Bars are indicative of protein size; gray indicates Ensembl-annotated regions, whereas orange indicates unannotated protein regions. The corresponding Ensembl annotations are indicated on the left, whereas for intergenic ORFs, chromosomal locations and identical proteins identified by protein BLAST are displayed. In addition, whether ORF delineation corresponds to de novo predictions of REPARATION (12) (*), DeepRibo (13) (†), ranSEP-predicted ORFs (ranSEP score ≥ 0.5 [6]) (¶), or matched S. Typhimurium str. LT2 annotation (§) is indicated. Eight translation products identified only by peptides due to re-scoring and/or iterative searching are indicated in bold. Nt, N-terminal.

