

Abstract
Objective
Recent studies suggest that sensory phenotyping may provide critical information for the diagnosis and management of patients with chronic neuropathic pain (NP). However, many formal quantitative sensory testing (QST) paradigms require expensive equipment, a dedicated location, and substantial time commitments on the part of patient and examiner, highlighting the need for a convenient and portable “bedside” QST battery. We developed and tested a bedside QST battery in a sample of patients with chronic NP.
Methods
Participants (N = 51) attended two in-person visits over approximately two weeks, during which they underwent QST using both laboratory-based equipment and simple, easily accessible bedside tools. Participants also completed questionnaires about their daily pain and NP symptoms.
Results
Test–retest reliability estimates were highly statistically significant and did not differ between bedside (mean r = 0.60) and laboratory-based (mean r = 0.72) QST. Bedside QST variables and corresponding laboratory-based QST variables were highly correlated, suggesting adequate criterion validity for the bedside tests.
Conclusions
Results from the present study may have important implications for the sensory phenotyping and subsequent management of patients with chronic NP. Implementation of a protocol that uses inexpensive, portable, and convenient tools may allow for the application of QST in variety of clinical settings and advance NP research.
Keywords: Pain, Neuropathic, Quantitative Sensory Testing
Introduction
Chronic neuropathic pain (NP) is characterized by multiple sensory alterations that frequently include sensory deficits, allodynia, and hyperalgesia in patterns that vary substantially across individual patients [1]. In 2011, the International Association for the Study of Pain (IASP) introduced an updated definition of NP as “pain that is caused by a lesion or disease of the somatosensory system” [2]. This condition affects millions of people globally, with population prevalence estimates ranging from 6% to 10% [3]. Symptoms of NP are often disabling and can significantly limit patients’ functioning both physically and psychologically [4]. Although patients with NP exhibit a core set of common symptoms and signs (e.g., spontaneous pain described as burning or shooting, altered sensory function, paresthesias, etc.), the combinations of presenting symptoms and alterations in sensory function differ widely across patients. Similarly, patients vary substantially in their responses to pharmacological and other therapeutic interventions, with long-term relief being difficult to achieve for many [5]. Recent reports in the area of “mechanism-based treatment” for chronic pain suggest that sensory phenotyping, based on individual patients’ sensory responses and symptoms, may have implications for shaping treatment outcomes [6–8]. Such findings highlight the possibility that treatment could be tailored, or personalized, to individual patient characteristics, improving NP outcomes by matching the recommended intervention to the mechanism that is presumably identified by the observed sensory alteration.
Such advances in personalized pain medicine will require the availability of valid, reliable, and scalable sensory profiling methods. To date, a broad array of measures has been applied to the study of NP profiles. Validated questionnaires assessing the number and degree of NP symptoms, such as the Neuropathic Pain Symptom Inventory (NPSI) [9], painDETECT [10], Leeds Assessment of Neuropathic Symptoms and Signs (LANSS) pain scale [11], Douleur Neuropathique en 4 Questions (DN4) [12], Neuropathic Pain Scale (NPS) [13], and more, are regularly used as screening tools in establishing patient-specific patterns of symptoms [14,15]. In addition, quantitative sensory testing (QST), a type of psychophysical assessment, precisely quantifies sensory sensitivity across multiple modalities [16–18]. Previous studies have applied primarily laboratory-based QST protocols to assess variability in sensory responses to standardized noxious thermal and mechanical stimuli in patients with an array of chronic pain disorders (i.e., fibromyalgia, NP, osteoarthritis, etc.). Such studies have been performed cross-sectionally in order to subgroup patients with a particular condition [19–21] or applied longitudinally to patients undergoing treatment [22–26].
However, while laboratory-based QST is an essential tool in the study of neuropathic pain, the high costs and intensive requirements (in space, trained personnel, time, etc.) associated with the design and implementation of extensive protocols can limit its availability and clinical application. Moreover, despite the availability of testing methods in laboratory settings, there is a lack of standardization in terms of administration techniques and choice of tests to be used among patients with specific phenotypic characteristics. There is a growing need for a standardized QST protocol using inexpensive, portable, and readily available equipment for the evaluation of patients with chronic NP in a variety of clinical settings. In the present study, we developed and tested such a “bedside” QST battery in a sample of patients with chronic NP. We focused on neuropathic pain conditions in the present study as NP has been a focus of sensory phenotyping [14,15]; however, we anticipate that this bedside battery would be useful in patients with an array of chronic pain conditions, including musculoskeletal pain, cancer-related pain, nociplastic pain, and others, who exhibit similar sensory phenomena. The aim of the study was to validate this bedside QST protocol as a convenient and portable method that can be used to reliably measure sensory characteristics and chronic pain phenotypes, compared with laboratory-based QST.
Methods
This validation study consisted of two in-person visits during which patients with NP underwent two QST batteries, one laboratory-based QST battery using relatively expensive, largely nonportable equipment, and one bedside QST battery using inexpensive, portable, and widely available tools. A total of 51 patients with chronic neuropathic pain participated in this clinical study. Subjects were recruited through online advertisements on a local clinical research website, physician referrals, flyers placed at hospitals and pain clinics, and letters sent out to potential participants on the Research Patient Data Registry (RPDR), a hospital-based electronic registry of patients who have agreed to be contacted about potentially relevant clinical studies. Potential participants called the study coordinator to obtain information about the project and to undergo telephone screening before being invited for an in-person visit. All of the study procedures were approved by the Brigham and Women’s Hospital and Beth Israel Deaconess Medical Center Institutional Review Boards. Written informed consent was obtained from each subject by study staff at the time of enrollment.
Participants met all inclusion criteria and attended two in-person research visits over a timespan of approximately two weeks. During the initial study visit, participants completed baseline clinical and demographic questionnaires and then underwent the two QST batteries described above, one with laboratory-based equipment and the other with our newly developed bedside testing battery, in a randomized order. At the second visit, participants again underwent both QST batteries, with the order counterbalanced. Subjects were compensated up to $200 for completion of all study procedures. Potential participants were screened over the phone and had to meet the following inclusion criteria in order to be eligible for the study: 1) physician diagnosis of neuropathic pain (verified by medical record review) that has lasted at least six months, 2) average baseline pain of 3 or greater on a 0–10 pain intensity scale (0 = “no pain,” 10 = “most intense pain imaginable”) with the neuropathic pain condition being the primary source of pain, 3) age 21 or older, and 4) fluent in English. Patients were not considered for participation if they met the following exclusion criteria: 1) a current diagnosis of cancer or any other malignant disease, 2) a non-neuropathic pain condition of equal or greater pain intensity relative to their neuropathic pain, 3) present or past DSM-V diagnosis of thought disorders such as schizophrenia, delusional disorder, psychotic disorder, or dissociative disorder, 4) pregnancy if female, 5) any clinically unstable systemic illness, 6) severe acute pain, 7) recent use of recreational drugs, or 8) severe cognitive disorders.
The first study visit consisted of a thorough review of the consent form, completion of pain and symptom-based questionnaires, and QST. After consenting, participants filled out demographic surveys and a series of pain-specific questionnaires, such as the NPSI, Brief Pain Inventory (BPI), and Patient-Reported Outcomes Measurement Information System 29 (PROMIS-29). At the start of the QST session, which in total lasted approximately two hours, subjects were asked to indicate their area of maximum neuropathic pain. A reference pain-free area was also identified for testing purposes. We conducted bedside tests in these two areas, which are specified below. Participants were provided with detailed instructions for all testing procedures, including the 0–10 pain intensity rating scale, which was used for the entirety of the session. A 20-minute recovery period was allowed between the testing sessions (bedside vs laboratory-based QST). At the second visit, participants were only asked to complete the NPSI and to once again undergo QST with the order of the two batteries counterbalanced. All testing was performed by the same research coordinator, who received adequate training by the principal investigator (PI) in both testing batteries and demonstrated standardized administration of the tests during mock visits before enrollment began. Over the course of the study, the PI and two other research staff observed the coordinator during subject visits, on separate occasions, to ensure that tests were administered in a standardized fashion. Both laboratory-based and bedside QST procedures are described in detail below, and a list of the equipment used is provided in the Appendix.
Bedside QST
Assessment of Sensory Threshold
Von Frey nylon filaments (North Coast Medical) of various thickness (2.83 mN, 3.61 mN, 4.31 mN, 4.56 mN, 5.07 mN, 6.65 mN) were used to evaluate subjects’ sensory threshold at the area of maximum pain (Figure 1). The test was conducted over three trials in which participants, with their eyes closed, were asked to say “yes” every time they felt something on their skin. In each trial, the 4.31 (2 g) filament was applied first (at a 90° angle), and if that filament was perceived, then filaments 3.61 (0.4 g) and 2.83 (0.07 g) were also applied. If the first filament was not perceived, then filaments 4.56 (4 g) and greater (10 g and 300 g) were applied. All filaments were in contact with the skin for a total of 1.5 seconds. Filaments 4.31 and lower were repeated three times in each trial; all other filaments were only applied once per trial.
Figure 1.

Bedside equipment including foam brush, metal rods, neurotips, and Von Frey monofilaments.
Assessments of Mechanical Pain
The tip of a plastic probe was used to evaluate static mechanical allodynia by applying constant light pressure (just enough to indent the skin) for 10 seconds at the area of maximum pain. A foam brush was used to measure dynamic mechanical allodynia by gently stroking the area of maximum pain in the shape of an “X” (Figure 2). The stroke was repeated twice at a rate of 3–5 cm/s, or at a length of 5–10 cm over one to two seconds. A Neurotip, which consists of a plastic holder and a sharp tip (Figures 1 and 3), was used to assess punctate hyperalgesia at the area of maximum pain and the reference area. The sharp tip was applied twice for a total of 1.5 seconds at each contact, and participants were asked to provide a rating of the pain, using the 0–10 scale, produced by each stimulus and not their ongoing or spontaneous pain. Temporal summation was evaluated at the area of maximum pain and the reference area using the 6.65 (300 g) Von Frey nylon filament (Figure 4). The stimulus involved repeatedly tapping the filament on either area at a consistent rate of 2 Hz for a total of 60 seconds. Pain ratings were collected at one second, 30 seconds, and 60 seconds. Following the continuous stimulus, participants were asked to report the maximum pain experienced during the temporal summation test. Temporal summation was operationalized as maximum pain minus initial pain.
Figure 2.
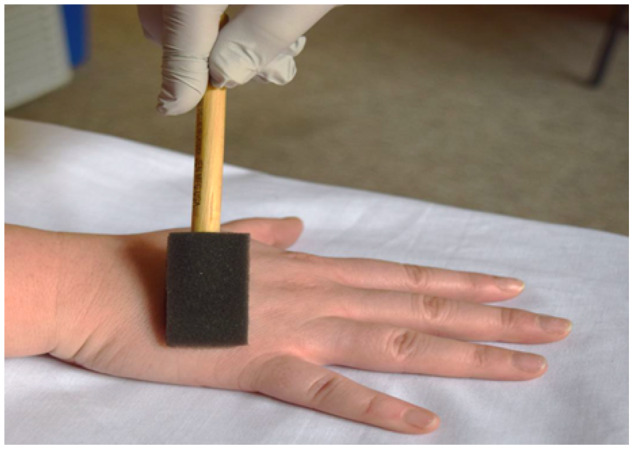
Dynamic mechanical allodynia performed with foam brush.
Figure 3.
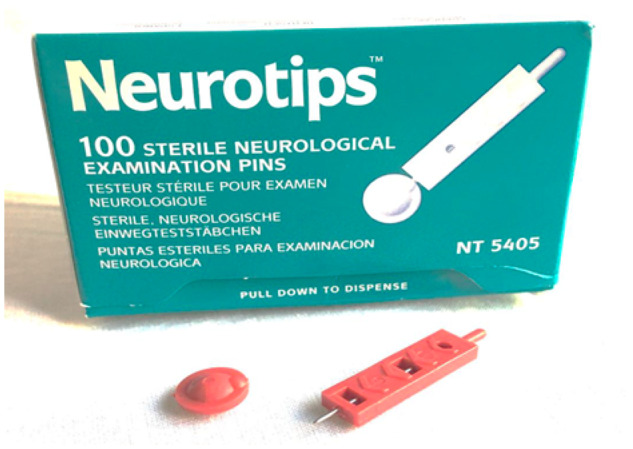
Neurotips used for punctate hyperalgesia.
Figure 4.
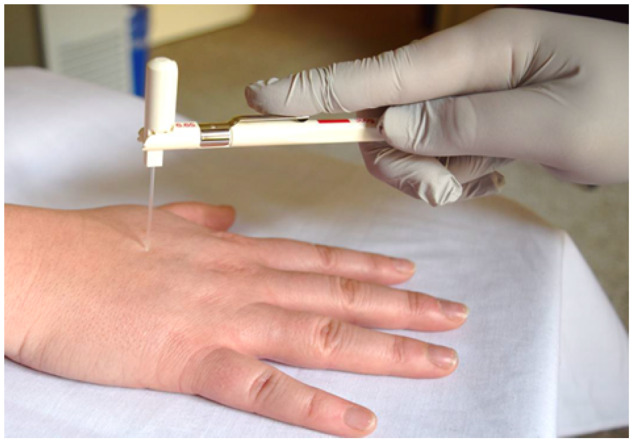
Temporal summation assessed with the 6.65 Von Frey monofilament.
Assessments of Thermal Pain Sensitivity
Cold allodynia at the area of maximum pain was evaluated with the application of a metal rod previously immersed in ice water. The rod was immersed in water for a total of three seconds to reach a temperature of 18°C and then dried. Warmth allodynia at the area of maximum pain was assessed with the application of a metal rod previously dipped in a mixture of boiling and tap water (∼1:2 ratio, temperature of 50°C) for a total of five seconds to reach a temperature of 35°C and then dried. Cold hyperalgesia at the area of maximum pain and the reference area was evaluated with the application of a metal rod previously submerged in ice water (measured to be 0°C) to reach a temperature of 6°C and then dried. The rod remained in the water for a minimum of 15 minutes before it was applied. Warmth hyperalgesia at the area of maximum pain and the reference area was evaluated with the application of a metal rod previously immersed in a mixture of boiling and tap water (∼1:1 ratio, temperature of 63°C) for a total of five seconds to reach a temperature of 43°C and then dried.
For each of the above thermal tests, the long end of the rod was applied to the area of maximal pain (and for assessment of hyperalgesia also to the reference area) for 10 seconds (Figure 5), and a pain rating due to the temperature of the rod was collected immediately following removal of the rod. The same processes for cold and warmth hyperalgesia were repeated to measure quantification of cold and heat perception. Immediately following the stimuli, participants were asked to answer the following questions: 1) for cold perception: “How would you rate how cold the rod feels using a scale where zero means not cold, and ten means the coldest sensation imaginable?”; and 2) for heat perception: “How would you rate how warm the rod feels using a scale where 10 means not warm and 10 means the hottest sensation imaginable?”
Figure 5.
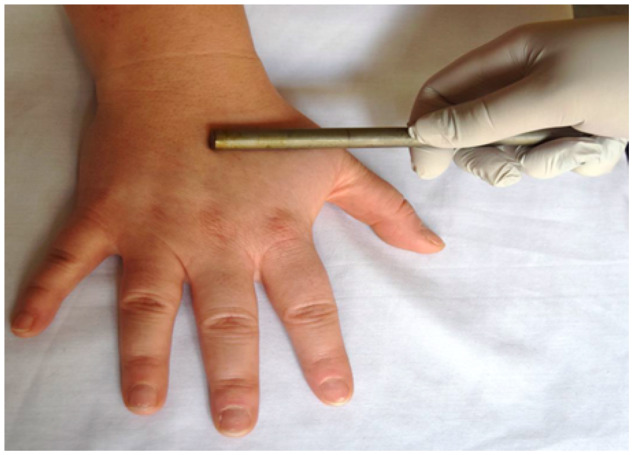
Assessments of thermal pain sensitivity using the metal rod.
Temperatures for each thermal pain sensitivity assessment (cold or warmth allodynia and hyperalgesia) were determined after several trials at various time points in a temperature-controlled room. Measurements were performed with a precision thermometer and a dedicated thermistor probe (Medoc TSA-II calibration measurement specialties, 4,600 thermometer test lab). The same process was followed for all tests in order to determine the ideal temperature and duration that would be used to carry out the thermal sensory assessments in this bedside QST battery. During these trials, temperature readings were obtained at different time intervals (five, 10, 15, 20, 25, and 30 seconds), after submerging the rods in either ice water or a mixture of boiling and tap water for the cold and warmth tests, respectively. The ideal temperatures of the rods were determined to be 18°C for cold allodynia, 6°C for cold hyperalgesia, 35°C for warmth allodynia, and 43°C for warmth hyperalgesia measured at 10 seconds. All rods were prepared using the same standard process as described above each time they were used for testing.
Laboratory-Based QST
Assessments of Mechanical Pain
A digital pressure algometer (Somedic) was used to assess mechanical pain thresholds. Pressure pain thresholds (PPThs) were determined at the metacarpophalangeal thumb joint (dominant hand), bilaterally at the trapezius muscle, and at the area of maximum pain. At each site, mechanical force was applied using a 0.5-cm2 probe covered with polypropylene pressure-transducing material; pressure was increased at a steady rate of 30 kPA/s until the subject indicated that the pressure was “first perceived as painful.”
Mechanical temporal summation was assessed with the use of weighted DFNS (German Research Network of Neuropathic Pain) probes, which are metal pinprick stimulators of various weights, at the area of maximum pain and the middle phalange of the third digit on the nondominant hand. The stimulus was first applied once for one second using the 128-mN and 256-mN probes, and pain ratings were noted. After that, both probes were used to apply a series of 10 consecutive one-second stimuli, and pain ratings were obtained at the first, fifth, and 10th stimuli. Participants provided residual pain ratings 15 seconds following the 10th stimulus. As in the bedside temporal summation testing, we derived a rating of maximal pain during the test, and temporal summation was operationalized as maximum pain minus initial pain.
Response to deep pressure pain was ascertained via cuff pressure algometry (CPA) using a Hokanson rapid cuff inflator. In brief, tonic, deep tissue mechanical stimulation was applied using a pneumatic tourniquet cuff, which was inflated gradually to determine the cuff pain threshold. A standard blood pressure cuff was placed around the subject’s gastrocnemius muscle and was then inflated to an initial pressure of 60 mmHg. The pressure was steadily increased at ∼20 mmHg/s, until participants reached a “moderate” pain intensity rating of 4 out of 10. The pressure then remained steady for the duration of the test, and participants were asked to provide pain ratings due to the pressure every 30 seconds up to two minutes, or until the pain became intolerable. Residual pain ratings were collected 15 seconds later.
Assessments of Thermal Pain Sensitivity
Heat pain sensitivity and cold pain sensitivity were evaluated using a contact thermode delivering hot or cold stimulus through a computer-controlled system (Medoc Q-Sense). The test was performed both at the area of maximum pain and at the subjects’ right or left upper arm, which constituted the reference area. For the first four trials, which examined thermal sensory thresholds, subjects were asked to indicate when they first started to feel a warm or a cool sensation through a button press that would return the device temperature to baseline (30°C). For the following four trials, which assessed thermal pain thresholds, subjects were asked to indicate when they “first felt pain” due to the heat or cold.
Finally, responses to noxious cold were evaluated using a cold pressor task (CPT), involving immersion of the dominant hand in a circulating cold water bath (NesLab RTE-17) maintained at 4°C. Participants immersed their dominant hand (up to the wrist) in the water bath and maintained their right hand in the water bath until reaching pain tolerance (or a three-minute maximum). Participants rated the maximum intensity of the cold pain on a 0–10 scale (“no pain” to “most intense pain imaginable”) during and at the conclusion of the CPT.
Changes in pain responses across sessions were examined using paired-samples t tests, as recommended when evaluating within-subject data. Test–retest correlations, as well as intercorrelations between different QST measures, were generally assessed using Pearson correlations, but Spearman’s rho was applied when variables were found to exhibit non-normal distributions. We used a Fisher Z-transformation to convert correlation coefficients to Z-scores and compare them. Such tests are routinely used to statistically compare the magnitudes of two correlation coefficients [27].
Results
The 51 patients enrolled in the present study had neurologist-diagnosed chronic neuropathic pain (verified by medical record review) attributable to a variety of etiologies. Nearly 40% had lower limb and foot pain as a consequence of diabetic neuropathy, with idiopathic small-fiber neuropathic pain and postoperative/post-traumatic pain being the second and third most common etiologies (Table 1). A variety of medications were used by at least a minority of patients (no medication class was used by a majority of the sample) (Table 2). No changes in prescription or over-the-counter medications were reported between Visit 1 and Visit 2. The mean age of the sample was 57 (±15) years, with the majority of participants being female (consistent with the demographics of chronic pain in general), white, employed, and fairly well educated. BPI, PROMIS-29, and NPSI scores indicated that the sample reported moderately severe and impairing chronic pain symptomatology (Table 3). The PROMIS-29 subscales are presented as T-scores, with a mean (derived from the reference sample in the general population) of 50 and a standard deviation of 10. Thus, the current sample reports physical functioning that is substantially (i.e., nearly 1.5 SDs) below the mean of the general population and pain interference that is substantially (i.e., nearly 1.5 SDs) above the mean of the general population.
Table 1.
Etiology of neuropathic pain
| Category | % of Participants |
|---|---|
| Diabetic neuropathy | 39.3 |
| Idiopathic small fiber neuropathy | 23.5 |
| Post traumatic/surgical neuropathy | 19.6 |
| Ulnar neuropathy | 7.8 |
| Radiculopathy | 5.9 |
| Chemotherapy | 3.9 |
Table 2.
Concomitant medications grouped by agent class
| Agent Class | % of Participants |
|---|---|
| Opioids | 15.4 |
| Muscle relaxant | 5.8 |
| Anticonvulsant | 44.2 |
| 1b-antiarrhymic drug | 5.8 |
| NSAID | 11.5 |
| SNRI | 5.8 |
| NDRI | 1.9 |
| Benzodiazepines | 7.7 |
| Steroids | 5.8 |
| Acetaminophen | 13.5 |
NDRI = Norepinephrine-Dopamine Reuptake Inhibitor; NSAID = nonsteroidal anti-inflammatory drug; SNRI = Serotonin-Norepinephrine Reuptake Inhibitor.
Table 3.
Baseline demographic and clinical data (N = 51)
| Sex | |
|---|---|
| % female | 69 |
| % male | 31 |
| Race | |
| % white | 80 |
| % African American | 12 |
| % other | 8 |
| Marital status | |
| % married | 37.3 |
| % never married | 25.5 |
| % divorced/separated | 25.5 |
| % widowed | 11.8 |
| Education | |
| % high school only | 11.7 |
| % some college | 25.5 |
| % college graduate | 39.3 |
| % graduate degree | 23.5 |
| Currently employed | |
| % yes | 68.6 |
| % no | 31.4 |
| Area of maximum pain | |
| % upper limb | 41.2 |
|
% lower limb |
58.8 |
|
Questionnaire scores | |
|
Promis-29 T-Scores |
Mean ± SD (% of Sample Scoring Worse than Population Mean) |
| Physical function | 35.9 ± 5.6 (100) |
| Anxiety | 55.6 ± 9.2 (78) |
| Depression | 51.3 ± 9.7 (53) |
| Fatigue | 58.1 ± 10.3 (71) |
| Sleep disturbance | 50.6 ± 5.1 (51) |
| Satisfaction with social role | 41.7 ± 9.3 (78) |
| Pain interference | 63.5 ± 7.1 (100) |
| BPI pain severity (0–10) | 5.7 ± 1.8 |
| BPI pain interference (0–10) | 5.2 ± 2.6 |
| Current pain at visit 1 (0–10) | 6.1 ± 1.7 |
| NPSI visit 1 | |
| Burning pain (0–10) | 4.9 ± 3.0 |
| Deep pain (0–10) | 3.5 ± 2.8 |
| Paroxysmal pain (0–10) | 4.2 ± 2.7 |
| Evoked pain (0–10) | 3.7 ± 2.5 |
| Paresthesia (0–10) | 6.1 ± 2.5 |
| Total (0–100) | 43.7 ± 20.7 |
| NPSI visit 2 | |
| Burning pain (0–10) | 4.0 ± 3.2 |
| Deep pain (0–10) | 2.8 ± 2.6 |
| Paroxysmal pain (0–10) | 4.4 ± 2.8 |
| Evoked pain (0–10) | 3.6 ± 2.8 |
| Paresthesia (0–10) | 5.3 ± 3.2 |
| Total (0–100) | 39.4 ± 21.4 |
PROMIS-29 subscales are presented as T-scores, in which 50 is the mean of the reference population and 10 is the SD of that population.
BPI = Brief Pain Inventory; NPSI = Neuropathic Pain Symptom Inventory.
Fifty out of 51 participants completed both visits (representing a 2% dropout rate for the study); the two visits were separated by a mean of 14 (±7) days. Bedside QST measurements showed substantial between-subject variability but exhibited good temporal stability over the two-week study period; Table 4 presents means and test–retest correlations for these variables. Bedside responses did not differ from Visit 1 to Visit 2 (all P > 0.05), and test–retest correlations were highly significant. The bedside QST was accomplished in 30 (±5) minutes on average, including the time to cool down or warm up the metal rods for the respective thermal tests. This was measured by recording the start time at the beginning of the session and the end time once all assessments were completed.
Table 4.
Mean, variability, and test–retest correlations for bedside QST
| Test | Visit 1, Mean ± SD | Visit 2, Mean ± SD | Correlation |
|---|---|---|---|
| Von Frey | 2.9 ± 1.2 | 2.8 ± 1.4 | 0.73*** |
| Static mechanical allodynia | 1.5 ± 1.8 | 1.5 ± 1.9 | 0.62*** |
| Dynamic mechanical allodynia | 1.2 ± 1.8 | 1.0 ± 1.8 | 0.64*** |
| Punctate hyperalgesia | 2.5 ± 2.2 | 2.2 ± 2.1 | 0.66*** |
| Temporal summation (maximum) | 3.4 ± 2.7 | 3.7 ± 2.8 | 0.70*** |
| Cold allodynia | 2.0 ± 2.4 | 2.4 ± 2.3 | 0.52*** |
| Cold hyperalgesia | 2.6 ± 2.4 | 2.9 ± 2.6 | 0.68*** |
| Cold rating | 4.0 ± 2.4 | 4.0 ± 2.5 | 0.53*** |
| Warm allodynia | 1.1 ± 1.7 | 1.7 ± 2.4 | 0.36* |
| Warm hyperalgesia | 4.9 ± 3.1 | 5.7 ± 3.2 | 0.42** |
| Heat rating | 6.2 ± 3.2 | 6.8 ± 3.1 | 0.65*** |
P < 0.5;
P < 0.01;
P < 0.001.
QST = quantitative sensory testing.
For comparison, test–retest correlations for laboratory-based QST are presented in Table 5. There were no Visit 1 to Visit 2 differences in laboratory-based QST responses. The bedside and laboratory-based batteries show comparable temporal stability estimates; the mean test–retest correlation was r = 0.60 for bedside QST and r = 0.72 for laboratory-based QST. The results of a Fisher test indicated that these correlations do not differ significantly (Z = 1.0, P = 0.31). Interestingly, these test–retest correlations for both bedside and laboratory-based QST responses are substantially higher than test–retest values for patient reports of their daily neuropathic pain symptoms. The test–retest correlation for NPSI is r = 0.11 (NPSI scores did not change significantly from Visit 1 to Visit 2; the mean difference score across visits was 3.0 ± 4.6). Fisher tests indicated that mean test–retest correlations for both bedside (Z = 2.8, P < 0.01) and laboratory-based (Z = 3.9, P < 0.001) QST responses were significantly higher than for NPSI scores. The test–retest coefficient for current (0–10) numeric pain intensity ratings is r = 0.76***.
Table 5.
Test–retest correlations for laboratory-based QST
| Test | Visit 1, Mean ± SD | Visit 2, Mean ± SD | Correlation |
|---|---|---|---|
| Pressure pain threshold, kPa | 261.1 ± 151.8 | 273.2 ± 165.1 | 0.78*** |
| Punctate hyperalgesia (0–10) | 2.6 ± 2.2 | 2.5 ± 2.4 | 0.58*** |
| Temporal summation (0–10) | 4.0 ± 2.8 | 4.0 ± 3.1 | 0.75*** |
| Cold pain threshold, °C | 26.0 ± 3.4 | 26.5 ± 3.8 | 0.60*** |
| Cold pain rating (0–10) | 7.8 ± 1.9 | 7.9 ± 2.4 | 0.72*** |
| Cold pain tolerance, sec | 36.7 ± 41.2 | 42.7 ± 46.5 | 0.89*** |
| Warm threshold, °C | 39.9 ± 5.3 | 39.7 ± 4.8 | 0.73* |
| Heat pain threshold, °C | 44.2 ± 4.8 | 44.4 ± 4.1 | 0.74** |
P < 0.5;
P < 0.01;
P < 0.001.
QST = quantitative sensory testing.
We also examined, using combined data from both visits, intercorrelations among the bedside QST variables. In general, correlations between bedside QST variables were moderate and significant within and across testing modalities (e.g., warm hyperalgesia is correlated with warm allodynia, cold hyperalgesia, and punctate mechanical hyperalgesia at 0.41–0.47, all P < 0.01). These correlations are presented in Table 6.
Table 6.
Intercorrelations among bedside QST variables
| Von Frey | Static Allodynia | Dynamic Allodynia | Punctate Hyperalgesia | Temp Summation | Cold Allodynia | Cold Hyperalgesia | Cold Rating | Warm Allodynia | Warm Hyperalgesia | Heat Rating | |
|---|---|---|---|---|---|---|---|---|---|---|---|
| Von Frey | 1 | –0.12 | –0.18 | –0.23* | –0.32** | –0.25* | –0.35** | –0.38** | –0.11 | –0.09 | –0.16 |
| Static allodynia | 1 | 0.41** | 0.37** | 0.55** | 0.46** | 0.53** | 0.17 | 0.51** | 0.38** | 0.27* | |
| Dynamic allodynia | 1 | 0.42** | 0.44** | 0.44** | 0.47** | 0.18 | 0.18 | 0.29** | 0.05 | ||
| Punctate hyperalgesia | 1 | 0.52** | 0.42** | 0.33** | 0.14 | 0.27* | 0.41** | 0.47** | |||
| Temp summation | 1 | 0.52** | 0.58** | 0.41** | 0.48** | 0.38** | 0.21* | ||||
| Cold allodynia | 1 | 0.72** | 0.43** | 0.54** | 0.38** | 0.19 | |||||
| Cold hyperalgesia | 1 | 0.57** | 0.57** | 0.46** | 0.35** | ||||||
| Cold rating | 1 | 0.25* | 0.34** | 0.22* | |||||||
| Warm allodynia | 1 | 0.47** | 0.23* | ||||||||
| Warm hyperalgesia | 1 | 0.63** | |||||||||
| Heat rating | 1 |
P < 0.5;
P < 0.01.
QST = quantitative sensory testing.
In addition, we evaluated associations between bedside QST variables and corresponding laboratory-based QST variables. Table 7 presents these associations, which are all (as expected) statistically significant, suggesting good criterion validity for bedside measures.
Table 7.
Correlations between bedside QST and corresponding laboratory-based QST responses
| Variables (Bedside Listed First) | Correlation |
|---|---|
| Static mechanical allodynia and PPTh | –0.49***,† |
| Dynamic mechanical allodynia and PPTh | –0.43***,† |
| Punctate hyperalgesia and punctate hyperalgesia | 0.55*** |
| Temporal summation and temporal summation | 0.69*** |
| Cold allodynia and CPTh | 0.58*** |
| Cold hyperalgesia and CPTh | 0.62*** |
| Cold rating and CPTh | 0.59*** |
| Warm allodynia and HPTh | –0.52***,† |
| Warm hyperalgesia and HPTh | –0.46**,† |
| Heat rating and HPTh | –0.51***,† |
CPTh = cold pain threshold; HPTh = heat pain threshold; PPTh = pressure pain threshold; QST = quantitative sensory testing.
P < 0.01;
P < 0.001.
Correlations between bedside and laboratory-based QST response are expected to be negative (e.g., higher ratings for bedside measures of allodynia reflect greater pain sensitivity, whereas lower pain thresholds for laboratory-based QST measures reflect greater pain sensitivity, producing negative correlation coefficients).
Finally, in order to assess associations with clinically relevant pain symptoms, we calculated correlations of bedside responses with patient-reported NPSI scores and pain intensity ratings. Many of these correlations (particularly with responses to mechanical stimuli) were positive and significant (Table 8). We also compared correlation coefficients for the bedside variables with those for the laboratory-based QST variables. There were no correlation coefficients between a clinical pain measure and a QST measure that were significantly higher (using a Fisher test) for laboratory-based QST than for the corresponding bedside measure; Table 8 includes the corresponding correlations between laboratory-based QST variables and patient-reported clinical pain symptoms.
Table 8.
Bedside QST: Correlations with clinical pain measures
| Bedside QST |
|||||
|---|---|---|---|---|---|
| Test | NPSI Item | NPSI Total | BPI Pain Severity | 0–10 Pain Intensity | |
| Von Frey | 0.52*** | 0.14 | 0.02 | 0.04 | |
| Static mechanical allodynia | 0.52*** | 0.46*** | 0.36** | 0.28* | |
| Dynamic mechanical allodynia | 0.58*** | 0.46*** | 0.33** | 0.39** | |
| Punctate hyperalgesia | 0.39** | 0.27* | 0.32* | 0.22 | |
| Temporal summation | 0.45*** | 0.26 | 0.34** | 0.28* | |
| Cold allodynia | 0.36** | 0.24 | 0.19 | 0.37** | |
| Cold hyperalgesia | 0.33* | 0.27* | 0.28* | 0.33** | |
| Cold rating | 0.35** | 0.04 | 0.25 | 0.14 | |
| Warm allodynia | 0.11 | 0.14 | 0.05 | 0.09 | |
| Warm hyperalgesia | 0.22 | 0.24 | 0.19 | 0.07 | |
| Heat rating | 0.12 | 0.26 | 0.37** | 0.05 | |
|
Laboratory-Based QST |
|||||
| Pressure pain threshold, kPa | 0.15 | 0.04 | –0.07 | 0.02 | |
| Punctate hyperalgesia (0–10) | 0.29* | 0.42** | 0.37** | 0.20 | |
| Temporal summation (0–10) | 0.38** | 0.16 | 23 | 0.13 | |
| Cold pain threshold, °C | 0.13 | 0.01 | 0.20 | 0.06 | |
| Cold pain rating (0–10) | 0.32* | 0.32* | 0.32* | 0.25 | |
| Cold pain tolerance, sec | –0.30* | –0.11 | –0.13 | –0.18 | |
| Warm threshold, °C | 0.08 | –0.22 | –0.12 | –0.11 | |
| Heat pain threshold, °C | 0.05 | –0.28* | –0.14 | –0.26 | |
BPI = Brief Pain Inventory; NPSI = Neuropathic Pain Symptom Inventory; QST = quantitative sensory testing.
P < 0.5;
P < 0.01;
P < 0.001.
Discussion
This study investigated the validity and reliability of a bedside QST protocol in a sample of chronic NP patients with moderate to severe symptomatology. The findings summarized here suggest that the present bedside QST protocol is comparable to and correlated with laboratory-based QST measures, has reasonable temporal stability, and shows potential clinical relevance. We found that patient responses to bedside mechanical and thermal stimuli varied highly across individuals while remaining stable within subjects over the course of two study visits that occurred approximately 14 days apart.
These findings may have important implications for the diagnosis and treatment of chronic NP. The clinical implementation of bedside QST appears to provide replicable quantitative information about patients’ pain-related sensory processing, as previously reported [16]. The bedside QST protocol in this study uses equipment that is readily available, easy to utilize, inexpensive, portable, and highly scalable. A widely implementable sensory testing battery such as this has the potential to optimize characterization and treatment of NP [18,28–32]. The availability of a reliable testing protocol using portable tools may allow clinicians to test patients in a variety of settings (e.g., outpatient and inpatient clinics, surgical settings, community health centers), thus expanding the pool of NP patients whose treatment could be informed by the sensory phenotyping described here.
It is noteworthy that patients with more hyperalgesic sensory responses to bedside QST reported greater intensity of daily NP symptoms on the NPSI. We found that more hyperalgesic responses to bedside testing were related to more intense daily neuropathic pain symptoms; this finding is consistent with previous research showing that hyperalgesia is associated with elevated pain levels among patients with chronic NP [33,34], though the amount of explained variance is modest, indicating that QST responses could not be substituted for patient-reported spontaneous pain scores. It is interesting to note that, for example, dynamic mechanical allodynia is correlated with NPSI scores (r = 0.46) to the same degree that it is correlated with cold allodynia and hyperalgesia (r = 0.44–0.47). These significant, moderate correlations suggest that patients may demonstrate broad trait-like characteristics (e.g., patients who are “pain-sensitive” tend to report a higher intensity of daily pain, more intense and bothersome neuropathic pain symptoms, and a greater propensity for thermal hyperalgesia, mechanical hyperalgesia, and likely hyperalgesia to other stimuli—chemical, ischemic, electrical, etc.—that were not measured in this study) while retaining the potential to display specific phenotypes (e.g., positive for cold hyperalgesia with no mechanical hyperalgesia). This is consistent with large studies that have identified moderate relationships between different QST-assessed variables and have used cluster analysis to identify subgroups of patients who show broad patterns of sensitivity across multiple sensory tests [24,35].
The potential application of QST to determine patient phenotypes that can be used to optimize treatment selection has generated a good deal of interest, though translational research in this area remains at a relatively early stage. Importantly, a handful of recent randomized, controlled pharmacologic trials in NP have suggested that sensory profiling of patients before treatment is predictive of interpatient variability in treatment response [36–38]. These findings are consonant with past research demonstrating that subgroups of patients with the same NP etiology may respond differently to pharmacological interventions [6,39–41], emphasizing the significance of creating unique, QST-based patient profiles. However, not all sensory profiling studies find strong relationships between QST-defined phenotypes and pharmacologic treatment responses [42], and much more work will be necessary before implementing QST-based clinical recommendations for individualized pain management.
During the past decade, interest in using QST to support a mechanism-based approach to pain treatment has grown rapidly, and the use of sensory profiles based on cluster analysis of QST test results has gained traction recently. It is hypothesized that the sensory profiles may provide a simple representation of underlying pain pathophysiological mechanisms, which could be used to guide therapeutic interventions. The present battery provides an array of representative tests for patients with NP, which maybe suitable for cluster analyses that could permit subgrouping patients into clusters such as “irritable and non-irritable nociceptors” [36,37,43] and “sensory loss,” “thermal hyperalgesia,” and “mechanical hyperalgesia” [44], as characterized using laboratory-based QST. Large-scale studies establishing reference values in normative populations would be helpful for those purposes. In the absence of such studies, a Z-score approach may be used, as has been done by the DFNS. In addition, while these baseline clusters may provide an organizing overview of NP mechanistic categories, they are broad groupings that may camouflage subtle distinctions in patient responses to an array of tests.
Most studies to date have originated in QST or clinical neurophysiology laboratories, which are not readily available in many treatment settings. The current bedside QST battery responds to the need for a convenient testing protocol that enables thorough evaluation of NP patients. Extensive batteries of laboratory-based QST are associated with high costs, unrealistic resource demands, and long testing sessions that require rigorous training. A need for a valid QST protocol that is inexpensive and can be used in a variety of settings has been repeatedly expressed in the field [45]. Researchers argue that a QST battery that can be easily transferred and applied between sites will foster its use and increase the collection of clinically relevant information, which should in turn facilitate further research and novel discoveries [46]. Previous successful attempts to validate equipment that is inexpensive, portable, and can be reliably used for NP testing (e.g., the Neuropen) [47] have shown promising results, but many of these studies evaluated a single testing modality using proprietary devices. Moreover, our bedside testing was accomplished in under 30 minutes in many cases, compared with over an hour of testing using laboratory-based equipment. All testing procedures followed standardized methodology carried out by the same research coordinator during every subject visit. Additional advantages of this bedside testing methodology include a lack of reliance on the availability of technology (e.g., a working laptop computer and high-voltage outlets) and a lack of confounding by response time variability (i.e., laboratory-based QST generally incorporates a method-of-limits-based assessment of thermal and mechanical pain responses based on a steadily changing stimulus, which is potentially contaminated by slow reaction times). Overall, the present data lend support to the use of a simple protocol with inexpensive equipment performed by technicians with necessary but rudimentary training to obtain reproducible results with tests that are similar to those used in laboratory-based QST.
Our bedside QST battery included assessment of multiple stimulation modalities using readily available, nonproprietary tools, generating responses that were highly correlated with laboratory-based QST and largely showed fair temporal stability (in fact, significantly better than the stability for patient-reported daily NP symptoms on the NPSI) over several weeks of assessment. Indeed, the present findings suggest the possibility that QST responses are more temporally stable (over short-term periods such as a week) than patient-reported descriptions of spontaneous neuropathic pain symptoms, which may have important implications for phenotyping. This may be attributable to the standardized nature of the testing (i.e., during QST, patients are responding to a physically identical stimulus at the different testing points, whereas the stimuli that provoke spontaneous neuropathic pain symptoms are unknown and presumably variable) or potentially to the larger array of factors that can influence clinical pain symptomatology. For example, the degree of neuropathic pain a patient experiences at any given moment may be affected by changes in body position or clothing or weather, whereas those factors have minimal influence on responses to a standardized stimulus, leading to greater temporal stability of QST responses relative to reports of spontaneous pain. Collectively, the appealing psychometric properties of this bedside QST battery (i.e., generally good stability over several weeks, good correlations with standard QST measures, significant and moderate associations with patient-reported neuropathic pain symptomatology) make it a potentially attractive candidate for larger, clinic-based studies.
Multiple limitations should be considered when interpreting the results of this study. Although the clinical and sociodemographic characteristics of our sample were consistent with prior studies of NP [48], the study was limited by its relatively small size and inability to assess the full range of NP etiologies (e.g., we did not enroll any patient with HIV-related or alcohol-induced neuropathy). We were also unable to control for or systematically evaluate the effects of patients’ medication regimens on their sensory responses. Furthermore, the present bedside QST battery was tested in a laboratory setting to compare its effectiveness to the laboratory-based QST procedures, and even though the duration of this battery was substantially shorter than the laboratory-based QST, its length may still pose a challenge during clinical applications. The psychometric characteristics of this bedside QST battery should be further investigated in less controlled settings (e.g., at the actual bedside of a patient in a recovery room or in a provider’s office), with properly trained researchers, and in larger samples to assess its reproducibility under an array of clinical conditions. Moreover, some of the bedside tests demonstrated lower temporal stability scores than others (e.g., test–retest correlations were <0.5 for warm allodynia and hyperalgesia). We are uncertain whether this was due to the characteristics of the testing or to the nature of thermal hyperalgesia; several previous studies have also reported lower validity and reliability estimates for thermal hyperalgesia scores relative to mechanical hyperalgesia scores [49,50]. Finally, healthy volunteers were not recruited for this study, and no normative values are currently available (i.e., this will require control groups and much larger sample sizes); thus, the current battery cannot yet formally designate patients as abnormal or normal in their sensory profiles. The scope of this study was to gather pilot data to support the need for continuing research within this field in more clinical settings, with larger sample sizes, and with the addition of control groups.
Nevertheless, the present findings appear promising, and additional investigation of this Boston Bedside Quantitative Sensory Testing Battery has the potential to contribute to advancing NP research. Future studies should assess which of these tests may be ideal for phenotyping and which could determine predictors of therapeutic success.
Appendix
Table A1.
Laboratory-based and bedside QST equipment information: Bedside QST equipment details
| Tool | Description | Vendor/Address | URL |
|---|---|---|---|
| Von Frey nylon monofilaments | 6-piece kit (sizes 2.83, 3.61, 4.31, 4.56, 5.07, 6.65) | North Coast Medical Inc., Morgan Hill, CA, USA | https://www.ncmedical.com/item_1278.html |
| Plastic probe | Plastic end of Von Frey monofilament | North Coast Medical Inc., Morgan Hill, CA, USA | https://www.ncmedical.com/item_1278.html |
| Foam brush | 1 inch wide, 2.5-inch bristle | Fisher Scientific, Hampton, NH, USA | https://www.fishersci.com/shop/products/1-polyurthn-wood-hndl-foam-bru/501112328#? keyword=foam+brush |
| Neurotip | Single-use sharp pins of 40 g force | Hopkins, Emporia, KS, USA | https://www.hopkinsmedicalproducts.com/diabetic-supplies/p/Neuropen-Neurotips/ |
| Stainless steel rod | 3/8-inch diameter, custom size 0’6” | MetalsDepot, Winchester, KY, USA | https://www.metalsdepot.com/stainless-steel-products/stainless-steel-round |
| Bowl for ice and cold water | 0.21 kg | Fisher Scientific, Hampton, NH, USA | https://www.fishersci.co.uk/shop/products/polypropylene-bowl-5/10098680 |
| Electric water kettle | 1.0 L max capacity, white K2070Y | Proctor Silex, Glen Allen, VA, USA | https://www.target.com |
QST = quantitative sensory testing.
Table A2.
Laboratory-based QST equipment details
| Tool | Description | Vendor/Address | URL |
|---|---|---|---|
| Digital Pressure Algometer/Handheld FPX Algometer | Range = 0–4,000 kPa/10 × 0.01 kgf | Somedic SenseLab, Sosdala, Sweden/Wagner Instruments, Riverside, CT, USA | |
| DFNS PinPrick Stimulators | Weighted pinpricks (used 128-mN and 256-mN probes) | MRC Systems, Heidelberg, Germany | https://www.mrc-systems.de/en/products/pinprick |
| Q-Sense | Computer-controlled, portable system for thermal testing | Medoc, Ramat Yishai, Israel | https://medoc-web.com/products/q-sense/ |
| Rapid cuff inflator | Pressure range = 0–300 mmHg | Hokanson, Bellevue, WA, USA | http://hokansonvascular.com/products/133448 |
| Thermo Neslab RTE-17/Thermo Scientific circulating water bath | Temperature range = –10oC to 100oC, 115V | Cole-Parmer Scientific Experts, Vernon Hills, IL, USA | https://www.coleparmer.com/i/thermo-scientific-sc100-a10-5l-circulating-bath-10-to-100c-115v/1212610? PubID=MP&persist=True&ip=no&gclid=Cj0KCQiAtbnjBRDBARIsAO3zDl-0NiXcAd2AmzhG3WG6c4fZldSr3kBrBkCZkZy_n-I5IuAteSpOa-saAor1EALw_wcB |
QST = quantitative sensory testing.
Contributor Information
Alexandra E Koulouris, Department of Anesthesiology, Harvard Medical School, Brigham & Women’s Hospital, Boston, Massachusetts.
Robert R Edwards, Department of Anesthesiology, Harvard Medical School, Brigham & Women’s Hospital, Boston, Massachusetts.
Kathleen Dorado, Department of Anesthesiology, Harvard Medical School, Brigham & Women’s Hospital, Boston, Massachusetts.
Kristin L Schreiber, Department of Anesthesiology, Harvard Medical School, Brigham & Women’s Hospital, Boston, Massachusetts.
Asimina Lazaridou, Department of Anesthesiology, Harvard Medical School, Brigham & Women’s Hospital, Boston, Massachusetts.
Sharika Rajan, Department of Neurology, Harvard Medical School, Beth Israel Deaconess Medical Center, Boston, Massachusetts, USA.
Jeffrey White, Department of Neurology, Harvard Medical School, Beth Israel Deaconess Medical Center, Boston, Massachusetts, USA.
Jenniffer Garcia, Department of Neurology, Harvard Medical School, Beth Israel Deaconess Medical Center, Boston, Massachusetts, USA.
Christopher Gibbons, Department of Neurology, Harvard Medical School, Beth Israel Deaconess Medical Center, Boston, Massachusetts, USA.
Roy Freeman, Department of Neurology, Harvard Medical School, Beth Israel Deaconess Medical Center, Boston, Massachusetts, USA.
Funding sources: This work was supported by National Institutes of Health grant R21DA041020. None of the authors have any financial or nonfinancial conflicts of interest with regard to this study or its findings.
References
- 1. Colloca L, Ludman T, Bouhassira D, et al. Neuropathic pain. Na Rev Dis Prim 2017;3(1):17002. [DOI] [PMC free article] [PubMed] [Google Scholar]
- 2. Jensen TS, Baron R, Haanpää M, et al. A new definition of neuropathic pain. Pain 2011;152(10):2204–5. [DOI] [PubMed] [Google Scholar]
- 3. Van Hecke O, Austin SK, Khan RA, et al. Neuropathic pain in the general population: A systematic review of epidemiological studies. Pain 2014;155(4):654–62. [DOI] [PubMed] [Google Scholar]
- 4. Smith BH, Torrance N.. Epidemiology of neuropathic pain and its impact on quality of life. Curr Pain Headache Rep 2012;16(3):191–8. [DOI] [PubMed] [Google Scholar]
- 5. Dworkin RH, O'Connor AB, Backonja M, et al. Pharmacologic management of neuropathic pain: Evidence-based recommendations. Pain 2007;132(3):237–51. [DOI] [PubMed] [Google Scholar]
- 6. Baron R, Förster M, Binder A.. Subgrouping of patients with neuropathic pain according to pain-related sensory abnormalities: A first step to a stratified treatment approach. Lancet Neurol 2012;11(11):999–1005. [DOI] [PubMed] [Google Scholar]
- 7. Edwards RR, Dworkin RH, Turk DC, et al. Patient phenotyping in clinical trials of chronic pain treatments: IMMPACT recommendations. Pain 2016;157(9):1851–71. [DOI] [PMC free article] [PubMed] [Google Scholar]
- 8. Bosma RL, Cheng JC, Rogachov A, et al. Brain dynamics and temporal summation of pain predicts neuropathic pain relief from ketamine infusion. Anesthesiology 2018;129(5):1015–24. [DOI] [PubMed] [Google Scholar]
- 9. Bouhassira D, Attal N, Fermanian J, et al. Development and validation of the neuropathic pain symptom inventory. Pain 2004;108(3):248–57. [DOI] [PubMed] [Google Scholar]
- 10. Freynhagen R, Tölle TR, Gockel U, et al. The painDETECT project—far more than a screening tool on neuropathic pain. Curr Med Res Opin 2016;32(6):1033–57. [DOI] [PubMed] [Google Scholar]
- 11. Bennett MI, Smith BH, Torrance N, et al. The S-LANSS score for identifying pain of predominantly neuropathic origin: Validation for use in clinical and postal research. J Pain 2005;6(3):149–58. [DOI] [PubMed] [Google Scholar]
- 12. Timmerman H, Steegers MAH, Huygen FJPM, et al. Investigating the validity of the DN4 in a consecutive population of patients with chronic pain. PLoS One 2017;12(11):e0187961. [DOI] [PMC free article] [PubMed] [Google Scholar]
- 13. Galer BS, Jensen MP.. Development and preliminary validation of a pain measure specific to neuropathic pain: The Neuropathic Pain Scale. Neurology 1997;48(2):332–8. [DOI] [PubMed] [Google Scholar]
- 14. Bouhassira D, Attal N.. Diagnosis and assessment of neuropathic pain: The saga of clinical tools. Pain 2011;152(3 Suppl):S74–83. [DOI] [PubMed] [Google Scholar]
- 15. Bennett MI, Attal N, Backonja MM, et al. Using screening tools to identify neuropathic pain. Pain 2007;127(3):199–203. [DOI] [PubMed] [Google Scholar]
- 16. Hansson P, Backonja M, Bouhassira D.. Usefulness and limitations of quantitative sensory testing: Clinical and research application in neuropathic pain states. Pain 2007;129(3):256–9. [DOI] [PubMed] [Google Scholar]
- 17. Backonja M-M, Walk D, Edwards RR, et al. Quantitative sensory testing in measurement of neuropathic pain phenomena and other sensory abnormalities. Clin J Pain 2009;25(7):641–7. [DOI] [PubMed] [Google Scholar]
- 18. Edwards RR, Sarlani E, Wesselmann U, et al. Quantitative assessment of experimental pain perception: Multiple domains of clinical relevance. Pain 2005;114(3):315–9. [DOI] [PubMed] [Google Scholar]
- 19. Andrasinova T, Adamova B, Buskova J, et al. Is there a correlation between degree of radiologic lumbar spinal stenosis and its clinical manifestation? Clin Spine Surg 2018;31(8):E403–8. [DOI] [PubMed] [Google Scholar]
- 20. Frey-Law LA, Bohr NL, Sluka KA, et al. Pain sensitivity profiles in patients with advanced knee osteoarthritis. Pain 2016;157(9):1988–99. [DOI] [PMC free article] [PubMed] [Google Scholar]
- 21. Pfau DB, Rolke R, Nickel R, et al. Somatosensory profiles in subgroups of patients with myogenic temporomandibular disorders and fibromyalgia syndrome. Pain 2009;147(1–3):72–83. [DOI] [PubMed] [Google Scholar]
- 22. Hurtig IM, Raak RI, Kendall SA, et al. Quantitative sensory testing in fibromyalgia patients and in healthy subjects: Identification of subgroups. Clin J Pain 2001;17(4):316–22. [DOI] [PubMed] [Google Scholar]
- 23. Backonja MM, Attal N, Baron R, et al. Value of quantitative sensory testing in neurological and pain disorders: NEUPSIG consensus. Pain 2013;154(9):1807–19. [DOI] [PubMed] [Google Scholar]
- 24. Freeman R, Baron R, Bouhassira D, et al. Sensory profiles of patients with neuropathic pain based on the neuropathic pain symptoms and signs. Pain 2014;155(2):367–76. [DOI] [PubMed] [Google Scholar]
- 25. O'Leary H, Smart KM, Moloney NA, et al. Pain sensitization associated with nonresponse after physiotherapy in people with knee osteoarthritis. Pain 2018;159(9):1877–86. [DOI] [PubMed] [Google Scholar]
- 26. Jamison RN, Mei A, Edwards RR, et al. Efficacy of vibrating gloves for chronic hand pain due to osteoarthritis. Pain Med 2018;19(5):1044–57. [DOI] [PubMed] [Google Scholar]
- 27. Yuan Z, Liu H, Zhang X, et al. From interaction to co-association—a Fisher R-to-Z transformation-based simple statistic for real world genome-wide association study. PloS One 2013;8(7):e70774. [DOI] [PMC free article] [PubMed] [Google Scholar]
- 28. Pfau DB, Geber C, Birklein F, et al. Quantitative sensory testing of neuropathic pain patients: Potential mechanistic and therapeutic implications. Curr Pain Headache Rep 2012;16(3):199–206. [DOI] [PubMed] [Google Scholar]
- 29. Greenspan JD, Ohara S, Sarlani E, et al. Allodynia in patients with post-stroke central pain (CPSP) studied by statistical quantitative sensory testing within individuals. Pain 2004;109(3):357–66. [DOI] [PubMed] [Google Scholar]
- 30. Casanova-Molla J, Grau-Junyent JM, Morales M, et al. On the relationship between nociceptive evoked potentials and intraepidermal nerve fiber density in painful sensory polyneuropathies. Pain 2011;152(2):410–8. [DOI] [PubMed] [Google Scholar]
- 31. Geber C, Baumgärtner U, Fechir M, et al. Comparison of LEP and QST and their contribution to standard sensory diagnostic assessment of spinal lesions: A pilot study. Neurol Sci 2011;32(3):401–10. [DOI] [PubMed] [Google Scholar]
- 32. Yarnitsky DM. Quantitative sensory testing. In: Cervero F, Jensen T, eds. Handbook of Clinical Neurology. New York, NY: Elsevier; 2006:397–409. [DOI] [PubMed]
- 33. Baumgärtner U, Magerl W, Klein T, et al. Neurogenic hyperalgesia versus painful hypoalgesia: Two distinct mechanisms of neuropathic pain. Pain 2002;96(1–2):141–51. [DOI] [PubMed] [Google Scholar]
- 34. Bouhassira D, Attal N, Willer JC, et al. Painful and painless peripheral sensory neuropathies due to HIV infection: A comparison using quantitative sensory evaluation. Pain 1999;80(1–2):265–72. [DOI] [PubMed] [Google Scholar]
- 35. Bair E, Gaynor S, Slade GD, et al. Identification of clusters of individuals relevant to temporomandibular disorders and other chronic pain conditions: The OPPERA study. Pain 2016;157(6):1266–78. [DOI] [PMC free article] [PubMed] [Google Scholar]
- 36. Demant DT, Lund K, Vollert J, et al. The effect of oxcarbazepine in peripheral neuropathic pain depends on pain phenotype: A randomised, double-blind, placebo-controlled phenotype-stratified study. Pain 2014;155(11):2263–73. [DOI] [PubMed] [Google Scholar]
- 37. Demant DT, Lund K, Finnerup NB, et al. Pain relief with lidocaine 5% patch in localized peripheral neuropathic pain in relation to pain phenotype: A randomised, double-blind, and placebo-controlled, phenotype panel study. Pain 2015;156(11):2234–44. [DOI] [PubMed] [Google Scholar]
- 38. Holbech JV, Bach FW, Finnerup NB, et al. Pain phenotype as a predictor for drug response in painful polyneuropathy—a retrospective analysis of data from controlled clinical trials. Pain 2016;157(6):1305–13. [DOI] [PubMed] [Google Scholar]
- 39. Finnerup NB, Sindrup SH, Jensen TS.. The evidence for pharmacological treatment of neuropathic pain. Pain 2010;150(3):573–81. [DOI] [PubMed] [Google Scholar]
- 40. Bouhassira D, Wilhelm S, Schacht A, et al. Neuropathic pain phenotyping as a predictor of treatment response in painful diabetic neuropathy: Data from the randomized, double-blind, COMBO-DN study. Pain 2014;155(10):2171–9. [DOI] [PubMed] [Google Scholar]
- 41. Attal N, Bouhassira D, Baron R, et al. Assessing symptom profiles in neuropathic pain clinical trials: Can it improve outcome? Eur J Pain 2011;15(5):441–3. [DOI] [PubMed] [Google Scholar]
- 42. Schliessbach J, Siegenthaler A, Bütikofer L, et al. Predicting drug efficacy in chronic low back pain by quantitative sensory tests. Eur J Pain 2018;22(5):973–88. [DOI] [PubMed] [Google Scholar]
- 43. Fields HL, Rowbotham M, Baron R.. Postherpetic neuralgia: Irritable nociceptors and deafferentation. Neurobiol Dis 1998;5(4):209–27. [DOI] [PubMed] [Google Scholar]
- 44. Baron R, Maier C, Attal N, et al. Peripheral neuropathic pain: A mechanism-related organizing principle based on sensory profiles. Pain 2017;158(2):261–72. [DOI] [PMC free article] [PubMed] [Google Scholar]
- 45. Cruz-Almeida Y, Fillingim RB.. Can quantitative sensory testing move us closer to mechanism-based pain management? Pain Med 2014;15(1):61–72. [DOI] [PMC free article] [PubMed] [Google Scholar]
- 46. Walk D, Sehgal N, Moeller-Bertram T, et al. Quantitative sensory testing and mapping: A review of nonautomated quantitative methods for examination of the patient with neuropathic pain. Clin J Pain 2009;25(7):632–40. [DOI] [PubMed] [Google Scholar]
- 47. Paisley A. A comparison of the Neuropen against standard quantitative sensory‐threshold measures for assessing peripheral nerve function. Diabet Med 2002;19(5):400–5. [DOI] [PubMed] [Google Scholar]
- 48. Bouhassira D, Lantéri-Minet M, Attal N, et al. Prevalence of chronic pain with neuropathic characteristics in the general population. Pain 2008;136(3):380–7. [DOI] [PubMed] [Google Scholar]
- 49. Gierthmühlen J, Schneider U, Seemann M, et al. Can self-reported pain characteristics and bedside test be used for the assessment of pain mechanisms? An analysis of results of neuropathic pain questionnaires and quantitative sensory testing. Pain 2019;160(9):2093–104. [DOI] [PubMed] [Google Scholar]
- 50. Felix ER, Widerstrüm-Noga EG.. Reliability and validity of quantitative sensory testing in persons with spinal cord injury and neuropathic pain . J Rehabil Res Dev 2009;46(1):69–83. [PubMed] [Google Scholar]