Abstract
The skin is a multi-layered organ equipped with appendages (i.e. follicles and glands) critical for regulating bodily fluid retention and temperature, guarding against external stresses, and mediating touch and pain sensation1,2. Reconstruction of appendage-bearing skin in cultures and in bioengineered grafts remains an unmet biomedical challenge3–9. Here, we report an organoid culture system that generates complex skin from human pluripotent stem cells. We use step-wise modulation of the TGFβ and FGF signalling pathways to co-induce cranial epithelial cells and neural crest cells within a spherical cell aggregate. During 4–5 months incubation, we observe the emergence of a cyst-like skin organoid composed of stratified epidermis, fat-rich dermis, and pigmented hair follicles equipped with sebaceous glands. A network of sensory neurons and Schwann cells form nerve-like bundles that target Merkel cells in organoid hair follicles, mimicking human touch circuitry. Single-cell RNA-sequencing and direct comparison to foetal specimens suggest that skin organoids are equivalent to human facial skin in the second-trimester of development. Moreover, we show that skin organoids form planar hair-bearing skin when grafted on nude mice. Together, our results demonstrate that nearly complete skin can self-assemble in vitro and be used to reconstitute skin in vivo. We anticipate skin organoids will be foundational to future studies of human skin development, disease modelling, or reconstructive surgery.
Culture systems containing epidermal and dermal cells have been used to model human skin outside of the body for research or clinical uses for over 40 years7,8,10; however, growing functional skin appendages in these systems has been persistently difficult. We recently reported that appendage-bearing skin organoids can be generated via directed differentiation of epidermal and dermal cells from mouse pluripotent stem cells (PSCs)3. From this study, we recognised that a 3D cyst composed of surface ectoderm (i.e. epidermal precursors) enveloped by mesenchymal cells (i.e. dermal precursors) can self-organize and mimic cell-to-cell signalling mechanisms critical for hair follicle (HF) development.
Induction of human skin organoids
Here, we sought to co-induce surface ectodermal and mesenchymal cells from human PSCs (hPSCs; Fig. 1a). As a starting point, we revisited our group’s human inner ear organoid induction method9, which yields epidermal keratinocytes and mesenchymal tissues as off-target by-products. Human embryonic stem cells (hESCs; WA25 cell line) were dissociated into single cells and plated on U-bottom 96-well plates to create uniform cell aggregates. We then transferred the aggregates to new plates containing a differentiation medium with key factors to promote epidermal induction: Matrigel, bone morphogenetic protein-4 (BMP), and a transforming growth factor beta (TGFβ) inhibitor, SB431542 (SB; Fig. 1b, Extended Data Fig. 1a, Supplementary Note). TGFβ inhibition promotes ectoderm induction from pluripotent stem cells, whereas BMP activation promotes surface ectoderm (alternatively, non-neural ectoderm) induction and suppresses neuroectoderm induction9–12. This differentiation strategy produced uniform epithelial cysts, ~500–1000 μm in diameter (Extended Data Fig. 1c). These results were replicable using a Desmoplakin (DSP)-GFP human induced-PSC (hiPSC) line, in which desmosomes in the epithelium are GFP+ (Extended Data Fig. 1c). However, over long-term culture (>60 days), epidermal cysts never displayed higher-order skin morphology, such as stratified keratinocyte layers. Therefore, we sought stimuli to co-induce fibroblasts.
Figure 1 |. Surface ectoderm and CNCC co-induction leads to hair-bearing skin generation.
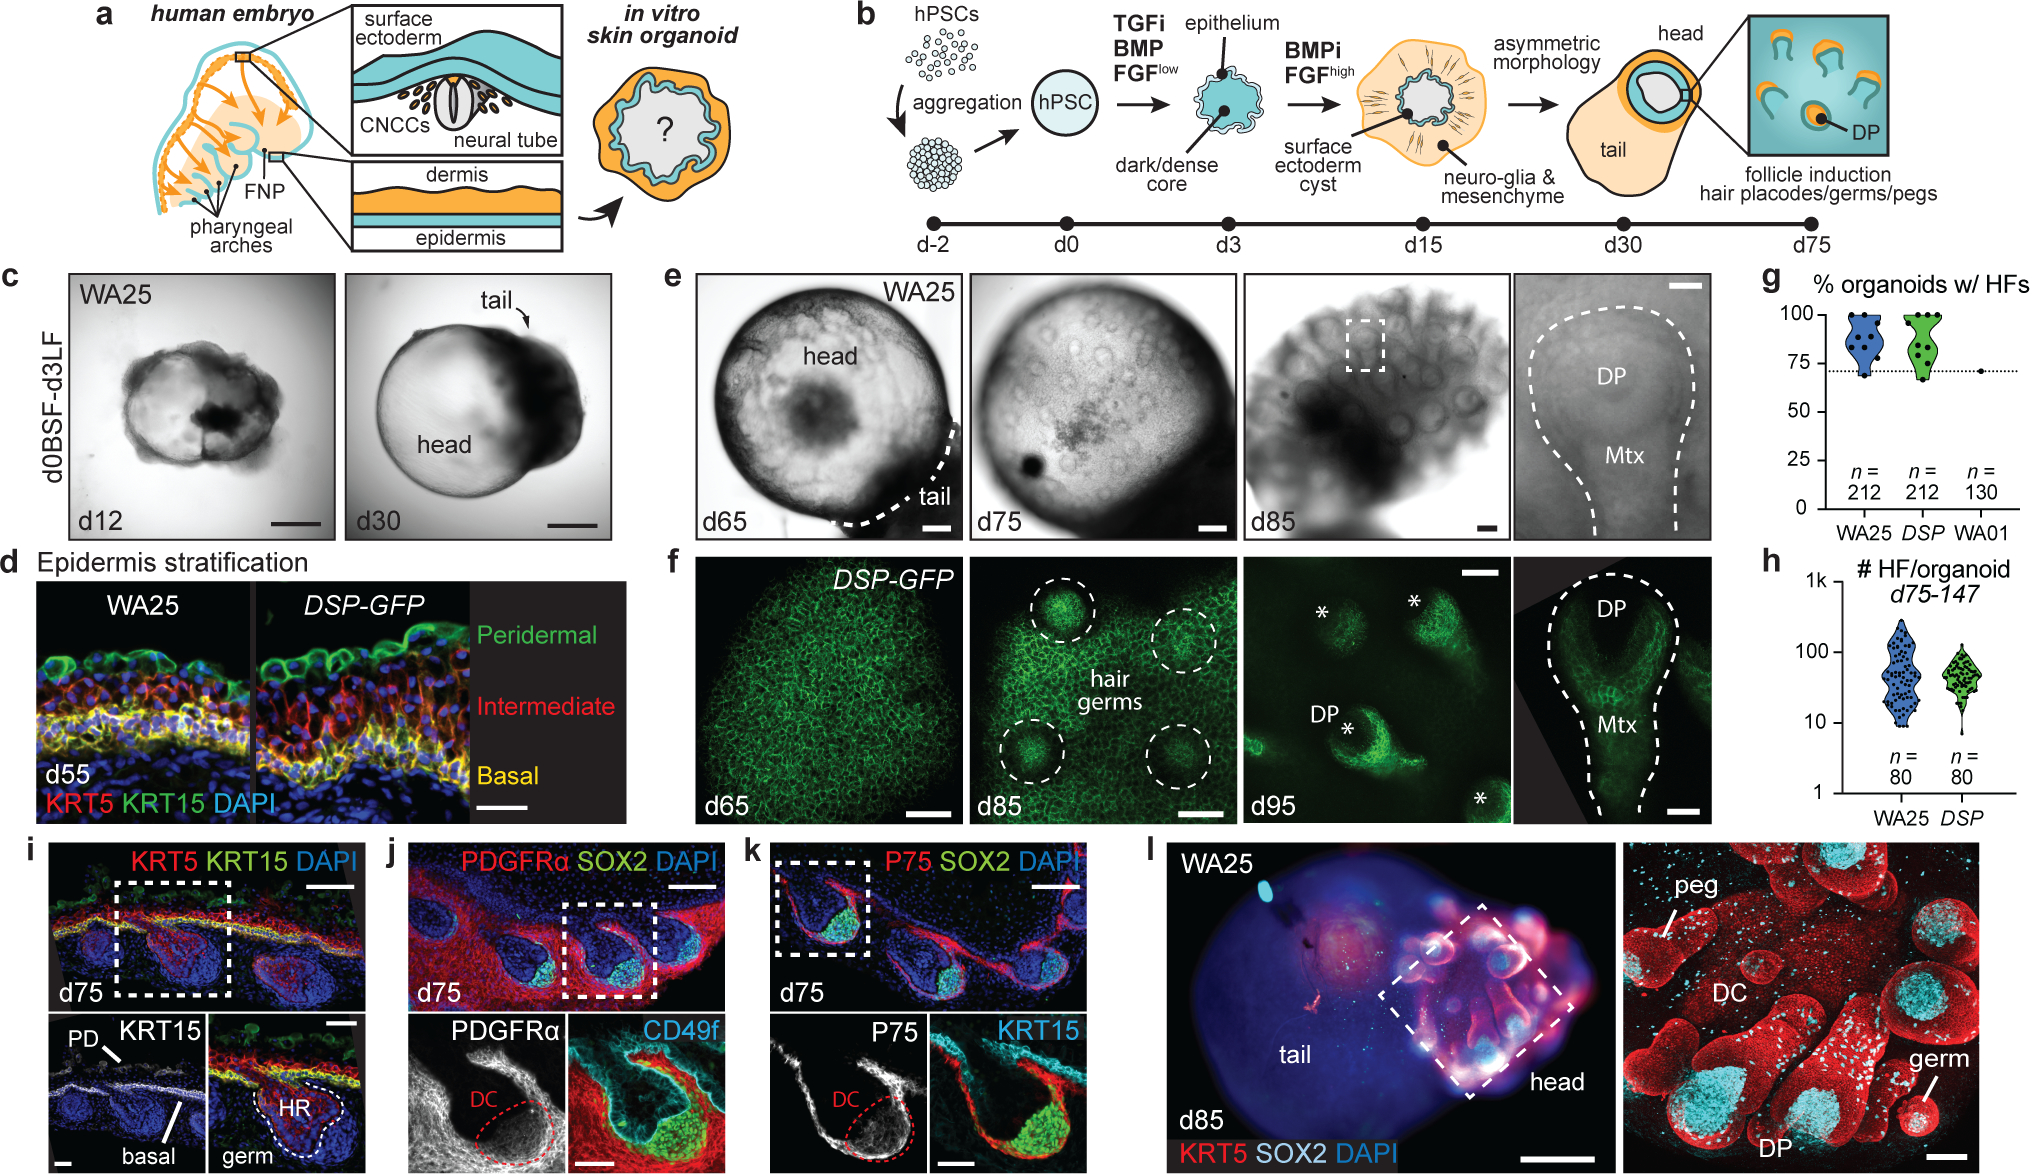
a, b, Overview of (a) study objectives and (b) skin organoid (SkO) protocol. c, Brightfield images of WA25 aggregates on days 12 and 30 in optimized culture. d, Immunostaining for KRT5+KRT15+ basal and KRT15+ peridermal layers at day-55. e, f, Representative HF-induction images (e) in brightfield of days 65–85 WA25 SkOs and (f) max-intensity confocal image (endogenous DSP-GFP) of days 65–95 DSP-GFP SkO. Dashed-box: magnified-HF; dashed-line: HF; dashed-circles: developing hair germs; asterisks: dermal papilla. g, h, Violin plots showing (g) frequencies of HF-formation in WA25 (average 87.4%, min=68.8%, max=100%, n=212 organoids), DSP-GFP (average 87.2%, min=66.7%, max=100%, n=212 organoids), and WA01 (71%, n=130 organoids) cultures, and (h) average number of HFs formed in WA25 (average 64 HFs/organoid, min=9, max=285, n=80 organoids) and DSP-GFP (average 48 HFs/organoid, min=7, max=128, n=80 organoids) cultures between days 75–147. i-k, Immunostained day-75 WA25 SkO with hair placodes. Antibodies highlight epidermal (KRT5+KRT15+CD49f+) and periderm (KRT15+) layers, dermis (PDGFRα+P75+), and DC cells (SOX2+PDGFRα+P75+). Dashed-boxes: magnified-regions. l, Wholemount of day-85 WA25 SkO with head-tail structures. KRT5 highlights epidermis and HF outer root sheath. SOX2 marks DC, DP, Merkel cells and melanocytes. Dashed-box: area shown to the right. Abbr: frontonasal prominence (FNP); cranial neural crest cells (CNCCs); dermal papilla (DP); matrix (Mtx); periderm (PD); hair root (HR); dermal condensate (DC). Scale: 500 μm (c), 250 μm (l; left), 100 μm (e; first three panels, f; third-panel, i-k; upper-panels), 50 μm (d, f; second-panel, i-k; lower-panels, l; right), 25 μm (e; last-panel, f; first/last-panels). See Statistics and Reproducibility for plot and experimental information.
Dermal fibroblasts have two embryonic origins: mesoderm cells (body and scalp skin) and cranial neural crest cells (CNCC; facial skin)13,14. In our inner ear culture system, we determined that a co-treatment of basic-FGF (FGF) and a BMP inhibitor, LDN-193189 (LDN) promotes induction of CNCC-like cells that can generate mesenchymal cells; however, we did not previously investigate dermal cell specification in the system9. Here, we optimized the timing of LDN/FGF treatment to day-3 of differentiation, which reproducibly generated epithelial cysts that were enveloped by CNCC-like cells (Fig. 1c, Extended Data Fig. 1c and 2). To mature the organoids, we incubated them with constant agitation on an orbital shaker. By day-16, the LDN/FGF-treated organoids consisted of an inner mantle of TFAP2A+ECAD+ epithelial cells surrounded by an outer layer of migratory TFAP2A+ CNCC-like cells (Extended Data Fig. 2). Within the cell mass, there appeared to be two sub-types of CNCC-like cells expressing either the mesenchyme-associated marker PDGFRα or the neuro-glial-associated markers SOX10 and P75 (Extended Data Fig. 2)15,16. Clearly being visible from day-18, both WA25 and DSP-GFP organoids gradually became bipolar, with the epidermal cyst partitioned to one pole (hereafter, the head) and an opaque cell mass on the opposite pole (hereafter, the tail; Fig. 1c, Extended Data Fig. 1c). After ~50 days of culture, the epithelium stratified into KRT5+KRT15+ basal, KRT5LOW intermediate (suprabasal), and KRT15+ periderm-like layers, suggestive of higher-order skin morphogenesis (Fig. 1d).
Human HFs typically develop between days 63–70 of gestation (Extended Data Fig. 1b); thus, we waited over 70 days for skin organoids to reach a hair-bearing stage. Surprisingly, after a period of quiescence (days 50–70), hair germ-like buds began extending radially outward from the organoid surface (Fig. 1e, f, Extended Data Fig. 3). On average, hair germs appeared at 70 ± 5 days for WA25 and 72 ± 4 days for DSP-GFP organoids. Through 120 days, we observed HF induction from batch-to-batch and across cell lines (87.4% WA25 and 87.2% DSP-GFP organoids with HFs; Fig. 1g, Extended data Fig. 3a, b, Supplementary Table 1a). Hair-bearing skin organoid generation was not restricted to these cell lines or the Koehler laboratory. For protocol validation, hair-bearing skin organoids were generated from the WA01 hESC line in the Heller laboratory (70.8% organoids with HFs; Fig. 1g, Extended data Fig. 3c). By manual counting, we estimated an average of 64 HFs per WA25 and 48 HFs per DSP-GFP organoid (Fig. 1h). As in nascent mouse HFs, immunostaining revealed that epidermal germ cells were LHX2+PCAD+EDAR+, and dermal condensates were SOX2+PDGFRα+P75+ (Fig. 1i–l, Extended Data Fig. 4). The transcription factor SOX2 was expressed in every dermal papilla (DP) cell cluster examined (Fig. 1i–l, Supplementary Video 1, 2), consistent with human foetal HFs and mouse guard, awl, and auchene HFs17. These data show that skin organoid HFs undergo morphogenesis similar to mammalian HFs. Moreover, organoid HFs are periodically spaced throughout the epidermis suggesting that appendage patterning mechanisms are preserved in organoids18.
The organoids have craniofacial identity
To gain insight into the cell lineages arising in skin organoids, we performed single-cell RNA-sequencing (scRNA-seq) on WA25 and DSP-GFP organoids after a week (day-6; 23,329 cells) and one month (day-29; 18,190 cells) of differentiation. For both timepoints, WA25 and DSP-GFP datasets were integrated to identify differences and similarities in cellular composition (Fig. 2; see Supplementary Data 1–6 for detailed analysis). At day-6, unbiased clustering identified 23 sub-types, which we manually annotated into four major cell groups: epithelial (~59%), neuro-glial (~8%), mesenchymal (~8%), and actively cycling cells (~25%) (Fig. 2b, Extended Data Fig. 5). All cell sub-types were present in WA25 and DSP-GFP organoids, but in different proportions (Fig. 2b, c), suggesting further protocol optimization may be needed to reduce variability19. The largest group, epithelial cells, consisted of EPCAM+TFAP2A+ cells expressing markers of nascent surface ectoderm (HAND1+), epidermal progenitors (WNT6+TP63+), and anterior (SIX1+PAX6+DLX5+) and posterior (SIX1+PAX8+GBX2+) cranial placodes (Fig. 2a–d, Extended Data Fig. 5)11,20. Within the neuro-glial group, PAX6+HES5+ neuroectoderm-like cells clustered near PLP1+SOX10+PAX3+ CNCC-like cells (Fig. 2d), suggesting that CNCC arise from a neuroectoderm intermediate11. The mesenchymal group contained NR2F1+MEF2C+TWIST1+, consistent with CNCC-derived mesenchyme capable of generating dermal cells (Fig. 2d, Extended Data Fig. 5)21. No cell clusters expressed early markers of the endoderm or mesoderm lineages, such as SOX17 or TBXT. These data show that skin organoids emerge from anatomically diverse cranial ectoderm cell populations.
Figure 2 |. Single-cell RNA-sequencing reveals gene expression signatures of craniofacial skin development.
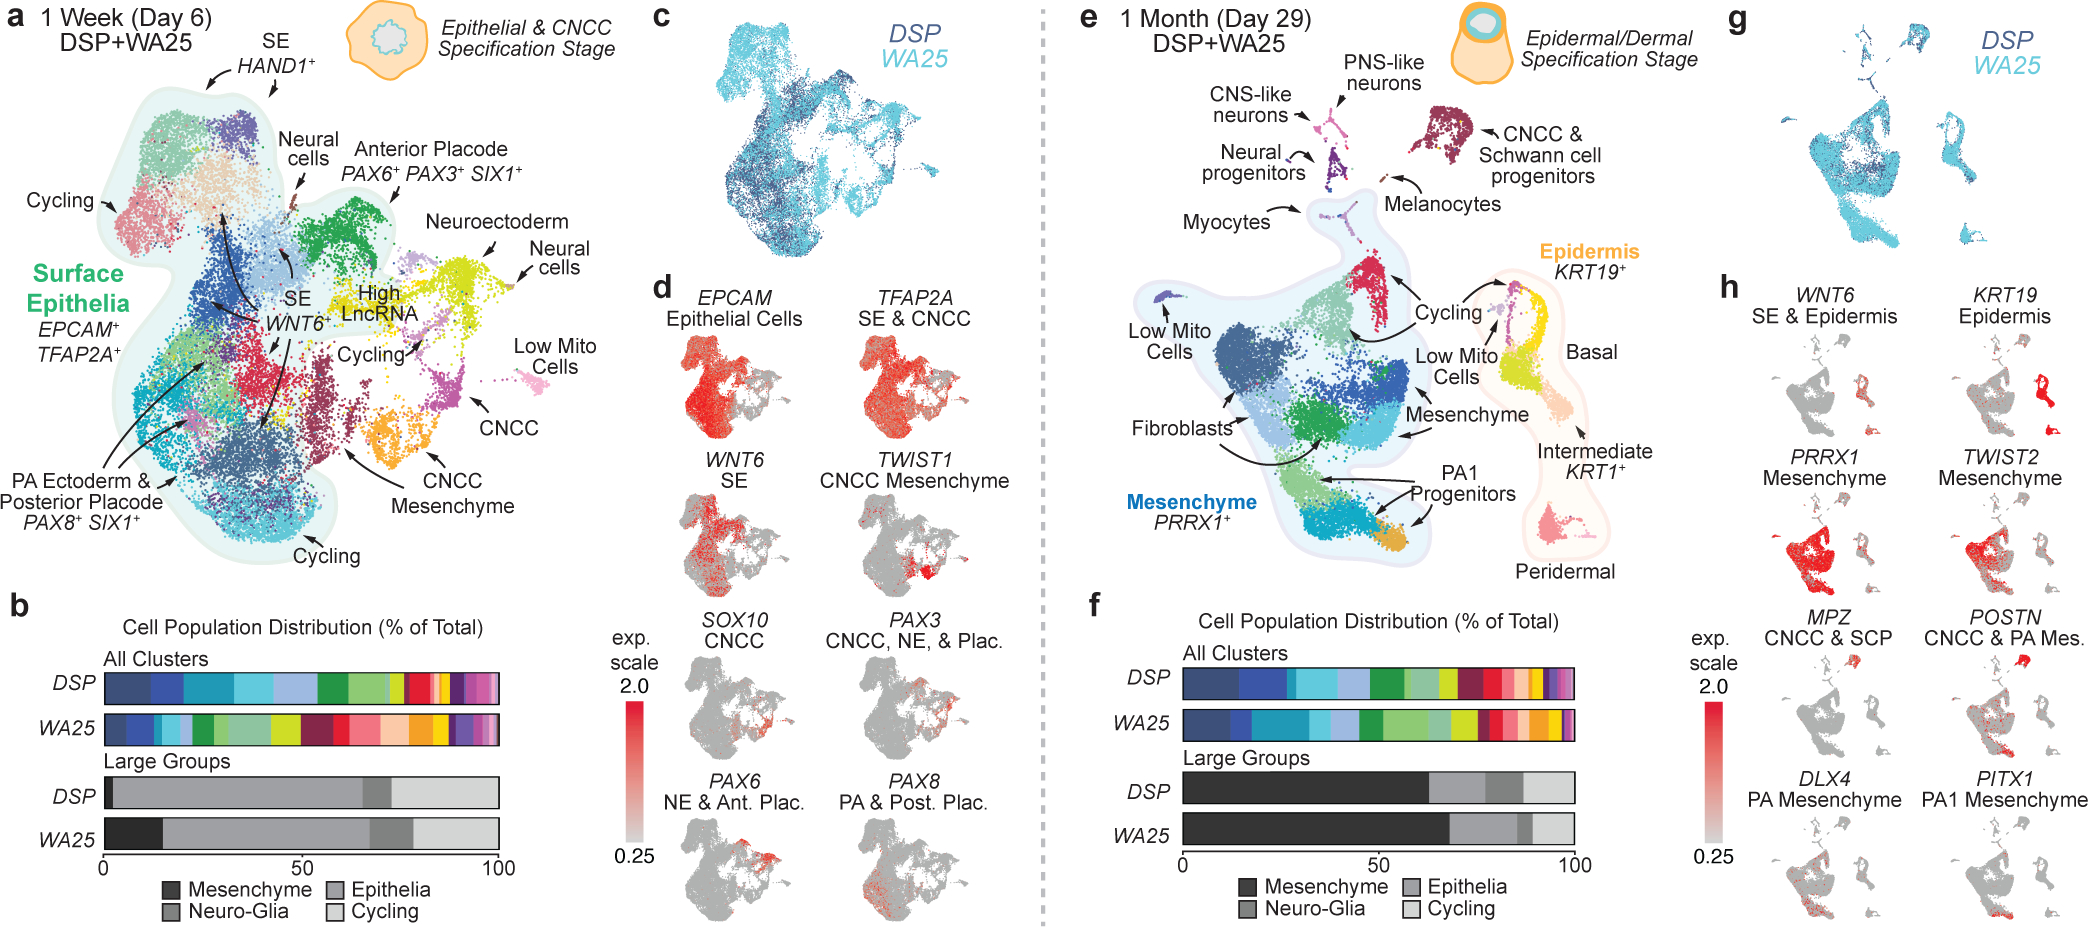
a, e, Uniform manifold approximation projections (UMAP) of day-6 and day-29 WA25 and DSP-GFP integrated datasets. Data represent (a) 23,239 cells and (e) 18,190 cells. The major cell cluster groupings of surface epithelia, epidermis, and mesenchyme and presumptive cell identities, based on a priori knowledge, are noted. b, f, Percentage distribution of all cell clusters (color-coded to match panels a and e) and large groups consisting of mesenchymal, epithelial, neuro-glial, and cycling cells. c, g, Overlay UMAP plots comparing cells from DSP-GFP and WA25 datasets. d, h, Key gene markers for cell subtype classification and determination of anterior-posterior patterning. Clusters with no discernable identity had either low mitochondrial or high long non-coding RNA gene expression and are labeled “Low Mito Cells” and “High LncRNA”, respectively. Abbr: pharyngeal arch (PA).
Clustering analysis at day-29 revealed mesenchymal cells as the dominant cell group (~70%) over epithelial (~17%), neuro-glial (~7%), and actively cycling (~6%) cell groups (Fig. 2e–h, see Supplementary Data 4–6 for detailed analysis). The epithelial group contained three epidermal sub-clusters: CXCL14+ basal, KRT1+ intermediate, and KRT4+ peridermal keratinocytes (Fig. 2e, Extended Data Fig. 5)22. Any remaining surface ectoderm progenitors or placodal cells were undetectable. The neuro-glial group contained clusters of Schwann cell precursor cell (SCP)-like cells (PLP1+MPZ+), as well as melanocytes (PMEL+MITF+) (Fig. 2h, Extended Data Fig. 5). Neural clusters contained cells expressing SOX2 (neural progenitors), DCX (CNS neurons) or PRPH (PNS neurons) (Extended Data Fig. 5)23. The mesenchymal group contained ten distinct PRRX1+ populations, including dermal fibroblast-like subtypes expressing TRIL, TWIST2, APCDD1, and PAX1 (Fig. 2h, Extended Data Fig. 5)24. Other mesenchyme clusters contained cells expressing DLX genes, reminiscent of pharyngeal arch (PA) or frontonasal process CNCC-derived mesenchymal cells (Fig. 2h, Extended Data Fig. 5)13. Interestingly, these clusters also had cells expressing PITX1, BARX1, GSC, and HAND2; markers of the first PA, which gives rise to the jaw and outer/middle ear during development (Fig. 2h)25. Furthermore, we noted a lack of HOX gene expression, which would indicate more caudal PAs (Extended Data Fig. 5)26. These data suggest that skin organoids may develop a distinct anatomical identity reminiscent of chin, cheek, and outer ear skin, despite early indication at day-6 of broad anterior-posterior patterning. The mesenchymal group also contained a small subset of TNNT1+MYOG+ myocyte-like cells, suggesting potential off-target mesoderm induction (Extended Data 5e, f, Supplementary Data 6). We did not, however, detect progenitors for other lineage cells, such as Langerhans cells, which are resident skin immune cells.
We performed additional scRNA-seq on day-48 WA25 organoids. In these data, we saw more definitive markers of the dermal lineage compared to day-29. In particular, five VIM+ clusters contained cells expressing DPT, TWIST2 and LUM, as well as numerous collagen genes, such as COL1A1/2, COL3A1, COL5A3, COL6A3, COL12A1, and COL21A1 (Extended Data Fig. 6a–d, see Supplementary Data 7 for detailed analysis)24. Additionally, we gained insight into self-organizing signalling mechanisms that may be governing interactions between the epidermal and dermal layers. Genes encoding WNT signalling pathway modulators were differentially expressed between epidermal (WNT6, LEF1) and dermal (SFRP2, TCF4, WIF1, APCDD1) cell populations (Extended Data Fig. 6d, e)27. Presumptive dermal cells expressed FGF7 (Keratinocyte Growth Factor), which may be a key driver of epidermal stratification in this system (Extended Data Fig. 6f)28,29. These data show that skin organoids generate diverse cell populations consistent with embryonic skin.
HF pigment, layering, and innervation
After >100 days in culture, skin organoids had the morphology illustrated in Fig. 3a. The external appearance of skin organoids was comparable to 18-week human foetal skin viewed from the dermal-side (Fig. 3b, c). Remarkably, organoid HFs were often pigmented, which led us to closely examine melanocyte development (Fig. 3b, d–g, Extended Data Fig. 7a, c, d–g). In pigmented skin organoids, we found premelanosome protein (PMEL)+ melanocytes evenly distributed throughout the epithelium and concentrated in the matrix region of HFs (Fig. 3d, e, Supplementary Video 3). Electron microscopy confirmed production of melanosomes in melanocytes of the epidermis and HFs (Fig. 3f, Extended Data Fig. 7a, c). An average of 53.5% WA25 and 76.2% DSP-GFP organoids produced pigmented HFs (Fig. 3g). Using immunostaining and electron microscopy, we found the organoid HFs had most of the unique cellular HF layers except the medulla layer, characteristic of adult terminal HFs, suggesting that the skin organoids produce lanugo or vellus-like HFs (Fig. 3h–k, see Supplementary Discussion on HF type)30. Another interesting feature of late-stage organoids was hyaline cartilage, which developed in the tail region (Fig. 3a, b, Extended Data Fig. 8). ACAN+COL9A1–3+ chondral progenitors were evident in our day-48 scRNA-seq dataset (Extended Data Fig. 8). Additionally, lipid-rich adipocytes developed around organoid HFs, mimicking the development of hypodermal fat (Fig. 3b, c, Extended Data Fig. 9)14. These data reinforce a tissue architecture model whereby skin organoids represent craniofacial skin (superficial tissue) and cartilage (deep tissue) developing inside-out.
Figure 3 |. Skin organoid HF pigmentation, structure, and neural innervation.
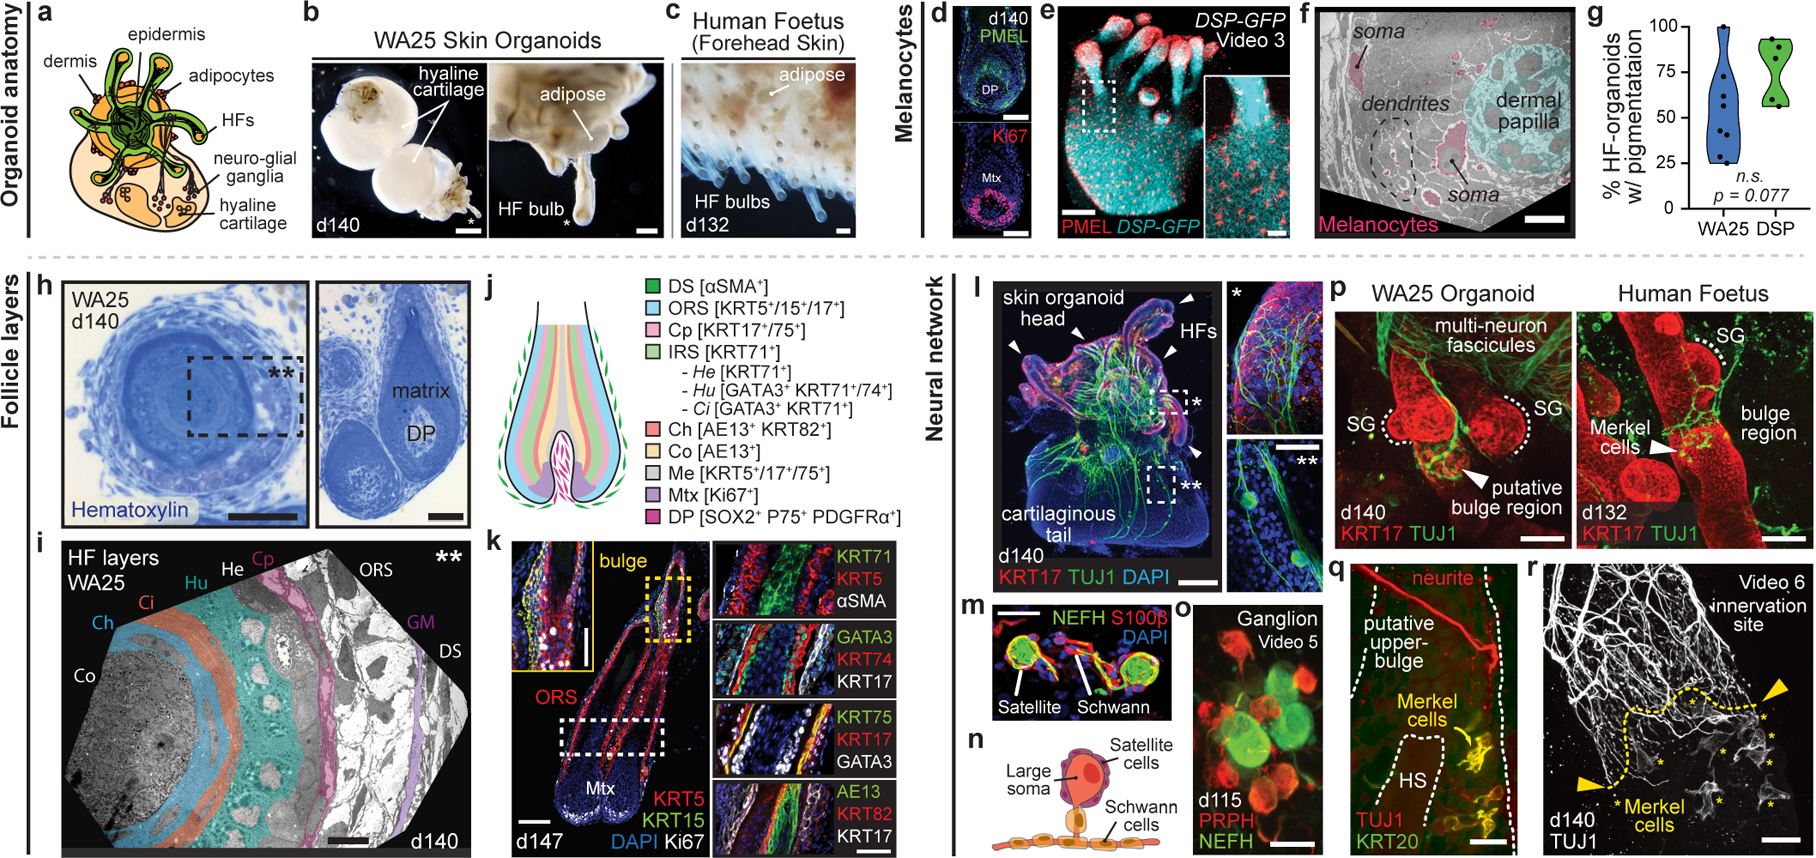
a-c, Skin organoid (SkO) anatomy: (a) Schematic; typical SkO. (b, c), Darkfield-images; (b) day-140 WA25 SkOs; cartilage in organoid-tail and (c) 18-week human foetal skin. d-g, Melanocytes: (d) PMEL/Ki67 immunostaining; WA25 organoid-HFs and (e) PMEL+ melanocytes in DSP-GFP organoid-HFs and -epithelium. (f) Transmission electron microscopy (TEM); matrix-associated melanocytes (pink). (g) Violin plots compare HF-pigmentation frequency between WA25 (average=53.5%, min=25%, max=100%, n=137 organoids) and DSP-GFP (average=76.2%, min=56.3%, max=93.3%, n=91 organoids); Welch’s two-sided t-test, p=0.077. h-k, HF-layers: (h) Hematoxylin-staining; day-140 WA25 HFs. Dashed-box: region in (i) TEM; HF-layers. (j) Schematic; human HF-layers. (k) Immunostaining for markers in (j) on day-147 organoid-HFs; each layer from outermost ⍺SMA+ DS to innermost AE13+ Co. l-r, Neural network: (l) KRT17/TUJ1 wholemount; neurons in day-140 WA25 SkO. Magnified-area with asterisks: neurites targeting (*) HF-bulge and (**) neuron-soma. Arrowheads: HF-clusters. (m) Neurofilament-heavy chain (NEFH)-positive neurons with S100β+ satellite glial and Schwann cells. (n) Schematic; typical SkO-neurons. (o) Wholemount of day-115 WA25 SkO; ganglion with PRPH+NEFH− and PRPHLOWNEFH+ neurons. (p) Wholemount for TUJ1/KRT17; (left) day-140 WA25 SkO and (right) 18-week human foetus-forehead skin; neurites innervate HF-upper-bulge. HF-SGs noted. (q, r) TUJ1/KRT20 wholemount on day-140 WA25 SkOs; TUJ1+ neurites innervate HF-upper-bulge above TUJ1+KRT20+ (yellow) Merkel cells. (r) High-magnification of innervation site. Yellow-asterisks: Merkel cells. Abbr: hair shaft (HS); dermal sheath (DS); glassy membrane (GM); outer root sheath (ORS); companion (Cp); inner root sheath (IRS); Henle’s (He); Huxley’s (Hu); IRS-cuticle (Ci); cuticle (Ch); cortex (Co); medulla (Me); sebaceous gland (SG). Scale: 250 μm (b; upper, l; left), 100 μm (b; lower, c, e, k; left), 50 μm (d, h; right, k; insert and right-panels, p), 25 μm (e; insert, h; left, l; right-panels, m, o, q, r), 10 μm (f, i). See Statistics and Reproducibility for statistics and experimental information.
Next, we investigated whether the neuro-glial cells identified by scRNA-seq at day-29 matured into organized nervous tissue. In 100% of the organoids examined (>30 organoids; 7 experiments), we discovered a network of ISL1+ βIII-Tubulin (TUJ1)+ axons interwoven between HFs (Fig. 3l, p–r, Extended Data Fig. 7h, Supplementary Videos 2, 4–6). The organoid neurons were reminiscent of NC-derived neurons found in cranial or dorsal root ganglia, with medium-large soma Neurofilament-Heavy Chain (NEFH)+ Peripherin (PRPH)+ neurons and smaller soma NEFH−PRPH+ neurons (Fig. 3o, Supplementary Video 7)23,31. The most salient neuronal morphology was consistent with NEFH+ pseudounipolar neurons, reminiscent of Aβ/δ-LTMRs or proprioceptors (Fig. 3m, n)31. These neurons formed fascicles that were associated with S100β+ Schwann-like cells and satellite glia-like cells covering the neuron cell bodies (Fig. 3m, Extended Data Fig. 7i). In large ganglia (>10 neurons), we identified a subset of Parvalbumin (PVALB)+ neuron somas, indicative of proprioceptors (Extended Data Fig. 7j)31. In day >125 organoids, neuronal processes contacted the skin organoid epithelium and wrapped around HFs, much like the immature circumferential and lanceolate nerve endings of HFs in the 18-week human foetus (Fig. 3l, p–r, Supplementary Videos 5, 6). KRT20+TUJ1+ Merkel cells were located in the outer root sheath of HFs near the site of axon targeting, which we presume to be the bulge region of the HFs (Fig. 3q, r, Supplementary Video 5). Merkel-like cells expressing key marker genes, such as ATOH1, KRT8/18, SOX2, and ISL1, were also identified in our day-48 scRNA-seq dataset (Extended Data Fig. 6g)32. Our data suggest that skin organoids form nascent mechanosensitive touch complexes33,34. Additional molecular and physiological profiling will be necessary to determine whether other somatosensory neuron subtypes and nerve endings can be induced in skin organoids.
Organoids form planar skin in vivo
After ~150 days in culture, we observed a build-up of squamous cells in the core of skin organoids (Extended Data Fig. 9b) and abnormal HF morphologies, suggesting that this timepoint may be the upper limit for skin organoid culture. Thus, we tested whether skin organoids could integrate into endogenous skin in a mouse model (Fig. 4a). On day 140, we removed the cartilaginous tails with tungsten needles (Fig. 4b) and implanted hair-bearing WA25 skin organoids in small 1–2 mm incisions in the back skin of nude mice35. Remarkably, we observed 2–5 mm hairs growing out from 55% of the xenografts (15 of 27 xenografts, 3 experiments; Fig. 4c–e). The other grafts had in-grown hairs (22%) or failed (22%) due to technical issues (Fig. 4c). None of the grafts displayed ulceration or other signs of uncontrolled tumour-like growth. For out-grown xenografts, histology confirmed that the organoid epidermis had integrated with the host epidermis, and the hair shafts were oriented perpendicular to the skin surface, reminiscent of bona-fide human skin tissue (Fig. 4f, g). We noted that the out-grown xenograft epidermis had a cornified layer and Rete ridge-like structures comparable to adult facial skin (Fig. 4g, h). In addition, CD49f+ vasculature had grown into the xenografts (Fig. 4g). Our findings demonstrate that cystic skin organoids can unfurl and integrate into planar skin at a wound site.
Figure 4 |. Skin organoids undergo cystic-to-planar transition when xenografted.
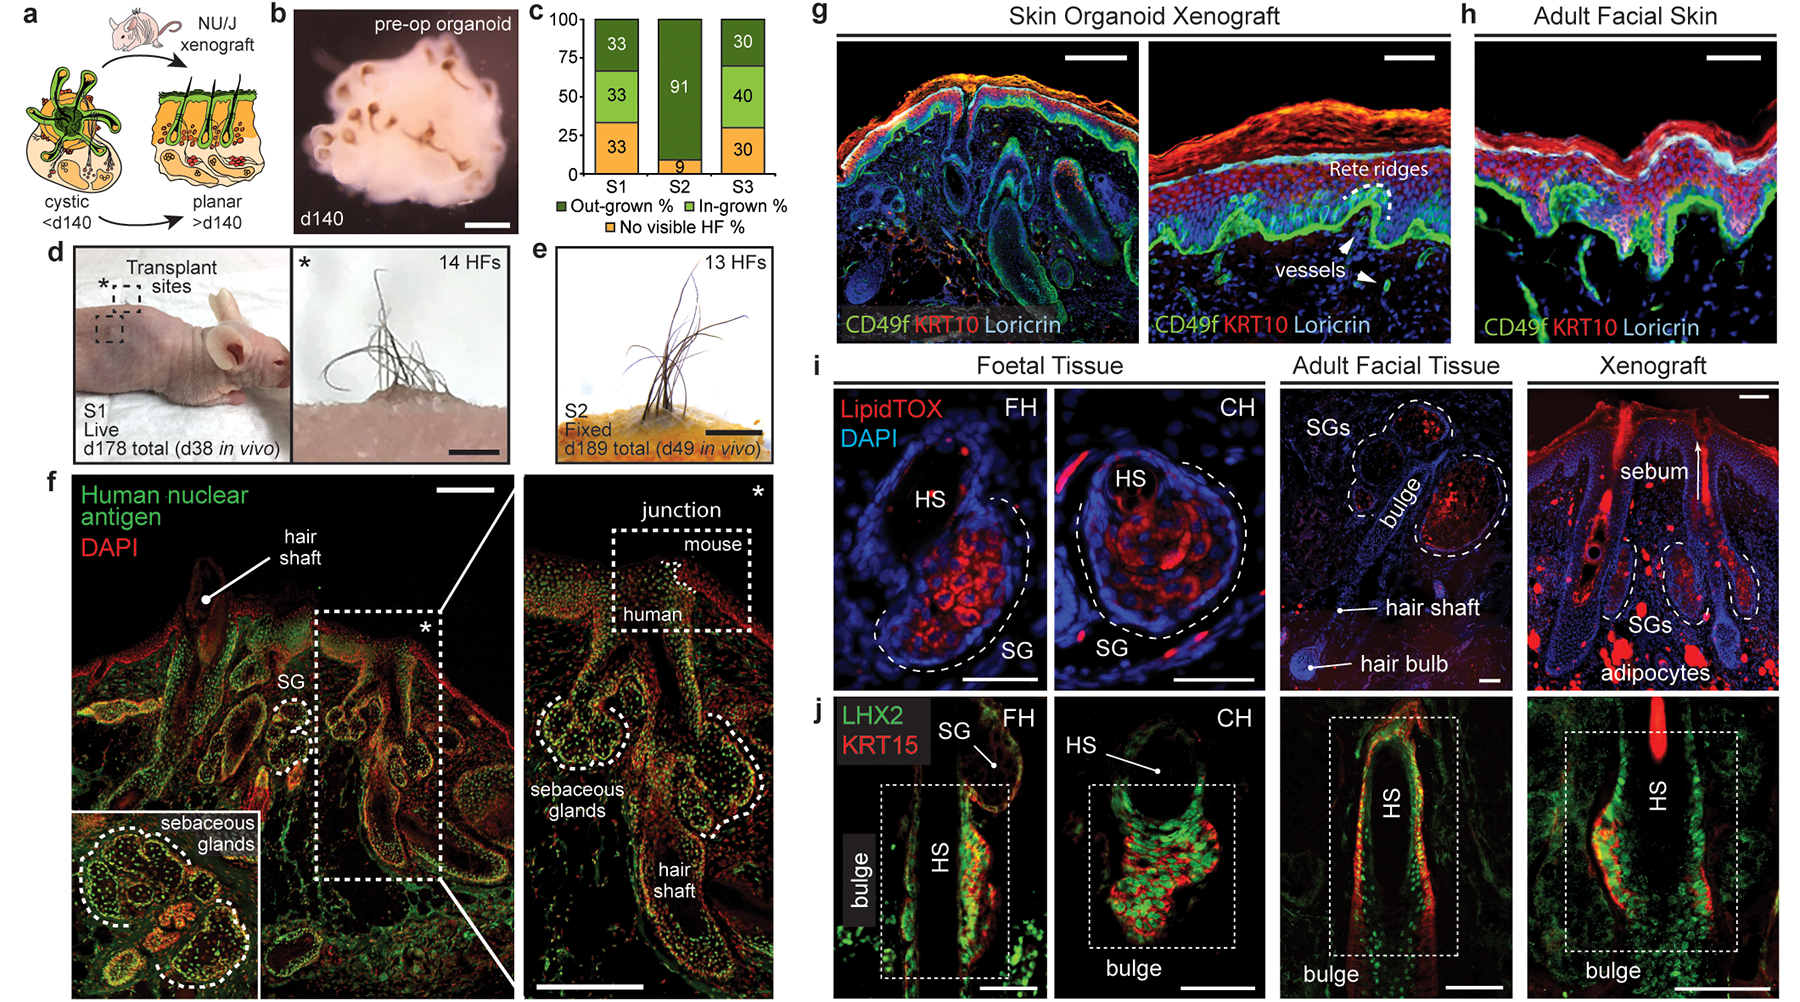
a, Schematic of skin organoid (SkO) xenografting strategy. b, Darkfield image of day-140 WA25 SkO prior to grafting (pre-operative; pre-op). c, Quantification of HF-growth percentage throughout xenograft experiments. Data compiled from 27 xenografts performed over 3 separate experiments/surgeries (S1, S2, S3). d, A xenografted NU/J mouse at 38-days post-operative (PO) following the first experiment (S1); total 178-days-old SkO. Pigmented hair shafts are visible at both graft sites, highlighted by boxes. One graft site (right) shows 14 HFs. e, S2 xenograft containing out-grown pigmented-hairs at 49-days PO; total 189-days-old SkO. f, Immunostaining for Human nuclear antigen and DAPI in out-grown xenograft. Note mouse and human epidermis junction (right). Organoid-HFs have SGs. g, h, Comparison of epidermis layers between (g) SkO-xenograft and (h) adult facial skin by immunostaining for CD49f (basal), KRT10 (intermediate), and Loricrin (granular). Unspecific staining above Loricrin+ granular layer is cornified layer. Note Rete ridges in xenograft and adult skin. Arrowheads; vessels. i, j Comparison of (i) LipidTOX+ SGs and (j) LHX2+KRT15+ putative bulge stem cells at HF-bulge region in (left) foetal forehead and cheek, (middle) adult facial, and (right) xenograft. (i) LipidTOX also labeled adipocytes. Dashed-lines; SGs. (j) Dashed-boxes: HF-bulge. Abbr: operative (OP); forehead (FH); cheek (CH). Scale: 1 mm (d; right, e), 200 μm (b, f, g; left), 100 μm (i & j; Adult & Xenograft), 50 μm (g; right, h, i & j; Foetal). See Statistics and Reproducibility for experimental information.
Finally, we examined out-grown xenografted HFs for two hallmarks of mature pilosebaceous units: sebaceous glands and bulge stem cells. We detected sebaceous glands containing SCD1+ cells in all xenografted HFs (Fig. 4i, Extended Data Fig. 9d, d’). Organoid sebocytes had sebum vacuoles visible using electron microscopy (Extended Data Fig. 9c). Morphologically, xenograft sebaceous glands had multiple lobes similar to adult sebaceous glands and were located superficial to the HF bulge region (Fig. 4i, Extended Data Fig. 9). In the presumptive bulge region of xenografted HFs, we found KRT15+LHX2+NFATC1+ HF stem cell-like cells and Nephronectin (NPNT)+ basement membrane (Fig. 4j, Extended Data Fig. 10d, Supplementary Video 8). The expression pattern of NFATC1 was predominantly cytoplasmic, which was consistent with follicular bulges in foetal skin; by contrast, adult bulge cells displayed nuclear NFATC1 expression, a sign of maturity (Extended Data Fig. 10)2,36. Together, these findings suggest that skin organoid HFs reach a level of maturity roughly equivalent to second trimester foetal hair and have the cellular components for further maturation. Long-term (>1 year) observation will be needed to determine if xenografted follicles convert to a terminal hair fate or maintain a growth cycle in vivo.
Discussion
Our study establishes a novel model to investigate the cellular dynamics of developing human skin and its appendages—including sweat glands, which were absent from the skin organoids reported here. Numerous genetic skin disorders and cancers could be modelled with skin organoids to accelerate drug discovery. Moreover, with additional control of off-target cell lineages, we envision skin organoids being used to reconstitute appendage-bearing skin in burned or wounded patients.
METHODS
hPSC lines and culture.
Culture experiments were performed with the WA25 hESC line (passages 21–47), purchased from WiCell Research Institute, and the Desmoplakin-mEGFP (DSP-GFP) hiPSC line (passages 35–51), acquired from the Allen Institute for Cell Science and the Coriell Institute37. Cells were cultured on 6-well plates coated with Vitronectin Recombinant Human Protein (Invitrogen) at a concentration of 0.5 μg/cm2. Pluripotent stem cells were maintained in Essential 8 Flex (Gibco) medium with 100 μg/ml Normocin (Invivogen; hereafter, E8). The medium was replenished every other day or everyday depending on cell confluency. Cells were passaged at ~80% confluency (generally every 4–5 days): WA25 cells were passaged in tiny clusters with 0.5 mM EDTA, and DSP-GFP cells were passaged as single cells (occasionally in tiny clusters) with StemPro Accutase Cell Dissociation Reagent (hereafter, Accutase; Gibco). Either Accutase exposed or single-celled cells (DSP-GFP) were passaged in E8 medium containing 10 μM Y27632 (hereafter, Y; ROCK inhibitor that inhibits apoptosis, Stemgent). Twenty-four hours following passaging, medium was replenished with fresh E8 medium without Y. Detailed information concerning cell line specifics as well as validation and testing is available at: https://www.wicell.org/home/stem-cells/catalog-of-stem-cell-lines/wa25.cmsx?closable=true and https://www.allencell.org/cell-catalog.html.
Optimized hPSC differentiation.
For differentiation, pluripotent hPSC colonies were detached from the culture dish using Accutase. Once dissociated, hPSCs were collected as a single cell suspension in E8 medium containing 10 μM Y (hereafter, E8–10Y). Cell concentration was determined with an automated cell counter (Countess™ II Automated Cell Counter; Countess II, Life Technologies); Trypan blue (Gibco) was used at a ratio of 1:1 (Trypan blue:cell suspension) to distinguish dead vs. live cells. The appropriate number of live cells needed for an experiment was transferred into E8 medium containing 20 μM Y (hereafter, E8–20Y). From the E8–20Y cell suspension, cells were distributed at a count of 3,500 cells in 100 μl per well into 96-well U-bottom plates (Thermo Scientific). Aggregation was aided by centrifugation at 110 rcf for 6 min. These cell aggregates were incubated in 37°C incubator under 5% CO2 for 48 hrs. Thus, we designated this timepoint as day −2. After 24 hrs incubation (at day −1), fresh 100 μl E8 medium was added to each well in order to dilute out Y and promote cell proliferation and aggregate growth. On day-0, to start differentiation, all cell aggregates were individually collected and transferred to new 96-well U-bottom plates in 100 μl of E6-based differentiation medium containing 2% Matrigel (Corning), 10 μM SB (Stemgent), 4 ng/ml basic-FGF (hereafter, FGF; PeproTech), and 2.5 ng/ml BMP-4 (PeproTech) to initiate non-neural ectoderm formation. On day-3 of differentiation, to induce CNCC formation, 200 ng/ml LDN (BMP inhibitor, Stemgent), and 50 μg/ml of FGF were added in a volume of 25 μl per well, thus making the final volume 125 μl per well. On day-6 of differentiation, 75 μl of fresh E6 medium was added, bringing the final volume to 200 μl. Half of the media was changed (removal of 100 μl spent medium and addition of 100 μl fresh E6 medium) on days 8 and 10. On day-12, in order to induce self-assembly of epidermis, all aggregates were transferred into individual wells of 24-well low-attachment plates (Thermo Scientific) in 500 μl organoid maturation medium (OMM) containing 1% Matrigel. To maintain the aggregates in a floating culture for constant medium circulation, 24-well plates were placed on an orbital shaker shaking at a speed of 65 rpm in the 37°C incubator with 5% CO2. OMM is composed of Advanced DMEM/F12 (Gibco) and Neurobasal (Gibco) media at a 1:1 ratio, 1X GlutaMax™ (Gibco), 0.5X B-27 Minus Vitamin A (Gibco), 0.5X N2 (Gibco) supplements, 0.1 mM 2-Mercaptoethanol (Gibco), and 100 μg/ml Normocin. On differentiation day-15, half of the spent medium was replenished (removal of 250 μl of spent medium and addition of 250 μl fresh medium) with OMM containing 1% Matrigel. Starting from day-18, half-medium was changed every three days (from day-18 to day-45) or every other day (from day-45 to day-150 or longer) with fresh OMM without Matrigel, including once a week full-medium change starting from day-45. Increasing total volume of medium per well to 1 ml was at times necessary from day-80 onward as aggregates mature and grow larger. (See Supplementary Note for additional differentiation protocol information and Supplementary Table 2 for media compositions). A more detailed step-by-step skin organoid induction protocol can be found on the Protocol Exchange38.
Human Foetal and Adult Specimens.
Facial skin tissue from an 18-week miscarried foetus was obtained from the University of Washington Birth Defects Research Laboratory. The tissue was not obtained from a living individual and was de-identified. De-identified adult human facial skin tissue samples were obtained from the Human Skin Disease Resource Centre at Brigham and Women’s Hospital-Harvard Medical School. Informed consent was obtained from all patients (or their legal guardians) who contributed samples used in this study. All specimens qualified for NIH Exemption 4 and were deemed “Non-Human Subjects Research” by the Indiana University School of Medicine IRB.
Skin organoid dissociation for scRNA-seq.
To dissociate WA25 and DSP-GFP into single cells, randomly selected day-6 organoids (n = 10) and day-29 organoids (n = 5) were pooled from each group. For day-48 WA25 cell aggregates, six representative skin organoids were collected, and the tail structure containing non-skin associated mesenchymal and neuronal cells was removed using two tungsten needles prior to dissociation in order to bias analysis toward skin tissue. Briefly, collected organoids were incubated with pre-warmed (37°C) TrypLE™ for total 8–30 min (depending on the organoid sizes and densities) in a 37°C incubator on a shaker at 65 rpm for a gentle swirl. During the incubation, the dissociation mixture was agitated every 3–10 min with gentle pipetting using wide-orifice p1000 and p200 tips (Mettler-Toledo). By total 8–30 min of incubation, the tissue structure dissociated into a single cell suspension with no visible cell aggregation. Cold 3% BSA solution (Sigma-Aldrich) was added to the dissociated cell suspension in order to inactivate TrypLE enzymatic activity. The suspension was filtered through a 40 μm Flowmi™ cell strainer (Bel-Art™) in order to eliminate any debris. An additional three washes with cold 3% BSA solution were performed. Cells were resuspended in 3% BSA and filtered through a 40 μm Flowmi™ cell strainer. Viability (live cell percentage) and live cell count was determined using Trypan Blue (used at 1:1 ratio) and Countess II. Final cell concentration was ~1,000 cells/μl and >90% viability.
scRNA-seq cDNA library preparation and sequencing.
Single cell 3’ RNA-seq experiments were conducted using the Chromium single cell system (10x Genomics, Inc) and the NexSeq500 or NovaSeq 6000 sequencer (Illumina, Inc). Approximately 17,000 cells (targeting for 10, 000 cells) per sample were added to a single cell master mix, following the Chromium Single Cell 3’ Reagent Kits v2 User Guide, CG00052 Ver B (10x Genomics, Inc). Day-6 samples were processed using the Version 3 Chromium Single Cell 3’ Reagent Kits. Along with the single-cell gel beads and partitioning oil in separate wells of a Single Cell A Chip, the single cell reaction mixture was loaded to the Chromium Controller for GEM generation and barcoding, followed by cDNA synthesis and library preparation. At each step, the quality of cDNA and library was examined by Bioanalyzer. The resulting library was sequenced in a custom program for 26b plus 98b paired-end sequencing on an Illumina NextSeq500 or 28b plus 91b paired-end on Illumina NovaSeq 6000 to a read depth of >30,000 reads per cell.
scRNA-seq data analysis.
The 10x Genomics CellRanger 2.1.0 pipeline (http://support.10xgenomics.com/) was used to process raw sequence data. Briefly, CellRanger uses bcl2fastq (https://support.illumina.com/) to demultiplex raw base sequence calls generated from the sequencer into sample-specific FASTQ files. The FASTQ files are then aligned to the reference genome with RNAseq aligner STAR. The aligned reads are traced back to the individual cells and the gene expression level of individual genes are quantified based on the number of UMIs (unique molecular indices) detected in each cell. Filtered gene-cell barcode matrices were generated by CellRanger for further analysis. Cells with extremely high or low number of detected UMIs were excluded from further analysis. In addition, cells with a high percentage of mitochondrial reads were filtered out. After removing unwanted cells, the gene expression levels for each cell were normalized by the total number of UMIs in the cell and multiplied by a scaling factor of 10,000. After log-transformation, we used Seurat 2 for cell clustering using principal component analysis (PCA) on highly variable genes39,40. The cell clusters were visualized using the T-Distributed Stochastic Neighbor Embedding (t-SNE) and Uniform Manifold Approximation and Projection (UMAP) plotting methods. The gene markers for each cluster were identified through differential expression analysis by comparing cells in the cluster to all other cells.
To integrate the single cell data from WA25 and DSP-GFP samples, we applied functions FindIntegrationAnchors and IntegrateData from Seurat v341. The integrated data was then scaled and PCA was performed. Clusters were identified with the Seurat functions FindNeighborsand FindClusters. The FindConservedMarkers function was subsequently used to identify canonical cell type marker genes that are conserved of cells across different samples. Cell cluster identities were manually defined with the cluster-specific marker genes. To compare average gene expression within the same cluster between cells of different samples, we applied function AverageExpression. The cell clusters were visualized using the t-Distributed Stochastic Neighbor Embedding (t-SNE) plots and Uniform Manifold Approximation and Projection UMAP) plots. R packages ggplot2 and ggrepel (https://github.com/slowkow/ggrepel) were used to plot the average gene expression. Violin plots (VlnPlot) and feature plots (FeaturePlot) were used to visualize specific gene expressions across clusters and different sample conditions.
Immunohistochemistry.
For immunostaining, fixed samples were cryoprotected through a graded treatment process of 10, 20, and 30% of Sucrose (Sigma-Aldrich), embedded on cryomolds (Endwin Scientific) in tissue freezing medium (General Data Healthcare), snap frozen at −80°C, and sliced to 12 or 15 μl thickness. Cryosections were blocked in 10% normal goat/horse serum, incubated with primary antibodies diluted in 3% normal goat/horse serum, and then incubated with secondary antibodies in 3% normal goat/horse serum. Unless stated otherwise, images are representative of specimens obtained from at least 3 separate experiments. For IHC analysis of aggregates between days 0–12, we sectioned at least 3–6 aggregates from each condition in each experiment. IHC analysis of later stages of development was performed on at least 3 aggregates from each condition per experiment.
Wholemount immunostaining was performed with a previously published method42 with major adjustments in incubation times to account for reduced tissue size2. In brief, samples were fixed in 4% (v/v) PFA (Electron Microscopy Sciences), permeabilized, descaled, incubated with primary antibodies, incubated with fluorescently labelled secondary antibodies, re-fixed in 4% (v/v) PFA (Electron Microscopy Sciences), and cleared. Microscopy was performed with a Leica DMi8 Inverted Microscope, a Leica TCS SP8 Confocal Microscope, an Olympus FV1000-MPE Confocal/Multiphoton Microscope, and a Nikon A1R HD25 Microscope. Three-dimensional reconstruction was performed with Imaris 8 software package (Bitplane) on computers housed at the Indiana Centre for Biological Microscopy and NIS-Elements analyzer software provided from Nikon. See Supplementary Table 3 for a list of antibodies.
Cell culture quantitative analysis.
Frequency of organoids producing HFs.
Starting from day 75, organoids with protruding hair placodes, germs, pegs, and HFs were counted and recorded. To calculate a percentage of HF production within a culture, the number of HF-produced organoids was divided by the total number of organoids cultured in the experiment and multiplied by a hundred. Percentages of HF formation from nine independent experiments of both WA25 and DSP-GFP cell lines were calculated and averaged to get the general frequency of HF production from each cell line.
Number of HFs produced.
HF numbers generated in both WA25 and DSP-GFP skin organoids were counted manually. From each cell line-derived hairy skin organoid in nine independent experiments, 80 organoids were randomly pooled, and their pictures were taken under Leica M165FC stereo microscope. An angle of each organoid was chosen blinded, and a picture of that view under the microscope was taken. Number of HFs in the image view was quantified by counting the protruded hair bulbs using ImageJ ‘Cell Counter’ plugin function.
Frequency of HF pigmentation.
Among the hair-bearing skin organoids, some HFs were pigmented in dark brown or black in the bulbs and hair shafts, while the rest were albino – white hairs. Pigmentation is visible with naked eyes, but to clearly distinguish pigmented hairs, including faint, pigmentation-initiating HFs from white hairs, organoids were observed under Leica DMi1 without condenser on and/or under Leica M165FC stereo microscope set to dark field illumination. The number of skin organoids containing pigmented HFs was divided by the total number of HF generating organoids within the experiment and multiplied by a hundred to calculate the percentage of pigmented HF formation. Each percentage from eight independent WA25 experiments and five independent DSP-GFP experiments were averaged to determine the HF pigmentation rate of each cell line.
LipidTOX Staining.
LipidTOX Staining (Invitrogen) was performed to visualize sebaceous glands and lipid-rich adipocytes. Cryosections of skin organoids were incubated with LipidTOX neutral lipid stain diluted at a ratio of 1:200 in 1X PBS for 30 min at RT, followed by Hoechst staining (1:2000; Invitrogen) for 1 min at RT to visualize nuclei.
Xenograft Experiments.
In vivo experiments were performed after an approval from the Indiana University Animal Care and Use Committee (IACUC) and complied with federal regulations. For grafting, 5–6-week-old female immunodeficient nude mice (NU/J) purchased from The Jackson Laboratory were used. Prior to surgery, WA25 cell-derived either pigmented or albino hair-bearing skin organoids at varying days – days 113, 115, 120, 124, 127, 140, and 145 – were pooled and prepared; using tungsten needles, tail portion (mesenchymal cells or cartilages) of the organoids was gently removed, and a tiny incision was made on the hairy-skin to increase chances for the organoid core to be exposed and allow hairs to grow outward. The mice were anesthetized under Isoflurane, and Bupiviczaine, a pain reliever, was administered (6 mg/kg) via subcutaneous injection to the intended incision sites on the back of the mice (3–5 incision sites per mouse). About 1–2 mm-sized incisions, of which can fit a hairy-skin organoid, were made, and each hairy-skin organoid prepared ahead was placed on individual incision site by facing hair bulb side inward, contacting muscle layer of the mice, and organoid-incision side outward, being exposed to the air. Sterile gauze was place on top of the mice’s back, covering all graft sites, and tightened with bandage by wrapping around the body of the mice. Then, the bandage was sutured for stability. After the surgery, the mice were provided with Carprofen wet food for pain relief. Dressing was removed 7–9 days post-surgery. The mice were observed for- and sacrificed after- about 7 or 14 weeks of the surgery. Using a scalpel, each area with skin organoid graft was collected at about 3 mm × 5 mm (width × length) size. Collected samples were flattened on a filter paper to inhibit curling effect of the skin edges and fixed in 4% PFA overnight at 4°C with constant gentle agitation.
Analysis of HFs growth in xenografts.
For transplantation, skin organoids containing hairs were selected and grafted between days 113–145 of differentiation. HF protrusion and growth at the grafted sites on the back of mice were monitored until the day mice were sacrificed. Some HFs failed to grow outwards potentially due to imperfect organoid grafting method that the follicle orientation was altered (hair bulbs of organoid facing outward) during the procedure that the hairs grew inward instead and were visible as pigmented dark shade under the skin. Number of grafted sites with protruded hairs (both pigmented and albino) or dark pigmented shade under the skin were counted, divided by the number of initial grafts that were made to calculate the percentage of out-grown, in-grown, or failed grafts.
Statistics and Reproducibility.
No statistical test was used to predetermine sample size, the investigators were not blinded to the treatment groups. In general, experiments were not randomized; however, organoid specimens used for histology and single-cell RNA-sequencing analysis were selected at random and not screened for quality or specific morphological characteristics. All statistics were performed using GraphPad Prism 8 software. Unless stated otherwise data are reported as mean ± SEM. Violin plot limits show maxima and minima, and the dots represent individual data points.
Violin plots in Figure 1g represent frequency of hairy-organoids generation in each of WA25, DSP-GFP, and WA01 culture: WA25; average 87.4 ± 3.5%, min=68.8%, max=100%, 181 hairy-organoids out of total 212 skin organoids across 9 independent experiments, DSP-GFP; average 87.2 ± 4.1%, min=66.7%, max=100%, 177 hairy-organoids out of total 212 skin organoids across 9 independent experiments, WA01; 71%, 92 hairy-organoids out of total 130 skin organoids in one experiment, see Supplementary Table 1). Violin plots in Figure 1h show average number of hair follicles produced within individual skin organoids across 80 specimens that were collected from 9 independent experiments between days 75–147 from both WA25 and DSP-GFP cultures: WA25: average 48 hair follicles per organoid, min=9, max=285; DSP-GFP: average 48 hair follicles per organoid, min=7, max=128. Violin plots in Figure 3g compare frequency of pigmented hair-bearing organoids formation between WA25 and DSP-GFP cultures: WA25; average 53.5 ± 8.8%, min=25%, max=100%, 70 pigmented hairy-organoids out of total 137 hairy-organoids across 8 independent experiments, DSP-GFP; average 76.2 ± 7.6%, min=56.3%, max=93.3%, 72 pigmented hairy-organoids out of total 91 hairy-organoids across 5 independent experiments. Statistical significance was determined in Figure 3g using an unpaired Student’s t-test with Welch’s correction to account for unequal standard deviations and sample sizes, p=0.077. See Cell culture quantitative analysis section for additional information.
All representative skin organoid images shown in this manuscript represent results from nine independent experiments of WA25 and DSP-GFP cultures and one WA01 culture (Figure 1c–f, i–l and Figure 3b, d–f”, h, i, k–m, o–r). The pigmented hairy-organoid image shown in Figure 4b represents one of the 27 pre-operative skin organoids used in 3 independent xenografts experiments, and Figures 4d–j show results from the same experiments. All immunostaining images shown in this manuscript are representative of minimum 3 times of the same staining. Specifically, Figure 1d, i–l and Figure 3k–m, p–r represent 5 independent staining on 3–5 different organoids per staining, and Figure 3d, e, o represent 3 independent staining on 3–5 different organoids per staining. Figure 3f, h, i are representative hair follicle (f, i) TEM and (h) Hematoxylin staining images of 2 separate skin organoids that are on day-140.
The culture method was optimized and replicated by three investigators (K.R.K., J.L., and M.S.) using the WA25 and DSP-GFP cell lines. During preparation of this manuscript, K.R.K. and J.L. contacted S.H. and B.M.W. for assistance validating the skin organoid culture method. S.H. and B.M.W. were provided with a detailed protocol for skin organoid induction with a list of suggested reagents. S.H. and B.M.W. were blinded to the data already generated for this study with WA25 and DSP-GFP PSCs; thus, they were unfamiliar with the expected morphological changes during skin organogenesis. K.R.K. and J.L. provided minimal guidance via email. In his validation experiment, B.M.W. generated 92 hair-bearing skin organoids (out of 130 total organoids) from WA01 (H1) ESCs (see Extended Data Fig. 3c).
Data availability.
Single-cell RNA sequencing data have been uploaded to the Gene Expression Omnibus (Accession code GSE147206): https://www.ncbi.nlm.nih.gov/geo/query/acc.cgi?acc=GSE147206. In the supplementary material, we have provided HTML files that generate an online interface with which to explore our scRNA-seq analysis pipeline and evaluate additional cell cluster markers for the integrated and non-integrated datasets (Supplementary Data 1–7). In addition, the integrated datasets shown in Figure 2 can be queried via a data exploration portal hosted on our laboratory website: https://www.koehler-lab.org/resources. Source data behind Figures 1–4 are available within the manuscript files.
Extended Data
Extended Data Figure 1 |. Overview of skin organoid induction in relation to normal human skin developmental events and its morphological changes under different treatment regimes.
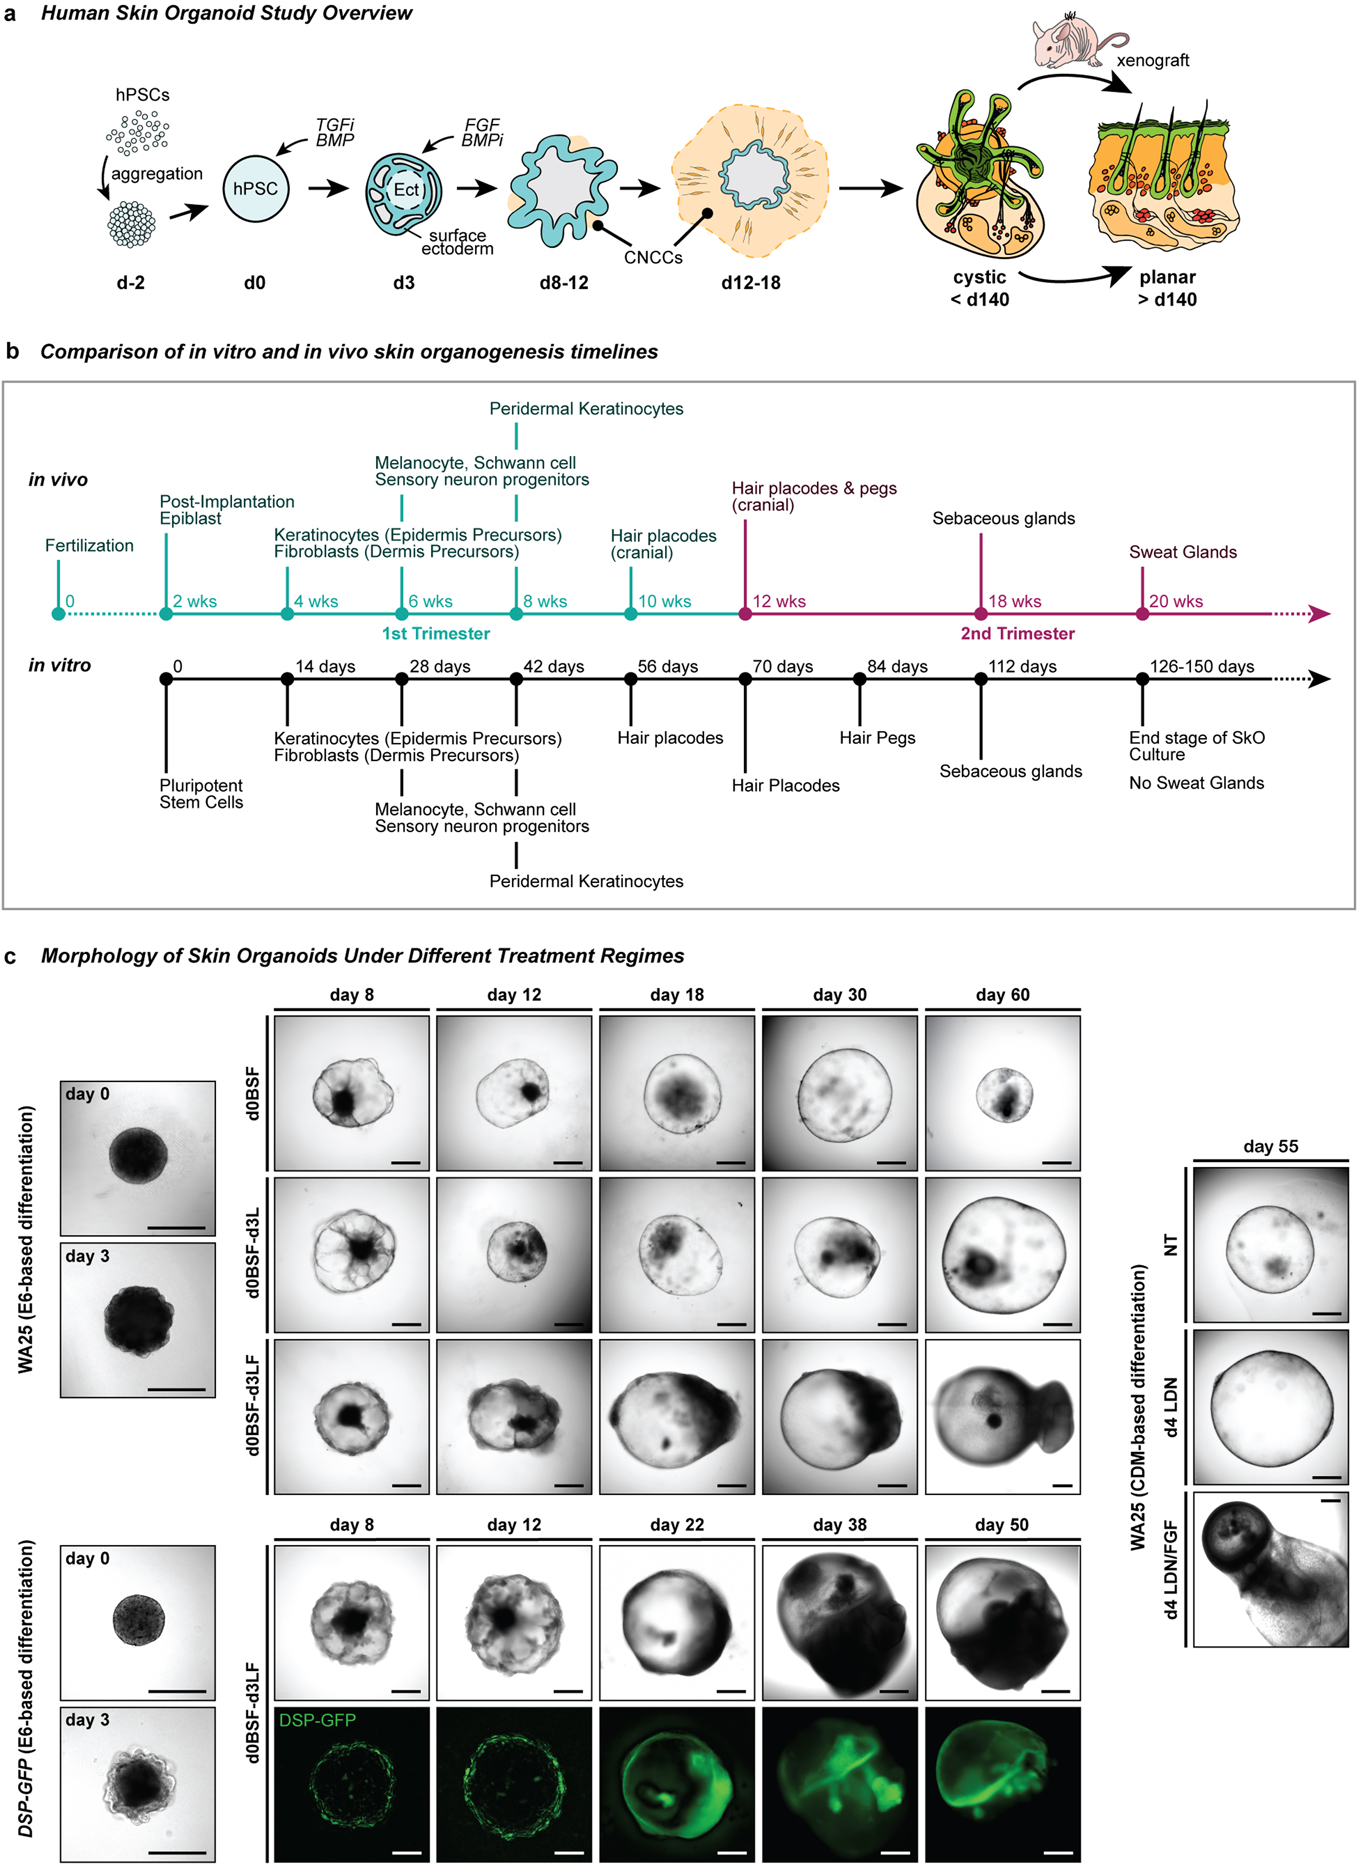
a, Schematic overview of the skin organoid protocol; i) pre-aggregate hPSCs to form an aggregate, ii) induce differentiation of aggregate to form surface ectoderm and cranial neural crest cells (CNCC) by modulating TGF and BMP signaling pathways, and iii) provide sufficient environment for aggregate to mature itself into a complex skin organoid unit composed of fully stratified skin with dermal layer, producing hair follicles, sensory neurons, and cartilages. The cystic skin organoid can be transplanted and integrated into the back skin of a mouse as a planar layer and out-grow hair follicles. b, Comparison of in vitro and in vivo skin development timelines. Note that developmental timing is approximate. c, Representative differential interference contrast (DIC) and endogenous GFP fluorescence images of WA25 and DSP-GFP skin organoids on different days of differentiation under different treatment regimes. (upper) WA25 skin organoid were differentiated in E6-based medium culture under three different day-3 treatment conditions - no LDN nor FGF, LDN only, and LDN/FGF - and monitored during days 0–60. Day-3 no LDN nor FGF treated aggregates maintained cystic organoids for about 30 days of differentiation, but the organoids lost their morphology and shrunk afterwards. Day-3 LDN only treatment promoted cystic morphology, but was not sufficient to produce hair-bearing skin organoids in a consistent manner. Co-treatment of LDN and FGF on day-3 (final optimized treatment condition) was optimal for epithelial stratification and sufficient dermal layer development. Tail-like region containing mesenchymal and neuronal cells on one pole of skin organoids are visible by day-18 of differentiation. (lower) DSP-GFP skin organoids were also differentiated in E6-based medium with day-3 treatment of LDN/FGF (final optimized treatment regime). GFP+ epithelium is visible on the surface/edge of the sphere-like organoid, and the GFP signal intensifies as the organoids differentiate and mature further. The tail portion of the organoid appears by day 22 of differentiation (GFP+ signal at the tail portion presented in the day 22 image is an autofluorescence). (right) WA25 skin organoid were differentiated in CDM-based medium under three different day-4 treatment conditions - no LDN nor FGF, LDN only, and LDN/FGF. By differentiation day-55, aggregates that were treated with neither LDN nor FGF eventually lost their shape and shrunk. Day-4 LDN treatment maintained cystic organoid morphology, and occasionally induced maturation of skin organoids. Co-treatment of LDN and FGF on day-4 of differentiation was suitable for skin organoids to fully mature in a relatively consistent manner. Note: Substitution of CDM- to E6-based differentiation medium improved skin organoid development by reducing the tail portion (non-skin related mesenchymal cells) and increasing the head – skin – portion. Optimization experiments were repeated at least three times independently. Scale bars, 500 μm (all panels).
Corresponds with data/concepts in Fig. 1.
Extended Data Figure 2 |. Surface ectoderm and CNCC induction in WA25 and DSP-GFP skin organoid cultures.
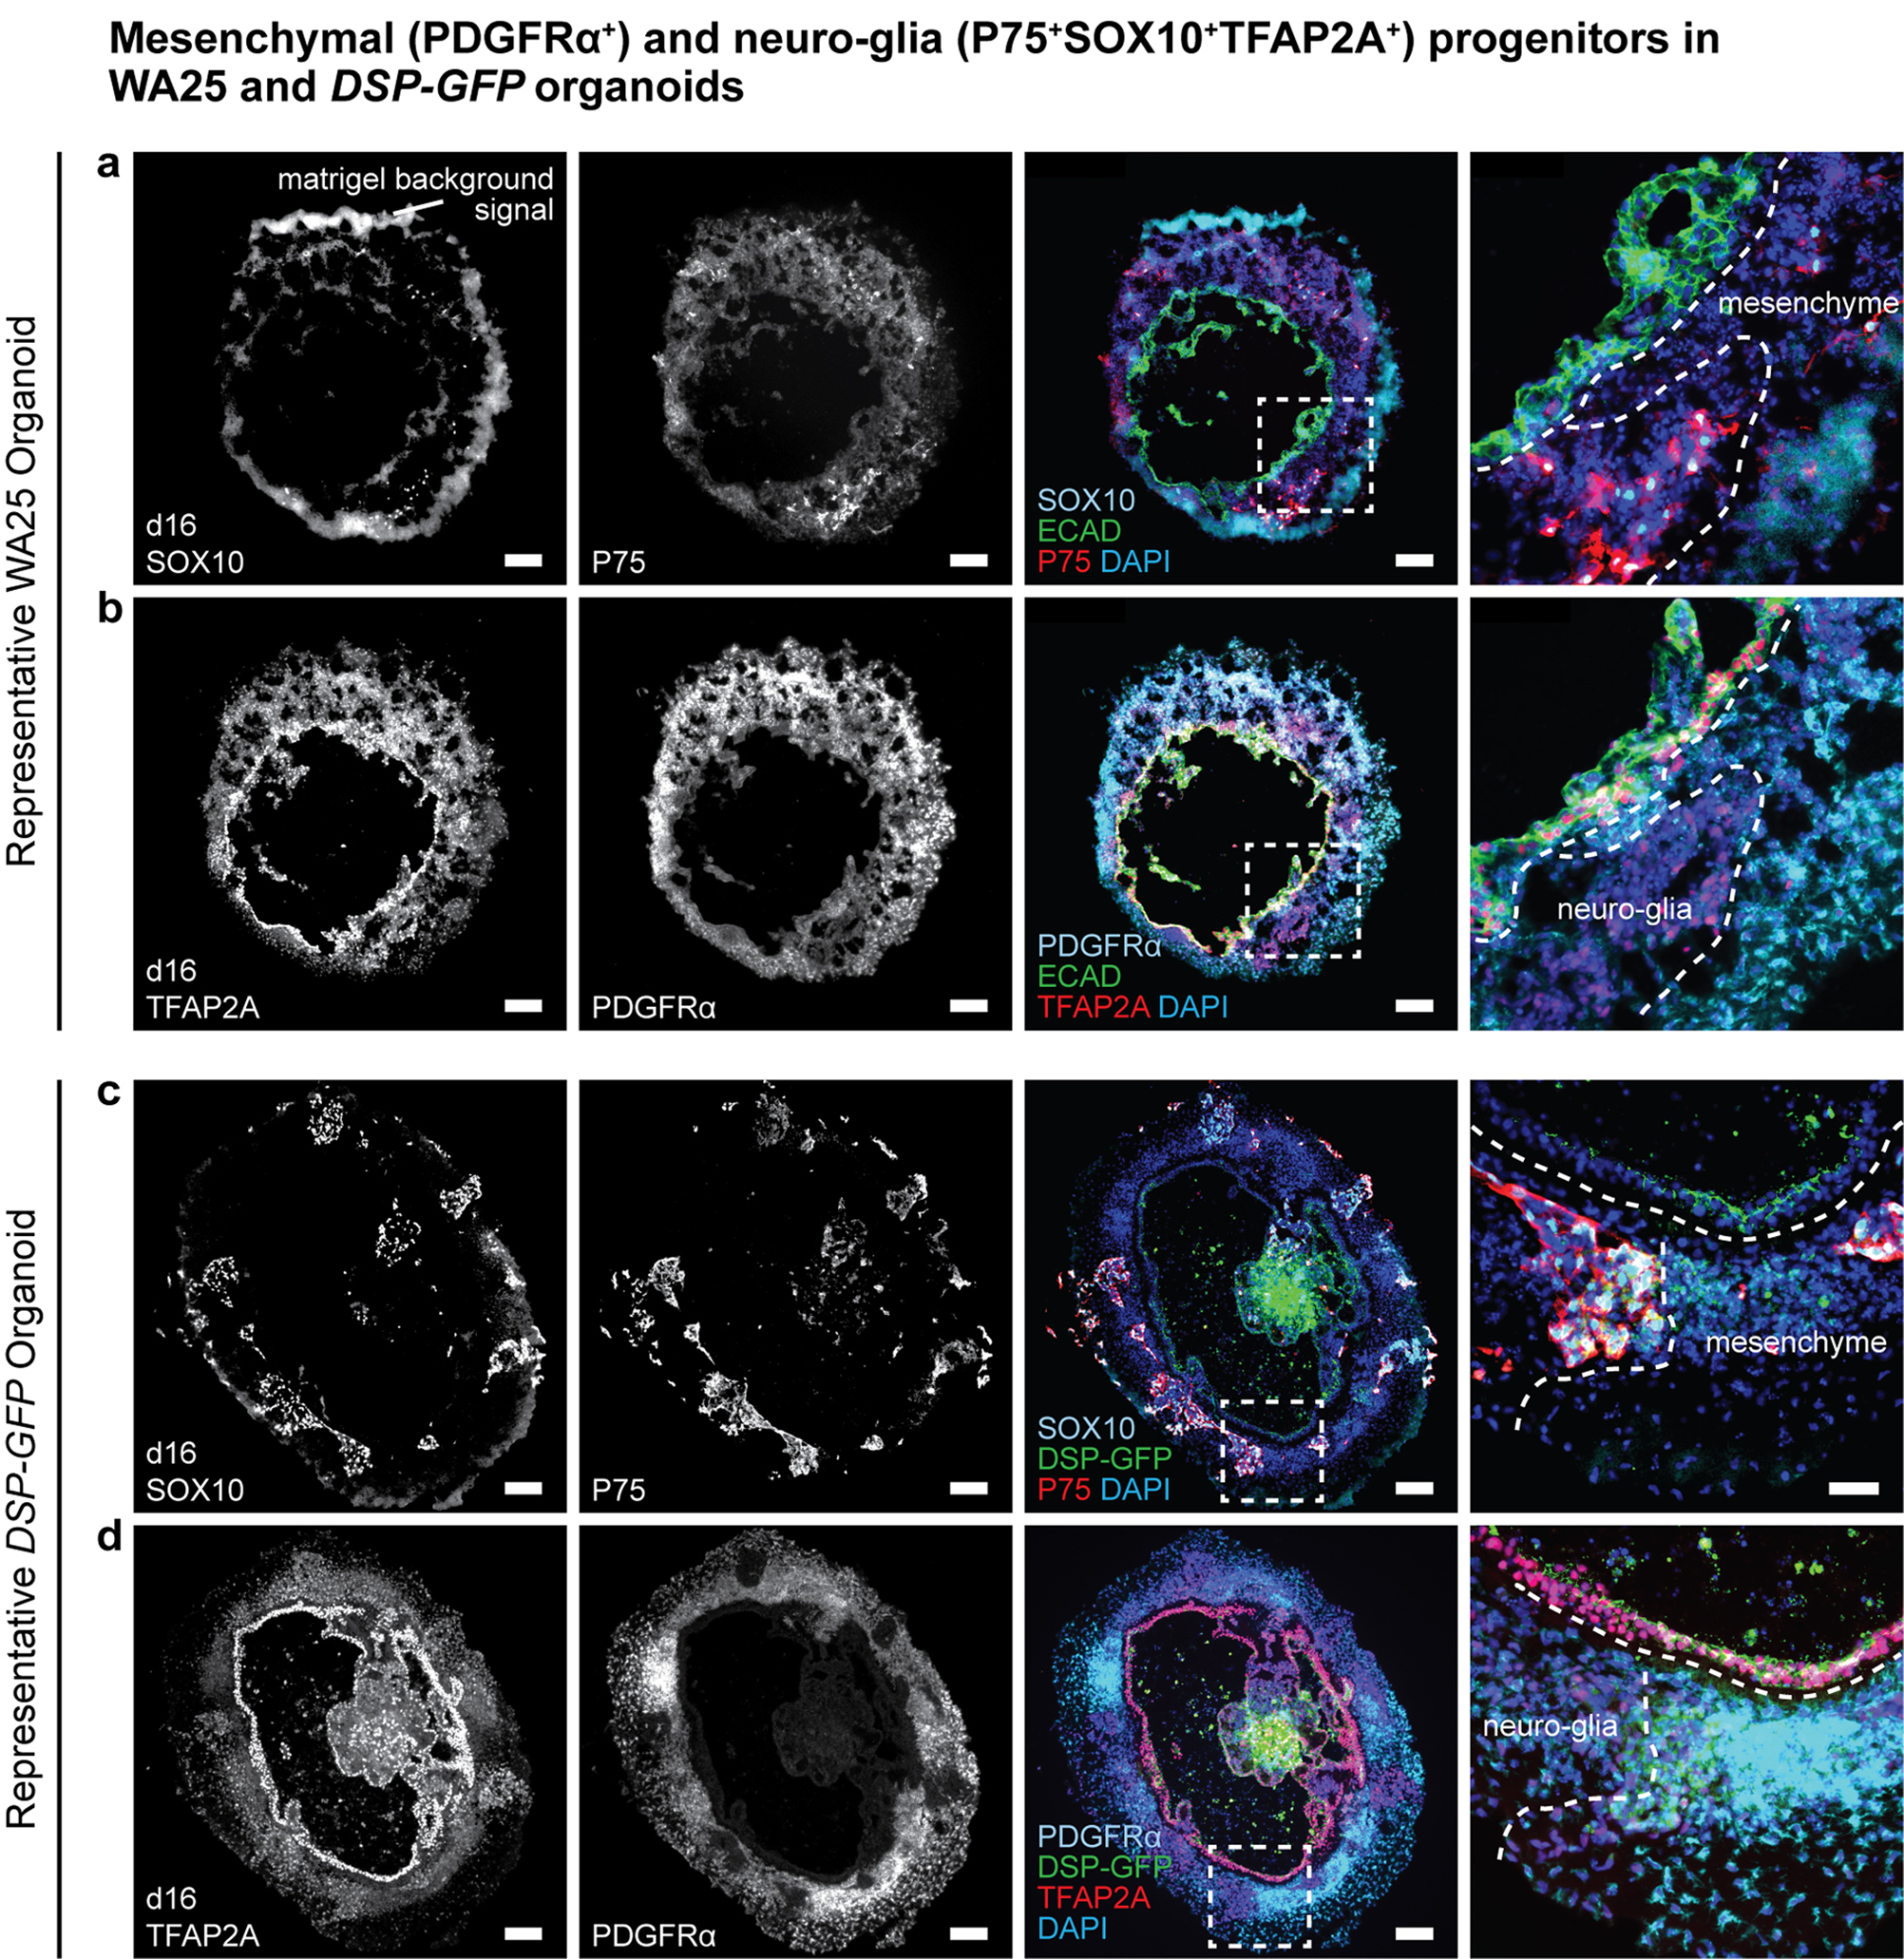
a-d, Representative immunostaining images of day-16 (a, b) WA25 and (c, d) DSP-GFP aggregates with co-induced epithelium and CNCCs under optimized d0BSF-d3LF treatment culture. P75 and SOX10 highlight neuro-glial-associated CNCCs, and PDGFRα and TFAP2A highlight mesenchyme-associated CNCCs. (a, b) Epithelium is highlighted by ECAD and TFAP2A double-positive signals. (c, d) ECAD was omitted to allow observation of the endogenous DSP-GFP signal at the apical surface of the epithelium. Dashed boxes indicate magnified regions presented in the right-end panels. Dashed lines outline the borders between the epithelium and CNCCs and between neuro-glial- and mesenchyme-associated CNCCs. Note that there are nonspecific fluorescence background noise signals from Matrigel. Immunostaining was repeated three times independently on a total 9 aggregates from 3 separate experiments. Scale bars: 100 μm (a-d), 50 μm (magnified panels). Corresponds with concepts/data in Fig. 1c.
Extended Data Figure 3 |. Comparison of initial hair follicle induction in WA25 and DSP-GFP live-cell aggregates.
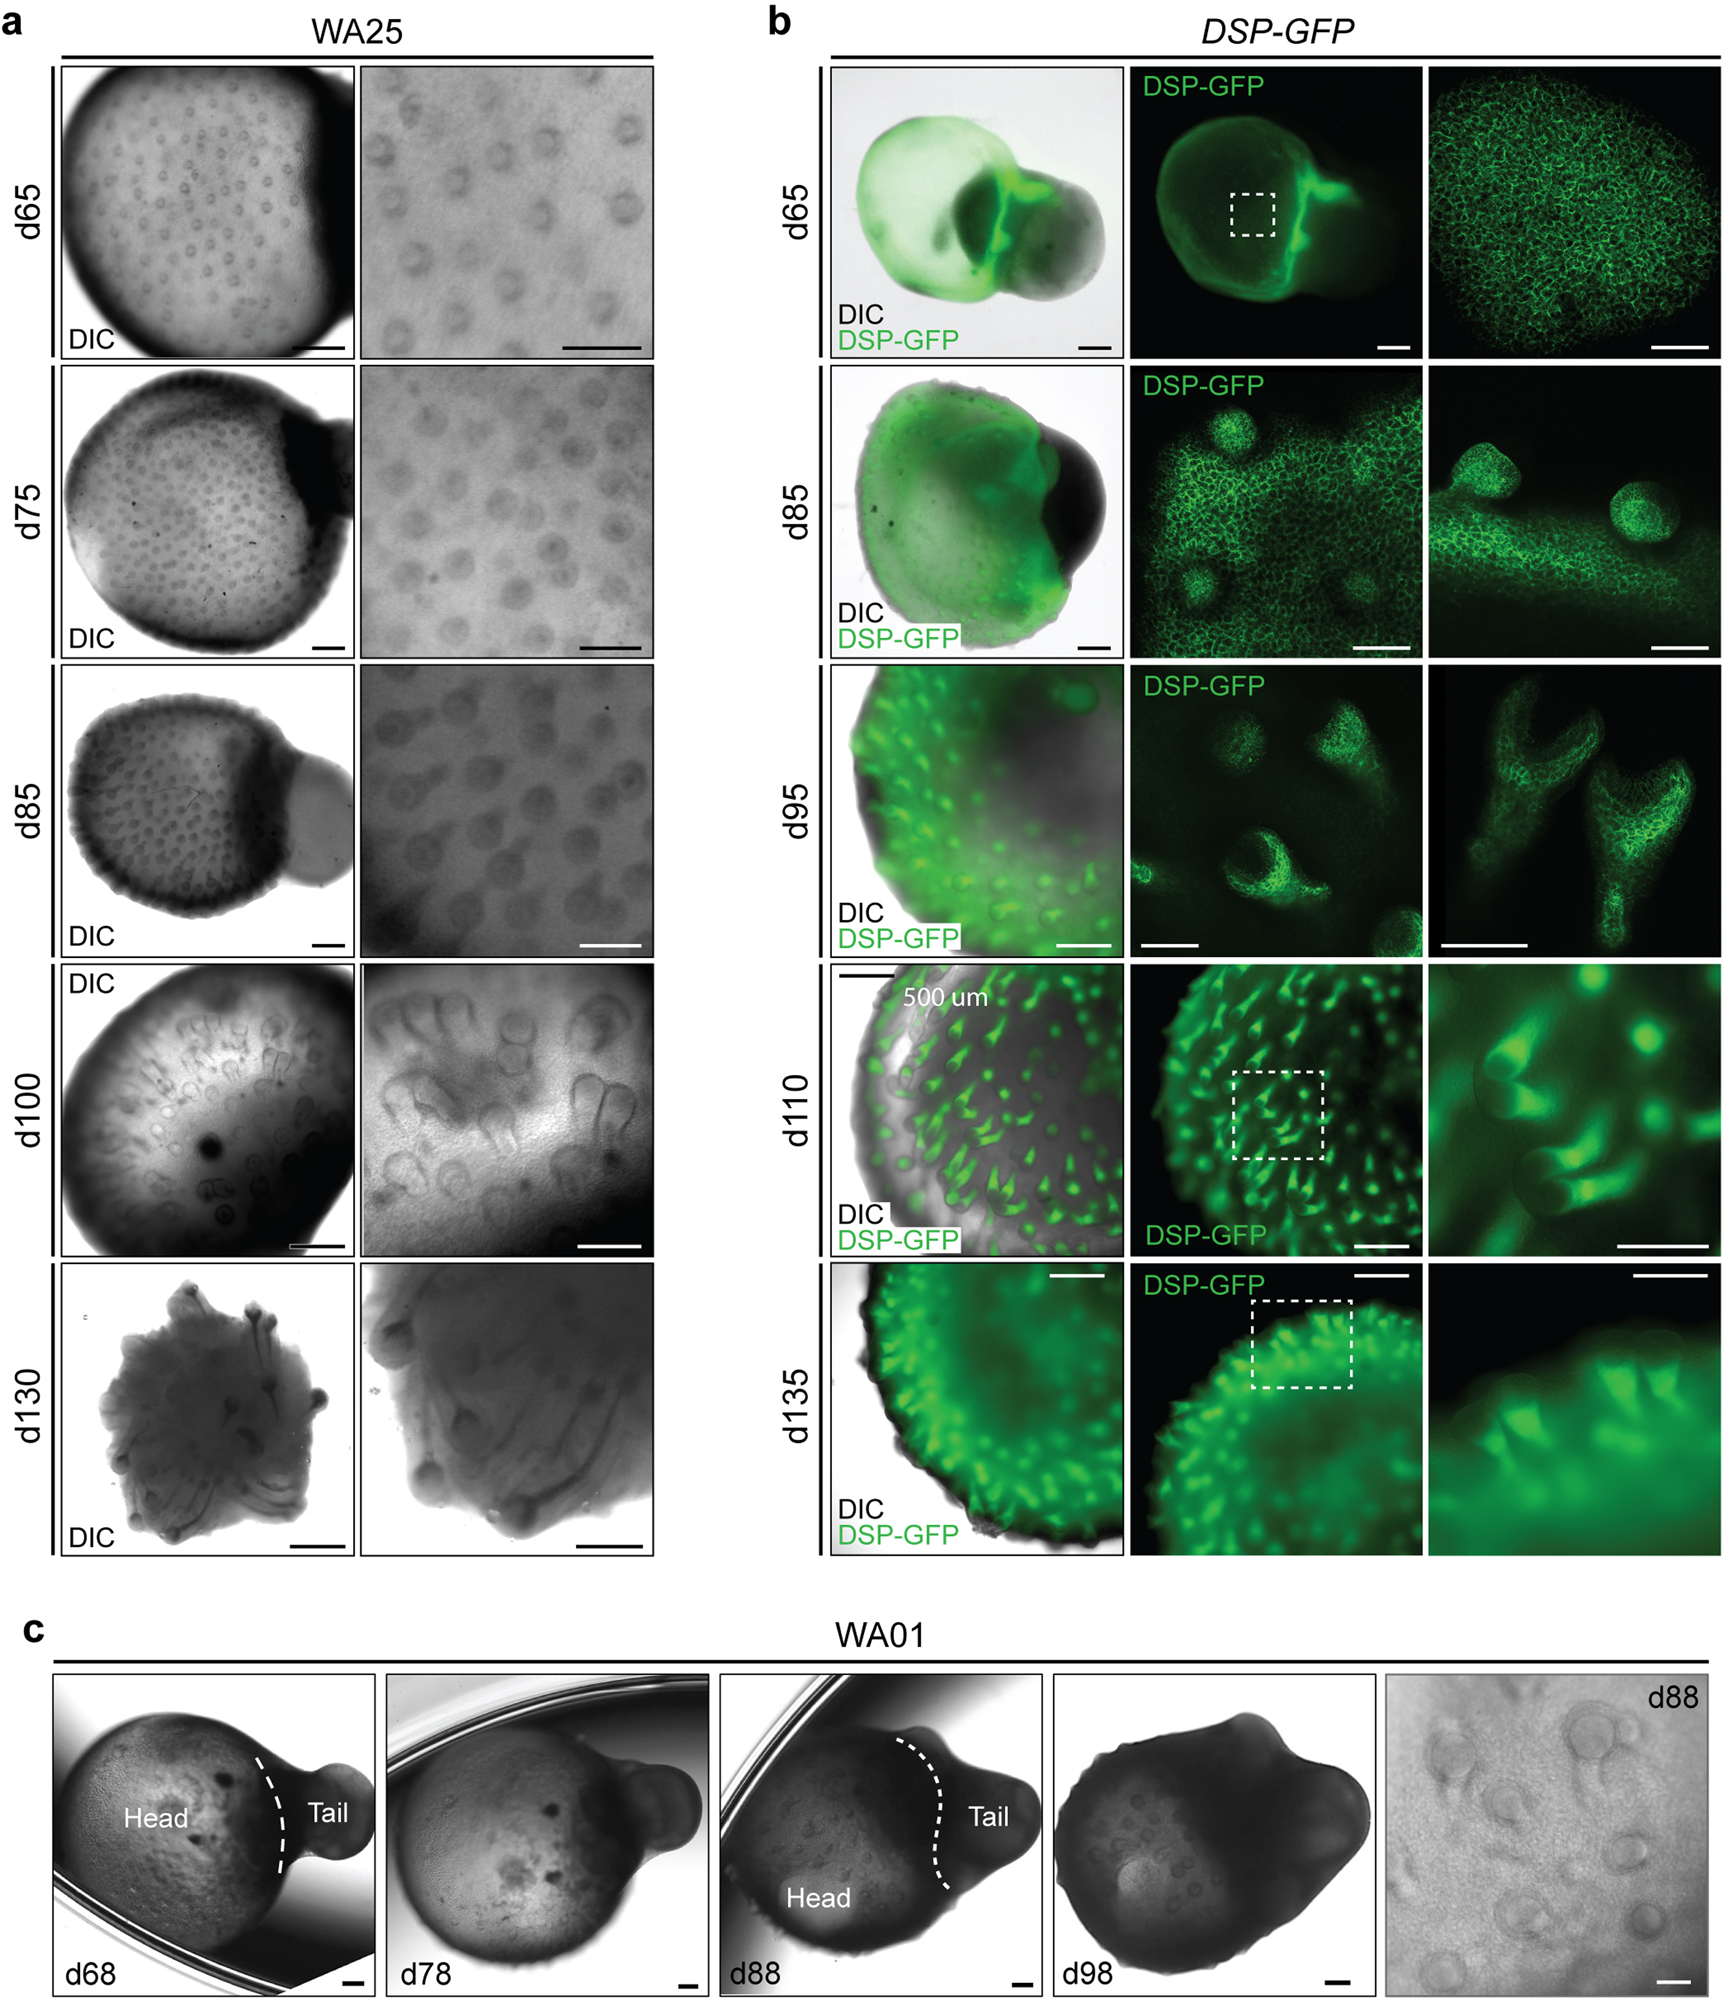
a, Representative DIC images of days 65–130 WA25 skin organoids with developing HFs. b, DIC and endogenous GFP fluorescence images of days 65–135 DSP-GFP skin organoids with developing HFs. c, DIC images of days 68–98 WA01 skin organoids with developing HFs. Magnified view of day-88 WA01 skin organoid HFs is shown in the last panel. Note that the head (skin cyst)-and-tail (non-skin mesenchymal) portions within skin organoids are distinguishable. Also, note that the hair bulbs are facing outward of the organoid, contacting medium, while the hair shafts grow inward toward the center of the skin organoid. Dashed boxes indicate magnified regions. Scale bars: 500 μm (a; left panels, b; left/middle panels), 250 μm (a & b; right panels, c; all panels except last panel), 100 μm (b; d65 & 85 right panels), 50 μm (c; last panel). WA25 and DSP-GFP skin organoid images represent morphologies observed throughout 9 independent cultures, and WA01 skin organoid images represent one experiment performed by the Stanford group. Corresponds with data in Fig. 1e and f.
Extended Data Figure 4 |. Key protein markers of hair follicle induction in skin organoids.
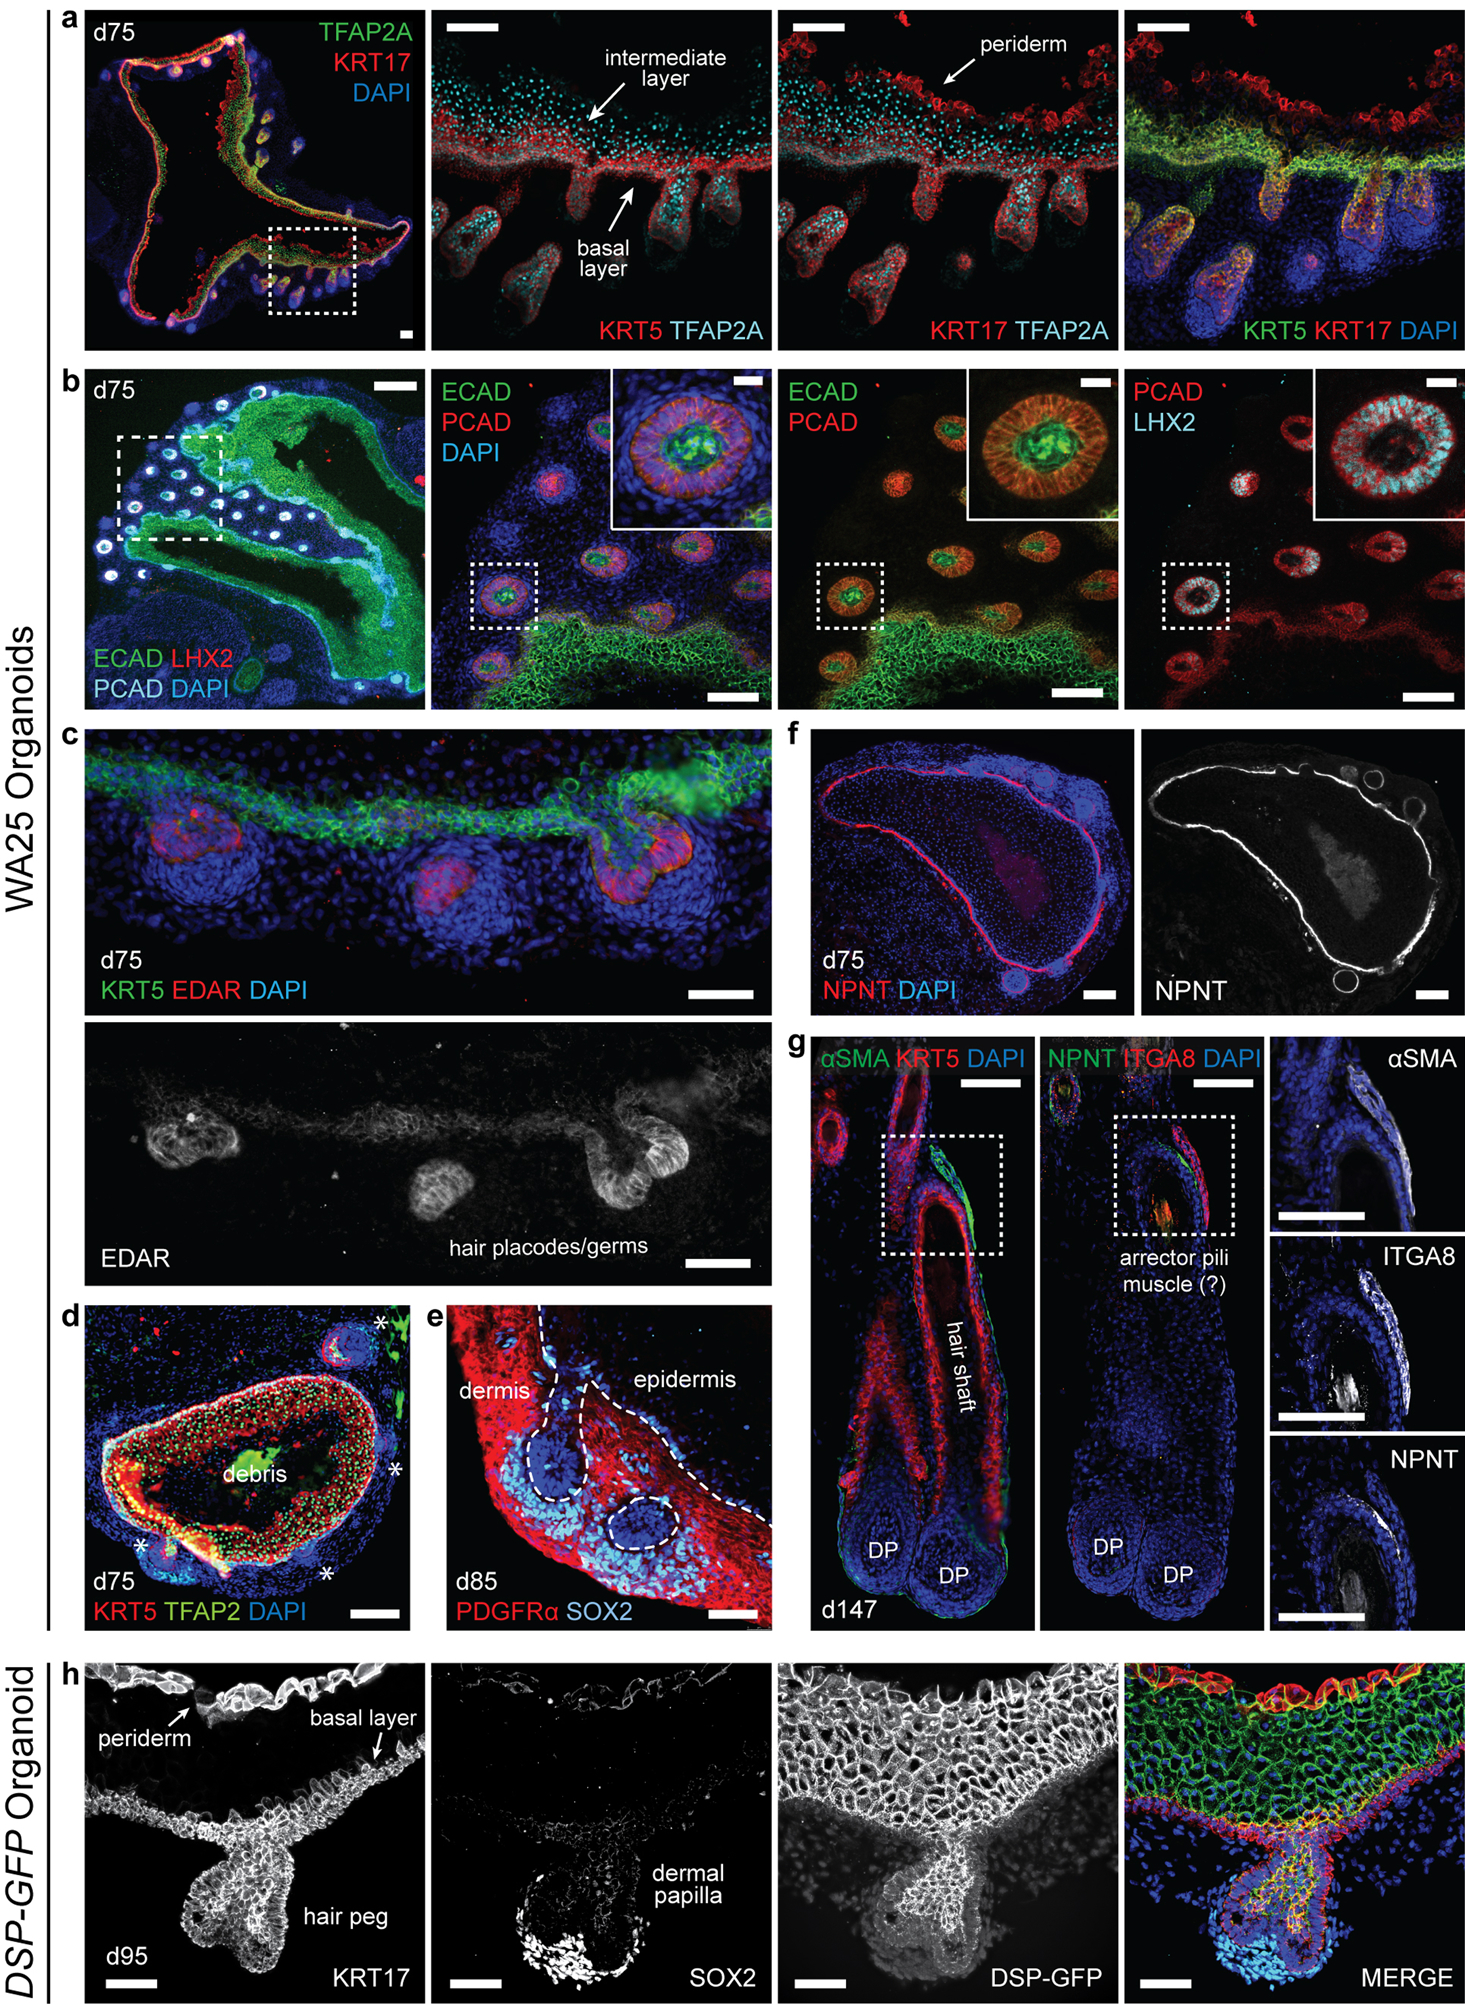
a, Day-75 WA25 skin organoid with nascent hair follicles immunostained for KRT5, KRT17, and TFAP2A. Note that this KRT17 antibody labels basal and peridermal keratinocytes. KRT5 and TFAP2A double-positive staining represents basal layer, and TFAP2A single-positive staining between basal and peridermal layers indicates intermediate layer. Dashed box region is presented in a high-magnification image. b, Immunostaining for ECAD on day-75 WA25 skin organoids labels the entire epithelium, whereas PCAD expression is restricted to the basal layer and the hair germ epithelium. LHX2 labels hair placode and matrix cells. Close up hair germ images in dashed boxes are presented on the right top corner in each panel as insets. c, Immunostaining for EDAR on day-75 WA25 skin organoids labels placodes and matrix cells of hair follicles. d, Low magnification immunostaining image of a day-75 WA25 organoid shows the distribution of KRT5 and TFAP2A expression, representing basal and intermediate layers. Note that the nonspecific fluorescence signal in the core of the skin cyst is cell debris. Asterisks indicates developing hair follicle placodes and germs. e, Representative immunostaining image for PDGFRα and SOX2 on a day-85 WA25 skin organoid. PDGFRα is expressed throughout the dermis developed in the outer layer of skin cyst, and SOX2 labels dermal condensate and dermal papilla cells, yet is also expressed in some basal epidermal cells—likely Merkel cells. f, By day-75 of differentiation, NPNT (nephronectin) is localized to the basement membrane of WA25 skin organoid epithelia. g, In an immunostaining image of a day-147 WA25 skin organoid, ⍺SMA (alpha-smooth muscle actin)+ ITGA8 (integrin-alpha-8)+ arrector pili muscle-like feature was detected along with the NPNT+ hair follicle bulge region, residing next to each other, suggesting the potential capability of producing arrector pili muscle in our skin organoid. However, this feature is extremely rarely observed in our current culture condition, which is still at an early developmental stage that further optimization of medium for long-term culture is necessary. Dashed boxes indicate magnified bulge region with arrector pili muscle-like phenotype presented on the right panels. Dermal papilla (DP). h, Immunostaining of a day-95 DSP-GFP skin organoid showing a hair peg with KRT17+ peridermal layer and outer root sheath, SOX2+ dermal papilla, and GFP+ desmosome-rich intermediate epidermis of the hair follicle. All immunostaining was repeated at least 3–5 times on 9–12 skin organoids generated from 4 independent experiments prior to selection of representative images. Scale bars: 250 μm (b-first panel), 100 μm (a, b-all magnified panels, d, f, g), 50 μm (c, e, h), 23 μm (b-all insets). Corresponds with data in Fig. 1.
Extended Data Figure 5 |. Single-cell RNA-seq analysis of day-6 and day-29 skin organoids derived from WA25 and DSP-GFP cells.
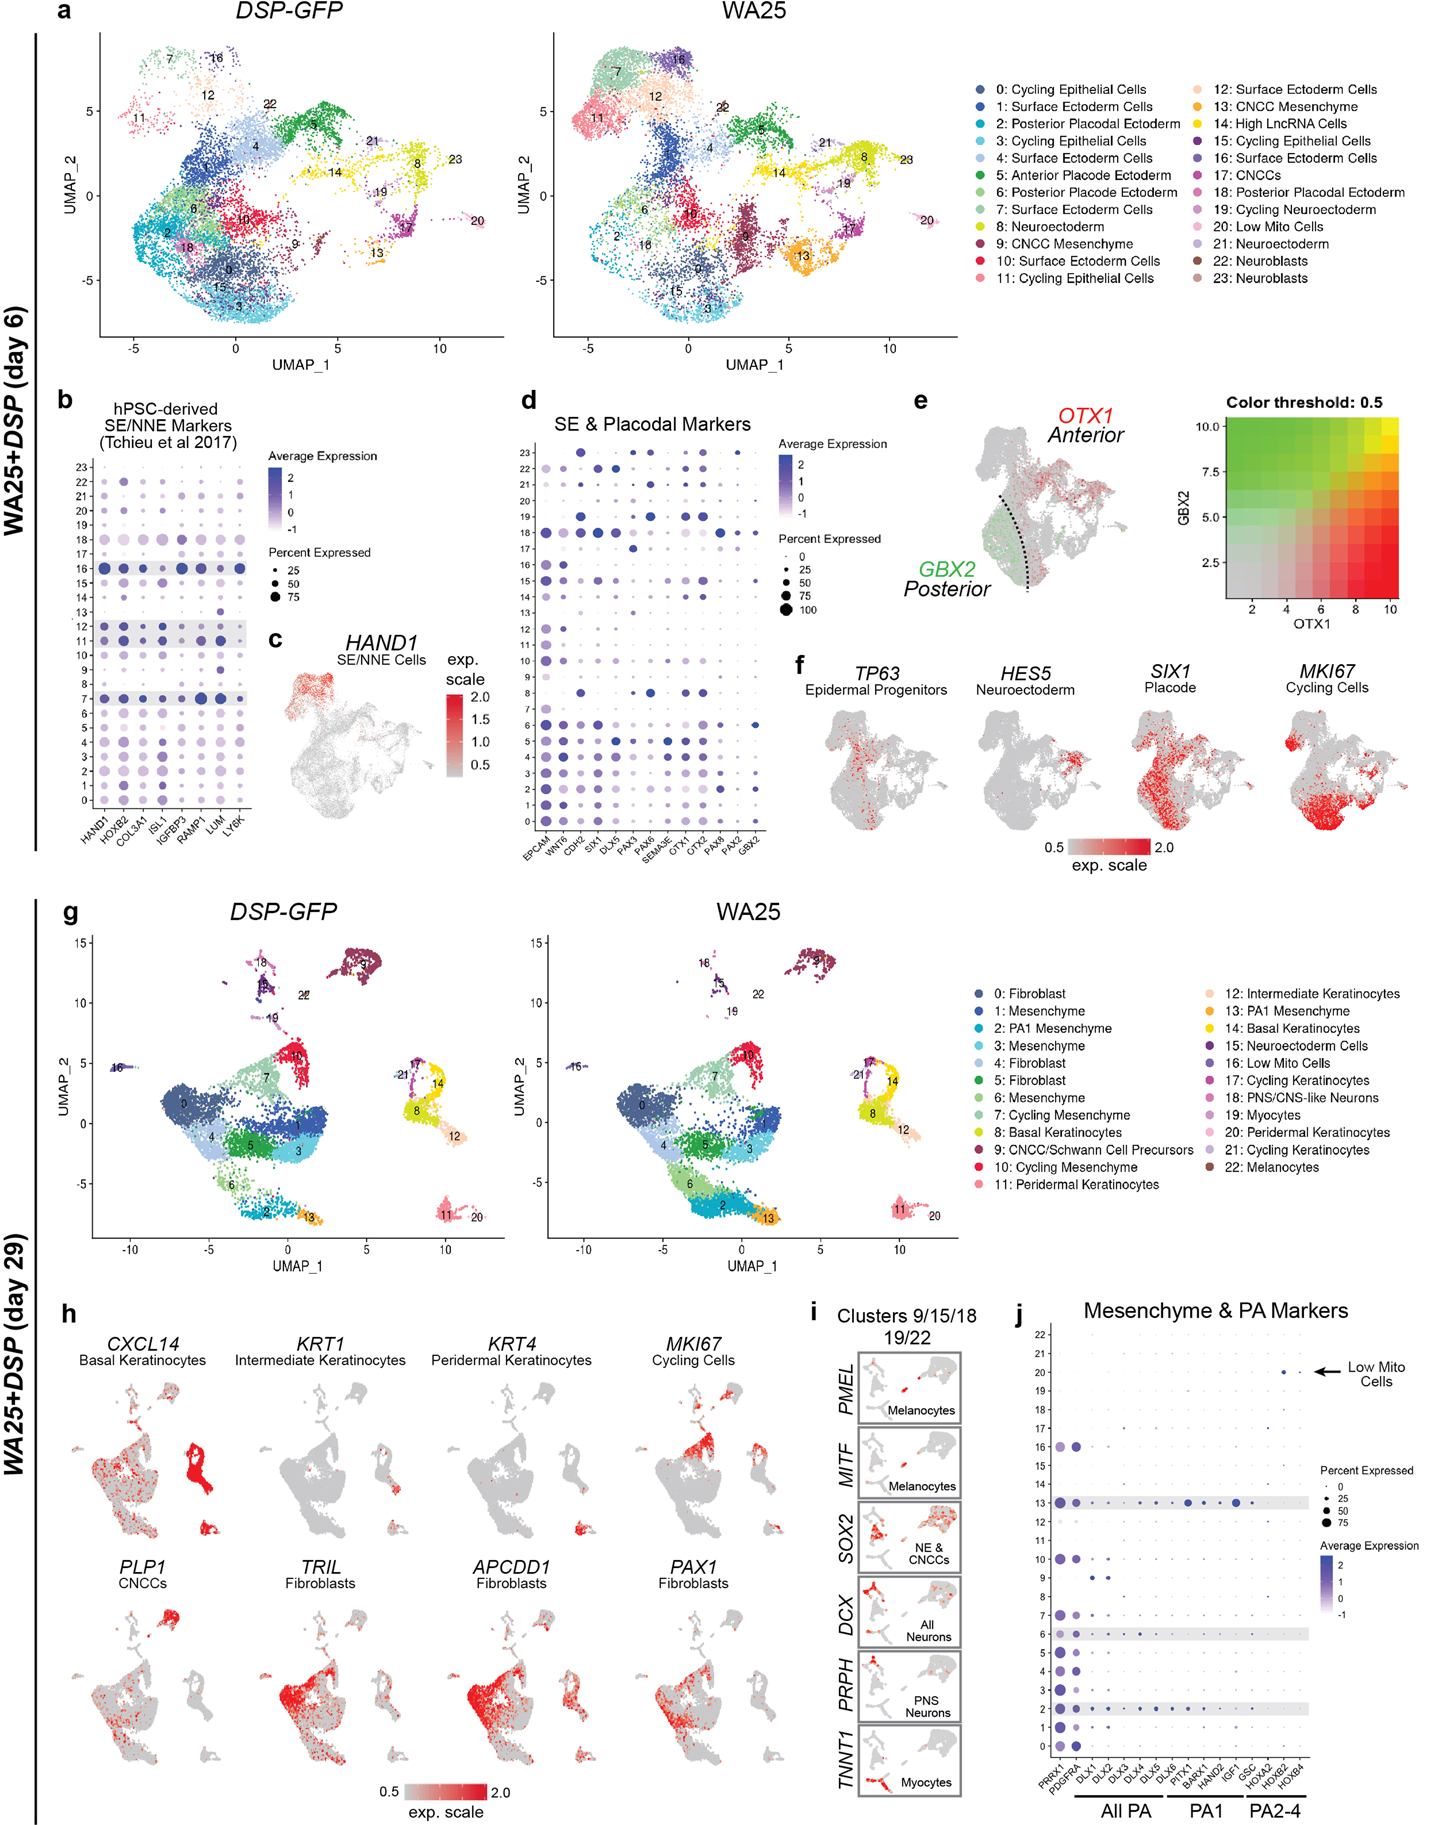
a, g, Separate uniform manifold approximation projections (UMAP) for WA25 and DSP-GFP cell clusters at day-6 and day-29. The major cell cluster groupings of surface epithelia, epidermis, and mesenchyme are noted. Colours indicate cell state. The presumptive cell identities, based on a priori knowledge of marker genes, are listed. Cell clusters with no discernable identity had either low mitochondrial or high long non-coding RNA gene expression and are labeled “Low Mito Cells” and “High LncRNA”, respectively. n = day-6: 11,785 WA25 cells, 11,544 DSP-GFP cells; day-29: 9,268 WA25 cells, 9,013 DSP-GFP cells. Ten day-6 organoids from one experiment and five day-29 organoids from one experiment were randomly pooled for scRNA-seq analysis (per cell line). b, Dot plot for SE and NNE markers based on RNA-seq data from Tchieu et al. Cell Stem Cell 2017. c, UMAP plot for HAND1, a key marker for NNE cells derived from hPSCs. d, Dot plot for SE and anterior-posterior placodal markers. Gene expression frequency is indicated by spot size and expression level is indicated by colour intensity. e, UMAP overlay plot showing the distribution of OTX1 (Anterior placode/Neuroectoderm marker) and GBX2 (Posterior placode marker). f, UMAP plots for key markers of epidermal progenitors, neuroectoderm, general placode, and cycling cells. h, UMAP plots for specific marker genes that define epidermal, cycling, CNCC, and dermal cell subtypes. i, Magnified view of clusters 9 (CNCC and Schwann Cell Precursors), 15 (Neuroectoderm Cells), 18 (PNS/CNS-like Neurons), 19 (Myoctyes), 22 (Melanocytes). Key marker genes are displayed to label each cell cluster. SOX2 has broad expression across Neuroectoderm and CNCCs. j, Dot plot for general mesenchymal (PRRX1, PDGFRA), PA, PA1, and PA2–4 markers. Gene expression frequency is indicated by spot size and expression level is indicated by colour intensity. Note expression of HOX genes appears limited to a subset of high LncRNA gene expressing cells. Abbr: surface ectoderm (SE); non-neural ectoderm (NNE); cranial neural crest cell (CNCC); pharyngeal arch (PA). Corresponds with data in Fig. 2.
Extended Data Figure 6 |. Single-cell RNA-seq analysis of day-48 skin organoids derived from WA25 cells.
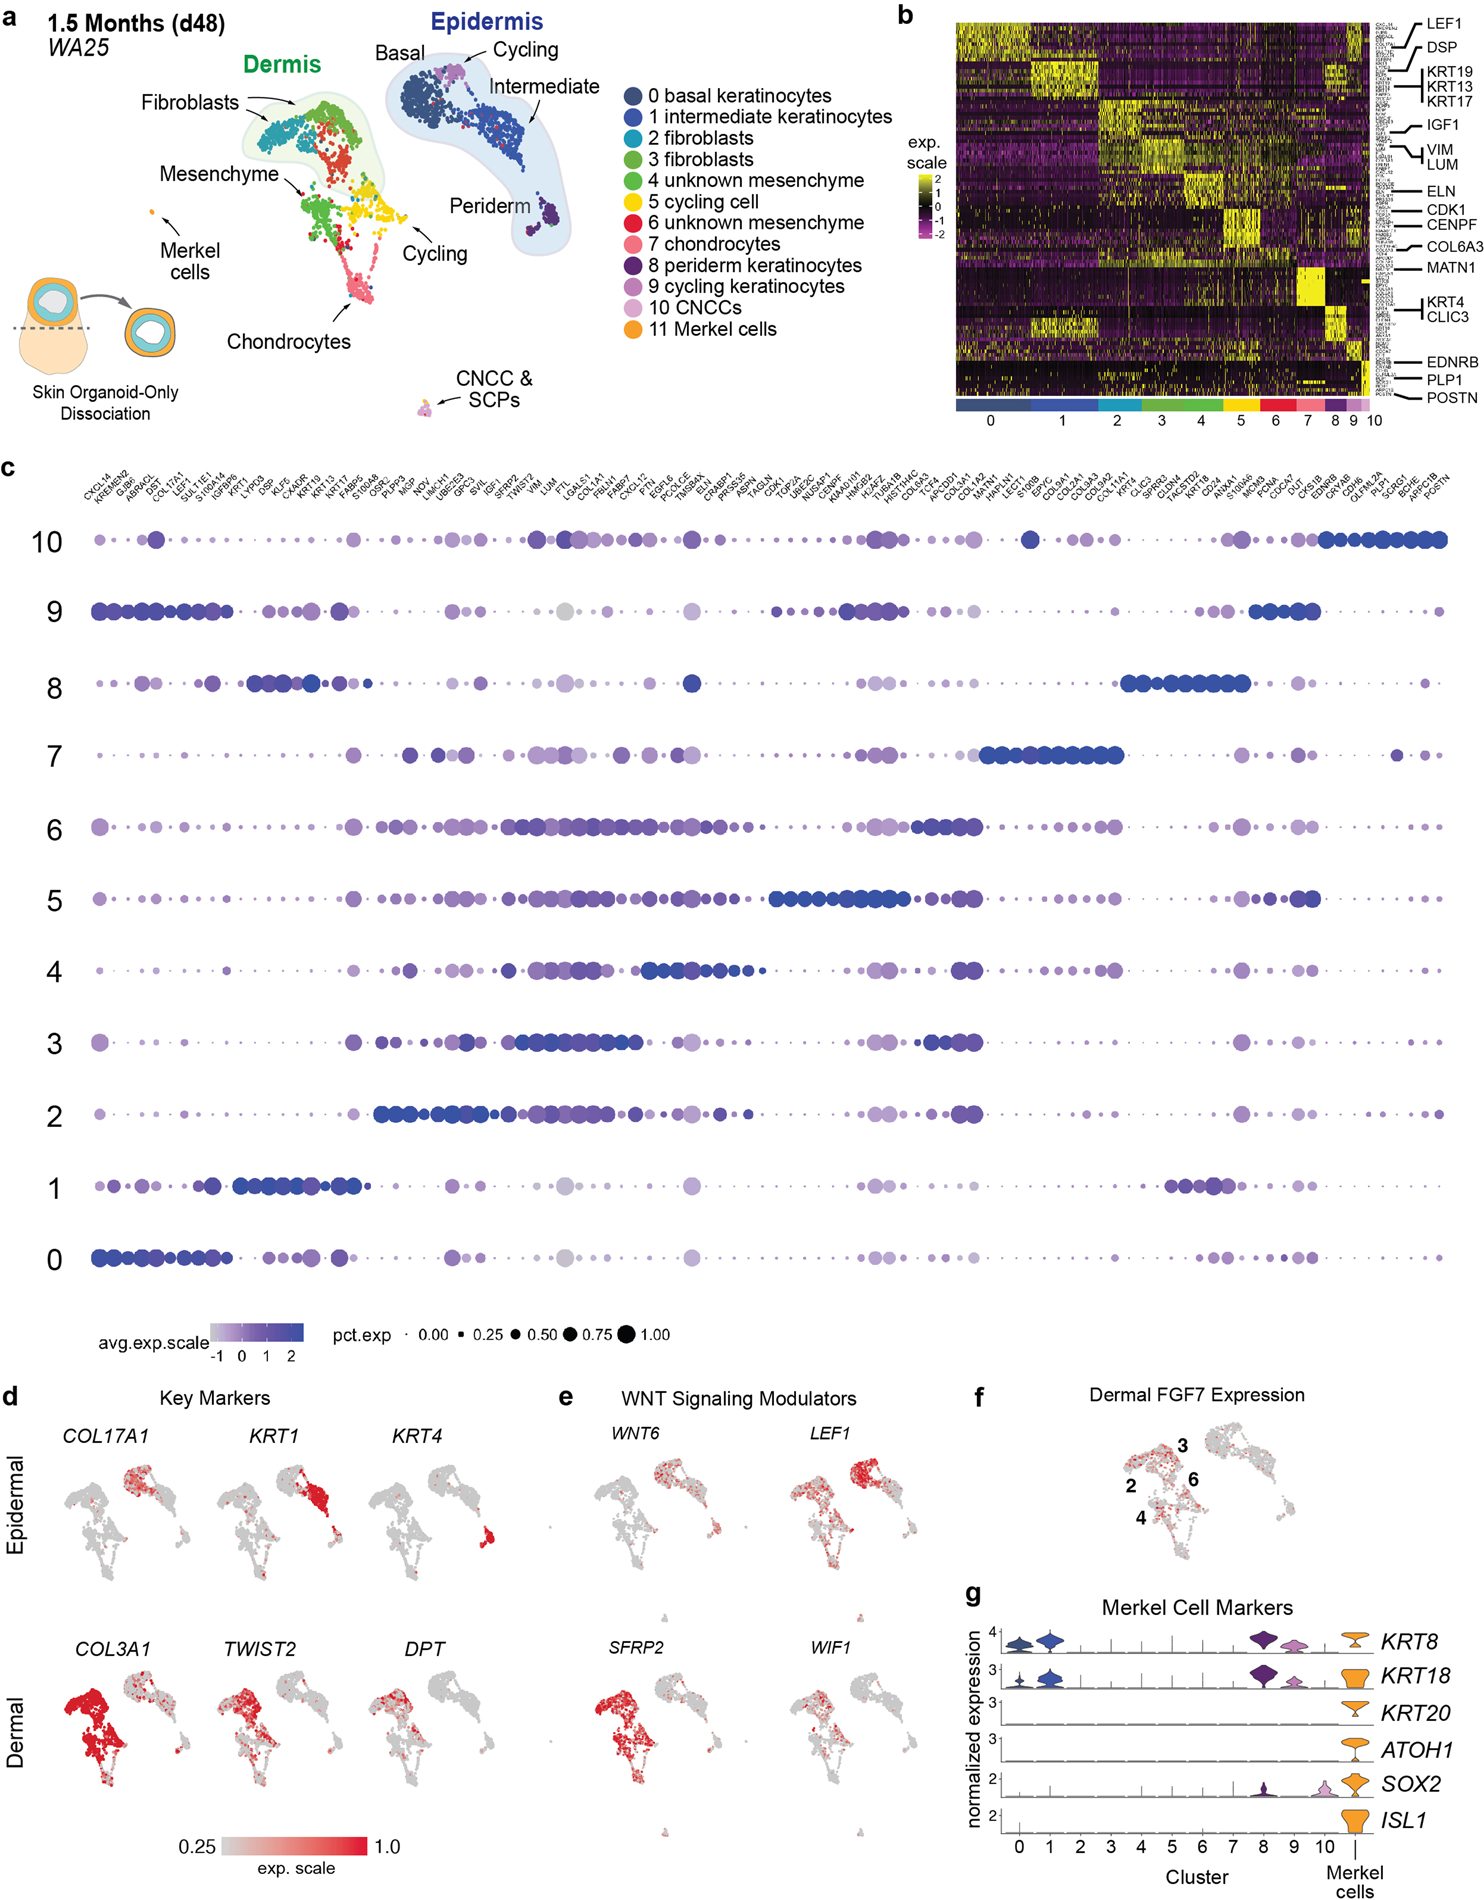
a, UMAP clustering of day-48 WA25 cell subtypes. Colours indicate cell state. n = 2491 cells. Six day-48 skin organoids from one experiment were pooled for scRNA-seq analysis. b, Heatmap displaying the scaled LogNormalize (ln)-expression of the top 10 differentially expressed genes per cell cluster for the day-48 WA25 scRNA-Seq dataset. c, Dot plot array displaying the top 10 positively expressed genes per cell cluster for the day-48 WA25 scRNA-Seq dataset. Gene expression frequency is indicated by spot size and expression level is indicated by colour intensity. d, UMAP plots for cell subtype specific marker genes. e, UMAP plots for WNT signalling pathway genes. Note that WNT6 is expressed in basal keratinocytes and peridermal keratinocytes. LEF1 expression appears localized to basal keratinocytes. Negative WNT modulatory genes, SFRP2 and WIF1, are expressed in putative dermal fibroblasts of the mesenchymal cell group. f, Dermal fibroblast clusters also contain cells expressing FGF7 (also known as Keratinocyte Growth Factor). The numbers of cell clusters with positive expression are listed on the UMAP plot. g, Merkel cell identification: Using the UMAP clustering algorithm, we identified a subset (n = 8 cells) of cluster (C)-0 cells (putative basal keratinocytes) that were completely separated from the majority of C-0 cells, suggesting that our unbiased analysis pipeline failed to identify a unique subset of low-abundance cells. We used the Seurat manual selection tool to generate an 11th cluster containing these cells (see left side of panel “a”). Violin plots show normalized gene expression of the Merkel cell marker genes ATOH1, ISL1, SOX2, KRT8, KRT18, and KRT20.
Extended Data Figure 7 |. Pigmentation in WA25 and DSP-GFP skin organoid hair follicles.
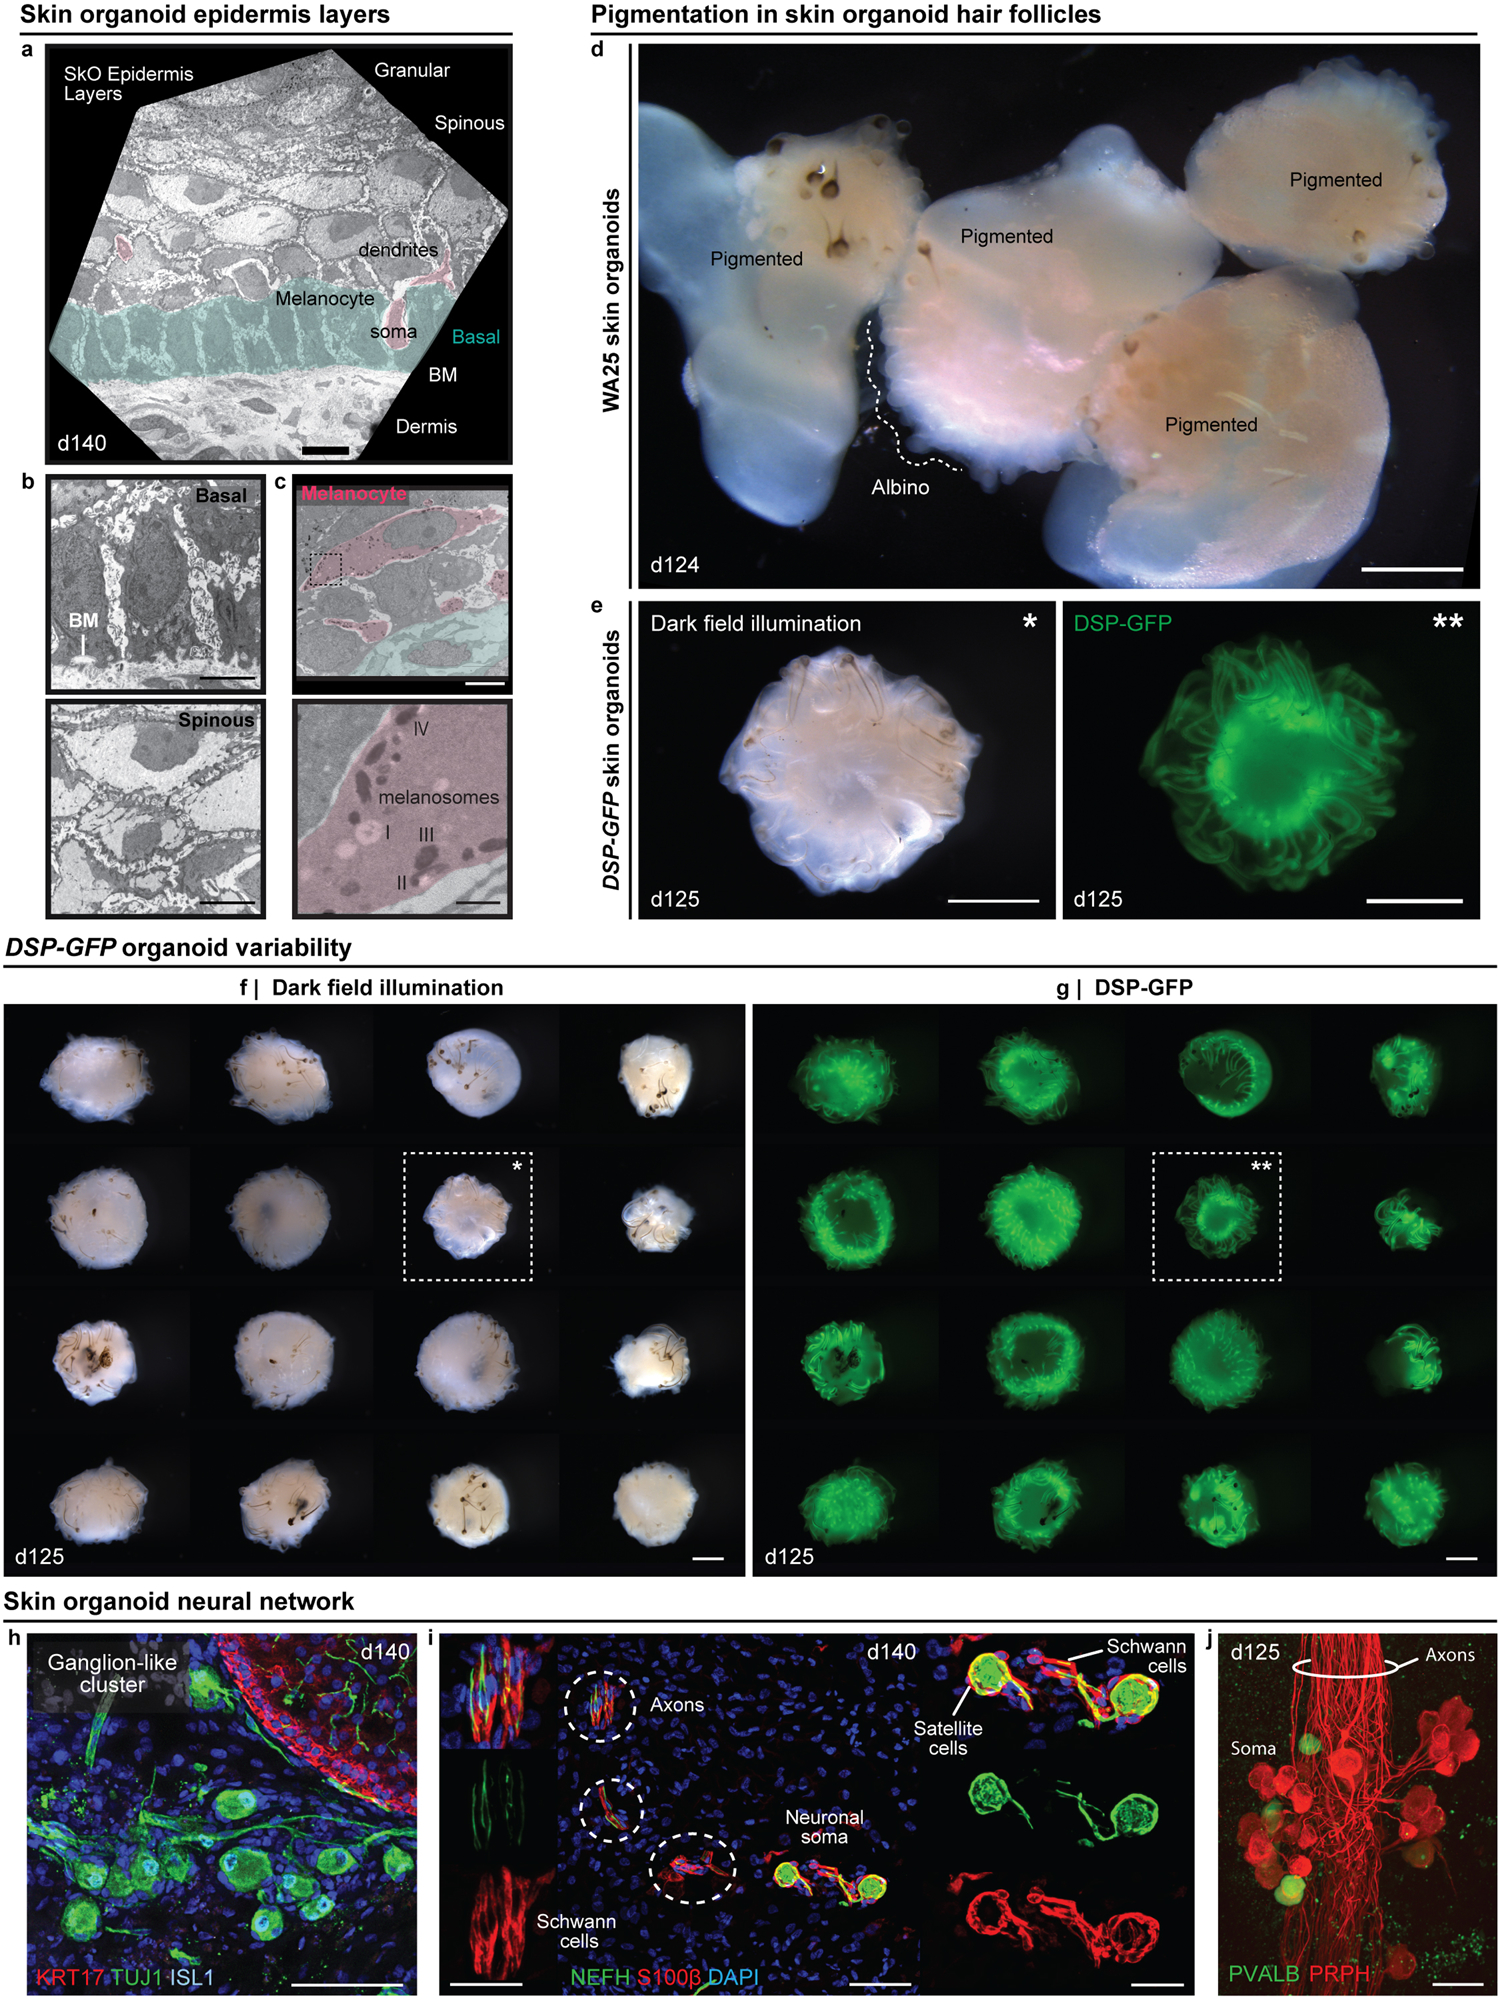
a, TEM image of epidermis in a day-140 WA25 skin organoid. A melanocyte cell body is pseudo-coloured pink, and basal skin layer is pseudo-coloured green. b, Higher magnification image of (upper) basal keratinocytes and the basement membrane (BM) and (lower) spinous layer keratinocytes. c, Higher magnification image of matrix-associated melanocytes (pink) with (lower) melanosomes at different stages (I, II, III, and IV); corresponds to Fig. 3f. Dashed box area in upper panel is magnified in lower panel. (a-c) TEM was performed on two day-140 skin organoids from separate experiments. d, Dark field illumination image of day-124 WA25 skin organoids, comparing pigmented vs. non-pigmented (albino) hairs development; represents pigmented and non-pigmented hairy-skin organoids from 9 independent experiments. e, Representative (*) dark field illumination and (**) endogenous GFP fluorescence images of day-125 DSP-GFP skin organoids with pigmented hair follicles. f, g, Overview of one DSP-GFP experiment containing 24 skin organoids. Note that each organoid displays pigmented hair follicles; however, the morphology of the epidermal cyst, as shown by DSP-GFP expression (green), varies between organoids. Closeup view of organoids highlighted with dashed boxes and asterisks are presented in (e). (e-g) Images show a set of organoids from one experiment and are representative of morphologies observed over the course of 9 independent experiments. h, Immunostaining for TUJ1 and ISL1 on day-140 WA25 organoid reveals the ganglion-like cluster of neurons. i, A subset of organoid neurons express NEFH and are associated with S100β+ satellite glial cells and Schwann cells. Dashed circles indicate axons of neurons. j, Immunostaining for PVALB on a day-125 WA25 organoid reveals the proprioceptors. PRPH+ sensory neurons have small somas, and their axons form a fascicle. (h-j) Immunostaining was repeated at least three times on 5–6 independent organoids. Scale bars: 1 mm (d-g), 50 μm (h, i), 35 μm (j), 25 μm (i; inserts) 10 μm (a), 5 μm (b, c; upper), 800 nm (c; lower). Corresponds with data in Fig. 3.
Extended Data Figure 8 |. Chondral development in the skin organoid tail region.
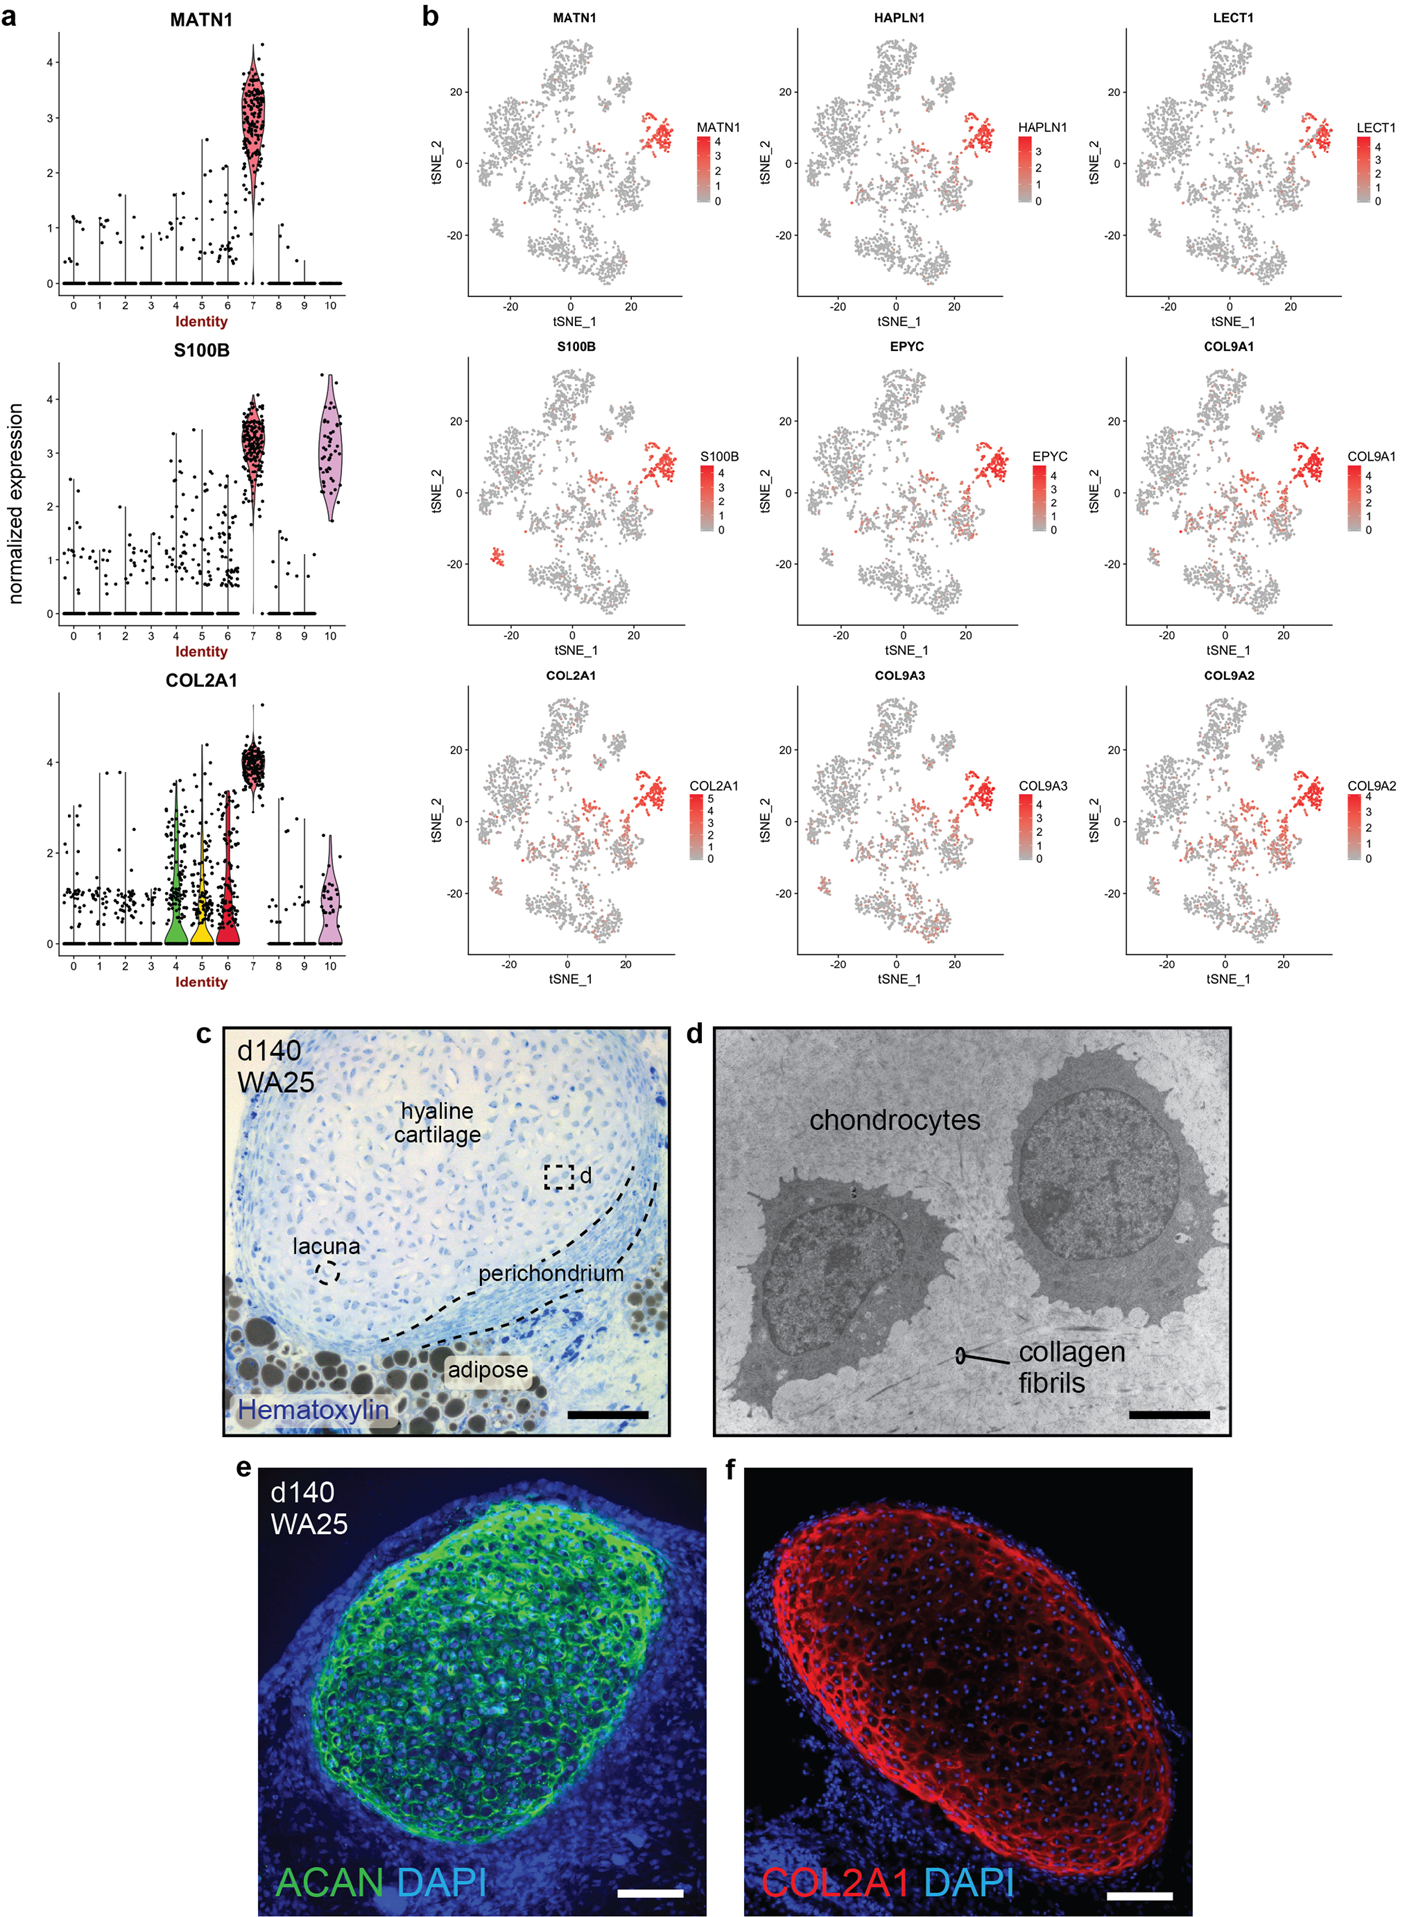
a, b, Violin and tSNE plots showing normalized expression of chondral marker genes within cluster 7 of the day-48 WA25 skin organoid dataset (see Fig. 2 and Supplementary Data 4). The data represent cells pooled from six day-48 skin organoids from one experiment. c, Hematoxylin stained section of a day-140 skin organoid showing hyaline cartilage that has formed within skin organoid-associated mesenchymal tissue; 3 independent hematoxylin stainings were performed on 6 skin organoids from 3 different experiments. d, TEM image of two representative chondrocytes located within hyaline cartilage tissue shown in panel (c); TEM was performed once on two different skin organoids. e, f, Immunostaining of day-140 organoid samples for Aggrecan (ACAN) and Collagen 2A1 (COL2A1) highlights cartilage development; images represent one of 3 independent IHC staining on 6 skin organoids produced from 3 separate experiments. Scale bars: 100 μm (c-f). Corresponds with data in Fig. 2 and 3.
Extended Data Figure 9 |. Xenografted WA25 skin organoid hair follicles have sebaceous glands comparable to second-trimester (18 weeks) foetal and adult facial hair.
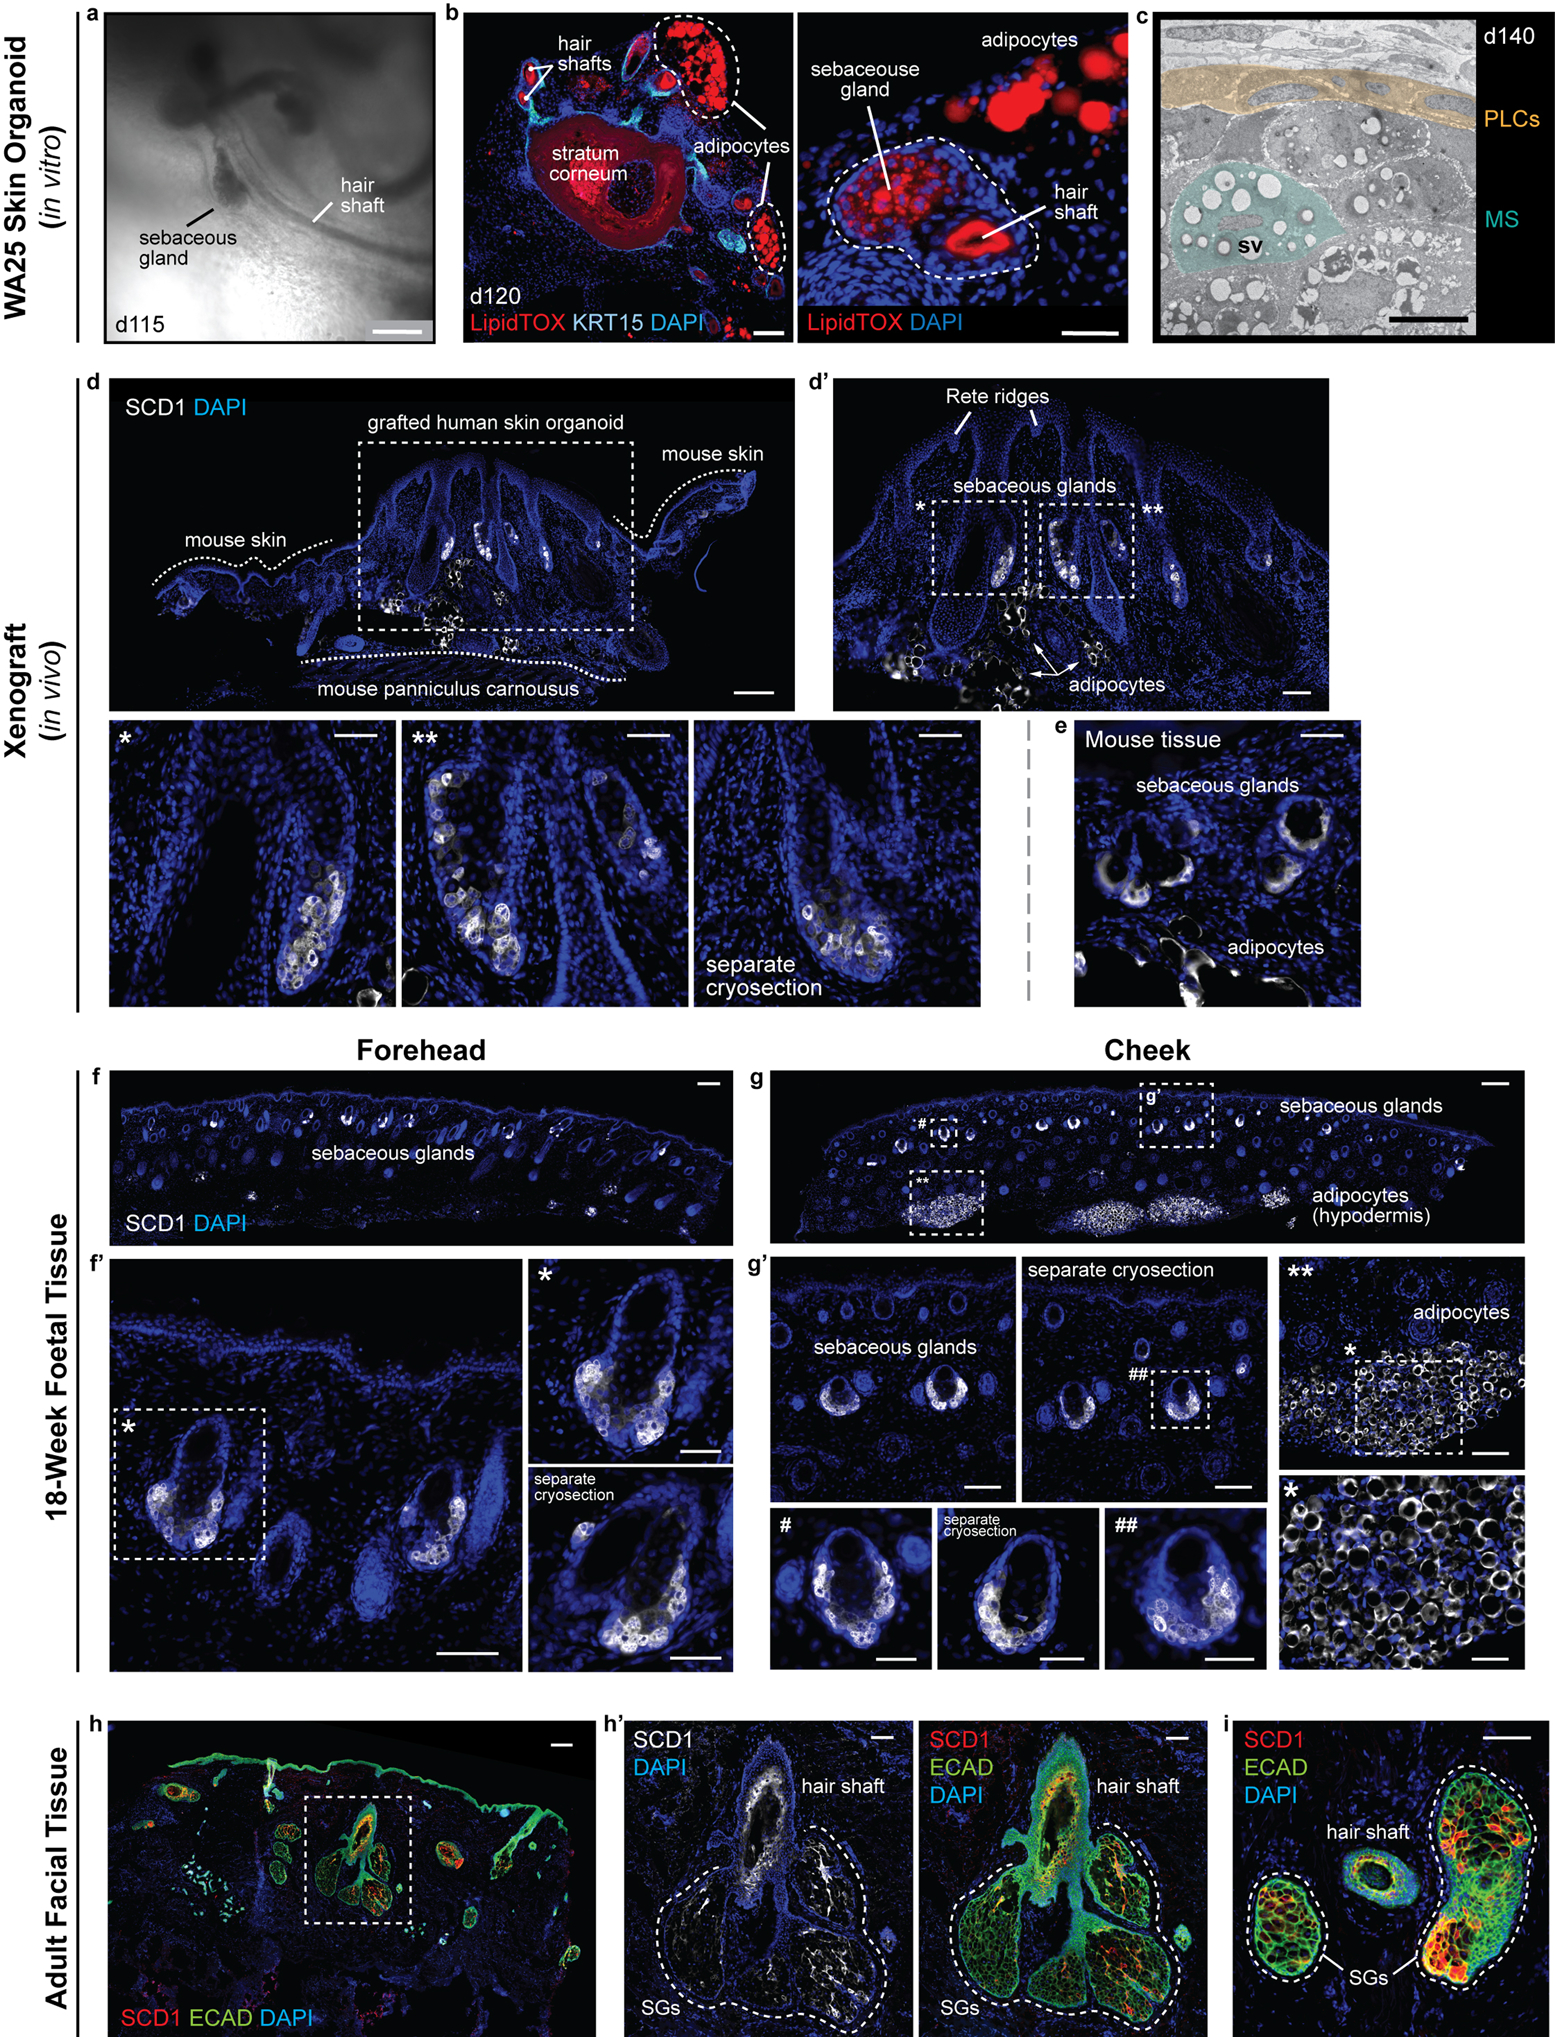
a, Brightfield image of two day-115 (in vitro) WA25 skin organoid hair follicles with visible hair shafts and sebaceous glands; represents hair follicles produced in 9 independent experiments. b, LipidTOX staining of day-120 WA25 skin organoid hair follicles reveals lipid-rich cells, such as sebocytes and adipocytes (APs; outlined by dashed lines). (left) Immunostaining for KRT15 labels outer root sheath of hair follicle cells. (right) High magnification image of an adjacent cryosection of the specimen in the left panel. Dashed line highlights a horizontally-cross-sectioned hair shaft and a sebaceous gland. c, TEM image of a day-140 WA25 skin organoid sebaceous gland; TEM was performed once on 2 different skin organoids from separate experiments. Peripheral layer cells (PLCs) and a maturing sebocyte (MS) containing sebum vacuoles (SV) have been pseudo-coloured in yellow and green, respectively. d, d’, SCD1+ sebaceous glands in xenografted day-140 WA25 skin organoids. Xenografts were extracted and fixed in 4% PFA, >49 days after transplantation. Dashed boxes and asterisks indicate magnified regions presented in following image panels. Dashed lines distinguish between the grafted human skin organoid tissue and the tissues of host mouse (NU/J). Arrows indicate SCD1+ adipocytes. e, SCD1+ sebaceous glands in the NU/J mouse skin adjacent to xenografts. Note that the size of mouse sebaceous glands is smaller than those of human that the origin of sebaceous glands is distinguishable within the extracted xenograft samples. f, f’, SCD1+ sebaceous glands in 18-week human foetal forehead skin. g, g’, SCD1+ sebaceous glands and adipocytes in 18-week human foetal cheek skin. Note that the adipocytes are prominently abundant in foetal cheek tissue compared to forehead tissue (f vs. g). Dashed boxes and symbols highlight the magnified regions in following images. h-i, SCD1+ sebaceous glands (SG) in adult human facial skin. Epithelium is visualized by ECAD immunostaining. Dashed line outlines several lobes of sebaceous glands of a hair follicle. Immunostaining images represent one of 5 independent staining on 3–5 different samples per tissue type. Scale bars: 250 μm (a, f, g, h), 100 μm (b; left, d, d’, f’, g’, g’; **, h’, i), 50 μm (b; right, d’; *, **, separate cryosection (SC), e, f’; *, SC, g’; #, SC, ##, *), 5 μm (c). Corresponds with data in Fig. 4.
Extended Data Figure 10 |. Xenografted WA25 skin organoid hair follicles have bulge regions comparable to second-trimester (18 weeks) foetal and adult facial hair.
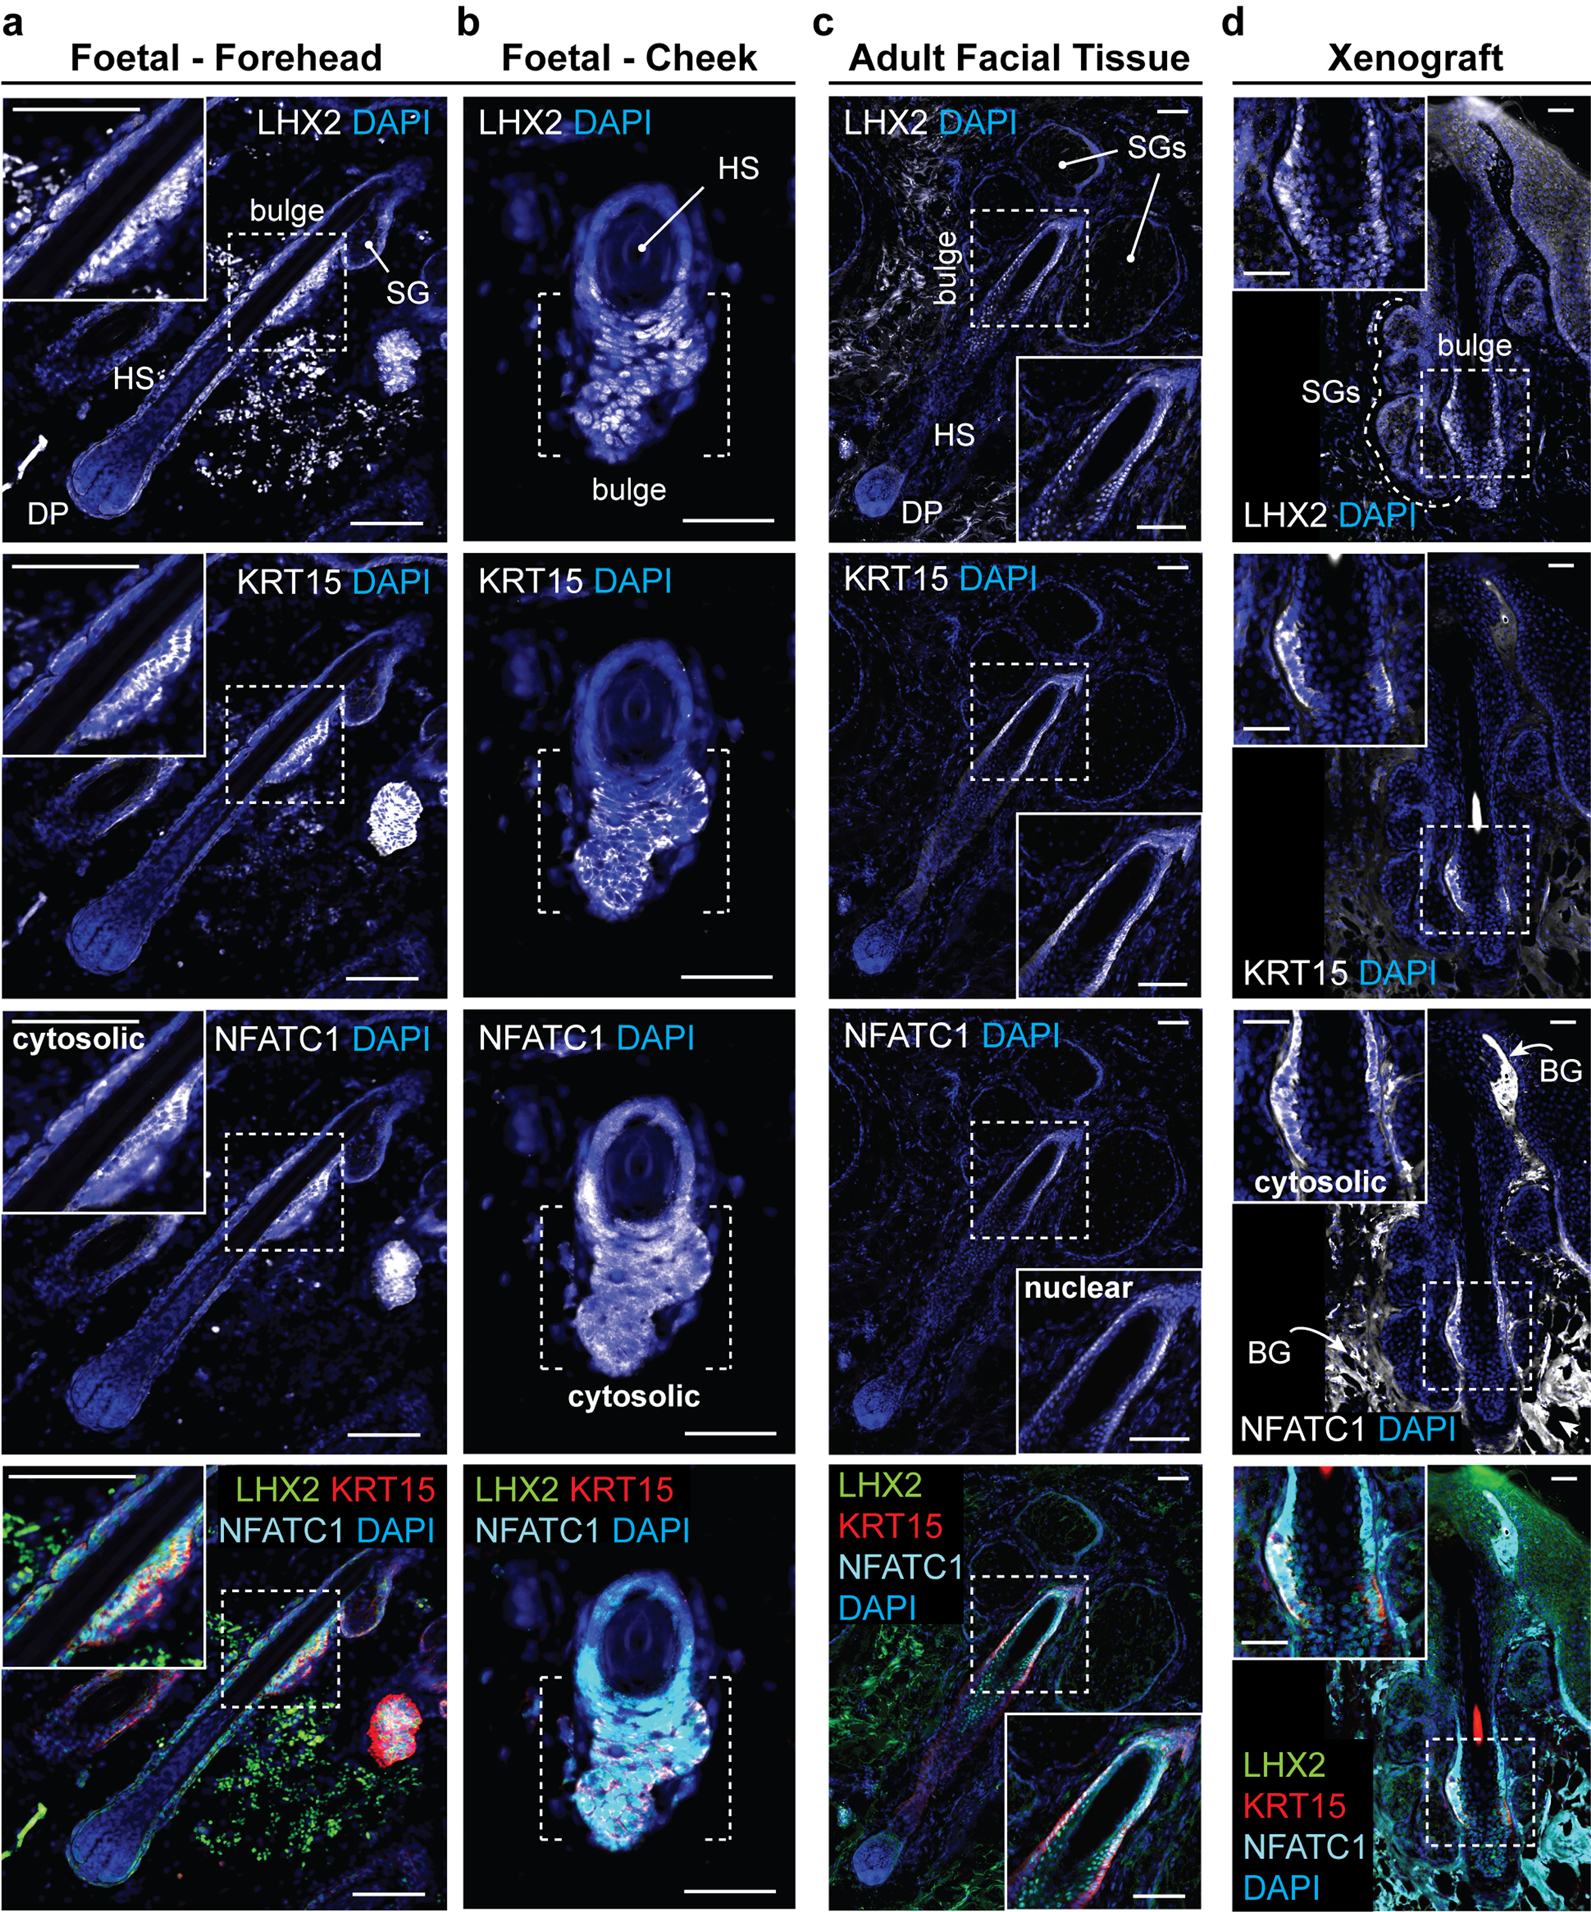
a-d, Representative immunostaining images for hair follicle stem cell markers, LHX2, KRT15, and NFATC1, in the hair follicle bulge region in (a, b) 18-week human foetal skin from two facial locations (Forehead and Cheek), (c) adult facial skin, and (d) xenografted skin organoid tissue. Note that in both foetal and xenograft hair follicles, NFATC1 expression is predominantly localized to the cytoplasm in bulge cells, while NFATC1 expression in adult facial hair follicles is nuclear-localized in hair follicle bulge region, reminiscent of previous reports showing nuclear-localized NFATC1 in mouse bulge stem cells. Arrows indicate background (BG) staining noises. Dashed boxes indicate magnified bulge regions presented on a corner of each image panel (a, c, d). Dashed brackets indicate bulge region (b). Abbr: hair shaft (HS); dermal papilla (DP); sebaceous gland (SG). Representative immunostaining images are selected from 5 independent staining on 3–5 different samples per tissue type. Scale bars: 100 μm (a, c), 50 μm (b, d). Corresponds with data in Fig. 4.
Supplementary Material
ACKNOWLEDGEMENTS
This work was supported by the Ralph W. and Grace M. Showalter Trust (K.R.K.), the Indiana CTSI (core pilot grant UL1 TR001108 to K.R.K. and Anantha Shekhar), the Indiana Center for Biomedical Innovation (Technology Enhancement Grant to K.R.K.), and the NIH (grants R01AR075018, R01DC017461, R03DC015624 to K.R.K.). Cell lines associated with this study were stored in a facility constructed with support from the NIH (grant C06 RR020128-01). The University of Washington Birth Defects Research Laboratory was supported by NIH award number 5R24HD000836 from the Eunice Kennedy Shriver National Institute of Child Health and Human Development. We would like to thank W. van der Valk, D. O’Day, I. Glass, B. Koh, A. Tward, S. Frumm, D. Spandau, J. Foley, U. Arimpur, E. Longworth-Mills, P-C. Tang, A. Elghouche, M. Kamocka, and C. Miller for their technical assistance. We thank M. Rendl and N. Saxena for critical comments on the manuscript.
Footnotes
COMPETING INTERESTS
J.L. and K.R.K, with the Indiana University Research and Technology Corporation, have submitted a patent application covering the entire skin organoid induction method and including much of the data presented in this manuscript (WO2017070506A1). The other authors declare no competing interests.
REFERENCE
- 1.Sun BK, Siprashvili Z & Khavari PA Advances in skin grafting and treatment of cutaneous wounds. Science 346, 941–945 (2014). [DOI] [PubMed] [Google Scholar]
- 2.Lee J et al. Hair Follicle Development in Mouse Pluripotent Stem Cell-Derived Skin Organoids. Cell reports 22, 242–254 (2018). [DOI] [PMC free article] [PubMed] [Google Scholar]
- 3.Yang R et al. Generation of folliculogenic human epithelial stem cells from induced pluripotent stem cells. Nat Commun 5, 3071–3071 (2014). [DOI] [PMC free article] [PubMed] [Google Scholar]
- 4.Abaci H et al. Tissue engineering of human hair follicles using a biomimetic developmental approach. Nat Commun 9, 5301 (2018). [DOI] [PMC free article] [PubMed] [Google Scholar]
- 5.Gledhill K et al. Melanin transfer in human 3D skin equivalents generated exclusively from induced pluripotent stem cells. Plos One 10, e0136713–e0136713 (2015). [DOI] [PMC free article] [PubMed] [Google Scholar]
- 6.Itoh M et al. Generation of 3D skin equivalents fully reconstituted from human induced pluripotent stem cells (iPSCs). Plos One 8, e77673–e77673 (2013). [DOI] [PMC free article] [PubMed] [Google Scholar]
- 7.Lei M et al. Self-organization process in newborn skin organoid formation inspires strategy to restore hair regeneration of adult cells. Proc National Acad Sci 114, E7101--E7110 (2017). [DOI] [PMC free article] [PubMed] [Google Scholar]
- 8.Heitman N, Saxena N & Rendl M Advancing insights into stem cell niche complexities with next-generation technologies. Curr Opin Cell Biol 55, 87–95 (2018). [DOI] [PMC free article] [PubMed] [Google Scholar]
- 9.Koehler KR et al. Generation of inner ear organoids containing functional hair cells from human pluripotent stem cells. Nat Biotechnol 35, 583–589 (2017). [DOI] [PMC free article] [PubMed] [Google Scholar]
- 10.Koehler KR, Mikosz AM, Molosh AI, Patel D & Hashino E Generation of inner ear sensory epithelia from pluripotent stem cells in 3D culture. Nature 500, 217–221 (2013). [DOI] [PMC free article] [PubMed] [Google Scholar]
- 11.Tchieu J et al. A Modular Platform for Differentiation of Human PSCs into All Major Ectodermal Lineages. Cell Stem Cell 21, 399–-410.e7 (2017). [DOI] [PMC free article] [PubMed] [Google Scholar]
- 12.Wilson P & Hemmati-Brivanlou A Induction of epidermis and inhibition of neural fate by Bmp-4. Nature 376, 331–333 (1995). [DOI] [PubMed] [Google Scholar]
- 13.Minoux M & Rijli FM Molecular mechanisms of cranial neural crest cell migration and patterning in craniofacial development. Development 137, 2605–2621 (2010). [DOI] [PubMed] [Google Scholar]
- 14.Driskell RR et al. Distinct fibroblast lineages determine dermal architecture in skin development and repair. Nature 504, 277–281 (2013). [DOI] [PMC free article] [PubMed] [Google Scholar]
- 15.Betters E, Liu Y, Kjaeldgaard A, Sundström E & in Garcia-Castro MI Analysis of early human neural crest development. Dev Biol 344, 578–592 (2010). [DOI] [PMC free article] [PubMed] [Google Scholar]
- 16.Lee R et al. Cell delamination in the mesencephalic neural fold and its implication for the origin of ectomesenchyme. Development 140, 4890–4902 (2013). [DOI] [PMC free article] [PubMed] [Google Scholar]
- 17.Driskell RR, Giangreco A, Jensen KB, Mulder KW & Watt FM Sox2-positive dermal papilla cells specify hair follicle type in mammalian epidermis. Development 136, 2815–2823 (2009). [DOI] [PMC free article] [PubMed] [Google Scholar]
- 18.Chuong C-M, Yeh C-Y, Jiang T & Widelitz R Module-based complexity formation: periodic patterning in feathers and hairs. Wiley Interdiscip Rev Dev Biology 2, 97–112 (2013). [DOI] [PMC free article] [PubMed] [Google Scholar]
- 19.Velasco S et al. Individual brain organoids reproducibly form cell diversity of the human cerebral cortex. Nature 570, 523–527 (2019). [DOI] [PMC free article] [PubMed] [Google Scholar]
- 20.Pijuan-Sala B et al. A single-cell molecular map of mouse gastrulation and early organogenesis. Nature 566, 490–495 (2019). [DOI] [PMC free article] [PubMed] [Google Scholar]
- 21.Soldatov R et al. Spatiotemporal structure of cell fate decisions in murine neural crest. Science 364, eaas9536 (2019). [DOI] [PubMed] [Google Scholar]
- 22.Joost S et al. Single-Cell Transcriptomics Reveals that Differentiation and Spatial Signatures Shape Epidermal and Hair Follicle Heterogeneity. Cell Syst 3, 221–237.e9 (2016). [DOI] [PMC free article] [PubMed] [Google Scholar]
- 23.Zeisel A et al. Molecular Architecture of the Mouse Nervous System. Cell 174, 999–1014.e22 (2018). [DOI] [PMC free article] [PubMed] [Google Scholar]
- 24.Sennett R et al. An Integrated Transcriptome Atlas of Embryonic Hair Follicle Progenitors, Their Niche, and the Developing Skin. Dev Cell 34, 577–91 (2015). [DOI] [PMC free article] [PubMed] [Google Scholar]
- 25.Lanctot C, Moreau A, Chamberland M, Tremblay M & Drouin J Hindlimb patterning and mandible development require the Ptx1 gene. Nat Genet 126, 1805–1810 (1999). [DOI] [PubMed] [Google Scholar]
- 26.Minoux M et al. Mouse Hoxa2 mutations provide a model for microtia and auricle duplication. Development 140, 4386–4397 (2013). [DOI] [PubMed] [Google Scholar]
- 27.Lim X & Nusse R Wnt Signaling in Skin Development, Homeostasis, and Disease. Csh Perspect Biol 5, a008029 (2013). [DOI] [PMC free article] [PubMed] [Google Scholar]
- 28.Zhu X-J et al. BMP-FGF Signaling Axis Mediates Wnt-Induced Epidermal Stratification in Developing Mammalian Skin. Plos Genet 10, e1004687 (2014). [DOI] [PMC free article] [PubMed] [Google Scholar]
- 29.Richardson GD et al. KGF and EGF signalling block hair follicle induction and promote interfollicular epidermal fate in developing mouse skin. Development 136, 2153–2164 (2009). [DOI] [PMC free article] [PubMed] [Google Scholar]
- 30.Langbein L, Yoshida H, Praetzel-Wunder S, Parry DA & Schweizer J The keratins of the human beard hair medulla: the riddle in the middle. J Investigative Dermatology 130, 55–73 (2010). [DOI] [PubMed] [Google Scholar]
- 31.Gatto G, Smith K, Ross S & Goulding M Neuronal diversity in the somatosensory system: bridging the gap between cell type and function. Curr Opin Neurobiol 56, 167–174 (2019). [DOI] [PMC free article] [PubMed] [Google Scholar]
- 32.Perdigoto CN, Bardot ES, Valdes VJ, Santoriello FJ & Ezhkova E Embryonic maturation of epidermal Merkel cells is controlled by a redundant transcription factor network. Development 141, 4690–4696 (2014). [DOI] [PMC free article] [PubMed] [Google Scholar]
- 33.Jenkins BA & Lumpkin EA Developing a sense of touch. Development 144, 4078–4090 (2017). [DOI] [PMC free article] [PubMed] [Google Scholar]
- 34.Narisawa Y, Hashimoto K, Nakamura Y & Kohda H A high concentration of Merkel cells in the bulge prior to the attachment of the arrector pili muscle and the formation of the perifollicular nerve plexus in human fetal skin. 285, 261–268 (1993). [DOI] [PubMed] [Google Scholar]
- 35.Toyoshima K et al. Fully functional hair follicle regeneration through the rearrangement of stem cells and their niches. Nat Commun 3, 784–784 (2012). [DOI] [PMC free article] [PubMed] [Google Scholar]
- 36.Horsley V, Aliprantis AO, Polak L, Glimcher LH & Fuchs E NFATc1 Balances Quiescence and Proliferation of Skin Stem Cells. Cell 132, 299–310 (2008). [DOI] [PMC free article] [PubMed] [Google Scholar]
- 37.Roberts B et al. Systematic gene tagging using CRISPR/Cas9 in human stem cells to illuminate cell organization. Mol Biol Cell 28, 2854–2874 (2017). [DOI] [PMC free article] [PubMed] [Google Scholar]
- 38.Lee J & Koehler KR Generation of human hair-bearing skin organoids from stem cells. Protocol Exchange (2020). [Google Scholar]
- 39.Butler A, Hoffman P, Smibert P, Papalexi E & Satija R Integrating single-cell transcriptomic data across different conditions, technologies, and species. Nat Biotechnol 36, 411 (2018). [DOI] [PMC free article] [PubMed] [Google Scholar]
- 40.Satija R, Farrell JA, Gennert D, Schier AF & Regev A Spatial reconstruction of single-cell gene expression data. Nat Biotechnol 33, 495–502 (2015). [DOI] [PMC free article] [PubMed] [Google Scholar]
- 41.Stuart T et al. Comprehensive Integration of Single-Cell Data. Cell 177, 1888–1902.e21 (2019). [DOI] [PMC free article] [PubMed] [Google Scholar]
- 42.Hama H et al. ScaleS: an optical clearing palette for biological imaging. Nat Neurosci 18, 1518–1529 (2015). [DOI] [PubMed] [Google Scholar]
Associated Data
This section collects any data citations, data availability statements, or supplementary materials included in this article.
Supplementary Materials
Data Availability Statement
Single-cell RNA sequencing data have been uploaded to the Gene Expression Omnibus (Accession code GSE147206): https://www.ncbi.nlm.nih.gov/geo/query/acc.cgi?acc=GSE147206. In the supplementary material, we have provided HTML files that generate an online interface with which to explore our scRNA-seq analysis pipeline and evaluate additional cell cluster markers for the integrated and non-integrated datasets (Supplementary Data 1–7). In addition, the integrated datasets shown in Figure 2 can be queried via a data exploration portal hosted on our laboratory website: https://www.koehler-lab.org/resources. Source data behind Figures 1–4 are available within the manuscript files.


