Abstract
This paper presents the development of a thin filament pyrometry method to characterize the time-varying temperature field in a medium-scale pool fire burning in a quiescent environment. A digital camera with optical filters and zoom lens was used to record the high temperature emission intensity of 14 μm diameter, Silicon-Carbide filaments oriented horizontally at various heights above the center of a steadily burning 0.30 m diameter methyl alcohol (methanol; CH3OH) pool fire. Experiments collected 30 Hz video of the planar filament array. In a separate experiment, a 50 μm diameter thermocouple was used to acquire independent temperature measurements in the high temperature zone of the fire. A correlation was developed between the probability density functions of the radiation-corrected thermocouple measurements and the camera grayscale pixel intensity of the filaments. This arrangement enables measurement of the time-varying temperature field over a temperature range from about 1150 K to 1900 K with a spatial resolution of 160 μm, a temporal resolution of 0.033 s, and an expanded uncertainty of about 150 K (at a mean temperature of 1300 K).
Measurements of the grayscale pixel intensities of the filaments were obtained. False color maps of the temperature field were produced to characterize the high temperature field as a function of time. Using statistical analysis, the local time-averaged temperatures and their variance for each location on the filaments were determined. Time-averaged temperatures were compared favorably to previously reported measurements. The dominant frequency of the puffing fire was determined. The temperature field time series was transformed to consider its character during consecutive phases of the fire’s puffing cycle. The analysis emphasizes the cyclic nature of a pool fire, providing insight on its complex dynamic structure.
Keywords: methanol, pool fires, pyrometry, temperature field measurements
1. BACKGROUND
Pool fires are a fundamental type of combustion phenomena in which the fuel surface is isothermal, flat, and horizontal, which provides a simple and well-defined configuration for testing models and furthering the understanding of fire phenomena. The flow field is characterized by a dominant puffing frequency associated with the large-scale vortical structures generated by the fire [1]. There are few studies that have reported time-varying field measurements in a medium-scale fire, which may be of interest in the development and validation of computational fluid dynamic fire models. The focus of this study is the development of a method to characterize the time-varying temperature field in a medium-scale methanol pool fire steadily-burning in a well-ventilated, quiescent environment.
Use of fire modeling in fire protection engineering has dramatically increased during the last decade due to the development of practical computational fluid dynamic fire models and the decreased cost of computational power. Today, fire protection engineers use models like the Consolidated Fire and Smoke Transport Model (CFAST) and the Fire Dynamics Simulator (FDS) to design safer buildings, nuclear power plants, aircraft cabins, trains, and marine vessels to name a few types of applications [2, 3]. To be reliable, the models require validation, which involves a large collection of experimental measurements. Traditionally, model validation studies in fire research are typically conducted through comparison of model results with time-averaged and root mean square (rms) measurements of quantities such as temperature and heat flux. Typical fire model validation studies consider time-averaged point measurements – even if many simultaneous local measurements were conducted (e.g., Ref. [4]). Yet, point by point comparisons of means may mask large-scale flow field features. In order to understand the dynamic structure and character of a turbulent fire, it is useful to consider additional ways to compare field measurements and model results in a turbulent fire. This study proposes one possible methodology to enable such comparisons.
Due to the harsh environment, temperature measurements in fires commonly use large diameter thermocouples (> 500 μm), which have relatively large time constants (> 1 s), resulting in instrument response times that are not particularly useful for understanding the time-resolved structure of turbulent fires. Thin filament pyrometry (TFP) offers relatively fast time response measurements. Hariharan et al. measured the structure of a blue fire whirl burning heptane and other hydrocarbons using TFP calibrated by fine wire thermocouples [5, 6]. Pitts used thin filament pyrometry to characterize the structure of acoustically phase-locked flickering methane-air diffusion flames [7].
In this study, methyl alcohol (methanol; CH3OH) was selected as the fuel for investigation since it yields a fire in which negligible amounts of carbonaceous soot are present. The absence of soot creates conditions advantageous for application of thin filament pyrometry methods as there is no background radiation emission, which otherwise would compete with luminosity from the thin filament. Table 1 provides a list of previous local and global measurements [8 – 14] in the well-ventilated, 30 cm diameter, methanol pool fire, which are complementary to the measurements reported here. The investigations help build a comprehensive picture of the energetics, structure, and dynamics of this particular fire.
Table 1.
Previously reported time-averaged global and local measurements in a well-ventilated, steadily-burning, 30 cm diameter, methanol pool fire.
| Parameter | Value [Reference] | |
|---|---|---|
| Global | Mean flame height (m) | 0.51 [11] |
| Pulsation frequency (Hz) | 2.8 [8] | |
| Radiative fraction (kW/m2) | 0.24, 0.20, 0.17, 0.22 [10, 11, 12, 13] | |
| Mass burning flux (g/m2-s) | 15.2, 13.5, 12.7, 12.7, 13, 12.5 [8, 10, 11, 12, 13, 14] | |
| Heat Release Rate (kW) | 22 [10] | |
| Local | Radiative flux distribution onto fuel surface (kW/m2) | [11] |
| Total heat flux distribution onto fuel surface (kW/m2) | [10] | |
| Radiative flux distribution to surroundings (kW/m2) | [10] | |
| Vertical temperature distribution in the fuel (°C) | [11] | |
| Gas species volume fractions (mol/mol) | [9] | |
| Temperature field (°C) | [8, 9] | |
| Velocity field (m/s) | [8] | |
Weckman and Strong [8] made point measurements of local velocity and temperature up to one diameter above the fuel surface of the methanol pool fire for conditions similar to those considered here – they used a 30.5 cm diameter burner with a lip height of 10 mm. Ref. [9] reproduced a portion of the gas-phase temperature data reported in Ref. [8] and extended the spatial extent of the data to 60 cm above the pool surface. The radiative heat flux distribution both onto the fuel surface and emitted to the surroundings for the 0.30 m methanol pool fire are discussed in Refs. [10–11]. Global parameters such as the mean flame height and dominant pulsation (or puffing) frequency have also been previously characterized in this fire [8,11].
This study presents measurements characterizing the transient temperature field in a medium-sized pool fire burning methanol. The results are presented in terms of both the time-averaged field temperature and as the field temperature representative of each of the consecutive phases that characterize the evolving fire as it undergoes its puffing cycle.
2. EXPERIMENTAL METHOD
This section describes the experimental apparatus and methods. More detailed information can be obtained in Refs. [9,10].
2.1. Exhaust Hood and Compartment
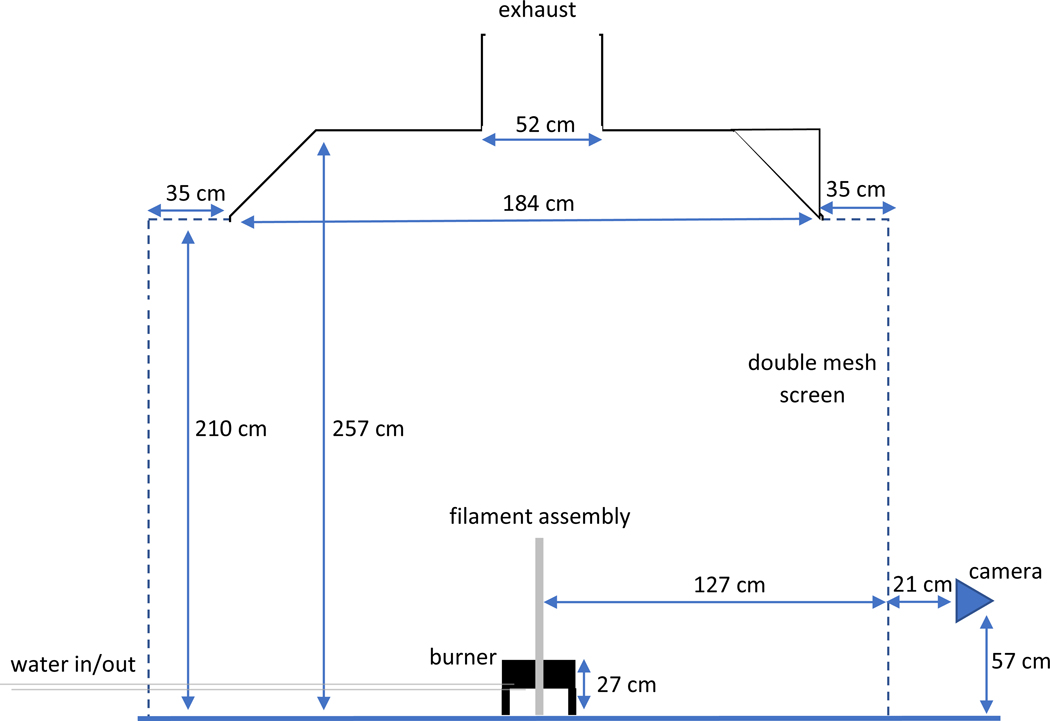
The fuel pan was placed in a compartment with dimensions as indicated in Figure 1. Experiments were conducted under an exhaust hood located 2.5 m above the burner rim. The walls of the compartment (2.54 m by 2.54 m) were formed by a double layer wire mesh screen (6 mesh/cm with 83 % porosity), which created a porous barrier that reduced the influence of room currents on the flow field. The exhaust hood (1.84 m by 1.84 m) was positioned 2.57 m above the floor with an exhaust inlet (0.52 m by 0.52 m).
Figure 1.
Schematic of overall experimental setup. Arrangement of the filament assembly can be found in Figure 2.
The exhaust flow was maintained at 0.50 kg/s using a system of bidirectional probes, averaging pitot tubes, and associated thermocouples.
2.2. Pool Burner
A circular stainless-steel pan with an inner diameter (D) of 0.30 m, a depth of 0.15 m, and a wall thickness of 0.0013 m was used to hold the liquid fuel. The bottom of the burner had a water-cooled section with thermocouples monitoring the water temperature. The water flow rate was about 1 L/min, ensuring that the bottom of the burner was maintained at a near constant temperature (20 °C ± 3 °C)1. The burner was mounted on 7.7 cm “legs” such that the top of the burner rim was 0.27 m above the floor. A fuel overflow section, included for safety, was positioned at a location 10 cm below the rim; it extended 2.5 cm in the radial direction beyond the fuel reservoir outer wall.
Fuel to the burner was gravity fed from a reservoir on a load cell monitored by a data acquisition system. The fuel level was verified throughout the experiment by visually observing the tiny tip of a sharpened (2 mm diameter) pointer that formed a barely discernable bulge on the fuel surface. The level of the fuel was maintained 10 mm below the burner rim by regulating the fuel supply from the reservoir to the burner, using either a thermocouple located just above the pool surface to control a solenoid valve in the fuel feed line or by manually adjusting a valve to control the rate of fuel flow. Based on observation, the expanded uncertainty in the fuel level was estimated to be 1 mm.
2.3. Thermocouple Temperature Measurement
2.3.1. Apparatus and Procedure
A 50 μm diameter bare-bead Type S (Pt- 10% Rh/Pt) thermocouple mounted on a 20 cm long, 3 mm outer diameter, ceramic tube with two holes was used to calibrate the thin filament pyrometry measurement. The thermocouple and filament measurements were not conducted at the same time. Thermocouple calibration measurements were made at 7 radial positions about the center of the flame at a height of 10 cm above the burner. The thermocouple time response was estimated as 0.02 s [15]. The thermocouple leads were oriented horizontally in the fire. The time series of the thermocouple signal was acquired at a rate of 60 Hz for 90 s at 7 locations near the pool centerline of the fire 10 cm above the burner surface and the measurements were repeated. The inherent accuracy of Type S thermocouples is 1.5 K or 0.25 %, whichever is larger [16].
2.3.2. Thermocouple Radiation Correction
The thermocouple measurements were corrected for radiative losses considering an energy balance at the thermocouple bead [17]. The convective- radiative energy balance can be written as:
| (1) |
where T is the gas temperature, Tm is the temperature at the thermocouple bead, Ta is the ambient temperature (298 K), k is the gas thermal conductivity, d is the diameter of the thermocouple bead, σ is the Stefan–Boltzmann constant, ε is the thermocouple emissivity, and Nu is the Nusselt number. Since soot does not present in the methanol fire, the thermocouple emissivity and diameter were considered invariant with time. The bead was approximately spherical as seen in an optical microscope with the bead diameter approximately two times the diameter of the lead wires. The Nusselt number for a sphere is given by Ref. [17]:
| (2) |
where Re is the Reynolds number and Pr is the Prandtl number. The temperature dependent gas properties for k, Re, and Pr were taken as those of air and the temperature dependent emissivity was taken from Ref. [17]. To determine the Re, the measured gas velocity in the 30 cm methanol fire was taken from Ref. [8]. Solving Eq. 1 for T, a radiative correction for the gas temperature was found to be less than 40 K for the peak fire temperature (approximately 1900 K). The sensitivity of the value of the temperature correction to variance in the local velocity was less than 2 K.
2.4. Thin Filament Pyrometry System
2.4.1. SiC Filaments
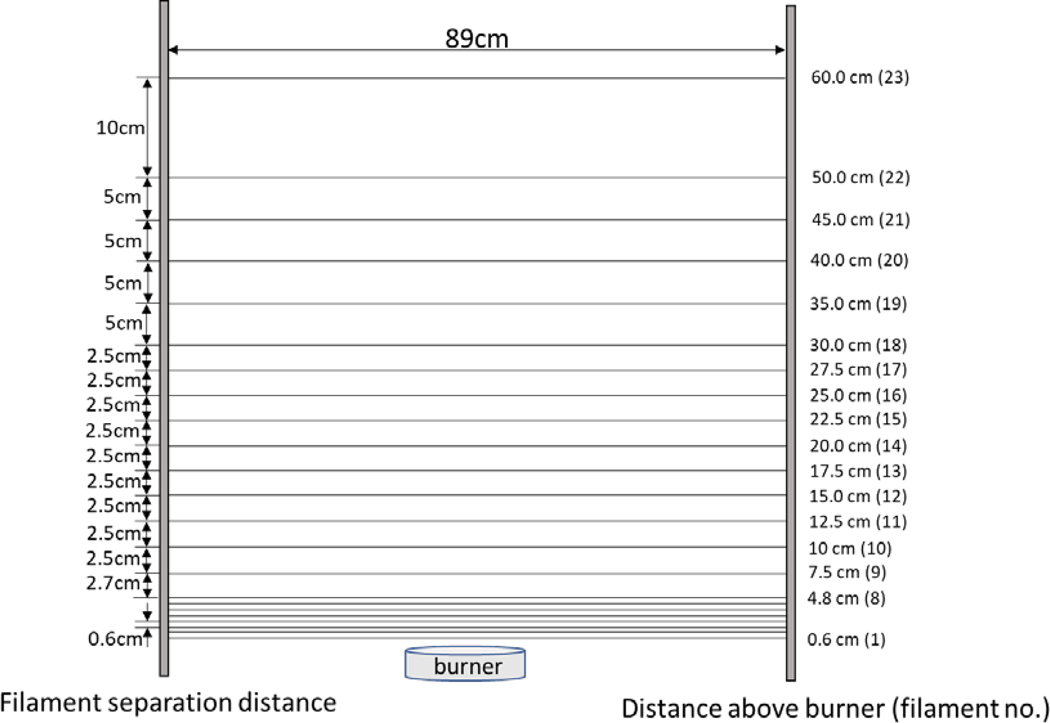
An array of 14 μm diameter Silicon-Carbide (SiC) filaments (Nicalon Type NL 200)2 were oriented horizontally at various heights above a central cross-section of the 0.30 m diameter methanol pool fire. The filaments were originally packaged in a bundle of 500 units encased in a polyvinyl acetate coating. Baking the bundle for 4 hours at 430 °C removed the surface coating, allowing separation of individual filaments from the bundle. The filaments were cut to approximately 0.85 m and each end was attached to string using a fast-drying cyanoacrylate liquid adhesive. The assembly was stretched between two pieces of an extruded aluminum structural framing system that were separated by approximately 0.89 m. Twenty-three filaments were aligned in a plane, parallel to each other, one above the other. The lowest filament was 0.6 cm above the burner, while the highest was 0.60 m above. The distance between the filaments varied with height above the burner as shown in Figure 2.
Figure 2.
Arrangement of the SiC filaments above the burner.
The composition and characteristics of the filaments have been described by Ichikawa [18]. For typical flame conditions, the filament time response has been estimated to be about 1 ms [19, 20]. The effect of heat conduction along the filament on the spatial resolution is shown to be relatively low (estimated to be on the order of 100 μm) [16, 18].
The local gas-phase temperature was determined from the measured filament intensity. The filament intensity at a location in the camera image was determined using the sum of the grayscale values of the seven pixels perpendicular to the filament in either direction following the method in Ref. [5]. Integrating the grayscale intensity perpendicular to the filament is a standard approach to measure luminosity, which allows determination of the total intensity, which is known to “bleed” from one pixel to adjacent pixels. Calibration of the thin filament pyrometry measurement system is described below.
2.4.2. Camera
A Nikon 500D single lens reflex digital camera with optical filters and a zoom lens was used to record the emission intensity of the filaments. The camera was positioned on a tripod and focused onto the center of the filament array, which was located 1.48 m from the camera. Setting the zoom lens to 35 mm allowed imaging of the entire 0.3 m by 0.6 m high temperature flow field. The camera’s aperture size and gain settings were adjusted to avoid pixel saturation. The camera was fitted with a BG7 blue bandpass optical filter and a 10 % neutral density filter. The camera F number was set to 2.8, the ISO speed was 2000, and the shutter speed was 1/60 s. The maximum grayscale pixel intensity was 8 bit in red I, green (G), and blue (B). The red, green, and blue (RGB) pixel intensities were extracted from the images and converted to grayscale as a weighted average of RGB values equal to (0.2989R + 0.5870G + 0.1140B) following Ref. [21]. Experiments collected 120 s of 29.97 Hz video at 4K Ultra High Definition (a frame size of 2840 × 2160 pixels) and 3400 frames were used in the analysis. The results were multiplied by 28 as part of the calculation procedure such that the maximum pixel intensity was 65 535 (216 - 1). Camera images were analyzed using standard features provided in MATLAB. Analogous experiments were conducted with the camera set to tagged image file format (TIFF) rather than video mode. Approximately 1000 images were collected in 12 bit TIFF mode at the camera’s maximum frame rate of 10 Hz. Under conditions used in the experiment, one pixel was equal to about 175 μm or about 12 times the filament diameter of 14 um.
Using a 1400 K blackbody source with a 2.5 cm aperture, the uniformity of pixel sensitivity was tested. The camera/light source conditions were set as in the experiment. The pixel intensity over the camera sensor showed that the pixel sensitivity over the entire sensor was uniform to better than 0.5%, which did not appreciably impact the temperature uncertainty estimate. The effect of angle on camera pixel intensity was also evaluated. The pixel intensity was observed as the blackbody was moved (in the same focal plane) relative to the camera with the result that the difference in grayscale with angle (and distance) was less than 0.5% on-average.
2.4.3. Calibration
The camera-temperature calibration strategy employed the notion that at each flame location, the thermocouple and the filament experienced the same thermal conditions. This implied that the probability density functions (PDFs) of the thermocouple signal and the filament signal were positively correlated. By considering the PDFs, a calibration curve relating the thermocouple temperature and the filament intensity was obtained. Initially, a thermocouple was present in the flow field along with the filament. We found that the image of the thermocouple and its radiative emission interfered with analysis of the filament image viewed by the camera. In addition, the thermocouple could not be positioned at the same exact location as the filament. Ultimately, the thermocouple and filament measurements were conducted separately. The experiment was repeated many times to optimize the dynamic range of the camera settings. The experiment was repeated once using the optimized camera settings.
For the sake of calibration, the PDFs of filament intensity and thermocouple temperature were broken into 200 parts, with the average of each of the parts used to construct the calibration curve. Since the filament intensity signal was only observable when the local temperature was sufficiently high, flame locations with the highest fractional probability of finite signal were selected to construct the calibration. Not surprisingly, these locations were locations of the highest mean temperature in the fire. The high temperature locations were identified based on previously reported thermocouple measurements reported in this fire [8, 9].
2.5. Experimental Procedure
Steady-state burning conditions were established before measurements were initiated. Quasi-steady burning was achieved by maintaining the fuel surface 10 mm below the burner rim during the entire experiment, allowing a warm-up period of 10 min before starting the experiment, water-cooling the burner bottom, and monitoring the burning rate using a load cell. To minimize the effect of water accumulation in the fuel due to back diffusion of water in methanol fires [14], the pool was emptied, and fresh fuel was used in each experiment.
3. RESULTS AND DISCUSSION
3.1. Thermocouple Temperature and Filament Intensity
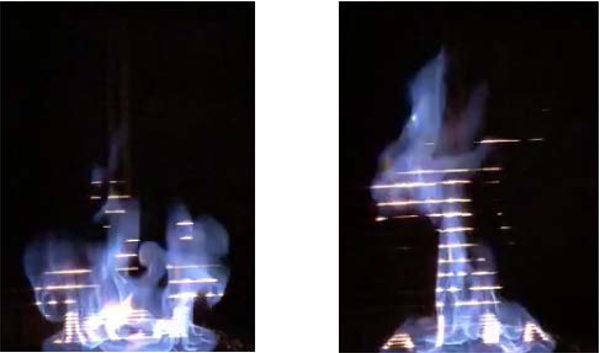
Figure 4 shows over-exposed snapshots of the pulsing methanol fire burning in the 0.30 m stainless-steel water-cooled burner with the thin filaments mounted above the central plane of the burner. For the images used to determine temperature, the camera settings were such that background flames were hardly visible. In Figure 4, some portions of the images show blue methanol flames in the presence of glowing filaments; other portions of the image show blue flames without the presence of glowing filaments, suggesting that the flames were away from the plane defined by the filament array. This low Froude number fire had a narrow necking region and was characterized by a prominent puffing cycle in which a series of repeated large vortical structures were observed to roll towards the fire centerline and neck-in to form a narrow and long visible fire plume. Curved flame sheets were anchored at the burner rim forming the base of the fire. The dynamic fire shape was consistent with previous descriptions of medium-scale pool fires [22].
Figure 4.
Two images of the glowing filaments mounted above the central plane of the methanol pool fire.
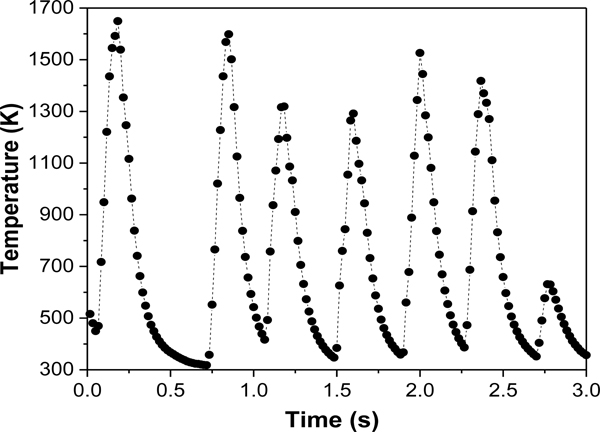
Figure 5 shows a typical trace of the local, radiation-corrected, thermocouple temperature as a function of time in the steadily burning methanol pool fire. The data was acquired at a sampling rate of 60 Hz at a position (Z, R) = (10 cm, 12 cm), where Z and R represent the distance above the burner and the distance from the burner centerline, respectively. This fire position experiences large intermittent extremes of temperature from about 300 K to nearly 1700 K. The temperature appeared to be periodic as discussed below. The radiation-corrected temperatures had an estimated combined expanded uncertainty equal to about ±13 K at 1700 K due to uncertainty in the calibration and the radiation correction (see Eq. 1). This value is smaller than the size of the symbols in the figure.
Figure 5.
Typical time series of the 60 Hz radiation-corrected thermocouple temperature measurement at (Z, R) = (10 cm, 12 cm). The combined uncertainty was less than the size of the symbols, equivalent to ±13 K at 1700 K.
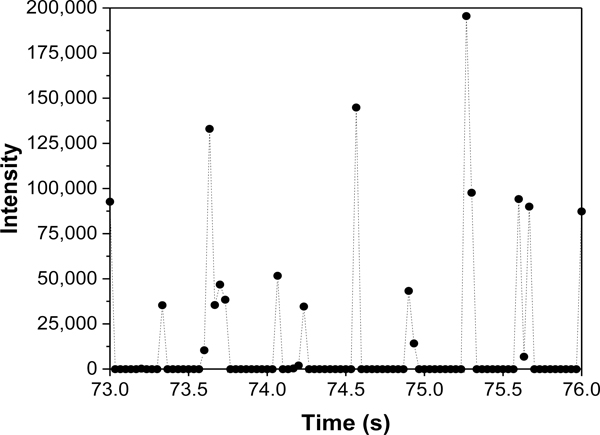
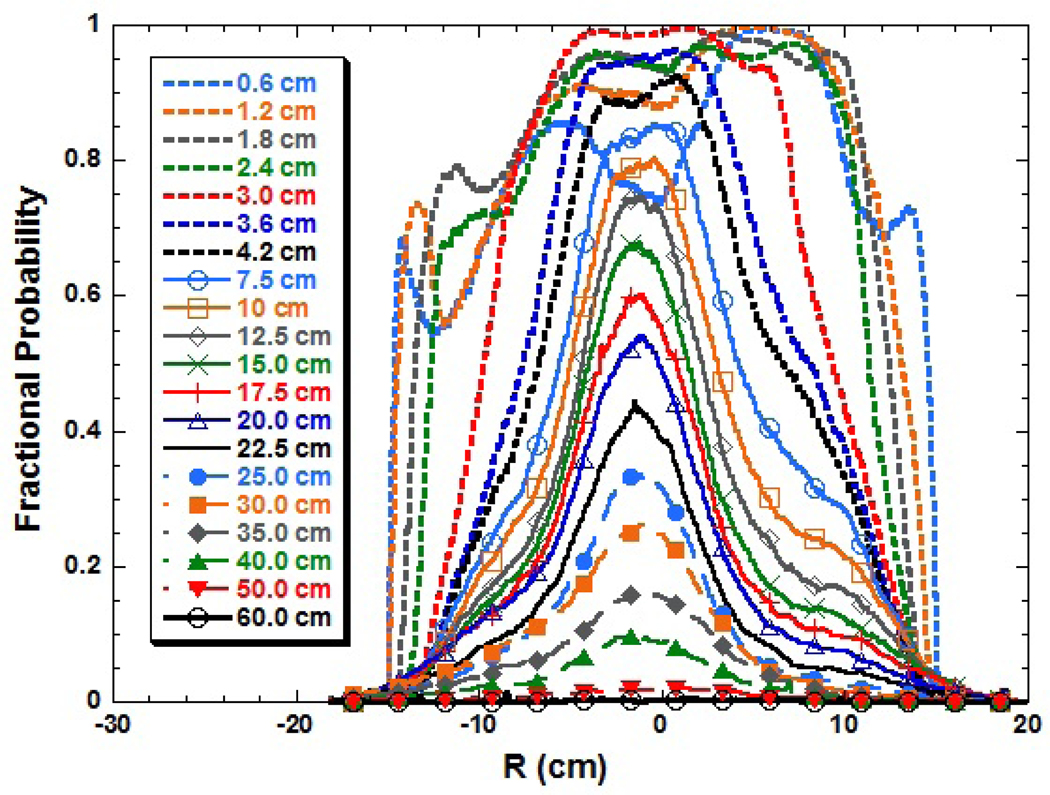
A typical trace of the video-mode grayscale filament intensity at the same fire location is shown in Figure 6. A large fraction of the grayscale time series had values of zero intensity. At this location, 80 % of the grayscale intensities were equal to 0, while 20 % of the instances had grayscale intensities with non-zero values (denoted as the fractional probability, P = 0.20). The range of P varied from 0 to 1, depending on the flame position relative to the distance above the burner (Z) and the radial location (R) relative to the burner centerline as seen in Figure 7. The largest values tended to appear near the fuel surface and along the fire centerline. Asymmetry in the fire is evident in this figure, which is attributed to air currents outside the compartment in the laboratory. In addition, some amount of filament motion was observed, which is attributed to the pulsing, accelerating buoyant flowfield. The standard deviation of the filament’s vertical position varied with distance above the burner and was 1.2 mm on-average. This phenomenon was considered as the filament temperature was determined.
Figure 6.
Typical time series of filament video-mode grayscale intensity at (Z, R) = (10 cm, 12 cm) acquired at a sampling rate of 30 Hz.
Figure 7.
The probability of non-zero grayscale intensity as a function of radial location (R) on each of the filaments.
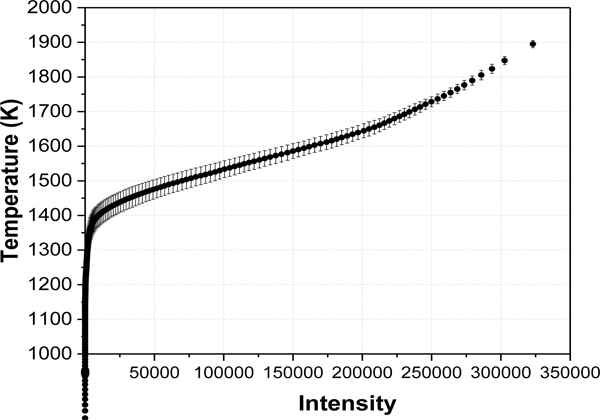
Measurements like those in Figure 5 and Figure 6 were used to develop a temperature-luminosity calibration, considering multiple locations with large P values. Figure 8 shows the relationship between the mean, radiation-corrected, thermocouple temperature and filament video-mode grayscale pixel intensity measurements averaged at seven fire locations (Z=10 cm and R = 0 cm, 1 cm, ±2 cm, 2.5 cm, 3 cm and 4 cm. The measurement variance is also shown, which decreased with temperature and was equal to 86 K at 1000 K and 15 K at 1800 K.
Figure 8.
The averaged radiation-corrected thermocouple temperature and grayscale video-mode filament intensity. The variance was determined from measurements at seven fire locations.
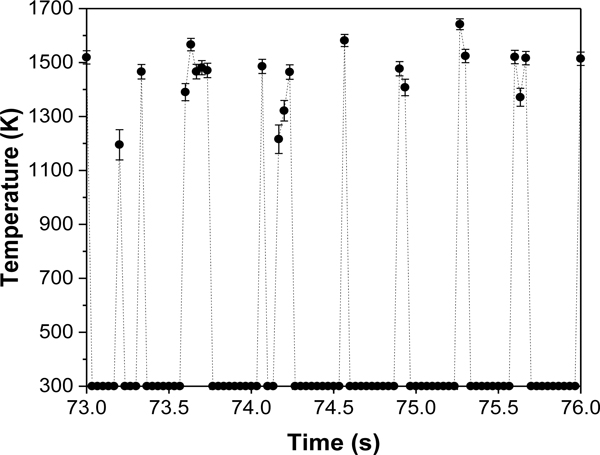
Using the calibration, Figure 9 re-plots the data shown in Figure 6, showing the transient local temperature at (Z, R) = (10 cm, 12 cm). The figure also shows the combined measurement uncertainty, which was dominated by the uncertainty in the calibration (see Figure 8).
Figure 9.
Time series of temperature at (Z, R) = (10 cm, 12 cm) corresponding to the data shown in Figure 6 with the zero intensity instances assumed to equal 300 K. The combined uncertainty is also shown.
Figure 10 shows the instantaneous filament grayscale intensity field for three instances (frame 65, 68, and 71). These frames are separated by approximately 0.1 s in time. The figure shows the changing intensity field, which exhibits substantial changes in its shape and the values of the resulting temperature. Based on the calibration curve as shown in Figure 8, the filament grayscale intensity is converted into temperature. Using a linear interpolation scheme provided in MATLAB, false color maps for frame 65, 68, and 71 are generated and they are presented in Figure 11. It should be noted that the use of traditional temperature measurement techniques (i.e. thermocouples) would be extremely difficult to implement to achieve this level of detail on the time-varying temperature field.
Figure 10.
False color representation of the filament grayscale intensities in the flow field at three instances in time, each separated by 0.1 s, in the pulsing methanol fire. In these figures, the filament thickness is multiplied by a factor of five to improve readability.
Figure 11.
Typical instantaneous field measurements of temperature (determined from the filament intensity) at three instances in time separated by about 0.1 s in the pulsing methanol fire. Here, Z and R represent the distance above the burner and distance from the burner centerline, respectively.
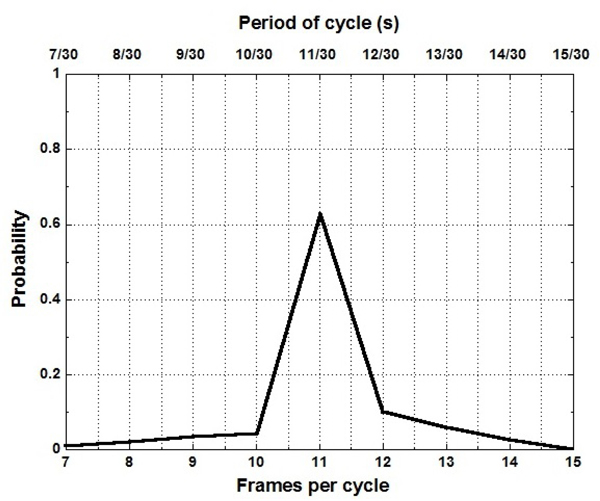
Image analysis of the video record of the instantaneous filament luminosity (such as seen in Figure 11) was used to quantify the fire’s puffing (or pulsation) frequency. Figure 12 shows the results of an analysis of 300 fire pulsation cycles for which the highest probability of cyclic periodicity was 11 frames/cycle. Figure 12 can also be thought of as a probability distribution for the period of a cycle, which varies from 7/30 s (0.23 s) to 15/30 s (0.5 s). The average period was found to be 11.3 (± 0.3) frames/cycle (or 0.38 s ± 0.01 s), which corresponds to a frequency of 2.65 Hz ± 0.08 Hz. The results are consistent with Fourier power spectra of the thermocouple temperature and the filament luminosity time series in the highly intermittent fire region (Z= 10 cm, R= 12 cm; see Figure 5 and Figure 6), which yield the same dominant frequency, equal to 2.64 Hz ± 0.06 Hz and 2.64 Hz ± 0.03 Hz, respectively. These results are consistent with previous estimates of puffing frequency for a 30 cm pool fire [23].
Figure 12.
Normalized probability distribution of the number of 30 Hz video frames for one fire pulsation cycle; alternatively, the probability density distribution of the period of one cycle.
3.2. Estimate of the Temperature Field
The time-averaged/mean temperature field was determined from the filament intensity measurements. Since filament intensity below 1100 K could not be obtained based on the current experimental arrangement, three approaches were used to estimate the mean temperature. In the first approach, the instantaneous temperature at every point was first determined by applying the calibration to the filament grayscale measurements and then effectively time-averaging the results shown in Figure 11 over the entire field. Figure 13 shows the false color map of the interpolated high temperature. For locations where P ≈ 1 (see Figure 7), the results in Figure 13 were expected to be a reasonable estimate of the average field temperature. For locations where P << 1, the results in Figure 13 were expected to have a positive bias since the instances when the filament was cold were not considered in the calculation.
Figure 13.
False color map of the mean, high temperature, filament measurements as a function of location.
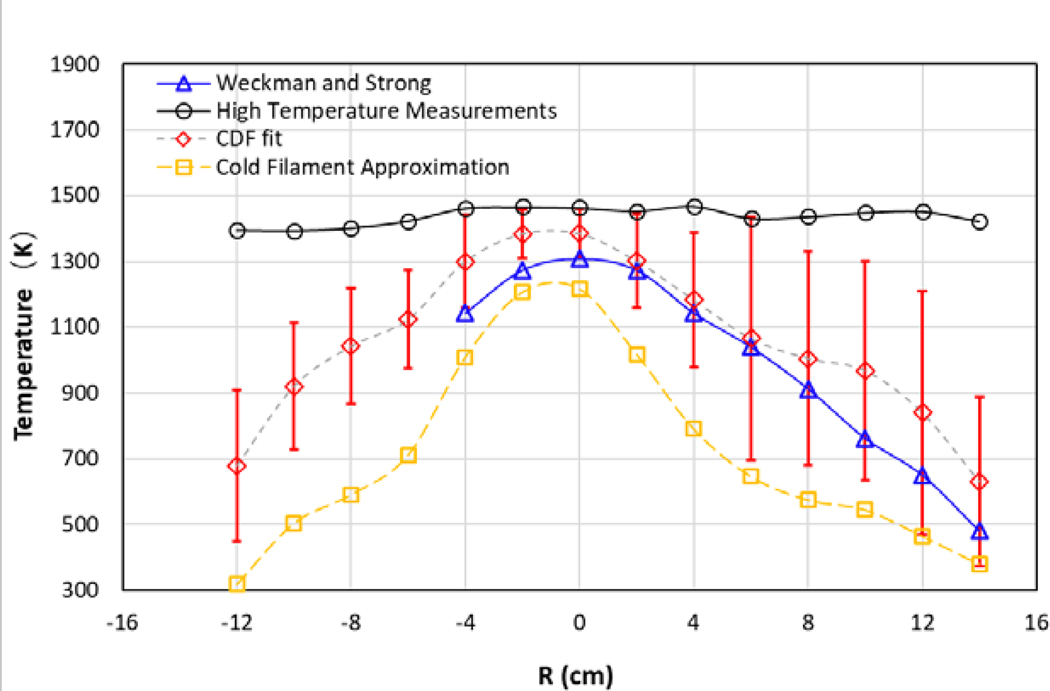
Figure 14 compares the time-averaged, high temperature, filament data (like Figure 13) to previously reported thermocouple measurements [8] as a function of radial distance from the burner centerline (R) for locations 10 cm above the burner. As expected, consideration of only the high temperature filament data led to a positive bias of the time-averaged mean local temperatures compared to the thermocouple measurements with the differences especially significant near the edges of the fire when P << 1.
Figure 14.
Time-averaged thin filament temperature profiles 10 cm above the burner surface using three methods compared to thermocouple measurements reported by Weckman and Strong [8].
As shown in Figure 14, the second approach was denoted as “cold filament” approximation. This approach is based on Ref. [5] in which the temperature was assumed to be equal to 300 K when the filament luminosity cannot be measured. As expected, this assumption led to a negative bias of the estimated time-averaged local temperature as compared to previously reported thermocouple measurements [8].
In order to reduce the effect of missing filament temperature, the third approach denoted as “CDF Fit” in the figure was used to estimate the mean temperature in the time series from a fit of the cumulative density function (CDF) to a Gaussian distribution, . A regression analysis of the CDF was used to estimate the mean and standard deviation of the time series at each position. The CDF is given by:
| (3) |
where Ti is the ith temperature determination, μ is the mean, and σ is the standard deviation of the distribution. The fit to the cumulative density function was obtained for locations even when P << 1. A standard regression analysis was conducted. At each position, the minimum difference between the local time series and the fit was determined through an iterative process by varying the fitting parameters: (μ, σ). The value of the statistical R2 fitting metric was > 0.95 for more than 90 % of the time series data and always > 0.9. The expanded uncertainty to the regression analysis is shown as error bars in the figure. The combined uncertainty, which was larger, was dominated by the uncertainty in the calibration and varied as a function of temperature. At 1000 K, the combined uncertainty was equal to ± 200 K. Figure 14 shows that the trends in the CDF results were in general agreement with the trends in the thermocouple measurements reported by Weckman and Strong [8]. Radiation-corrected thermocouple measurements conducted as part of this study (following Equations 1 and 2) are also provided in the figure. For P > 0.5, the TIFF mode temperature results were on-average 34 K larger than the video temperature results, which was within experimental uncertainty. The rest of this paper focuses on the video results.
Figure 15 shows typical measurements and fitted Gaussian distributions plotted as CDFs for two fire locations (Z, R) = (10 cm, 12 cm) and (10 cm, 0 cm), where P was equal to 0.14 and 0.77, respectively. From the 3400 camera frames, only 476 frames were available to compose the CDF since P was equal to 0.14. As exemplified in the figure, the goodness of fit was generally better when P was larger. The value of the coefficient of determination (R2) was always greater than about 0.9, which characterized the efficacy of using a Gaussian distribution. It should be noted that the mean temperature at a particular location was determined based on this fitting routine.
Figure 15.
CDF measurements and fits for positions (left; Z=10 cm, R=12 cm with P=0.14) and (right; Z=10 cm, R=0 cm with P=0.77).
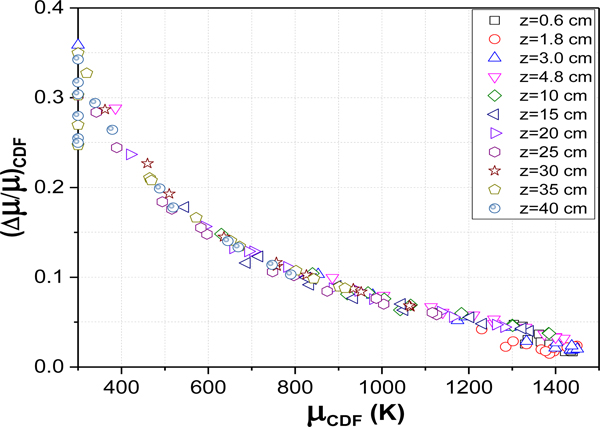
Figure 16 shows the normalized expanded uncertainty (95 % confidence level) in the CDF fit for multiple fire locations as a function of the mean temperature, which was estimated following Ref. [24]. As the temperature decreased, P decreased, and the uncertainty increased. For the largest temperatures, the expanded uncertainty was less than 6 % of the mean temperature, which was about a factor of 7 larger than the inherent thermocouple uncertainty. For the smallest temperatures, the normalized expanded uncertainty approached 30 % of the mean temperature, a relatively large value. The uncertainty shown in Figure 16 is a useful parameter for evaluating the efficacy of the TFP method applied here. Experimental repeatability was about 57 K on-average, considering high temperature regions of the fire where the mean temperature was greater than about 1100 K, computed using the cold-filament approximation.
Figure 16.
Relationship between the normalized uncertainty in the temperature determined using CDF fits for various radial positions on 11 filaments with Z varying from 0.6 cm to 40 cm above the burner rim.
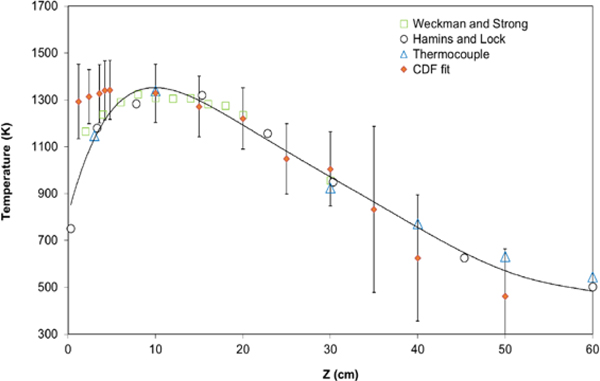
Figure 17 compares the time-averaged, thin filament temperature results determined from CDF fits with thermocouple measurements conducted as part of this study and previously reported in [8, 9] as a function of distance (Z) above the burner rim for locations on the central axis (R=0). A polynomial fit to the data is shown. Consideration of the expanded uncertainty in the filament temperature (see for example Figure 16) indicates that the mean filament temperatures are in general agreement with the thermocouple results to within measurement uncertainty except very near the fuel surface.
Figure 17.
Comparison of the mean temperature based on CDF fit, current temperature measurement (denoted as thermocouple) and two other temperature measurement based on previous experiments provided in [8, 9] as a function of different vertical distance at the center of the burner. The previous temperature measurements are denoted as “Weckman and Strong” [8] and “Hamins and Lock” [9]. The error bars represent the expanded uncertainty to each of the CDF fits. A fit to all the thermocouple data is shown as the solid line.
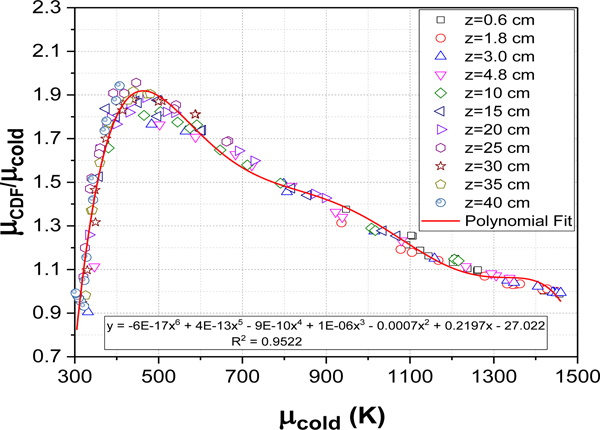
Figure 18 shows the mean temperature field calculated using the CDF fit method compared to the mean temperature determined using the cold filament approximation method (which set the zero grayscale filament intensity instances equal to 300 K). The results were approximately represented by a 5th order polynomial fit as seen in the figure suggesting that the relationship between the mean temperatures determined using the cold filament approximation and the CDF fits were independent of position in the fire. This relationship was used to estimate the mean temperature field discussed below.
Figure 18.
Relationship between the mean temperatures determined from the CDF fit and the cold filament temperature approximation for various radial positions on 11 filaments.
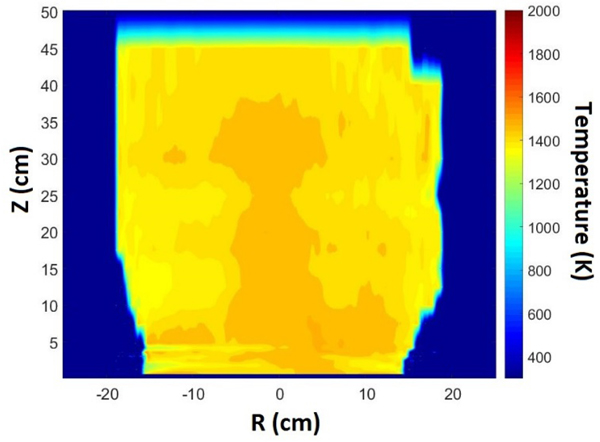
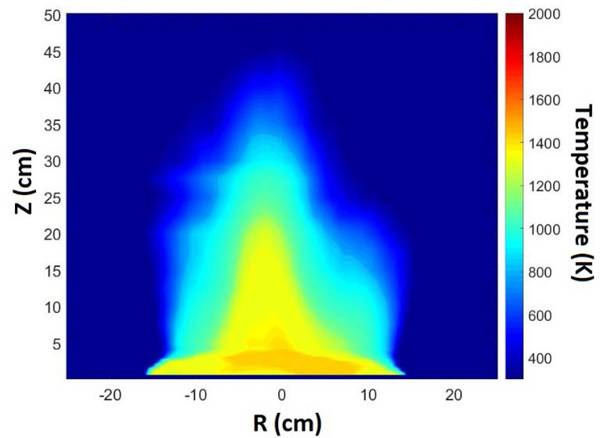
Figure 19 shows a false color map of the mean temperature field determined using the correlation provided in Figure 18. The map is developed using a linear interpolation of the filament data. The largest mean temperatures were found along the centerline near the burner surface, as expected from previous measurements [8, 9]. The values of the largest mean temperatures were approximately 1300 K, similar to the values seen in Figure 17. The combined uncertainty in the temperature map was dominated by the uncertainty in the calibration and varied as a function of temperature. At 1000 K, the combined uncertainty was approximately equal to ± 200 K, whereas at 1500 K, it was equal to ± 120 K.
Figure 19.
Mean temperature field calculated as a function of position using the CDF fit method.
3.3. Changing Temperature Field
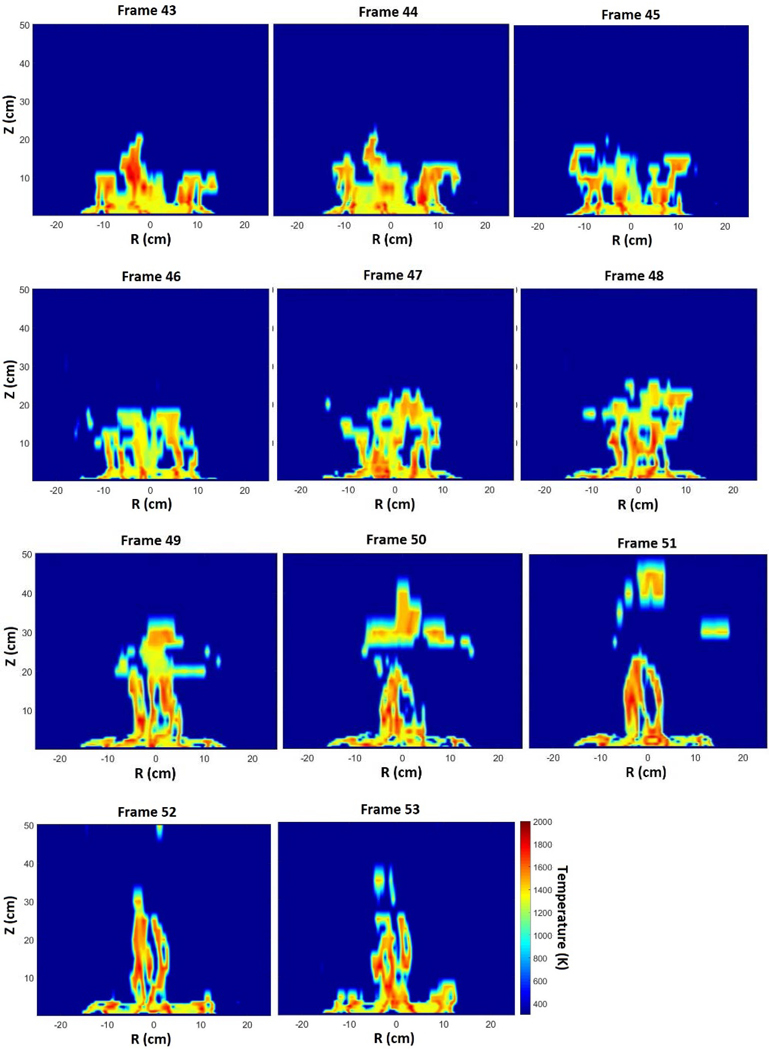
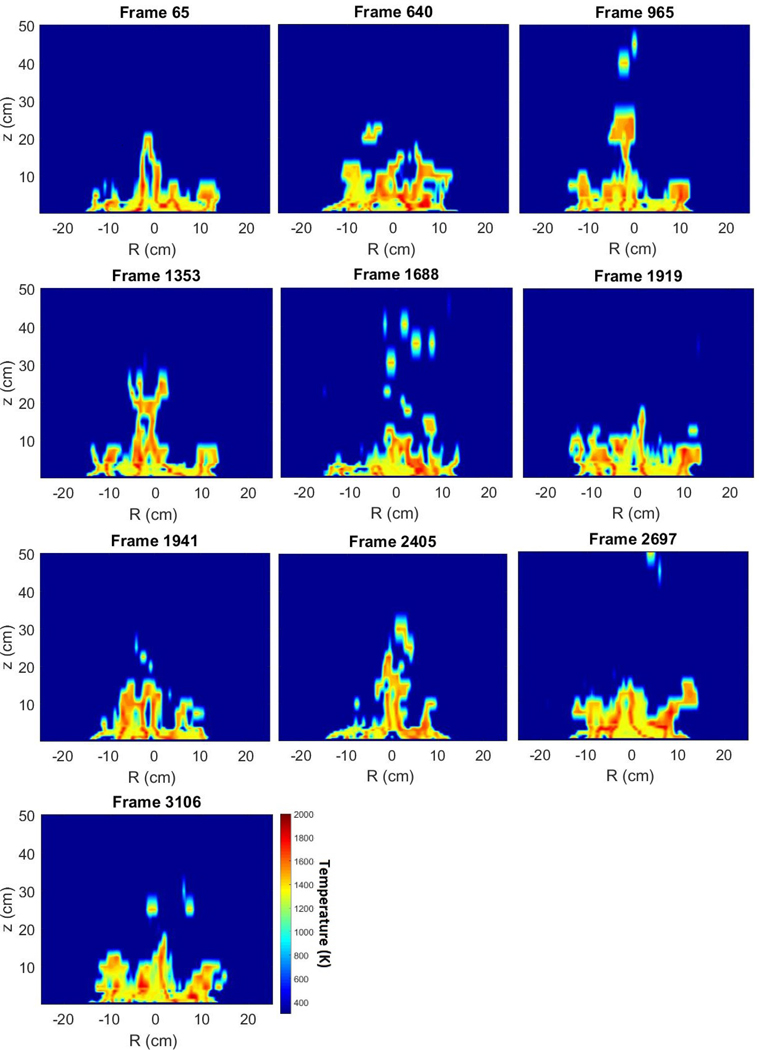
Figure 20 shows false color maps of the instantaneous temperature field for a fire puffing cycle. Based on the dominant frequency, a cycle with a period represented by 11 video frames (0.366 s) is considered. The consecutive temperature maps are separated by approximately 0.033 s in time and can be thought of as 11 phases in one fire puffing cycle. The maps were generated using a linear interpolation scheme provided in MATLAB. Interpolation in the vertical direction was based on the distance between the filaments (which varied with position), whereas interpolation in the radial (horizontal) direction was based on 20 pixels (equal to about 3. 5 mm). The maps provide a means to visualize the changing nature of the time-varying temperature field in the fire.
Figure 20.
False color maps of the instantaneous temperature field for one cycle of the pulsing fire (top row: Phases 1–3; second row: Phases 4–6; third row: Phases 7–9; last row: Phases 10–11).
Here, the cyclic nature of the puffing pool fire is emphasized by transforming the time series of field temperatures into “phase space.” Considering the instantaneous temperature maps (e.g., Figure 20), reference phases for each and every puffing cycle were identified. Selection of the reference phases was based on identification of a moment in the cycle that was distinct, integrating the calculated time-varying temperature for the filament located 30 cm above the pool as it evolved during a puffing cycle. A parametric study showed that this approach provided consistent identification of a new puffing cycle. Once selected, the frame order was defined for the subsequent phases within that cycle - and that cycle only. The reference phase was independently determined for each puffing cycle. The precise definition of the reference phase has no impact on this analysis but is important for synchronization of the cycles.
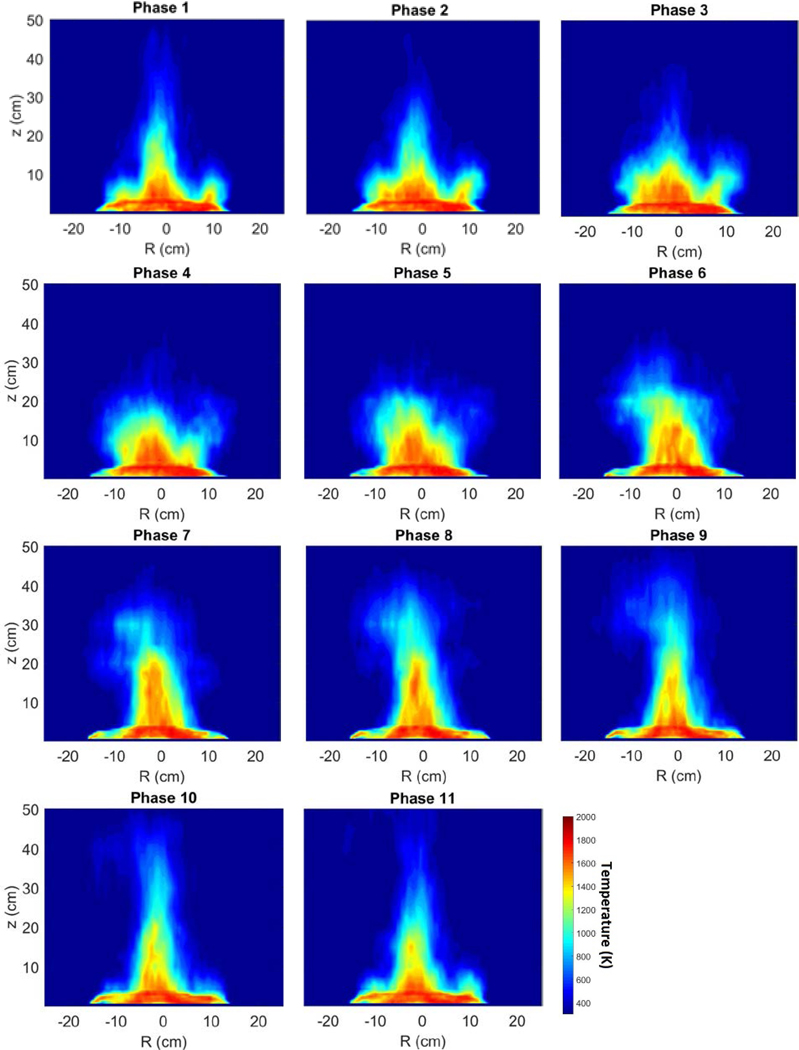
Figure 21 shows false color maps of the instantaneous temperature field associated with a particular phase* (i.e. phase 1) during ten different puffing cycles - for cycles that were nominally 11 frames (0.366 s) in duration. Puffing cycles with different periods were not considered here. The figure shows noticeable differences in the temperature field – even though every map represents the same phase in the fire puffing cycle. These differences may be caused by small differences in the period and initial phase of each cycle. Figure 22 shows a false-color map of the temperature field averaged for each phase during 300 puffing cycles that were 11 frames in duration (0.366 s). Puffing cycles that were not composed of 11 frames were not considered in this figure. The maps were constructed using the measured time series of filament grayscale intensity determined by applying the cold filament approximation and the correlation seen in Figure 18. As expected, the averaged temperature maps in Figure 22 appear smeared when compared to the instantaneous results in Figure 20. Uncertainty in the selection of the reference phase of the cycles contributes to the smearing. This uncertainty is related to the exact duration of the period and the value of the initial phase of each of the reference frames relative to the video record. Variance in the period and initial phase of a cycle leads to an estimated uncertainty of ±1/2 frame and ±1 frame, respectively, in the measured period of a cycle. The combination of these variances represents about frames (or ≈1.1 frames). For a 11 frame puffing cycle, these variances represent about 10 % of the cycle. The turbulent nature of the fire also contributes to the smearing.
Figure 21.
Comparison of the instantaneous temperature field in the reference phase of 10 distinct puffing cycles – all with a periodicity of 11 frames.
Figure 22.
False color map of the mean temperature fields during consecutive phases for fire cycles with a periodicity of about 0.366 s (11 frames) ± 0.033 s (1 frame).
4. SUMMARY AND CONCLUSIONS
Measurements were made to characterize the time-varying temperature field in a medium-scale methanol pool fire steadily burning in a quiescent environment. Previous pool fire measurements were made at a single location – temporally uncorrelated with other fire locations. Field measurements enable understanding of the complex thermal structure of a pool fire.
A correlation was developed between the probability density functions of the radiation-corrected thermocouple temperature measurements and the filament luminosity. The filament was observable by the camera only when its radiation emission was sufficiently large, and the gas temperature was sufficiently high, corresponding to a gas temperature of about 1150 K. A percentage of the camera observations exhibited zero grayscale intensity, depending on the instant in time and location in the fire. A calibration was developed that related the gas temperature to the observed filament luminosity. A regression analysis determined the mean temperature and its variance from the cumulative density function (CDF) of the distribution of calculated filament temperatures for locations where the probability of grayscale pixel intensity in the camera image was greater than about 0.05. The resulting fit for time-averaged temperatures followed trends previously reported [8]. The fitting routine (CDF) is a refinement of the previously developed cold filament approach [5]. This approach fully exploits the high temperature filament intensity information through consideration of statistical probabilities. Finally, an estimate of the instantaneous flame temperature was considered through the correlation between the CDF fit and the cold filament approximation.
A correlation was developed between the fits to the time-averaged gas temperatures and the probability of grayscale pixel intensity in the camera image. This relationship was used to transform the temperature field time series to consider the temperature field during the various phases that compose the fire’s puffing cycle. The results provide insight into the complex dynamic character of the time-varying pool fire.
The thin filament pyrometry methods used in this study have several limitations. They are not suggested as a replacement for the accuracy of thermocouple measurements, particularly at locations where the fire is not relatively hot, but it does provide detailed information on the spatial character of the time-varying temperature field. The method is most easily applied to non-luminous fires burning fuels such as methanol or nitrogen diluted hydrogen, for example, in which the background signal from radiating soot is not a factor. The assumption of a Gaussian fit everywhere in the fire is better in some fire locations than others, which influences the accuracy of the estimated mean temperature. The use of an infrared video camera may improve measurement accuracy particularly at lower temperatures.
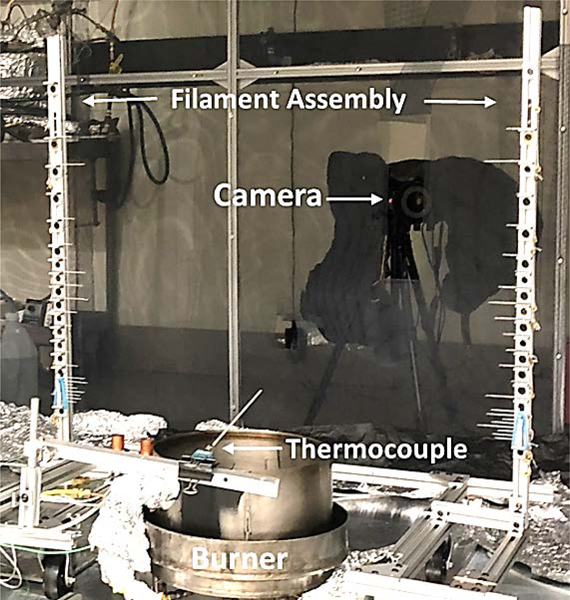
Figure 3.
Experimental apparatus and instrumentation including the filament assembly, thermocouple, and camera positioned about the screened compartment.
5. ACKNOWLEDGEMENTS
Many thanks are due to Michael Gollner and Peter Sunderland of the University of Maryland at College Park and Howard Baum of NIST for helpful discussions. The authors are grateful to Nippon Carbon Co and Hugh Spilker of COI Ceramics for providing the SiC filament samples.
Footnotes
Unless otherwise noted, the uncertainty in this paper is expressed as the combined uncertainty with a coverage factor of two, representing a 95 % confidence interval.
Certain commercial entities, equipment, or materials may be identified in this document in order to describe an experimental procedure or concept adequately. Such identification is not intended to imply recommendation or endorsement by the National Institute of Standards and Technology, nor is it intended to imply that the entities, materials, or equipment are necessarily the best available for the purpose.
The word phase is applied as commonly used, referring to an instance in time on a cyclic waveform.
6. REFERENCES
- 1.Cetegen BM, Ahmed T, “Experiments on the Periodic Instability of Buoyant Plumes and Pool Fires,” Combustion and Flame 93, 157–184 (1993). [Google Scholar]
- 2.Peacock RD, Reneke PA, Forney GP, CFAST – Consolidated Model of Fire Growth and Smoke Transport (Version 6), NIST Special Publication; 1041r1, March 2013. 10.6028/NIST.SP.1041r1v [DOI] [Google Scholar]
- 3.McGrattan K, McDermott R, Hostikka S, Floyd J, Weinschenk C, Overholt K , Fire Dynamics Simulator, National Institute of Standards and Technology, Gaithersburg, MD, NIST Special Publication 1019, Sixth Edition, April 2016. 10.6028/NIST.SP.1019 [DOI] [Google Scholar]
- 4.Hamins A, Johnsson E, Donnelly M, Energy Balance in a Large Compartment Fire, Fire Safety J. 43, 180–188 (2008). [Google Scholar]
- 5.Hariharan SB, Sluder ET, Gollner MJ, Oran ES, Thermal Structure of the Blue Whirl, Proc. Combust. Inst. 37, 4285–4293 (2019). 10.1016/j.proci.2018.05.115 [DOI] [Google Scholar]
- 6.Hariharan SB, The Structure of the Blue Whirl: A Soot-Free Reacting Vortex Phenomenon, Master’s Thesis, University of Maryland at College Park, 2017. [Google Scholar]
- 7.Pitts WM, Thin Filament Pyrometry in Flickering Diffusion Flames, Proc. Twenty-Sixth Sym. (Int.) on Combust, The Combustion Institute, 1171–1179 (1996). https://ws680.nist.gov/publication/get_pdf.cfm?pub_id=911805 [Google Scholar]
- 8.Weckman EJ, and Strong AB, Experimental investigation of the turbulence structure of medium-scale methanol pool fires, Combustion and Flame 105, 245–66 (1996). [Google Scholar]
- 9.Hamins A, Lock A, The Structure of a Moderate-Scale Methanol Pool Fire, NIST Technical Note 1928, October 2016. 10.6028/NIST.TN.1928 [DOI]
- 10.Kim SC, Lee KY, Hamins A, Energy Balance in Medium-Scale Methanol, Ethanol, and Acetone Pool Fires, Fire Safety J, 107:44–53 (2019). 10.1016/j.firesaf.2019.01.004 [DOI] [PMC free article] [PubMed] [Google Scholar]
- 11.Hamins A, Klassen M, Gore J, Fischer S, Kashiwagi T, Heat Feedback to the Fuel Surface in Pool Fires, Combust. Sci. Tech. 97, 37–62 (1993). [Google Scholar]
- 12.Klassen M, Gore JP, Structure and Radiation Properties of Pool Fires, NIST Report GCR-94651, National Institute of Standards and Technology, Gaithersburg, MD, June 1994. [Google Scholar]
- 13.Buch R, Hamins A, Konishi K, Mattingly D, Kashiwagi T, Radiative Emission Fraction of Pool Fires Burning Silicone Fluids, Combust. Flame 108, 118–126 (1997). [Google Scholar]
- 14.Corlett RC, Fu TM, Some Recent Experiments with Pool Fires, Pyrodynamics 1, 253–269 (1966). [Google Scholar]
- 15.OMEGA, Thermocouple Response Time, website consulted 7/1/2018. https://www.omega.com/techref/ThermocoupleResponseTime.html
- 16.Reotemp Instruments, Type S Thermocouples; website consulted 7/1/2018. http://www.thermocoupleinfo.com/type-s-thermocouple.htm
- 17.Bergman TL, Lavine AS, Incropera FP, DeWitt DP, Fundamentals of Heat and Mass Transfer, 7th ed., Wiley, 2011. [Google Scholar]
- 18.Ichikawa H, Advances in SiC Fibers for High Temperature Applications, Advances in Science and Technology Online 50, 17–23 (2006). doi: 10.4028/www.scientific.net/AST.50.17 [DOI] [Google Scholar]
- 19.Maun JD, Sunderland PB, Urban DL, Thin-filament pyrometry with a digital still camera, Applied Optics 46, 483–488 (2007). [DOI] [PubMed] [Google Scholar]
- 20.Bedat B, Giovanni A, Pauzin S, Thin Filament Infrared Pyrometry: Instantaneous Temperature Profile Measurements in a Weakly Turbulent Hydrocarbon Premixed Flame, Experiments in. Fluids 17, 397–404 (1994). 10.1007/BF01877042 [DOI] [Google Scholar]
- 21.Mathworks Documentation: rgb2gray; website consulted 7/1/2018. https://www.mathworks.com/help/matlab/ref/rgb2gray.html
- 22.Weckman EJ, Sobesiak A, Proc. Twenty-Second Symposium (International) on Combustion, The Combustion Institute, Pittsburgh, 1299 (1988). [Google Scholar]
- 23.Hamins A, Yang JC, Kashiwagi T, An Experimental Investigation of the Pulsation Frequency of Flames, Proc. Twenty-Fourth Sym. (Int.) Combust. 1695–1702 (1992). [Google Scholar]
- 24.Petty MD, Advanced topics in calculating and using confidence intervals for model validation. Spring Simulation Interoperability Workshop 2013, 194–204 (2013). [Google Scholar]


