Abstract
Optogenetic technology has enabled unparalleled insights into cellular and organ physiology by providing exquisite temporal and spatial control of biological pathways. Here, an optogenetic approach is presented for selective activation of the intrinsic cardiac nervous system in excised perfused mouse hearts. The breeding of transgenic mice that have selective expression of channelrhodopsin in either catecholaminergic or cholinergic neurons is described. An approach for perfusing hearts excised from those animals, recording the ECG to measure heart rate changes, and an illumination approach using a custom micro-LED light source to activate channelrhodopsin is explained. We have used these methods in ongoing studies of the kinetics of autonomic control of cardiac electrophysiology and contractility, demonstrating the proven utility of optogenetic technology to enable unparalleled spatiotemporal anatomic-functional probing of the intrinsic cardiac nervous system.
1. Introduction
Optogenetic tools have enabled unparalleled insights into fundamental intra- and intercellular processes by providing exquisite control of membrane potential1–4 and other cellular processes5 in single cells and biological networks. Optogenetics was originally developed for cell-specific activation of neurons and subsequently applied to control excitation and contraction in cardiac tissue6,7. Cellular light sensitivity is transcribed by induced expression of the light-gated cation channel channelrhodopsin (ChR2). Photostimulation of neurons expressing ChR2 have demonstrated spatiotemporal control in the photoactivated release of multiple neurotransmitters, including oxytocin8, norepinephrine (NE)9,10 and acetylcholine (ACh)11–14. The transduction of ChR2 into cells can be accomplished using transgenic animals15 or the exogenous delivery of the ChR2 gene by direct plasmid transfection6 or by using a virus16,17.
Cell-specific photoactivation is particularly useful for interrogating how distinct cell populations modulate the function of organs and tissues. For the heart, where intercellular communication between numerous cell types is critical for each contraction, optogenetics has provided a wealth of insights into normal physiology and disease10,18–20. For example, targeted expression of ChR2 enables either branch of the cardiac autonomic nervous system to be stimulated in a temporally and regionally specific manner. Recent work has demonstrated how targeted expression of ChR2 and fluorescent probes to autonomic neurons can be used to image the anatomy of the intrinsic cardiac nervous system and to measure the exquisite control of heart rate and contractility provided by autonomic nerves9,10,14,21.
Targeted cell-type expression of exogenous proteins is often accomplished using Cre/lox recombination and cell-specific promoters22. In a transgenic implementation of this system, a Cre responder animal would have a loxP-flanked STOP cassette upstream of a ChR2+EYFP fusion gene. This animal would then be mated with a Cre driver animal that expresses Cre recombinase under control of a cell-specific promoter such as alpha-myosin heavy chain (cardiomyocytes)23, tyrosine hydroxylase (TH, catecholaminergic neurons)9,24, or choline acetyltransferase (ChAT, cholinergic neurons)25. In the progeny, ChR2+EYFP would possess promoter-specific expression only in the targeted cells.
We present an optogenetic approach for selectively activating the intrinsic cardiac nervous system in excised perfused mouse hearts. The breeding of transgenic mice that have selective expression of ChR2+EYFP in either catecholaminergic or cholinergic neurons is described. An approach for perfusing excised hearts, recording the ECG to measure heart rate changes, and an illumination approach using a custom micro-LED light source is explained. We have used these methods in ongoing investigations of the kinetics of autonomic control of cardiac electrophysiology and contractility9,14. Similar methods have been used by others with similar outcomes in both cell-specific ChR2 expression and heart rate responses10,21. In sum, the methods presented here apply the proven utility of optogenetic technology to enable unparalleled spatiotemporal anatomic-functional probing of the intrinsic cardiac nervous system.
2. Materials
2.1. Transgenic mouse colonies (see Note 1)
TH-Cre colony (TH-Cre 1 or TH-1 Cre): these mice have knock-in hemizygous expression of Cre recombinase in catecholaminergic cells using a tyrosine hydroxylase (TH) promoter26.
ChAT-Cre colony (ChAT-IRES-Cre or ChAT-IRES-Cre::frt-neo-frt): these mice have knock-in homozygous expression of Cre recombinase in cholinergic cells using a choline acetyltransferase (ChAT) promoter27.
ChR2+EYFP colony (Ai32 or Ai32(RCL-ChR2(H134R)/EYFP)): these mice are homozygous for the expression of an improved ChR2+EYFP fusion protein following exposure to Cre recombinase28.
2.2. Mouse genotyping
Sealable 96 well plates from Transnetyx.
Forceps.
Ear punch.
Sterile towel drape.
70% ethanol.
Isoflurane induction chamber.
Prelabeled shipping envelope.
2.3. Perfusion system and data acquisition
Modified Krebs-Henseleit (KH) solution: 118 mM NaCl, 4.7 mM KCl, 1.25 mM CaCl2, 0.57 mM MgSO4, 1.17 mM KH2PO4, 25 mM NaHCO3, 6 mM glucose (see Note 2). The pH should be between 7.35 and 7.45 (see Note 3).
Cellulose nitrate membrane filter, 0.2 μm pore size to initially filter the KH solution.
95% O2/ 5% CO2 gas tank with pressure regulator.
A constant pressure excised heart (Langendorff) perfusion system that is suitable for retrograde perfusion of mouse hearts29.
Nuclepore polycarbonate membrane filter, 12 μm pore size as the in-line perfusate filter.
Data acquisition device and real-time signal display software.
3 29-gauge needle electrodes to acquire the pseudo-lead I electrocardiogram (ECG).
A low-noise bioamplifier.
A T-type thermocouple probe.
2.4. Micro-LED light source to excite ChR2
Surface-mount LEDs (ie, Dialight 598 series, Vf 3.2V) with peak wavelength at 465 nm. The size of these LEDs is 1.6 mm × 0.8 mm × 0.7 mm.
Polydimethylsiloxane (PDMS, ie, Sylgard 184) for LED encapsulation.
Optical power and energy meter.
Function generator that can deliver at least 40 mA of DC current.
3. Methods
3.1. Transgenic mouse colony breeding
Once procured, mice from each of the three strains (above) are inbred to increase the size of the three colonies (see Note 4). Breeding pairs are housed in the same cage for at least two weeks or until signs of pregnancy appear.
- Once colonies reach a sustainable size (containing at least 5 active breeding pairs), crossbreeding of mice between colonies is initiated to generate offspring that express ChR2+EYFP in either cholinergic or catecholaminergic cells (Figs. 1–3). Offspring will be used in experiments and should not be inbred. The following pairing is used:
After noting pregnancies, males should be moved to a new cage.
Litters must be weaned when they were 21 – 28 days old.
Breeding pairs should be retired at 8 months of age. New breeding pairs should be established with animals that are between two and six months old. Inbreeding of each colony is on-going to ensure colony maintenance.
Every other generation of each of the three colonies should be genotyped (12–16 animals each) to ensure maintenance of the desired genetic expression. Non-expressing mice should be culled (see Note 6).
Figure 1. Transgenic mouse breeding for cell-specific expression of ChR2.
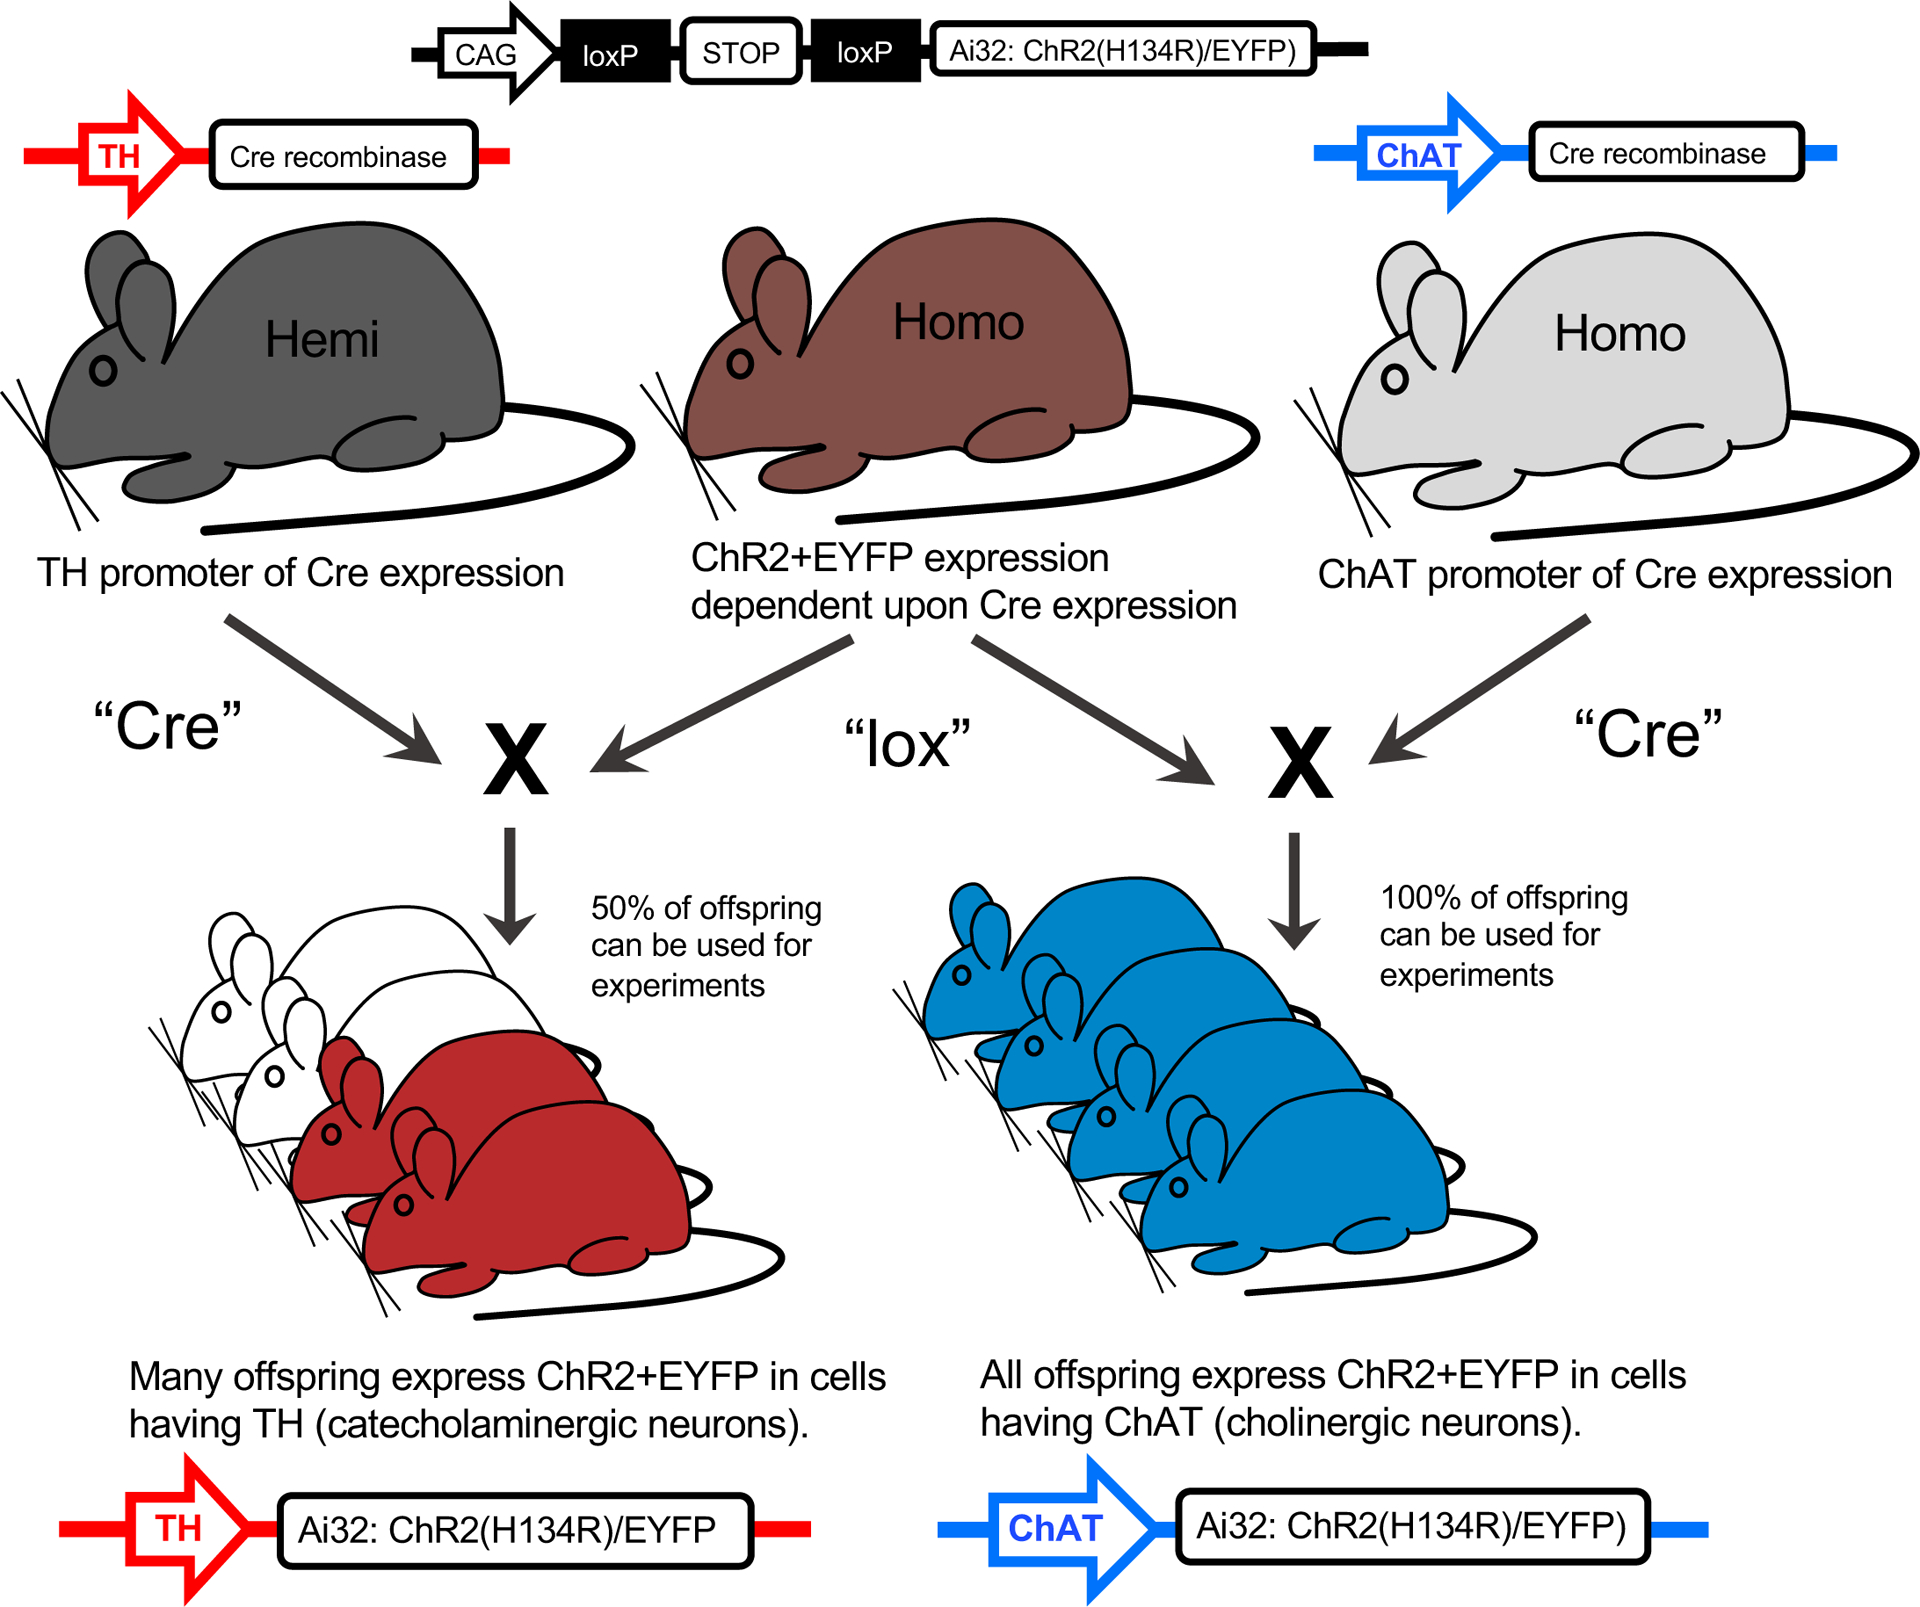
One hemizygous parent expressing the tyrosine hydroxylase (TH) promoter to direct the expression of Cre recombinase to catecholaminergic cells, or one homozygous parent expressing the choline acetyltransferase (ChAT) promoter to direct the expression of Cre recombinase to cholinergic cells, is paired with another homozygous parent with ChR2+EYFP fusion protein expression dependent upon Cre expression. The offspring expressing TH-Cre-ChR2+EYFP or ChAT-Cre-ChR2+EYFP is confirmed via genotyping of tail snips (Fig 2). Mice not expressing the respective expression are discarded from the study. The enhanced yellow fluorescent protein (EYFP) enables ChR2 expression to be directly visualized without the use of any fluorescent antibody staining (Fig 3B).
Figure 3. Basic neural structure for neurotransmitter release and colocalization of TH and ChAT with ChR2+EYFP expression.
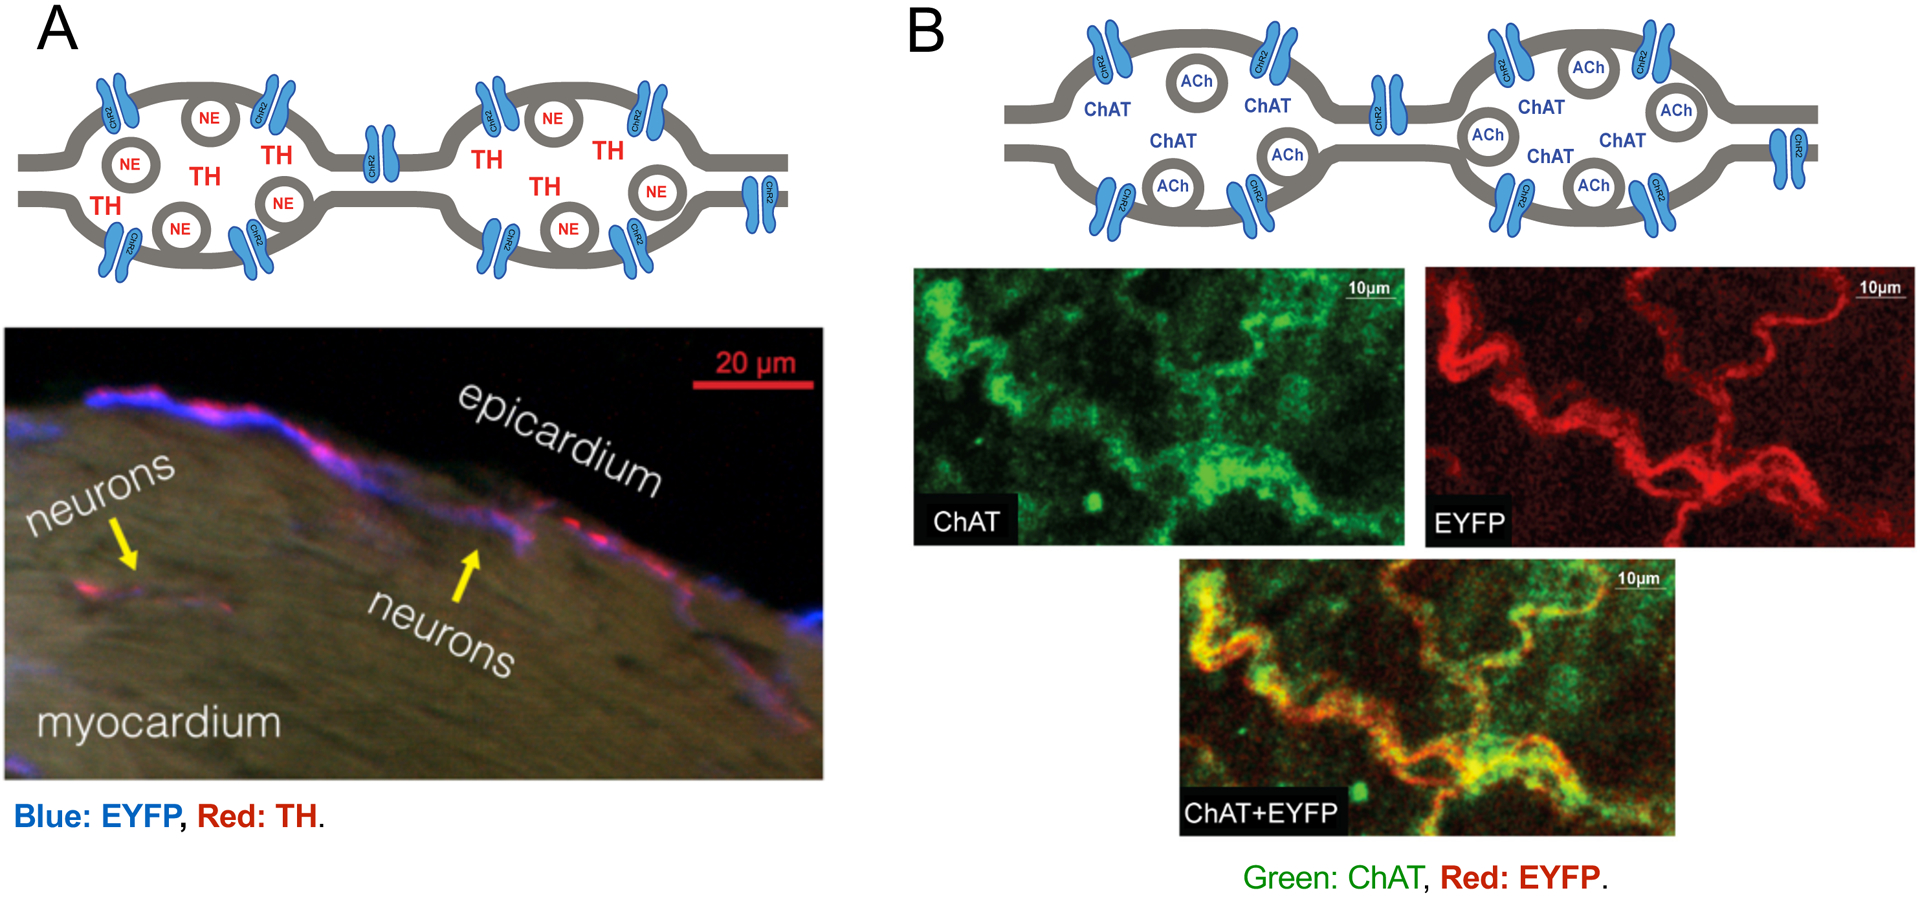
(A) Top - During sympathetic stimulation, TH-derived catecholamines, such as norepinephrine (NE), are released from dense-core vesicles at the axon varicosities. Bottom - Fluorescence overlap of TH (red) and EYFP (blue) confirmed selective expression within catecholaminergic neurons near the epicardial surface of the LV. (B) Top - During parasympathetic stimulation, the ChAT enzyme synthesizes the neurotransmitter acetylcholine (ACh), which is released from small synaptic vesicles at the axon varicosities. Bottom - Fluorescence overlap of ChAT and EYFP confirmed selective expression within cholinergic neurons in the right atrium. ChAT expression was imaged using an Alexa Fluor dye and excited at 651 nm, while EYFP expression was confirmed by exciting the tissue with a 514 nm light. Confocal images have been reproduced from Wengrowski, et al.9 (panel A) and Moreno, et al.14 (panel B).
3.2. Mouse genotyping
Tissue samples for genotyping are collected from ear punches. Animal IDs are assigned by cage number and the location of the ear punch (left or right ear, top or bottom). If more than four animals are in a cage then an additional ear punch is taken for the purpose of animal identification. Samples are mailed (fast courier) to Transnetyx Genotyping, which supply a sealable 96 well plate and prelabeled shipping envelope.
Lay out the towel drape in the working area. Spray the forceps and ear punch with 70% ethanol and place them on the towel drape.
A mouse is then anesthetized with isoflurane, quickly scruffed, an ear punch taken, and placed back in the cage.
The tissue sample is collected using forceps, placed in the 96 well plate, and the well number and animal ID are recorded.
The earpunch is then wiped down with 70% ethanol in preparation for the next animal.
Repeat steps 2 through 4 until all samples are collected and seal the 96 well plate.
The 96 well plate is registered online through Transnetyx (Fig. 2), the desired probe(s) to be used on the samples are selected, and the order is submitted online.
The sealed 96 well plate is then shipped using the prelabeled shipping envelope.
Figure 2. Example of real time PCR results produced by Transnetyx®.
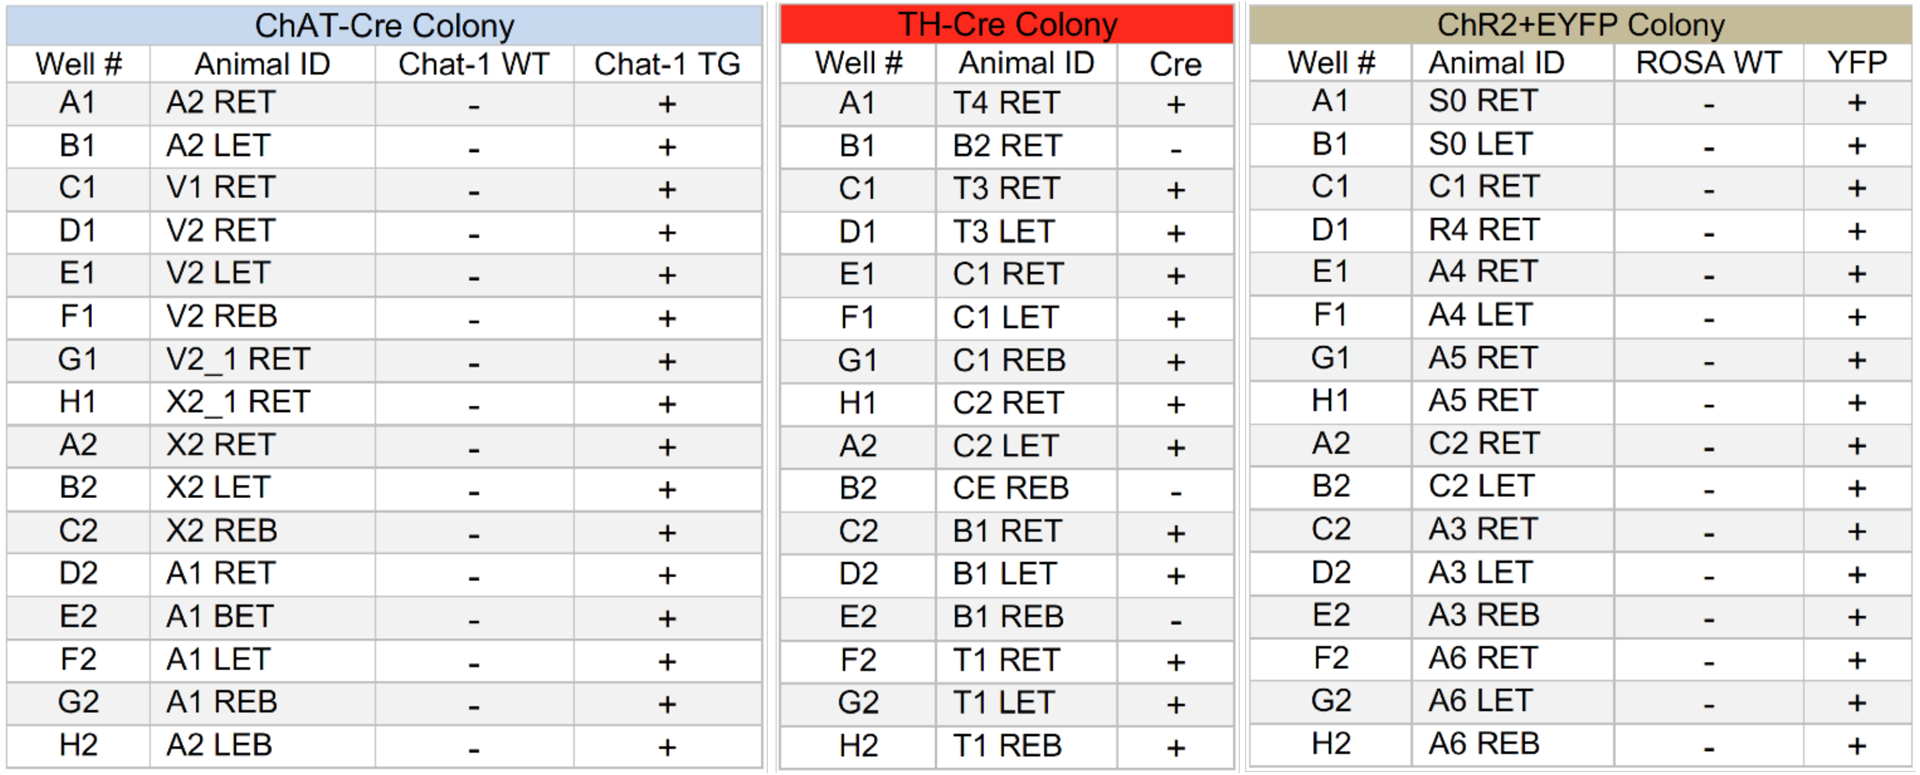
Chat-1 WT, and ROSA WT columns are the results using probes testing for the wild type sequence. The Chat-1 TG and YFP columns are the results of the probes testing for the mutant sequence of Cre and EYFP. “+,” and ”-” indicate expressing and non-expressing respectively. The “-” for the WTs and “+” Chat-1 TG and YFP indicate homozygosity. The TH-Cre results only show whether the animal is expressing Cre and does not indicate zygosity.
3.3. Micro-LED construction and preparation
Begin the construction of the LED light source by soldering insulated copper wires to the electrical contacts of the LED chip. A macroscope could be helpful when doing this.
Prepare a mixture of polydimethylsiloxane (PDMS) using a ratio of 10 parts elastomer to one-part curing agent. Ensure that no bubbles are present (see Note 7).
Place a thin layer (15 μm) of PDMS mixture over the front of the LED lens, where the light is emitted, and another layer (approximately 1 mm thick) to cover the rest of the LED (Fig. 4A). Allow the PDMS to harden (cure) overnight. Once the PDMS has cured, the LED is fully encapsulated, providing appropriate thermal and electrical insulation (2.9 × 10¹⁴ Ω.cm) between the LED and the surrounding environment14 (Fig. 4).
Calculate the irradiance of the LED to ensure that ChR2 can be adequately activated. First measure the optical power with the optical power meter, then divide the power by the illuminated surface area to compute irradiance. Irradiance of at least 2.4 mW/mm2 yields the best performance for optically activating cells that express ChR230.
Figure 4. LED encapsulation and positioning.
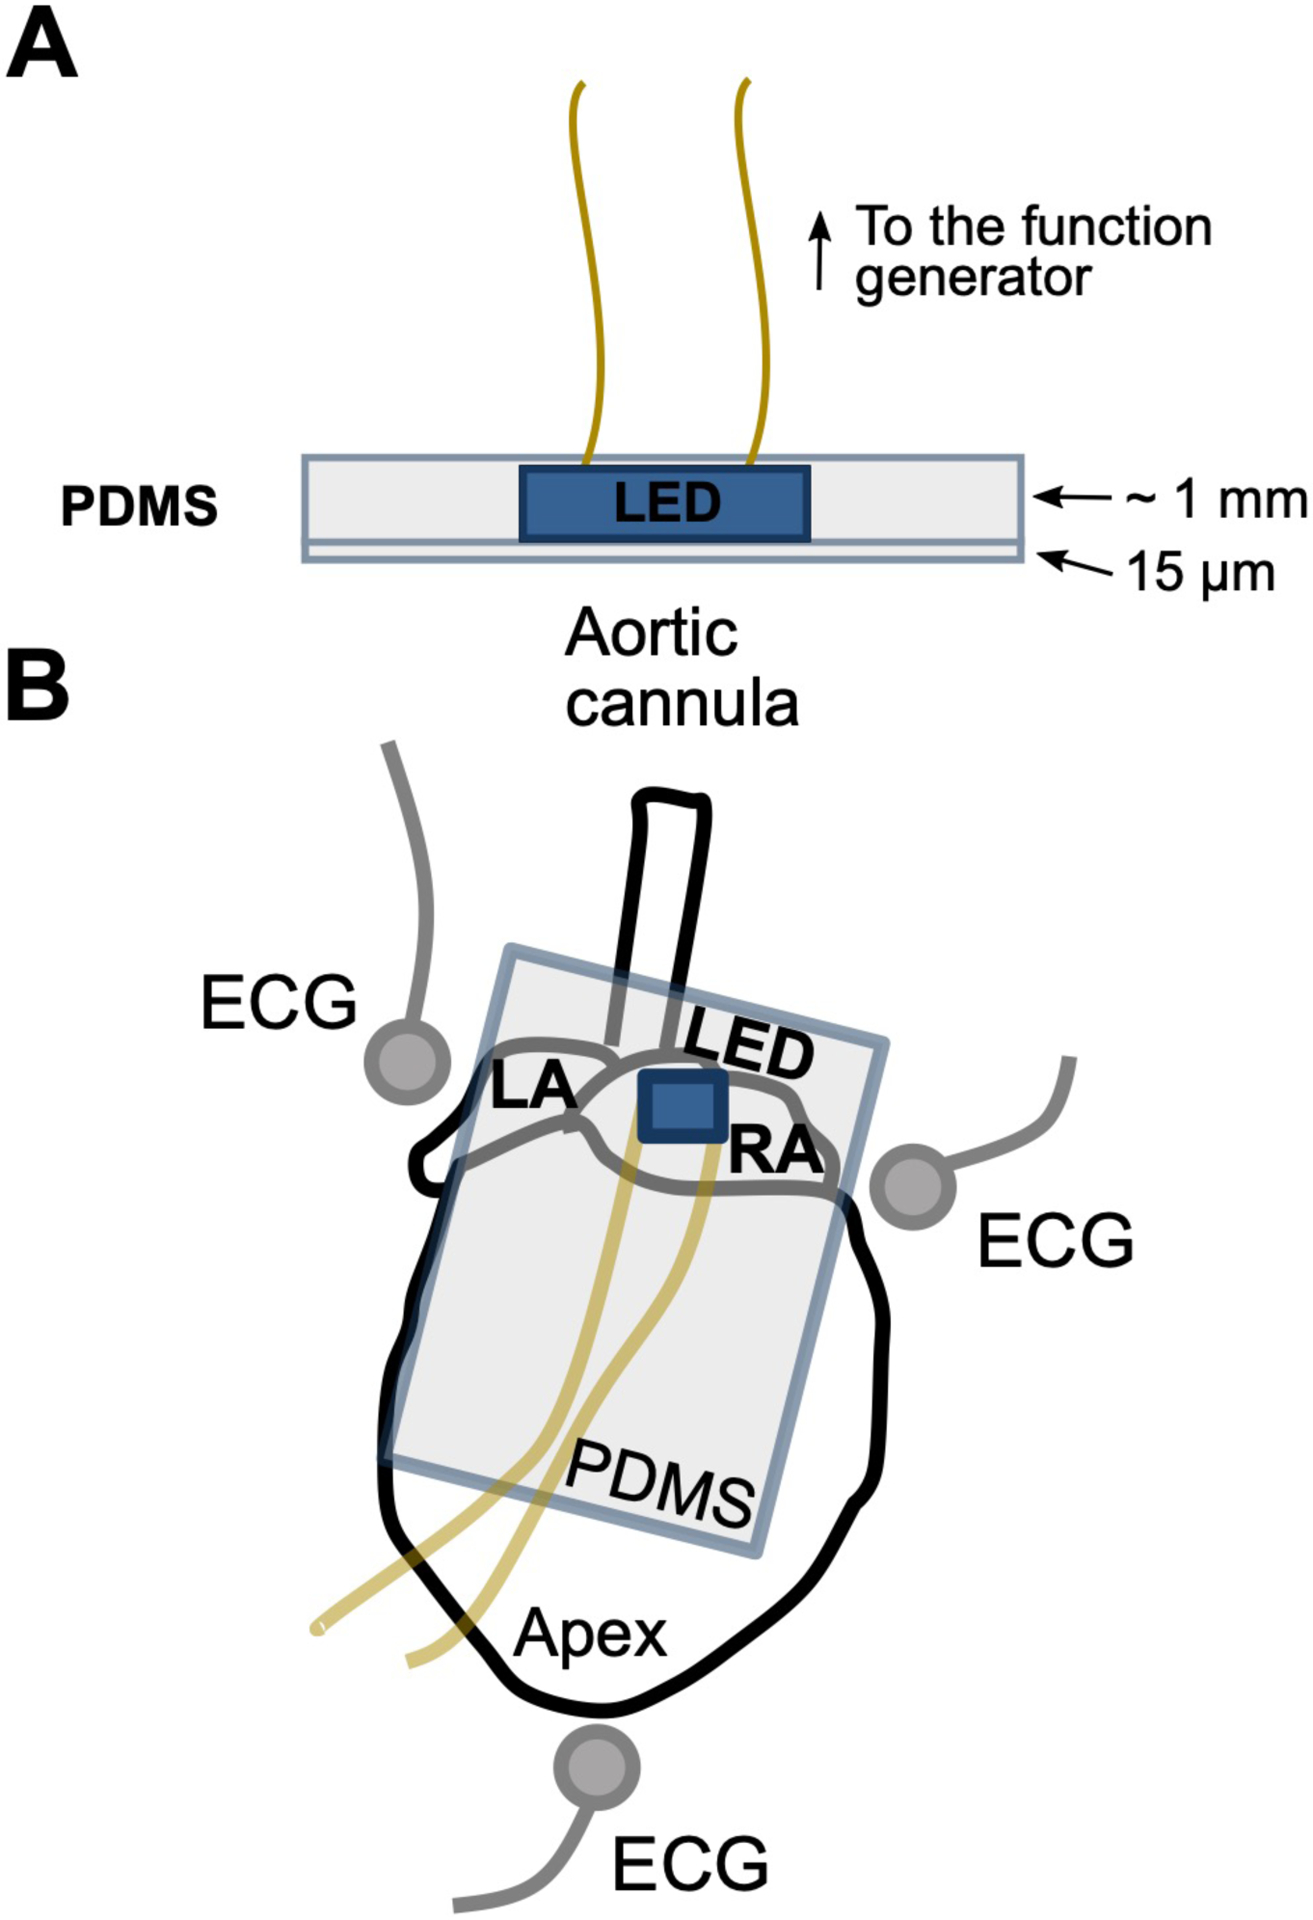
(A) The LED is encapsulated in PDMS to avoid the transfer of heat or electrical current into the tissue or the tissue bath. Very little light attenuation is observed through the thin 15 μm PDMS layer. (B) The encapsulated LED is positioned at the SA node to photostimulate intrinsic cardiac neurons. Needle electrodes are placed around the heart in an Einthoven’s configuration to acquire the ECG.
3.4. Perfused heart preparation and ECG measurement
Mice are anesthetized to reach a surgical plane of anesthesia that is appropriate for a thoracotomy. All institutional animal care procedures should be developed and approved following the National Institute of Health’s Guide for the Care and Use of Laboratory Animals. The next step must be carefully followed in order to ensure proper cardiac function during the experiment.
The heart is rapidly excised, the aorta is cannulated. The heart is flushed of blood with a bolus injection of perfusate, then retrograde-perfused at constant pressure (60 −70 mmHg) via a Langendorff perfusion system14,29,31,32. The perfusate is continuously oxygenated (95% O2, 5% CO2) and maintained at constant temperature (37°C). The temperature is monitored via the thermocouple and signal display software.
The heart is gently positioned within the superfusion bath of the perfusion system (also maintained at 37°C) with the posterior side of the right atrium facing up so that the atriocaval junction can be illuminated (Fig. 4B, see Note 8).
Three needle electrodes (Fig. 4B) are positioned around the heart to acquire the bath-conducted ECG using an Einthoven lead I configuration (see Note 9).
Each lead of the needle electrodes is appropriately connected to the low-noise bioamplifier. The highpass filter of the bioamplifier is at 0.5 Hz and the lowpass filter is set at 60 Hz. The gain of the bioamplifier is set at 100 to amplify the low-voltage ECG signal. The gain could be adjusted depending on the signal amplitude.
The output of the bioamplifier is connected to one input channel of the data acquisition device to store the ECG to the disk of an attached computer and to view the signal in real-time. A digital filter (60 Hz notch filter) could be applied (if needed) using the data acquisition software to further reduce noise in the ECG signal (see Note 10).
Setup the signal display software to compute instantaneous heart rate by measuring the R-R interval. Display the heart rate in real-time via the software display window.
After establishing heart perfusion, monitor the ECG for normal sinus rhythm and allow the heart to stabilize for at least 15 minutes before starting the optical stimulation protocol. An average sinus rhythm rate of approximately 350bpm is normal for an excised perfused mouse heart. If the heart is free of any perfusion and electrical disorder, this period of time will ensure a stable response to optogenetic activation of the intrinsic cardiac neurons (see Note 11).
3.5. Optical stimulation of intrinsic cardiac nerves
Connect the LED to the function generator. Setup the function generator to produce square wave pulses at 5 Hz, 3.2 V (this could vary depending on the forward voltage (Vf) of the LED). Establish a duty cycle within the range of 5 to 20%. A higher % duty cycle should induce a more pronounced heart rate response.
Gently place the encapsulated LED on the right atrium, facing the sinoatrial (SA) node (Fig. 4B). Avoid pressing the LED against the heart to minimize disrupting coronary flow and causing ischemia.
Turn on the function generator. Observe the ECG morphology and heart rate response via the signal display software. Successful optical stimulation will induce immediate changes in heart rate (see Note 12). For catecholaminergic activation (Fig. 5A), an exponential rise of heart rate is expected. For cholinergic activation (Fig. 5B), an immediate drop of heart rate in the form of a step response should be observed, without atrioventricular (AV) block (see Note 13).
Turn off the function generator. Within a minute, the heart rate should return to a level similar to that before activation.
If the heart rate response is inadequate, then slightly re-position the LED to better illuminate nerve bundles and ganglia within the right atrium. Achieving a maximal response is often dependent upon the position of the LED and the illumination level of the underlying neural structures.
Consider waiting between 3–4 minutes before starting another round of optical stimulation to allow the heart to stabilize at its unstimulated intrinsic sinus rate.
Figure 5. Kinetics of cardiac nerve activation during photostimulation.
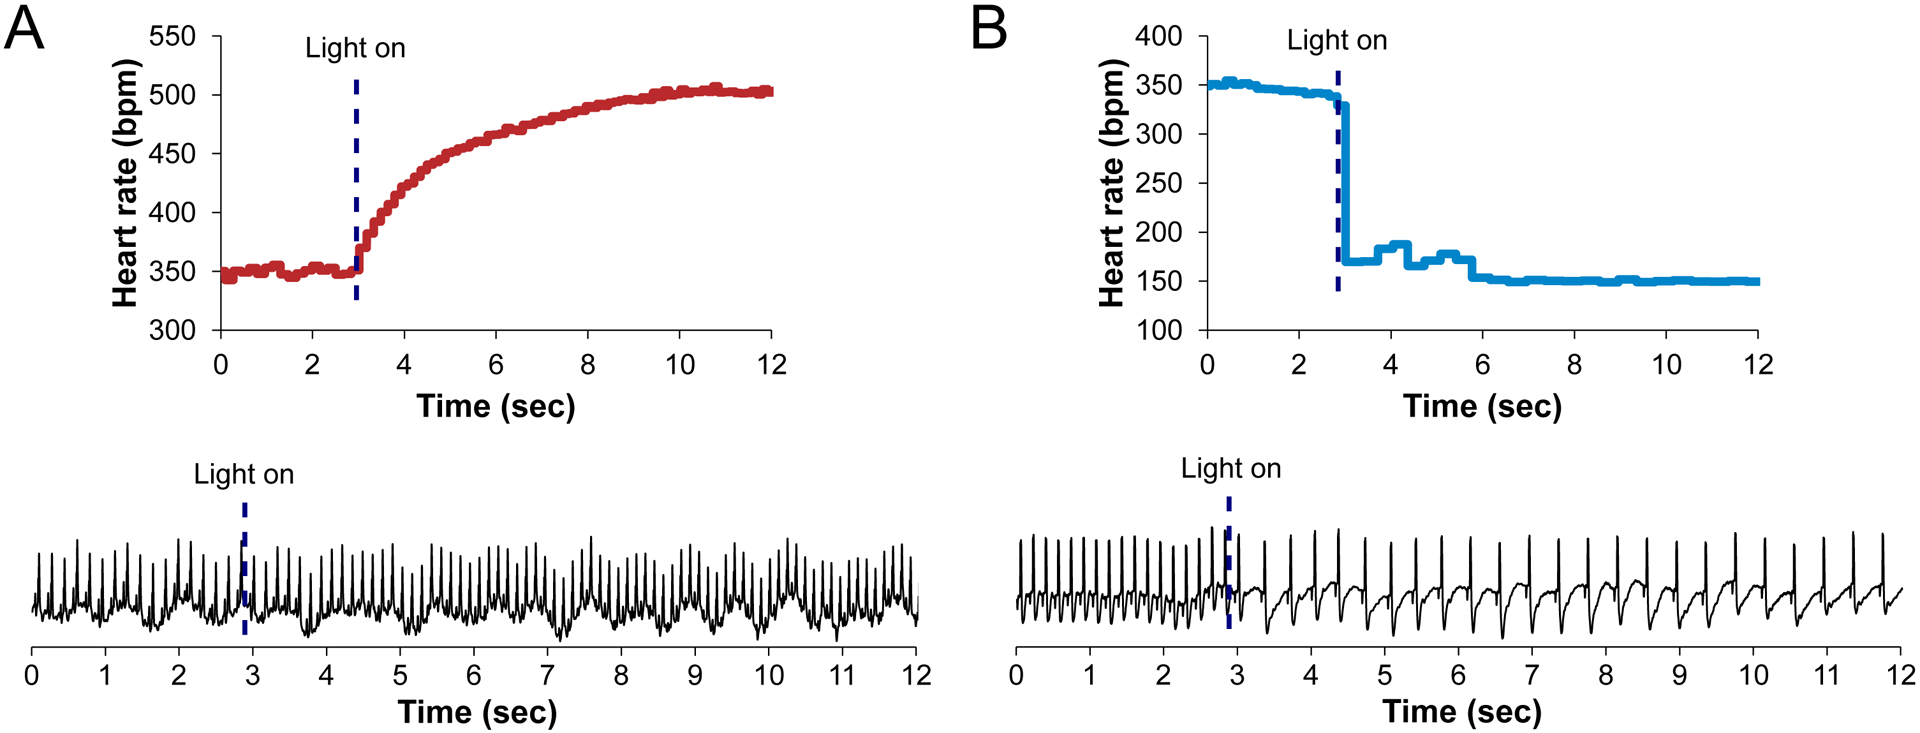
(A) During catecholaminergic activation, an exponential increase in heart rate is observed upon photostimulation (dashed line). No premature contractions are observed during this time. (B) Cholinergic activation yields an instantaneous reduction in heart rate upon photostimulation (dashed line). No AV block is observed if the SA node is selectively illuminated.
4. Notes
Transgenic mice are purchased (we use mice from The Jackson Laboratory, Bar Harbor, ME) then crossbred to generate offspring having cell type-specific expression of the ChR2+EYFP fusion protein in either catecholaminergic cells (containing L-DOPA, dopamine, norepinephrine, or epinephrine) or cholinergic cells (containing acetylcholine) (Fig. 1). Cell type-specific expression is accomplished using Cre/lox recombination15,28. The three mouse colonies (Section 2.1) are established using at least 3 females and 2 males of each strain. The Jackson Laboratory is not the only source of suitable mouse strains. Other strains have been used; for example, the strains reported in Prando et al. to express ChR2+td-Tomato in catecholaminergic neurons10. All animal procedures in our studies were approved by the GWU Institutional Animal Care and Use Committee and followed the National Institute of Health’s Guide for the Care and Use of Laboratory Animals.
Perfusate should be prepared using ultrapure water with a resistivity of 18 MΩ. It is easier to dissolve the salts and glucose if the solution is stirred at 37° C. Normally, no more than 500 mL of perfusate is needed for an experiment. Insulin could be included in the perfusate, if required.
It is important to titrate the pH of the solution. If the pH is below 7.35, add a base, one drop at a time of 1 M NaOH until the pH increases. If the pH is above 7.45, add an acid, one drop at a time of 1 M HCl until the pH decreases.
Inbreeding the hemizygous TH-Cre mice for several generations (Fig. 1) will provide homozygous offspring that could then be bred with ChR2+EYFP animals to increase the number of TH-(ChR2+EYFP) offspring (to above 50%) that can be used for experiments.
Initially there was no preference for the male (M) or female (F) to be a specific genotype within breeding pairs. Over time it was noticed that the number of offspring was typically less if the female was from the TH-Cre colony. From that point forward, it was preferred that the TH-Cre parent be male for TH-Cre X ChR2+EYFP breeding pairs since the ChR2+EYFP females had more success in rearing the offspring.
After multiple generations of inbreeding, both the ChR2+EYFP and Chat-Cre mice have maintained their desired protein expression. The TH-Cre animals are hemizygous when procured, and after several generations of inbreeding, genotyping results indicated that an average of 16.7% of animals in the colony do not express Cre (Fig. 2).
If bubbles are observed in the PDMS mixture then pour it in a falcon tube and spin it in a centrifuge (3000 RPM for 60 sec).
Position the heart so it is at least half-submerged in the KH solution but leaving the RA-atriocaval junction dry. This keeps the heart at a stable temperature while ensuring free access for optical stimulation.
To acquire a clean ECG signal, the three needle electrodes should be positioned in close proximity to the heart and be in contact with the perfusate (Fig. 4).
Ensure that the P and QRS waves are clearly visible in the ECG (Fig. 5). Particularly, achieving a clear P-wave could be sometimes challenging because atrial signals are predominantly of low amplitude and could be hidden in noise. Therefore, the needle electrode should be placed very close to the atrium to capture as much biopotential as possible.
Ensure that the temperature is constant during sudden changes in heart rate because heart rate modulates coronary flow. Even small changes in temperature (due to reduced coronary flow) could rapidly alter sinus node function, thereby causing experimental artifact.
Adequate optical stimulation of the cardiac nerve fibers and ganglia is sometimes difficult. The anatomy of the intrinsic neurons could be slightly different between hearts, making it challenging to find the optimal spot for photostimulation. Therefore, if photostimulation is not initially successful, the LED should be slightly moved to a different location, but always in the same region, until activation is achieved.
AV block could be observed, especially during cholinergic nerve photostimulation. This could happen because of asynchronous activation, particularly around the AV node. To prevent this issue, it is helpful to avoid any illumination of the AV node and only focus on the region around the SA node.
Acknowledgements:
The microscopy expertise of Anastas Popratiloff, MD, PhD and the facilities GWU SEH Microscopy Core Facility are gratefully acknowledged. Matthew Stoyek, PhD is gratefully acknowledged for guidance in antibody staining of ChAT. Matthew Colonnese, PhD and Marnie Phillips, PhD are gratefully acknowledged for providing mice used in early experiments. We also thank Emilia Entcheva, PhD for many insightful discussions regarding photoactivation of channelrhodopsin within cardiac tissues.
Funding: This work was supported by grants from the National Institutes of Health (R21-HL132618, R01-HL133862, R01- HL141470), and a Don J. Levy and Elma Levy fellowship.
References
- 1.Deisseroth K, Feng G, Majewska AK, Miesenbock G, Ting A, Schnitzer MJ. Next-Generation Optical Technologies for Illuminating Genetically Targeted Brain Circuits. J Neurosci. 2006;26:10380–10386. [DOI] [PMC free article] [PubMed] [Google Scholar]
- 2.Funken M, Malan D, Sasse P, Bruegmann T. Optogenetic Hyperpolarization of Cardiomyocytes Terminates Ventricular Arrhythmia. Front Physiol. 2019;10:498. [DOI] [PMC free article] [PubMed] [Google Scholar]
- 3.Williams JC, Entcheva E. Optogenetic versus Electrical Stimulation of Human Cardiomyocytes: Modeling Insights. Biophys J. 2015;108:1934–45. [DOI] [PMC free article] [PubMed] [Google Scholar]
- 4.Scardigli M, Müllenbroich C, Margoni E, Cannazzaro S, Crocini C, Ferrantini C, Coppini R, Yan P, Loew LM, Campione M, Bocchi L, Giulietti D, Cerbai E, Poggesi C, Bub G, Pavone FS, Sacconi L. Real-time optical manipulation of cardiac conduction in intact hearts. J Physiol. 2018;596:3841–3858. [DOI] [PMC free article] [PubMed] [Google Scholar]
- 5.Godwin WC, Hoffmann GF, Gray TJ, Hughes RM. Imaging of Morphological and Biochemical Hallmarks of Apoptosis with Optimized Optogenetic Tools. J Biol Chem. 2019;jbc.RA119.009141. [DOI] [PMC free article] [PubMed] [Google Scholar]
- 6.Jia Z, Valiunas V, Lu Z, Bien H, Liu H, Wang H-Z, Rosati B, Brink PR, Cohen IS, Entcheva E. Stimulating cardiac muscle by light: cardiac optogenetics by cell delivery. Circ Arrhythm Electrophysiol. 2011;4:753–60. [DOI] [PMC free article] [PubMed] [Google Scholar]
- 7.Burton RAB, Klimas A, Ambrosi CM, Tomek J, Corbett A, Entcheva E, Bub G. Optical control of excitation waves in cardiac tissue. Nat Photonics. 2015;9:813–816. [DOI] [PMC free article] [PubMed] [Google Scholar]
- 8.Jameson H, Bateman R, Byrne P, Dyavanapalli J, Wang X, Jain V, Mendelowitz D. Oxytocin neuron activation prevents hypertension that occurs with chronic intermittent hypoxia/hypercapnia in rats. Am J Physiol - Hear Circ Physiol. 2016;310:H1549–H1557. [DOI] [PMC free article] [PubMed] [Google Scholar]
- 9.Wengrowski AM, Wang X, Tapa S, Posnack NG, Mendelowitz D, Kay MW. Optogenetic release of norepinephrine from cardiac sympathetic neurons alters mechanical and electrical function. Cardiovasc Res. 2015;105:143–50. [DOI] [PMC free article] [PubMed] [Google Scholar]
- 10.Prando V, Da Broi F, Franzoso M, Plazzo AP, Pianca N, Francolini M, Basso C, Kay MW, Zaglia T, Mongillo M. Dynamics of neuroeffector coupling at cardiac sympathetic synapses. J Physiol. 2018;596:2055–2075. [DOI] [PMC free article] [PubMed] [Google Scholar]
- 11.Hedrick T, Danskin B, Larsen RS, Ollerenshaw D, Groblewski P, Valley M, Olsen S, Waters J. Characterization of channelrhodopsin and archaerhodopsin in cholinergic neurons of Cre-lox transgenic mice. PLoS One. 2016;11:1–15. [DOI] [PMC free article] [PubMed] [Google Scholar]
- 12.Nagode DA, Tang AH, Karson MA, Klugmann M, Alger BE. Optogenetic Release of ACh Induces Rhythmic Bursts of Perisomatic IPSCs in Hippocampus. PLoS One. 2011;6:1–9. [DOI] [PMC free article] [PubMed] [Google Scholar]
- 13.Ren J, Qin C, Hu F, Tan J, Qiu L, Zhao S, Feng G, Luo M. Habenula “ Cholinergic” Neurons Corelease Glutamate and Acetylcholine and Activate Postsynaptic Neurons via Distinct Transmission Modes. Neuron. 2011;69:445–452. [DOI] [PubMed] [Google Scholar]
- 14.Moreno A, Endicott K, Skancke M, Dwyer MK, Brennan J, Efimov IR, Trachiotis G, Mendelowitz D, Kay MW. Sudden Heart Rate Reduction Upon Optogenetic Release of Acetylcholine From Cardiac Parasympathetic Neurons in Perfused Hearts. Front Physiol. 2019;10:1–11. [DOI] [PMC free article] [PubMed] [Google Scholar]
- 15.Zeng H, Madisen L. Mouse transgenic approaches in optogenetics. Prog Brain Res. 2012;196:193–213. [DOI] [PMC free article] [PubMed] [Google Scholar]
- 16.Piñol RA, Bateman R, Mendelowitz D. Optogenetic approaches to characterize the long-range synaptic pathways from the hypothalamus to brain stem autonomic nuclei. J Neurosci Methods. 2012;210:238–46. [DOI] [PMC free article] [PubMed] [Google Scholar]
- 17.Ambrosi CM, Sadananda G, Han JL, Entcheva E. Adeno-Associated Virus Mediated Gene Delivery: Implications for Scalable in vitro and in vivo Cardiac Optogenetic Models. Front Physiol. 2019;10:1–13. [DOI] [PMC free article] [PubMed] [Google Scholar]
- 18.Quinn TA, Camelliti P, Rog-Zielinska EA, Siedlecka U, Poggioli T, O’Toole ET, Knöpfel T, Kohl P. Electrotonic coupling of excitable and nonexcitable cells in the heart revealed by optogenetics. Proc Natl Acad Sci. 2016;113:14852–14857. [DOI] [PMC free article] [PubMed] [Google Scholar]
- 19.Hulsmans M, Clauss S, Xiao L, Aguirre AD, King KR, Hanley A, Hucker WJ, Wülfers EM, Seemann G, Courties G, Iwamoto Y, Sun Y, Savol AJ, Sager HB, Lavine KJ, Fishbein GA, Capen DE, Da Silva N, Miquerol L, Wakimoto H, Seidman CE, Seidman JG, Sadreyev RI, Naxerova K, Mitchell RN, Brown D, Libby P, Weissleder R, Swirski FK, Kohl P, Vinegoni C, Milan DJ, Ellinor PT, Nahrendorf M. Macrophages Facilitate Electrical Conduction in the Heart. Cell. 2017;169:510–522.e20. [DOI] [PMC free article] [PubMed] [Google Scholar]
- 20.Wang Y, Lin WK, Crawford W, Ni H, Bolton EL, Khan H, Shanks J, Bub G, Wang X, Paterson DJ, Zhang H, Galione A, Ebert SN, Terrar DA, Lei M. Optogenetic Control of Heart Rhythm by Selective Stimulation of Cardiomyocytes Derived from Pnmt+ Cells in Murine Heart. Sci Rep. 2017;7:40687. [DOI] [PMC free article] [PubMed] [Google Scholar]
- 21.Rajendran PS, Challis RC, Fowlkes CC, Hanna P, Tompkins JD, Jordan MC, Hiyari S, Gabris-Weber BA, Greenbaum A, Chan KY, Deverman BE, Münzberg H, Ardell JL, Salama G, Gradinaru V, Shivkumar K. Identification of peripheral neural circuits that regulate heart rate using optogenetic and viral vector strategies. Nat Commun. 2019;10:1944. [DOI] [PMC free article] [PubMed] [Google Scholar]
- 22.Sauer B Inducible Gene Targeting in Mice Using the Cre/loxSystem. Methods. 1998;14:381–392. [DOI] [PubMed] [Google Scholar]
- 23.Zaglia T, Pianca N, Borile G, Da Broi F, Richter C, Campione M, Lehnart SE, Luther S, Corrado D, Miquerol L, Mongillo M. Optogenetic determination of the myocardial requirements for extrasystoles by cell type-specific targeting of ChannelRhodopsin-2. Proc Natl Acad Sci U S A. 2015;112:E4495–504. [DOI] [PMC free article] [PubMed] [Google Scholar]
- 24.Wang X, Piñol R a, Byrne P, Mendelowitz D. Optogenetic Stimulation of Locus Ceruleus Neurons Augments Inhibitory Transmission to Parasympathetic Cardiac Vagal Neurons via Activation of Brainstem α1 and β1 Receptors. J Neurosci. 2014;34:6182–9. [DOI] [PMC free article] [PubMed] [Google Scholar]
- 25.Kalmbach A, Hedrick T, Waters J. Selective optogenetic stimulation of cholinergic axons in neocortex. J Neurophysiol. 2012;107:2008–2019. [DOI] [PMC free article] [PubMed] [Google Scholar]
- 26.Savitt J, Jang S, Mu W, Dawson V, Dawson T. Bcl-x is required for proper development of the mouse substantia nigra. J Neurosci. 2005;25:6721–8. [DOI] [PMC free article] [PubMed] [Google Scholar]
- 27.Rossi J, Balthasar N, Olson D, Scott M, Berglund E, Lee CE, Choi MJ, Lauzon D, Lowell BB, Elmquist JK. Melanocortin-4 Receptors Expressed by Cholinergic Neurons Regulate Energy Balance and Glucose Homeostasis. Cell Metab. 2011;13:195–204. [DOI] [PMC free article] [PubMed] [Google Scholar]
- 28.Madisen L, Mao T, Kock H, Zhuo JJ, Berenyi A, Fujisawa S, Hsu YY-WA, Garcia A 3rd AJ, Gu X, Zanella S, Kidney J, Gu H, Mao Y, Hooks BBM, Boyden EES, Buzsáki G, Ramirez JMJ, Jones ARA, Svoboda K, Han X, Turner EE, Zeng H, Koch H, Zhuo JJ, Berenyi A, Fujisawa S, Hsu YY-WA, Garcia A 3rd AJ, Gu X, Zanella S, Kidney J, Gu H, Mao Y, Hooks BBM, Boyden EES, Buzsáki G, Ramirez JMJ, Jones ARA, Svoboda K, Han X, Turner EE, Zeng H. A toolbox of Cre-dependent optogenetic transgenic mice for light-induced activation and silencing. Nat Neurosci. 2012;15:793–802. [DOI] [PMC free article] [PubMed] [Google Scholar]
- 29.Bell RM, Mocanu MM, Yellon DM. Retrograde heart perfusion: the Langendorff technique of isolated heart perfusion. J Mol Cell Cardiol. 2011;50:940–950. [DOI] [PubMed] [Google Scholar]
- 30.Williams JC, Xu J, Lu Z, Klimas A, Chen X, Ambrosi CM, Cohen IS, Entcheva E. Computational optogenetics: empirically-derived voltage- and light-sensitive channelrhodopsin-2 model. PLoS Comput Biol. 2013;9:e1003220. [DOI] [PMC free article] [PubMed] [Google Scholar]
- 31.Skrzypiec-Spring M, Grotthus B, Szelag A, Schulz R. Isolated heart perfusion according to Langendorff - still viable in the new millennium. J Pharmacol Toxicol Methods. 2007;55:113–26. [DOI] [PubMed] [Google Scholar]
- 32.Sutherland FJ, Hearse DJ. The isolated blood and perfusion fluid perfused heart. Pharmacol Res. 2000;41:613–27. [DOI] [PubMed] [Google Scholar]


