

Abstract

Forensic chemistry is an important and rapidly growing branch of analytical chemistry. As a part of forensic practices, phenotype profiling is beneficial to help narrow down suspects. The goal of this study is to identify a person’s age range using dried bloodstains. Attenuated total reflection Fourier transform-infrared (ATR FT-IR) spectroscopy is the technique used to acquire information about the total (bio)chemical composition of a sample. For the purpose of this proof-of-concept study, a diverse pool of donors including those in newborn (<1), adolescent (11–13), and adult (43–68) age ranges was used. Different donor age groups were found to have different levels of lipids, glucose, and proteins in whole blood, although the corresponding spectral differences were minor. Therefore, the collected data set was analyzed using chemometrics to enhance discrepancy and assist in donors’ classification. A partial least squares discriminant analysis (PLSDA) was used to classify ATR FT-IR spectra of blood from newborn, adolescent, and adult donors. The method showed a 92% correct classification of spectra in leave-one-out cross-validation (LOOCV) of the model. Overall, ATR FT-IR spectroscopy is nondestructive and can be an infield method that can be used for a variety of forensic applications. In general, the developed approach combining ATR FT-IR spectroscopy and advanced statistics shows the great potential for classifying (bio)chemical samples exhibiting significant intra-class variations.
Introduction
Analytical methods are becoming extremely useful in the growing field of forensic science. A variety of emerging analytical and bioanalytical approaches, including spectroscopy, have been developed to revolutionize the world of forensics.1−3 As analytical chemistry becomes more relied upon in court cases, the need arises for universal and statistically confident methods. Advanced statistics allows investigators to obtain more reliable results with reduced human bias, which is of high importance in the courtroom.4
Critical characteristics of the human phenotype profile can significantly narrow down the search for potential suspects or missing persons.5 Biological traces can be recovered at a crime scene as evidence and can be very valuable for phenotype profiling. Phenotype profiling can categorize people into different groups based on their biological sex, race, and age.6 For this study, age groups of donors will be the main focus. Body fluids that are typically found at crime scenes are blood, saliva, semen, sweat, urine, and vaginal fluid.7 The examination of these body fluids can help narrow down suspects. The presence of these fluids is very common; however, blood is the body fluid most frequently found at crime scenes.8 The presence of blood results mostly from violence such as homicide, assaults, and robberies. Current forensic techniques, such as forensic serology and DNA profiling, have become very important. The most powerful forensic analysis is DNA analysis since it can identify a person. DNA profiling has a multitude of steps and needs time to process from start to finish.9 The whole process could take days. With the limitations of current technology, there is a very large backlog at the crime laboratories and some evidence samples are never processed. To process the samples, extraction, quantification amplification, separation, analysis, and then database searching need to be completed. Currently, there is the database for DNA that is known as the combined DNA index system (CODIS).9 Samples from known and unknown criminals are stored to see if there is a match from any crimes. If there is no match, then it is impossible to know much more about the criminal. This is a limitation for investigators; therefore, creating an analytical method such as human phenotype profiling by ATR FT-IR spectroscopy and chemometrics can alleviate this problem. This can provide invaluable information with statistical confidence even if there is no profile currently in the system.
Since blood is the most commonly found body fluid at a crime scene, in this study, it will be tested and correlated with the chronological age of a donor. Forensic anthropologists can determine a person’s age by studying the human body or skeleton.5 However, with the lack of a physical body or eyewitnesses, it is difficult to determine the age of a victim or their assailant. Donor biological sex, chronological age, and health status all have an effect on human blood.5,10 Levels of alkaline phosphatase (ALP) have been found to differ for young and old donors.11 The comparison can be done using a biocatalytic assay. The major difference in donor age based on blood can be found in hemoglobin–newborn whole blood samples that contain fetal hemoglobin (HbF), which differs from adult hemoglobin (HbA).12−14 The volume of red blood cells in blood is higher in newborns than in adults, and the structure of hemoglobin is slightly different. Both hemoglobin molecules, HbF and HbA, contain four subunits. HbA consists of α2β2, while HbF is made of α2γ2, which affects the amino acid composition of both molecules. This change in structure, in addition to many other discrepancies found between concentrations of components, such as other proteins, lipids, and carbohydrates, can be detected by attenuated total reflection Fourier transform-infrared (ATR FT-IR) spectroscopy.
For different developmental processes, levels of the (bio)chemical components in blood can vary with the age of an individual.15 This study focuses on the chronological age of a donor compared to the biological age because the biological age can be greatly affected by health status, diet, and physical fitness.5 To account for such discrepancies, only healthy donors from each category who showed a normal growth rate specific to their age were selected for this proof-of-concept study. In general, it is expected that newborn and adolescent subjects have different (bio)chemical compositions of blood than fully developed adults. These quantitative differences can help distinguish between the age categories.
Recently, Doty and Lednev reported on determining the chronological age of donors based on Raman microspectroscopy of dry bloodstains.5 They were able to conclude that there are differences between age groups and that Raman spectroscopy in combination with chemometrics was efficient in detecting these differences. In addition, Fujihara et al. conducted an experiment discriminating between infant and adult bloodstains using micro-Raman spectroscopy.16 This method has advantages and disadvantages in the field.17 Raman spectroscopy is often subjected to strong fluorescence interference when applied to biological samples. Numerous studies have focused on mitigating this limitation for analyzing body fluids using Raman spectroscopy by applying different excitation wavelengths.17,18 Sato et al. compared visible (514.5 nm) and near-infrared (720 and 1064 nm) excitation and showed that the 720 nm laser gives the most satisfactory results, and it is the shortest excitation wavelength to obtain good quality Raman spectra for analyzing whole blood samples.18 Their work illustrated that only the 720 nm excitation resulted in the spectrum with no fluorescence interference. When different excitation lasers were studied on bloodstains deposited on various substrates, there was no ideal excitation wavelength that would work best for all the studied substrates.17
The main limitation of near-infrared Raman spectroscopy when used for blood analysis is that the 785 nm excitation Raman spectra of blood are dominated by the hemoglobin contribution with limited input from other components. To overcome this limitation, a different technique was used to probe the (bio)chemical composition of blood in this study—ATR FT-IR spectroscopy. ATR FT-IR spectroscopy is a vibrational spectroscopic technique that is complementary to Raman spectroscopy. The advantage of ATR FT-IR spectroscopy over Raman spectroscopy is that infrared measurements are not subjected to fluorescence interference. Moreover, FT-IR spectroscopic instruments are found in many crime laboratories, and it is a relatively inexpensive and fairly easy to use method. This technique has already been used in the examination of body fluids and trace evidence in the forensic context.1,19,20 ATR FT-IR spectroscopy has been proven to successfully determine the donor sex and race from a bloodstain.21
In this proof-of-concept study, ATR FT-IR spectroscopy and chemometrics were used to analyze blood from 20 human donors and to differentiate between them based on their chronological age. The donors were split into three classes consisting of newborn, adolescent, and adult samples. The spectra variations between each group were studied using chemometrics, and a partial least squares discriminant analysis (PLSDA) model was constructed. For age determination, subject-wise leave-one-out cross-validation (LOOCV) was employed, which is a typical approach to ensure that no overfitting occurs.22
Results and Discussion
Spectral Analysis
The goal of this study was to use ATR FT-IR spectroscopy combined with chemometrics to classify blood samples based on donor age and differentiate blood samples of newborn, adolescent, and adult donors. There were 20 donors and 200 spectra total to be classified. An average spectrum of each group of donors can be seen in Figure 1. The infrared spectrum of biological samples illustrates a signal from the following: lipids (3000–2800 cm–1), proteins (1700–1500 cm–1), nucleic acids (1250–1000 cm–1), and carbohydrates (1000–800 cm–1).23,24 Small discrepancies between average spectra of different classes can be seen in Figure 1.
Figure 1.

Averaged ATR FT-IR spectra of blood from each age group: newborn (red), adolescent (green), and adult (blue). The spectral range of 2669–1711 cm–1 demonstrated the enhanced contribution from the ATR crystal, and this region was excluded from the analysis.
The average difference spectra between all three categories were calculated and plotted against the corresponding spectral standard deviations in Figure 2. Most of the standard deviations were larger than the corresponding difference spectra that indicated that the average spectral differences are statistically insignificant. The peaks in the difference spectra that were larger than the standard deviation peaks were analyzed separately, including those at 2909, 2871, 1659, and 1538 cm–1 (Figure S1). It was concluded that the changes in these peak intensities are too small to make a reliable class identification. This result differs from Raman spectroscopic results reported earlier.5 The conclusion was that, at 375 cm–1, there is a distinct statistical difference in the Raman peak intensity to differentiate newborns from adolescent and adult donors. The 375 cm–1 peak is not evident in the ATR FT-IR spectrum of dried blood. Therefore, chemometrics was used to build a statistical model and classify the samples.
Figure 2.
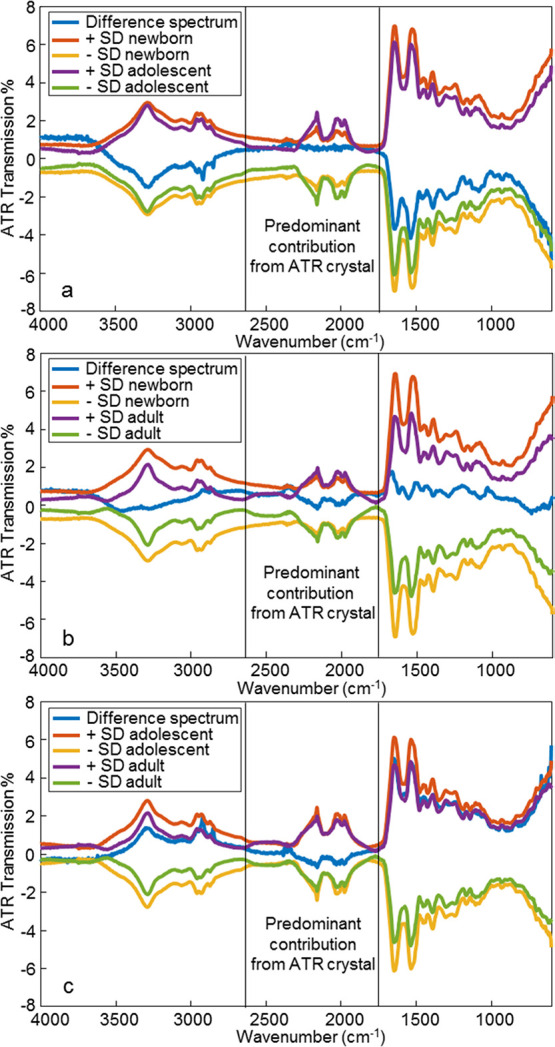
Raw ATR FT-IR spectra of blood standard deviations (SDs) for (a) newborn vs adolescent, (b) newborn vs adult, and (c) adolescent vs adult compared against the average difference spectra between each age group. The spectral range of 2669–1711 cm–1 demonstrated the enhanced contribution from the ATR crystal, and this region was excluded from the analysis.
Statistical Modeling of Spectra
Statistical modeling was used to study the small discrepancies in spectra that correspond to known functional groups shown in Table 1. The main components found in whole human blood are glucose, hemoglobin, proteins, and lipids. These components vary between different age groups due to human body development and can be studied using ATR FT-IR spectroscopy.
Table 1. Wavenumber Assignments of ATR FT-IR Spectra of Blood to Functional Groups.
| wavenumber (cm–1) | assignment |
|---|---|
| 3500–3200 | water and hydroxyl (O–H stretching)23,25 |
| 3284 | amide A (N–H stretching)26−28 |
| 2958 | lipids (asymmetric stretching of CH3)23,25,26,28 |
| 2872 | lipids (symmetric stretching of CH3)28 |
| 1700–1600 | amide I (C=O stretching)23,25−28 |
| 1560–1500 | amide II (N–H bending, C–N stretching)23,25−28 |
| 1390 | lipids and proteins (symmetric bending of CH3)25,26 |
| 1239 | amide III (C–N stretching)25−27 |
| 1082 | glucose (C–O stretching)26,28 |
| 698 | amide IV (C–H bending)28 |
A total of 200 spectra were used to build a PLSDA model. The model included 50 spectra of newborns, 40 spectra of adolescents, and 110 spectra of adults. The results of the model can be seen in Figure 3, which shows the strict class prediction for newborn (red), adolescent (green), and adult (blue) samples. Each symbol on the plot is a result of an individual spectrum collected with 10 spectra collected per sample. Based on internal predictions of the model, 198 spectra were classified correctly, and only two spectra were unassigned (Figure 3). For these two spectra, one spectrum belonged to the adolescent group and one to the adult group. None of the spectra were misclassified. Moreover, a 100% correct classification was observed at the donor level predictions with the training data set.
Figure 3.

Strict class prediction scores plot of the PLSDA model of each classification group: newborn (red), adolescent (green), and adult (blue) with spectral regions of 4000–2670 and 1710–600 cm–1. A value of 1 corresponds to newborns, a value of 2 to adolescents, and a value of 3 to adults. A score of 0 indicates unassigned predictions.
A genetic algorithm (GA) was performed to detect the most informative peaks in the spectra for distinguishing between the three age groups. Figure 4 shows the selected spectral regions by the GA. The major chemical components for determination of donor age are lipids (2958 and 1390 cm–1), proteins (1390 cm–1), and glucose (1082 cm–1). Newborns have a different quantity of protein because they are rapidly growing at such a young age compared to adolescents and adults. Adults tend to have a decrease in muscle mass, which correlates to the amount of protein in their system, especially as they age. These quantities are similar in healthy people in the same age bracket but can shift due to medical problems. This discrepancy was not considered in the current model.
Figure 4.
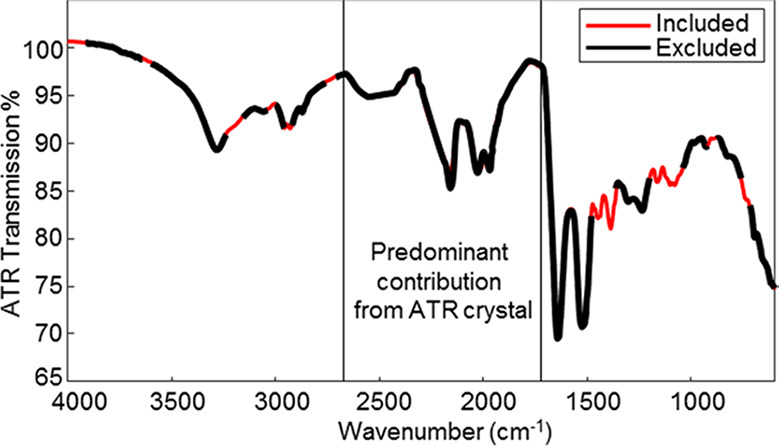
Averaged ATR FT-IR spectrum of human blood with selected spectral regions via the genetic algorithm in red and excluded spectral regions in black.
Model Validation
After the model was built with the training data set, it was validated using the subject-wise LOOCV method. In this method, spectra from each donor at the time were excluded from the training data set and used for predictions. Cross-validation (CV) is a technique that can be used to validate the stability of a model and how well a model will perform with unknown samples. The samples are used for both training and testing, which is beneficial especially for studies involving a small sample size. This process provides more metrics of the model and helps to draw important conclusions about the algorithm and data set. The goal of CV is to limit problems like overfitting by capturing noise or patterns that do not generalize well to an unseen data set. To build the final model for the prediction of future cases, the learning algorithm would be applied to the entire learning set. The purpose of CV is to provide an estimate for the performance of this final model on an independent data set. LOOCV is a good choice for high-dimensional data giving a low bias.22 The major advantage of CV is the universality of the data splitting, which only assumes that data are identically distributed and the training and test samples are independent. Thus, it is important for a study involving subjects/donors that contain the subject-to-subject variation to perform subject-wise LOOCV, which eliminates the subject bias.29 Based on a subject-wise LOOCV in this study, it was found that 92% of the spectra were correctly classified, and 95% of the donors were correctly assigned. Table 2 shows the results of the classification. Majority of spectra of newborn donors, 48 out of 50, were assigned correctly, and two spectra were unassigned. The adolescent class had four unassigned spectra out of 40 spectra total, and the adult class had six spectra unassigned and four misclassified out of 110 spectra total. The results of the subject-wise LOOCV per donor can be seen in Table S1. These results illustrated high accuracy within the model.
Table 2. Results of the Subject-Wise LOOCV of the PLSDA Model.
| actual |
|||
|---|---|---|---|
| class predicted | newborn | adolescent | adult |
| newborn | 48 | 0 | 3 |
| adolescent | 0 | 36 | 1 |
| adult | 0 | 0 | 100 |
| unclassified | 2 | 4 | 6 |
Conclusions
Phenotype profiling is a tool that can help narrow down suspects and the victim pool. Using the biological composition in the blood, one can study the differences in samples and categorize samples based on classification groups. In this study, age was examined in three groups: newborn (<1 year old), adolescent (11–13 years old), and adult (43–68 years old). With the use of ATR FT-IR spectroscopy and chemometrics, the dried blood, which exhibited significant intra-class variations, was analyzed and classified into each prospective class of human age groups. Specifically, the PLSDA model was used to enhance spectral differences to create a model for distinguishing between newborn, adolescent, and adult samples. This proof-of-concept approach was evaluated by subject-wise LOOCV, resulting in a 92% correct spectral classification and a 95% correct donor classification.
This study was conducted using a limited number of samples. A question of a sample size is a key concern when advanced statistics is used for the development of new analytical classification methods. There are several stages of such method development, and the first of them, proof-of-concept study, is typically based on a limited number of samples, which are required for demonstrating the classification capability of the method. To reach more advanced conclusions, we plan to increase the size and variability of the donor cohort and differentiate between smaller age groups. The ultimate goal of this project is to build a regression model for chronological age determination. Recently, we have reported on regression models developed for determining the time since deposition of bloodstains using Raman spectroscopy.30,31 We plan on utilizing this approach for determining the chronological age of a blood donor.
Overall, this proof-of-concept study demonstrated the great potential of ATR FT-IR spectroscopy and chemometrics for phenotype profiling for forensic purposes based on dry bloodstains. This methodology is specifically advantageous in the forensic field since it is nondestructive and could be potentially used at a crime scene. Before the developed methodology can be used by law enforcement agencies, further research is required to validate the method with respect to other age groups, health conditions of blood donors, the presence of other body fluids, potential environmental contaminations, and substrate interference. Moreover, the validation concerning the limited sensitivity and selectivity of portable instruments in comparison with the benchtop instrument used in this study is needed for utilizing this novel methodology immediately at a crime scene.
Experimental Section
Blood Samples
The experiment was performed on blood samples obtained from 20 donors provided to us by BioIVT (Westbury, NY). Samples were divided into age classes of newborn (<1 year old), adolescent (11–13 years old), and adult (43–68 years old). The pool of donors included 5 newborns, 4 adolescents, and 11 adults. Each whole blood sample contained disodium EDTA. The samples were defrosted and vortexed before deposition. Samples were prepared by placing 30 μL of whole blood on a microscope slide and dried overnight. The dried blood sample was scraped off the slide and deposited on the ATR crystal.
Instrumentation and Spectra Collection
Spectra were recorded using a PerkinElmer Spectrum 100 FT-IR spectrometer (PerkinElmer, Inc., Waltham, MA) equipped with a diamond/ZnSe ATR crystal. Spectrum software version 6.0.2.0025 (PerkinElmer, Inc., Waltham, MA) was used for collecting spectra. The crystal was cleaned with water and acetone before each sample was placed on its surface. A solution of 10% bleach was used for safety purposes to clean the crystal after measurements. A background check was run prior to placing the sample on the crystal. To account for the heterogeneity of dry bloodstains, 10 spectra were recorded from different spots of each sample in a spectral range of 4000–600 cm–1. The spectral resolution was set to 4 cm–1, and three scans were taken per spectrum.
Data Analysis
Data set preparation and statistical analysis were performed using PLS Toolbox (Eigenvector Research, Inc., Wenatchee, WA) operating in MATLAB R2017b (MathWorks, Inc., Natick, MA).32 The spectral range of 2669–1711 cm–1 demonstrated enhanced contribution from the ATR crystal (Figure S2); therefore, this region was excluded from the analysis, as shown in an earlier study provided by our group.33 Truncated spectra were transformed into absorption by applying a log(1/T) function, smoothed and baseline-corrected by a first-order derivative, normalized by the total area, and mean-centered. After these preprocessing steps, the GA was used to select the most significant spectral regions for classifying the studied groups.34 A supervised statistical method, PLSDA, was employed to distinguish between age groups of blood donors.
Validation Tests
Because of the limited sample population size, the technique was validated by subject-wise LOOCV to ensure no overfitting. The spectra from one donor were removed from the training data set, and the PLSDA model was refitted to the remaining training data. Removed spectra were then used for prediction purposes. This process was repeated until all subjects were removed and predicted. The subject-wise LOOCV results are reported as the performance over all test sets, providing an estimate of model performance and confirming the classification of predictions carried out for this particular training data set.
Acknowledgments
We would like to thank Dr. Lenka Halámková for her assistance with statistical analysis. This project was supported by award nos. 2017-R2-CX-0006 and 2017-DN-BX-0135 awarded by the National Institute of Justice, Office of Justice Programs, U.S. Department of Justice. The opinions, findings, and conclusions or recommendations expressed in this publication are those of the authors and do not necessarily reflect those of the U.S. Department of Justice.
Supporting Information Available
The Supporting Information is available free of charge at https://pubs.acs.org/doi/10.1021/acsomega.0c01914.
Plots with ± standard deviation of ATR transmission values for specific peaks, results of the subject-wise LOOCV for the PLSDA classification based on each donor, and the spectrum of the ATR crystal (PDF)
Author Contributions
The manuscript was written through contributions of all authors.
The authors declare no competing financial interest.
Supplementary Material
References
- Mistek E.; Fikiet M. A.; Khandasammy S. R.; Lednev I. K. Toward Locard’s exchange principle: Recent developments in forensic trace evidence analysis. Anal. Chem. 2019, 91, 637–654. 10.1021/acs.analchem.8b04704. [DOI] [PubMed] [Google Scholar]
- Muro C. K.; Doty K. C.; Bueno J.; Halámková L.; Lednev I. K. Vibrational spectroscopy: Recent developments to revolutionize forensic science. Anal. Chem. 2015, 87, 306–327. 10.1021/ac504068a. [DOI] [PubMed] [Google Scholar]
- Khandasammy S. R.; Fikiet M. A.; Mistek E.; Ahmed Y.; Halámková L.; Bueno J.; Lednev I. K. Bloodstains, paintings, and drugs: Raman spectroscopy applications in forensic science. Forensic Chem. 2018, 8, 111–133. 10.1016/j.forc.2018.02.002. [DOI] [PubMed] [Google Scholar]
- Kumar R.; Sharma V. Chemometrics in forensic science. TrAC, Trends Anal. Chem. 2018, 105, 191–201. 10.1016/j.trac.2018.05.010. [DOI] [Google Scholar]
- Doty K. C.; Lednev I. K. Differentiating donor age groups based on Raman spectroscopy of bloodstains for forensic purposes. ACS Cent. Sci. 2018, 4, 862–867. 10.1021/acscentsci.8b00198. [DOI] [PMC free article] [PubMed] [Google Scholar]
- Takamura A.; Halamkova L.; Ozawa T.; Lednev I. K. Phenotype profiling for forensic purposes: Determining donor sex based on Fourier transform infrared spectroscopy of urine traces. Anal. Chem. 2019, 91, 6288–6295. 10.1021/acs.analchem.9b01058. [DOI] [PubMed] [Google Scholar]
- Muro C. K.; Doty K. C.; de Souza Fernandes L.; Lednev I. K. Forensic body fluid identification and differentiation by Raman spectroscopy. Forensic Chem. 2016, 1, 31–38. 10.1016/j.forc.2016.06.003. [DOI] [Google Scholar]
- Saferstein R.Criminalistics: An Introduction to Forensic Science. 11th ed.; Pearson Education: Upper Saddle River, NJ, 2015. [Google Scholar]
- Elkins K. M.Forensic DNA Biology: A Laboratory Manual. Academic Press: Waltham, MA, 2013. [Google Scholar]
- Landin-Wilhelmsen K.; Wilhelmsen L.; Lappas G.; Rosén T.; Lindstedt G.; Lundberg P.-A.; Bengtsson B.-Å. Serum insulin-like growth factor I in a random population sample of men and women: relation to age, sex, smoking habits, coffee consumption and physical activity, blood pressure and concentrations of plasma lipids, fibrinogen, parathyroid hormone and osteocalcin. Clin. Endocrinol. 1994, 41, 351–357. 10.1111/j.1365-2265.1994.tb02556.x. [DOI] [PubMed] [Google Scholar]
- Agudelo J.; Halámková L.; Brunelle E.; Rodrigues R.; Huynh C.; Halámek J. Ages at a crime scene: Simultaneous estimation of the time since deposition and age of its originator. Anal. Chem. 2016, 88, 6479–6484. 10.1021/acs.analchem.6b01169. [DOI] [PubMed] [Google Scholar]
- Wimberley P. D. Adult hemoglobin: Structure and function. Scand. J. Clin. Lab. Invest. 1982, 42, 17–31. [Google Scholar]
- Wimberley P. D. Fetal hemoglobin: Structure and function. Scand. J. Clin. Lab. Invest. 1982, 42, 32–37. [Google Scholar]
- Terrenato L.; Bertilaccio C.; Spinelli P.; Colombo B. The switch from haemoglobin F to A: the time course of qualitative and quantitative variations of haemoglobins after birth. Br. J. Haematol. 1981, 47, 31–41. 10.1111/j.1365-2141.1981.tb02759.x. [DOI] [PubMed] [Google Scholar]
- Duggan C.; Watkins J. B.; Koletzko B.; Walker W. A.. Nutrition in Pediatrics: Basic Science, Clinical Applications. 5th ed.; People’s Medical Publishing House-USA: Shelton, CT, 2016. [Google Scholar]
- Fujihara J.; Nishimoto N.; Yasuda T.; Takeshita H. Discrimination between infant and adult bloodstains using micro-Raman spectroscopy: A preliminary study. J. Forensic Sci. 2019, 64, 698–701. 10.1111/1556-4029.13904. [DOI] [PubMed] [Google Scholar]
- McLaughlin G.; Sikirzhytski V.; Lednev I. K. Circumventing substrate interference in the Raman spectroscopic identification of blood stains. Forensic Sci. Int. 2013, 231, 157–166. 10.1016/j.forsciint.2013.04.033. [DOI] [PubMed] [Google Scholar]
- Sato H.; Chiba H.; Tashiro H.; Ozaki Y. Excitation wavelength-dependent changes in Raman spectra of whole blood and hemoglobin: comparison of the spectra with 514.5-, 720-, and 1064-nm excitation. J. Biomed. Opt. 2001, 6, 366–370. 10.1117/1.1380668. [DOI] [PubMed] [Google Scholar]
- Mistek E.; Lednev I. K.. FT-IR spectroscopy for identification of biological stains for forensic purposes. Spectroscopy, 2018, 33, 8–19. https://www.spectroscopyonline.com/view/ft-ir-spectroscopy-identification-biological-stains-forensic-purposes [Google Scholar]
- Bueno J.; Sikirzhytski V.; Lednev I. K. Attenuated total reflectance-FT-IR spectroscopy for gunshot residue analysis: Potential for ammunition determination. Anal. Chem. 2013, 85, 7287–7294. 10.1021/ac4011843. [DOI] [PubMed] [Google Scholar]
- Mistek E.; Halámková L.; Lednev I. K. Phenotype profiling for forensic purposes: Nondestructive potentially on scene attenuated total reflection Fourier transform-infrared (ATR FT-IR) spectroscopy of bloodstains. Forensic Chem. 2019, 16, 100176. 10.1016/j.forc.2019.100176. [DOI] [Google Scholar]
- Molinaro A. M.; Simon R.; Pfeiffer R. M. Prediction error estimation: a comparison of resampling methods. Bioinformatics 2005, 21, 3301–3307. 10.1093/bioinformatics/bti499. [DOI] [PubMed] [Google Scholar]
- Olsztyńska-Janus S.; Szymborska-Małek K.; Gąsior-Głogowska M.; Walski T.; Komorowska M.; Witkiewicz W.; Pezowicz C.; Kobielarz M.; Szotek S. Spectroscopic techniques in the study of human tissues and their components. Part I: IR spectroscopy. Acta Bioeng. Biomech. 2012, 14, 101–115. [PubMed] [Google Scholar]
- Baker M. J.; Trevisan J.; Bassan P.; Bhargava R.; Butler H. J.; Dorling K. M.; Fielden P. R.; Fogarty S. W.; Fullwood N. J.; Heys K. A.; Hughes C.; Lasch P.; Martin-Hirsch P. L.; Obinaju B.; Sockalingum G. D.; Sulé-Suso J.; Strong R. J.; Walsh M. J.; Wood B. R.; Gardner P.; Martin F. L. Using Fourier transform IR spectroscopy to analyze biological materials. Nat. Protoc. 2014, 9, 1771–1791. 10.1038/nprot.2014.110. [DOI] [PMC free article] [PubMed] [Google Scholar]
- Elkins K. M. Rapid presumptive “fingerprinting” of body fluids and materials by ATR FT-IR spectroscopy. J. Forensic Sci. 2011, 56, 1580–1587. 10.1111/j.1556-4029.2011.01870.x. [DOI] [PubMed] [Google Scholar]
- Orphanou C.-M.; Walton-Williams L.; Mountain H.; Cassella J. The detection and discrimination of human body fluids using ATR FT-IR spectroscopy. Forensic Sci. Int. 2015, 252, e10–e16. 10.1016/j.forsciint.2015.04.020. [DOI] [PubMed] [Google Scholar]
- Takamura A.; Watanabe K.; Akutsu T.; Ozawa T. Soft and robust identification of body fluid using Fourier transform infrared spectroscopy and chemometric strategies for forensic analysis. Sci. Rep. 2018, 8, 8459. 10.1038/s41598-018-26873-9. [DOI] [PMC free article] [PubMed] [Google Scholar]
- Kanagathara N.; Thirunavukkarasu M.; Esther Jeyanthi C.; Shenbagarajan P. FTIR and UV-visible spectral study on normal blood samples. Int. J. Pharm. Bio. Sci. 2011, 1, 74–81. [Google Scholar]
- Arlot S.; Celisse A. A survey of cross-validation procedures for model selection. Statist. Surv. 2010, 4, 40–79. 10.1214/09-SS054. [DOI] [Google Scholar]
- Doty K. C.; McLaughlin G.; Lednev I. K. A Raman “spectroscopic clock” for bloodstain age determination: the first week after deposition. Anal. Bioanal. Chem. 2016, 408, 3993–4001. 10.1007/s00216-016-9486-z. [DOI] [PubMed] [Google Scholar]
- Doty K. C.; Muro C. K.; Lednev I. K. Predicting the time of the crime: Bloodstain aging estimation for up to two years. Forensic Chem. 2017, 5, 1–7. 10.1016/j.forc.2017.05.002. [DOI] [Google Scholar]
- Wise B. M.; Gallagher N. B.; Bro R.; Shaver J. M.; Windig W.; Koch R. S.. PLS Toolbox 3.5 for use with Matlab; Eigenvector Research, Inc., Wenatchee, WA, 2005. [Google Scholar]
- Mistek E.; Lednev I. K. Identification of species’ blood by attenuated total reflection (ATR) Fourier transform infrared (FT-IR) spectroscopy. Anal. Bioanal. Chem. 2015, 407, 7435–7442. 10.1007/s00216-015-8909-6. [DOI] [PubMed] [Google Scholar]
- Niazi A.; Leardi R. Genetic algorithms in chemometrics. J. Chemometrics 2012, 26, 345–351. 10.1002/cem.2426. [DOI] [Google Scholar]
Associated Data
This section collects any data citations, data availability statements, or supplementary materials included in this article.