

Abstract
Biomaterial microarrays are being developed to facilitate identifying the extrinsic cues that elicit stem cell fate decisions to self-renew, differentiate and remain quiescent. Raman microspectroscopy, often combined with multivariate analysis techniques such as partial least square-discriminant analysis (PLS-DA), could enable the non-invasive identification of stem cell fate decisions made in response to extrinsic cues presented at specific locations on these microarrays. Because existing biomaterial microarrays are not compatible with Raman microspectroscopy, here, we develop an inexpensive substrate that is compatible with both single-cell Raman spectroscopy and the chemistries that are often used for biomaterial microarray fabrication. Standard deposition techniques were used to fabricate a custom Raman-compatible substrate that supports microarray construction. We validated that spectra from living cells on functionalized polyacrylamide (PA) gels attached to the custom Raman-compatible substrate are comparable to spectra acquired from a more expensive commercially available substrate. We also showed that the spectra acquired from individual living cells on functionalized PA gels attached to our custom substrates were of sufficient quality to enable accurate identification of cell phenotypes using PLS-DA models of the cell spectra. We demonstrated this by using cells from laboratory lines (CHO and transfected CHO cells) as well as adult stem cells that were freshly isolated from mice (long-term and short-term hematopoietic stem cells). The custom Raman-compatible substrate reported herein may be used as an inexpensive substrate for constructing biomaterial microarrays that enable the use of Raman microspectroscopy to non-invasively identify the fate decisions of stem cells in response to extrinsic cues.
Graphical Abstract

Introduction
Understanding the extrinsic cues that commit embryonic and adult stem cells to self-renew, differentiate or remain quiescent is necessary for the development of in vitro culture systems that allow expanding stem cells for clinical and scientific applications [1, 2]. Stem cell fate decisions are influenced by extrinsic cues found in the stem cell niche, such as extracellular matrix (ECM) proteins, niche cells, biomolecular signals, and matrix stiffness [3, 4]. For example, current models of hematopoietic stem cell (HSC) differentiation, which is the focus of our research, propose that the most primitive hematopoietic stem cells (HSCs), long term (LT)-HSCs, reside near the endosteal niche, which has hypoxic properties that promote quiescence and self-renewal [5]. In contrast, the perivascular niche where HSC resides promotes HSCs differentiation and mobilization towards the blood stream [6]. The perivascular and endosteal niches also differ in stiffness, and previous studies demonstrate that matrix stiffness and the presence of ECM proteins (e.g., fibronectin or laminin) affect HSC lineage specification in culture [3]. Yet, the precise combination of extrinsic cues that elicit the individual fate decisions of HSCs as well as other types of stem cells are not known. Consequently, a large number of possible combinations of molecular and environmental cues must be screened to identify the factors that would enable maintaining and expanding HSCs in vitro [5].
Biomaterial microarrays for screening stem cell fate decisions [7] could enable correlation of extrinsic cues with cell response while using a small number of stem cells. This is especially important for HSCs because they account for < 0.005% of nucleated bone marrow cells [5], and no cell line accurately recapitulates their capabilities. Because cell response needs to be correlated with location on the microarray, standard techniques to quantify the responses of large numbers of stem cells that lose spatial information, including fluorescence-activated cell sorting of immunolabeled cells, gene expression analyses, and colony forming unit assays [8], cannot be used to identify the fate decisions of cells at specific locations within microarrays. Instead, population-specific immunolabeling and fluorescence microscopy analysis must be used to assess stem cell fate decisions as it affords location specificity and retains spatial information. However, labelling with fluorescent antibodies (Abs) to lineage-associated surface antigens may alter stem cell response. Additionally, spectral crosstalk between the multiple fluorescent Abs that are required to identify the most primitive hematopoietic cell populations [4–6, 9], and the difficulty of assessing the intensities of multiple fluorophores hinders the accurate identification of HSC fate decisions using immunofluorescence microscopy [6, 10].
Confocal Raman microspectroscopy is a non-invasive, label-free technique for single-cell analysis. Single-cell Raman spectra consist of combinations of peaks that are related to nucleic acids, proteins, lipids and carbohydrates, where the intensities of these peaks depend on cell type [11]. Prior studies demonstrate that Raman analysis using near-IR excitation does not adversely affect living cells [12]. Suhito et al. [13] have shown that the differentiation of adipose-derived mesenchymal stem cells to osteoblasts or adipocytes can be detected by an increase in the peak at 960 cm−1 or 2900 cm−1, respectively, due to the synthesis of bone minerals and fats [14]. This motivated us to employ single-cell Raman spectroscopy for the location-specific identification of HSC fate decisions in microarrays. However, because immature populations of hematopoietic cells do not produce biomolecules that create new Raman peaks as they differentiate [15], we use partial least square-discriminant analysis (PLS-DA) [16] to identify the between-population spectral variability that is most useful for identification of cell differentiation stage. We have established that the combination of Raman spectroscopy and PLS-DA enables accurate (≤ 10% error) identification of the differentiation stages of chemically fixed cells from four different hematopoietic cell populations, including the two primitive and closely related stem cell populations, LT-HSC and short term (ST)-HSC, and the two fully committed populations, granulocytes and B cells [15]. Encouraged by this success, we are working to develop a microarray screening platform that is compatible with acquiring single-cell Raman spectra that may be used to identify HSC fate decisions.
The first step for creating the envisioned microarray screening platform is to identify a substrate that is compatible with both single-cell Raman spectroscopy and the chemistries that are commonly used for biomaterial microarray fabrication. The weak nature of Raman spectroscopy and similarities in the spectra from cells of different phenotypes calls for a Raman substrate that maximizes the Raman scattering that is detected from live cells while minimizing overlapping signal from the substrates [17]. The substrate must also be affordable, readily available, and compatible with the chemistries used to prepare microarray screening platforms. Specialized substrates with minimal background interference, such as calcium fluoride, barium fluoride and magnesium fluoride, have been used for single-cell Raman spectroscopy [18–20], but their elevated cost necessitates reuse, and they are non-compatible with the chemistries that are commonly used for microarray fabrication. In contrast, glass microscope slides are often used as substrates for the fabrication of microarray screening platforms because they are compatible with optical microscopy as well as the chemistries that are commonly used for polyacrylamide (PA) hydrogel attachment [21]. Unfortunately, glass microscope slides produce a large Raman signal that overlaps the cell spectra [22]. This interfering Raman signal is effectively eliminated by coating the glass slide with gold [22, 23], and the gold layer can be covered with a layer of silicate that is too thin to produce a large Raman signal [23, 24], but thick enough for compatibility with the chemistries that are used to functionalize the surfaces of glass slides.
In our previous publications, we used commercially available protected-gold mirrors that were coated with a thin SiO2 layer (Thorlabs) as our Raman substrates [12, 15, 25]. We showed that fibronectin-functionalized PA gels could be covalently attached to the surface of these substrates, and single-cell Raman spectra could be acquired from both chemically fixed and living cells on the gels. However, these Thorlabs substrates were relatively expensive, and the difficulty of removing the cellular material and PA gel residue without damaging the silicate coating prevented their reuse. Furthermore, the dimensions of the commercially available substrates (6 mm tall and 12.7 mm diameter) were poorly suited for cell analysis because their height made media spillage inevitable during handling. These challenges inspired us to fabricate an inexpensive custom Raman-compatible substrate with dimensions that are better suited for constructing the envisioned biomaterial screening platform. Additionally, current microarrays developed for probing cellular differentiation of stem and progenitor cells could be adapted for Raman analysis by replacing the glass slide they are built on with a custom Raman-compatible substrate [26, 27].
Here, we use standard fabrication techniques to produce a custom Raman-compatible substrate that supports microarray construction and the acquisition of Raman spectra with sufficient quality to allow accurate identification cell phenotype with our PLS-DA and Raman spectroscopy approach. We show that these substrates are compatible with the chemistries that are commonly employed in microarray construction to covalently attach soft and stiff fibronectin-functionalized PA gels [21] that mimic properties of the HSC niche to their surfaces [3]. Because the subtle spectral differences between HSCs and their progeny might be obscured by spectral variation due to the different substrate compositions within microarray platforms, we also show that the phenotypes of cells on gels of differing stiffness may be accurately identified. We validated that the spectra from living cells on PA gels attached to our custom Raman-compatible substrate were comparable to spectra acquired from the commercial (Thorlabs) substrate. We also show that the cell spectra acquired from our custom substrate was of sufficient quality to allow individual cells to be accurately identified as either CHO cells or cells from the derived CHO transfected (CHO-T) cell line by PLS-DA of the spectra. Finally, we confirm that the phenotypes of freshly isolated LT-HSCs and ST-HSCs seeded on these substrates could be accurately identified by using PLS-DA of Raman spectra acquired from cells on our custom substrate. Thus, our custom Raman-compatible substrate provides an inexpensive option for the construction of a biomaterial microarray that is compatible with the non-invasive, in-situ identification of HSC fate decisions in response to biochemical and mechanical cues exhibited by the PA gel.
Experimental
Fabrication of Raman-compatible substrates
Premium plain glass microscope slides (Fisherbrand™) were cut into 12.5 mm by 12.5 mm squares with a diamond pen. Unless otherwise indicated all reagents were purchased from SigmaAldrich. Prior to metal deposition, these square pieces of glass slides were cleaned by placing them on an orbital shaker and shaking for 30 min in a solution of Triton X-100 (Fisher BioReagents) in distilled water (0.25% v/v). Next, the substrates were rinsed 5 times with distilled water and then were shaken for 30 min in distilled water, and then in acetone, isopropanol, and ethanol. Then the substrates were individually dried with filtered compressed air and placed in a desiccator for storage. Next, a 5-nm-thick chromium adhesion layer [28] was deposited following a 50-nm-thick gold layer [22, 29] using a thermal evaporator (Nano36, Kurt J. Lesker Company) equipped with a quartz crystal to monitor the deposition thickness. Finally, the gold-coated substrates were transported to a clean room for deposition of a final 100-nm-thick SiO2 layer [24, 29] by plasma enhanced chemical vapor deposition (Minilock-Orion PECVD, Trion Technology, rate = 35 nm/min, time = 180 s).
Thermal polymerization of polyacrylamide gels attached to substrates
Polyacrylamide (PA) gels were fabricated and functionalized using previously reported techniques [21, 27]. Briefly, the commercially available gold mirror substrates (12.7 mm in diameter, Thorlabs) and the custom substrate that was used to compare the spectra from CHO cells were aminosilanized by reaction with 0.1 N sodium hydroxide, followed by 3-aminopropyltrimethoxysilane and 0.5 % glutaraldehyde [21]. Next, thermally polymerized PA gels with stiffness that are typically around 1.1 ± 0.30 kPa (“soft”) and 42 ± 1.2 kPa (“stiff’) were fabricated from acrylamide/ bis-acrylamide w/v prepolymer solutions with concentrations of 3%/0.15% (w/v) and 12%/0.3% (w/v), respectively. Tetramethylenediamine (1/1000 v/v) and 10% (w/v) ammonium persulfate in PBS (1/100 v/v) were added to the prepolymer solution. 30 μL of this solution was deposited on the activated substrate. The Thorlabs substrate was covered with a 12 mm diameter chlorosilanized coverslip, the custom substrate was covered with an approximately 13 mm by 13 mm chlorosilanized coverslip, and the prepolymer solution was polymerized for 40 min at rt. Then the coverslip was removed, and the PA gel was thoroughly washed with PBS.
For the HSC experiments, thermally polymerized PA gels were fabricated on the custom substrates. Briefly, the custom substrates were activated by shaking them in a solution of 0.05 N NaOH for 1 h [27]. The substrates were rinsed 5 times with distilled water, dried under a stream of filtered compressed air, and baked on a hot plate at 110 °C for 5 min. Next, the substrates were reacted with a 2% v/v solution of 3-(trimethoxysilyl)propyl methacrylate (3-TPM, Fisher Scientific) in ethanol for 30 min, rinsed by shaking the substrates in ethanol for 5 min, dried under a stream of filtered compressed air, and baked on a hot plate at 110 °C for 5 min. Next, thermally polymerized PA gels with stiffness that are typically around 1.6 ± 0.22 kPa (“soft”) and 45 ± 1.6 kPa (“stiff’) were fabricated from acrylamide/bis-acrylamide prepolymer solutions with concentrations of 4%/0.1% (w/v) and 12%/0.4% (w/v), respectively.
Photopolymerization of PA gels attached to custom substrates
PA gels were photopolymerized on the custom Raman substrates for the CHO cell experiments. The substrates were activated and reacted with 3-TPM as described above. Photopolymerized PA gels were fabricated on the activated substrates using a prepolymer solution of acrylamide/bis-acrylamide at a ratio of 16%/0.5% (w/v). Irgacure 2959 photoinitiator dissolved in methanol (20% w/v) was added to the prepolymer solution in a 1:9 ratio [27]. 30 μL of each solution was deposited on the activated custom Raman-compatible substrate and a chlorosilanized glass coverslip was placed on top. The solution was exposed to UV light (365 nm wavelength; ~3.5 mW/cm2, Daigger Scientific Inc.) for durations that varied in order to produce PA gels with stiffness that were typically 2.1 ± 0.48 kPa (“soft”) and 39 ± 1.4 kPa (“stiff’). Finally, the coverslip was removed, and the PA gel was thoroughly washed with PBS.
Functionalization of PA gels with fibronectin
The PA gels were subsequently reacted with 50 mM N-sulfosuccinimidyl 6-(4’-azido-2’-nitrophenylamino)hexanoate (sulfo-SANPAH) under UV from 10 min, rinsed with PBS, and exposed to a fibronectin solution (50 or 100 μg/mL in PBS) for 1 h at rt [21].
Creation of the transfected CHO-K1 cell line
To create CHO-K1 cells that stably express HaloTag® and SNAP-tag® proteins fused to organelle-specific proteins, CHO-K1 cells (CHO, ATCC®, CCL-61™) were transfected with a plasmid DNA expression clone for human RAB9A with N-terminal HaloTag® (RAB9A-Halo) and hygromycin resistance gene (GeneCopoeia), and a second plasmid DNA expression clone for amino acids 1-81 of human B4GALT1 with C-terminal SNAP-tag® (B4GALT1-SNAP) and neomycin resistance gene (GeneCopoeia). DNA plasmid solution was prepared by incubating 2.5 μg of each DNA Plasmid and 7.5 μL of EndoFectin Max transfection reagent (GeneCopoeia) in 250 μL of RPMI at rt for 30 min. The plasmid solution was added to CHO-K1 cells and incubated at 37 °C for 48 h. Then the medium was supplemented with 30 μL of 0.3 mg/mL of hygromycin (ThermoFisher Scientific) and 30 μL of 0.3 mg/mL geneticin (ThermoFisher Scientific), and the transfected cell were grown to 80% confluency. Next, the cells were fluorescently labeled with SNAP-Cell® 505-Star (New England BioLabs) and HaloTag® TMR (Promega) following the manufacturer’s protocol. Cells containing both fluorescent probes were purified via fluorescence-activated cell sorting (FACS) with a BD FACs Aria II flow cytometer. These cells were cultured under the same conditions as CHO cells, but the medium was supplemented with 30 μL of 0.3 mg/mL of hygromycin and 30 μL of 0.3 mg/mL geneticin. After 5 passages, expression of B4GALT1-SNAP-Tag and RAB9A-HaloTag were assessed by labelling cells with SNAP-Cell® 505-Star and HaloTag® TMR, and imaging them with a Zeiss laser scanning microscope, 710 confocal fluorescence microscope, at the Carl R. Woese Institute for Genomic Biology (University of Illinois at Urbana-Champaign). Fluorescence imaging of SNAP-Cell® 505-Star and HaloTag® TMR was performed with maximum excitation/emission of 488/522 nm and 561/650 nm, respectively. Cell population containing both fluorophores were aliquoted and frozen.
Cell culture
CHO-K1 and transfected CHO-K1 cells (CHO-T, CHO-K1 cells that stably express HaloTag® and SNAP-tag® proteins fused to organelle-specific proteins) were cultured in 6 cm culture dishes (Falcon) with RPMI, 10% fetal bovine serum (FBS, ThermoFisher Scientific), and 1% penicillin-streptomycin (P/S, ThermoFisher Scientific) in an incubator at 37 °C supplying 5% CO2. CHO-T cells were cultured under the same conditions as CHO cells, but the medium was supplemented with 30 μL of 0.3 mg/mL of hygromycin and 30 μL of 0.3 mg/mL geneticin.
Hematopoietic stem cell isolation
All work involving primary cell extraction was conducted under approved animal welfare protocols (Institutional Animal Care and Use Committee, University of Illinois at Urbana-Champaign). Bone marrow cells were isolated from the crushed tibia and femur of C57BL/6 female mice, age 4 – 8 weeks (The Jackson Laboratory). Following lysis of red blood cells in ACK lysis buffer, cells were washed in PBS + 5% FBS at 300 rcf for 10 minutes. Initial hematopoietic lineage negative enrichment was performed with EasySep™ Mouse Hematopoietic Progenitor Cell Isolation Kit (#19856, STEMCELL Technologies, CA). The enriched lineage-negative (Lin−) population were then stained for further purification via fluorescence-activated cell sorting (FACS). A BD FACS Aria II flow cytometer was used to collect LT-HSC: CD34− Flk2− Lin− Sca−1+ c-kit+; ST-HSC: CD34+ Flk2− Lin− Sca−1+ c-kit+; and MPP: CD34+ Flk2+ Lin− Sca−1+ c-kit+. Viable cells were sorted with propidium iodide (#BMS500PI ThermoFisher). Live cells were sorted into tubes in 500 μL of StemSpan™ SFEM (#09650 STEMCELL Technologies) supplemented with 100 ng/mL SCF (Peprotech), 25% FBS, and 0.1% P/S (Gibco).
All antibodies were supplied by ThermoFisher, and are as follows: eFluor660-conjugated CD34 (90 min: 1:100, # 50-0341-82), PerCp-eFluor710-conjugated Flk2 (30 min: 1:100, # 46-1351-82), APC-eFluor780-conjugated c-kit (30 min: 1:800, #47-1172-82), PE-conjugated Sca-1 (30 min: 1:400, #12-5981-82), and Lin: FITC-conjugated CD5, B220, CD8a, CD11b (1:100, #11-0051-82, #11-0452-82, #11-0081-82, #11-0112-82 ), Gr-1 (1:400, #11-5931-82), and Ter-119 (1:200, #11-5921-82) [30–33].
The primary LT-HSCs and ST-HSCs used in these experiments were harvested from a minimum of 4 mice on two different days one week apart. The flow cytometry counts after isolation of LT-HSCs were 100,782 for week 1 and 50,842 for week 2 and those of ST-HSCs were 7,070 for week 1 and 6,006 for week 2.
Sample preparation for Raman spectra acquisition
To compare the spectra from CHO cells on gels attached to both the custom substrates and the Thorlabs substrate, the cells were seeded on each substrate, transferred to a new dish containing fresh medium, and spectra were acquired in ambient air. For the CHO cells cultured on Thorlabs substrates and custom substrates, the fresh medium consisted of phenol red-free RPMI with 2.5% HEPES buffer (1 M), 10% FBS and 1% P/S.
Samples containing CHO and CHO-T cells that were used to assess accuracy of identification by PLS-DA were prepared as follows. Briefly, CHO and CHO-T cells were seeded onto separate 12.5 mm by 12.5 mm custom substrates that were functionalized with a fibronectin-coated PA gel and incubated overnight. Two substrates were prepared for each cell line, one with a soft gel and one with a stiff gel. To a new culture dish was added one substrate with cultured cells and 10 mL of fresh medium containing RPMI (with phenol red) plus 10% FBS and 1% P/S. These cells were maintained in ambient air at 37 °C using a custom heat stage for Raman acquisition.
For the experiment involving HSCs, samples were prepared as follows. Following flow cytometry, both LT-HSCs and ST-HSCs in tubes on ice were transported to the Microscope Suite at the Beckman Institute. Cells were centrifuged at 3900 rpm for 7 min and resuspended in 1 mL SFEM medium (STEMCELL) with 1% P/S and 100 ng/mL stem cell factor (SCF), which promotes HSC maintenance in culture. Each cell population was seeded onto two separate custom Raman-compatible substrates functionalized with a fibronectin coated PA gel, one soft and one stiff. These samples were incubated overnight (~16 h) to allow the cells to recover from the stress of harvesting and sample preparation. For live cell analysis, the custom Raman-compatible substrate was placed in a culture dish and maintained in ambient air at 37 °C with a custom heat stage. To facilitate the analysis of these weakly adherent cells, the volume of media was kept to the minimum required to hydrate the water dipping objective, and 100 μL aliquots of fresh SFEM media were added as needed.
Acquisition of Raman spectra
Spectra were acquired with a Raman confocal microscope (Horiba LabRam HR 3D confocal Raman imaging system) at 37 °C using an Olympus 60x, NA 1.0, water-dipping objective with a working distance of 2 mm that was immersed directly into the cell media. A 200 mW, 785 nm laser was used to focus on a diffraction-limited spot size of 1 μm (calculated as 1.22λ/NA) in diameter on each cell. Adjacent non-cellular material and neighboring cells were excluded from the focal area. The pinhole size was set to 500 μm, the slit size to 100 μm, and the grating to 300 groves per mm. Raman scattering was acquired for the fingerprint region from 600 to 1750 cm−1 for 20 s per cell [12, 15, 25].
Spectral analysis
Spectral preprocessing was performed using LabSpec 5 (Horiba Scientific) and the PLS Toolbox (v.8.8.1, Eigenvector Research) run in MATLAB (R2016b, MathWorks Inc.) prior to multivariate analysis. Cosmic spikes were removed manually during acquisition with LabSpec 5. Spectra were aligned to the peak of phenylalanine at 1004 cm−1, which is used as the reference peak because it is always present on the cell spectra. This alignment was performed manually in Excel for the CHO cell spectra, and it was performed using and an in-house MATLAB code for HSCs spectra. To minimize the large sloping baseline due to autofluorescence and peaks associated with the PA gel in the spectra from LT-HSCs and ST-HSCs, we employed an automated background subtraction algorithm developed by Beier et al [34]. All cell spectra were then preprocessed using the PLS Toolbox. Spectra were aligned using offset variable alignment (slack = 3) to correct small differences due to instrumental variation. Derivative of spectra was applied using a Savitzky-Golay algorithm (2nd order polynomial, 2nd derivative, window = 25 points). Each spectrum was normalized to all peaks over the 600-1750 cm−1 range and mean centered to the data set. A PLS-DA model that related the Raman peaks in the calibration spectra to a matrix of variables indicative of each sample classification was run with the PLS Toolbox in MATLAB. The minimum number of latent variables (LVs), which are the linear combinations of Raman spectral features that are the most useful for identifying cell type, required to capture at least 80% of the spectral variance were retained in each model [15]. The resulting PLS-DA model was applied to a separate set of test spectra that had not been used for model construction. The spectra in the test set were acquired from cells seeded on both soft and stiff PA gels functionalized with fibronectin. For each cell, numerical prediction values are calculated for each population and used to create identification plots. Prediction values that exceed the Bayesian threshold (red dashed line) determined for each cell population indicate the sample is a member of that population [16]. For comparison, we also assessed model accuracy by compiling all the spectra from each experiment in a single data set and performing cross-validation using the Venetian blinds method with 2, 5 and 10 splits.
Results and Discussion
Custom Raman-compatible substrates
The design of the custom Raman-compatible substrates for live cell analysis is illustrated in Figure 1. This custom Raman-compatible substrate is based on a gold layer that blocks interfering signal from the underlying glass slide [22]. This gold layer is coated with a thin SiO2 layer that allows the covalent attachment of a PA gel without producing a substantial background signal [24]. This renders the substrates suitable for the construction of the aforementioned microarray platform for screening HSC fate decisions and other types of stem cells with noninvasive Raman spectroscopy. To fabricate the substrates, thermal vapor deposition was used to deposit a 5-nm-thick chromium (Cr) adhesion layer on the glass substrate, followed a 50-nm-thick gold (Au) layer. The thickness of each layer was monitored during deposition with a quartz crystal thickness monitor. These layer thicknesses were validated by using X-ray reflectivity, and good agreement was found (Figure S1). Then a 100-nm-thick silicon dioxide (SiO2) layer was deposited on top of the gold layer using PECVD. Based on use of this fabrication process to create a single batch of substrates, we calculate our cost is $3.35 per substrate, which is approximately 8 times less expensive than the commercially available (Thorlabs) protected gold mirror substrate (Table S1). Of course, the cost would further decrease for both academic and nonacademic users if multiple batches were fabricated at a time.
Figure 1.

Diagram shows the dimensions and thickness of gold and silicon dioxide layers deposited on glass substrates that comprise our custom Raman-compatible substrate.
We assessed the quality of the Raman spectra acquired from individual CHO cells on soft and stiff PA gels covalently attached to custom substrates by comparison to spectra acquired from CHO cells on soft and stiff functionalized PA gels on the commercial substrates from Thorlabs (Figure 2.a). The primary difference between the four spectra is the intensity of the broad peak at 850 cm−1 is higher in the spectra of cells on the soft and stiff PA gels attached to the Thorlabs substrate than in the cell spectra acquired from gels on the custom substrate. This difference in the intensity of the broad 850 cm−1 peak is likely due to differences in PA gel thickness. This interpretation is supported by prior reports that assign the spectral peaks at 830-850 cm−1 to polyacrylamide [35–37]. Furthermore, the same volume of prepolymer solution was used to create the gels on both substrates even though the surface area of the Thorlabs substrate is smaller than that of the custom substrate. In contrast, the spectral features between the peak at 1004 cm− that is assigned to phenylalanine breathing modes [11] and the peak at 1750 cm−1 are highly comparable across all samples. This includes the 1450 cm−1 peak assigned to the C-H deformation from proteins and lipids, and the 1660 cm−1 peak assigned to the amide I vibration from proteins [11]. Comparison of the average spectra acquired from cells on each combination of PA gel stiffness and substrate (Figure 2.b) reveals the spectra acquired from both the custom substrate and the commercially available (Thorlabs) substrate are also roughly comparable across the same spectral range. Overall, the small standard deviations for each average spectrum indicate the spectral contributions of many well-defined biomolecules, such as those that produce the peaks at 1004 cm−1, 1450 cm−1 and 1660 cm−1, are reproducible.
Figure 2.
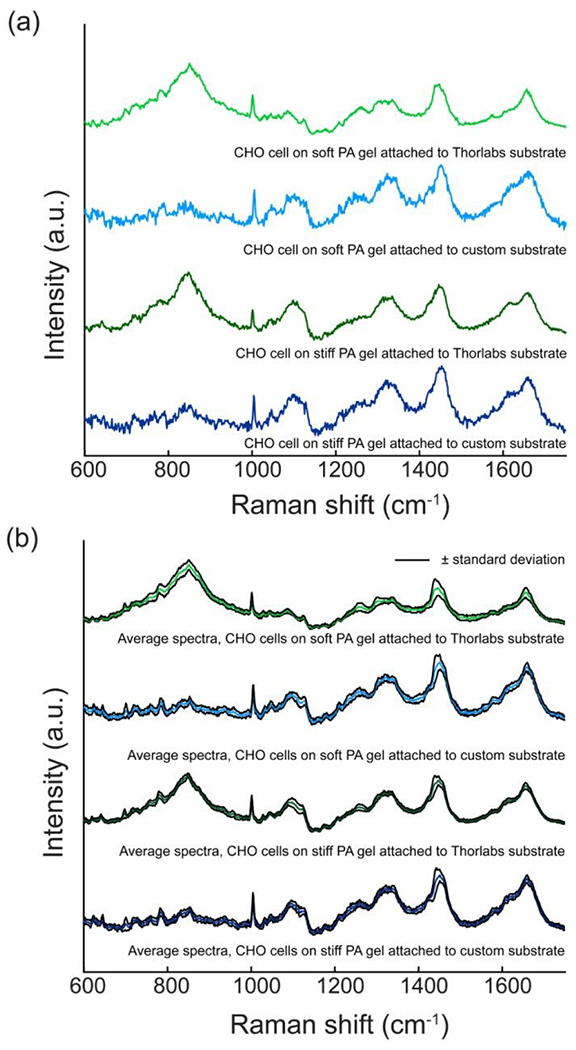
Comparison of spectra from samples on either a custom substrate (light and dark blue) or to a commercially available (Thorlabs) substrate (light and dark green). (a) A representative spectrum of a CHO cell on each type of fibronectin-functionalized PA gel (soft or stiff) attached to either a custom substrate or a Thorlabs substrate is shown for comparison. (b) Average spectra acquired from CHO cells on soft and stiff fibronectin-functionalized PA gels attached to either a custom substrate (nsoft = 20 and nstiff = 20) or to a Thorlabs substrate (nsoft = 20 and nstiff = 17). The spectra in both panels were baseline corrected using a weighted-least-squares method, normalized and offset for clarity.
Identifying the phenotype of individual living cells on custom Raman-compatible substrates
Next, we accessed whether the spectra acquired from living cells on fibronectin-coated soft and stiff PA gels anchored to custom Raman-compatible substrates were of sufficient quality to allow the accurate identification (error of identification of ≤ 10%) [12, 15] of the cell phenotypes using PLS-DA. We employed cells from the CHO and CHO-T cell lines because they are very closely related, so we expected their spectra would be as similar to one another as those from primary HSCs and their progeny. The spectra were preprocessed by taking the second derivative of the spectra, and then performing normalization and mean centering to reduce, but not eliminate the peaks in the Raman spectra of the living cells that were produced by the gels. Because PLS-DA uses spectral features that vary between, but not within each class for identification, we used a calibration set that contained an equal number of spectra for every combination of cell type and gel stiffness (24 spectra/cell type, 12 on soft and 12 on stiff gels) for PLS-DA model construction. The resulting model consisted of 4 latent variables that captured 84.90% of the total variation in the calibration set, and it was applied to an independent (test) set of 26 spectra of cells from each line. The cells that exceed the classification threshold represented by a red dashed line in the identification plot for the specified cell type (Figure 3.a and Figure 3.b) were identified as belonging to that population. High sensitivity and specificity (correctly identified as part of that population and correctly identified as not part of that population, respectively) were obtained for both the calibration (>0.95) and test (>0.85) sets. The lineages of the CHO and CHO-T cells in the test set were each identified with identification error of 9.6%, which is within our benchmark of ≤ 10%. To further evaluate model performance, we executed a cross-validation assessment by combining both calibration and test data (randomly distributed) using the Venetian blinds method with 2, 5 and 10 splits. The error of cross-validation with 2, 5 and 10 splits were all 10% (refer to Table S2), which is comparable to the identification error of 9.6% obtained when the PLS-DA model was constructed using a separate data set for calibration and validation. These results demonstrate the spectra acquired from living cells on fibronectin-functionalized PA gels that were covalently attached to the custom Raman-compatible substrates had sufficient intensities to discern subtle spectral differences between closely related cells using PLS-DA. Thus, cell phenotype can be accurately identified despite potential spectral variation within each cell class resulting from the difference in gel stiffness.
Figure 3.

Identification plots for the PLS-DA model generated using Raman spectra of calibration CHO and CHO-T cells seeded on soft and stiff PA gels functionalized with fibronectin were used to classify a test set of CHO and CHO-T cells. Cells located above the classification threshold (red dashed line) were identified as (a) CHO (ncalibration = 24, ntest = 26, red diamonds) and (b) CHO-T (ncalibration = 24, ntest = 26, green squares) cells. (c) Average Raman spectra that were background subtracted, baseline corrected using automatic Whittaker filter, and normalized used for comparison to the relevant peaks on the variable importance for prediction (VIP) plot. (d) VIP score plot for the PLS-DA model represented in (a) and (b). Peaks with high VIP scores (> 1) that are labeled in black correspond to the black-labeled peaks in (c).
We examined the variable importance for prediction (VIP) plot to identify the spectral and biochemical components that were important for identifying the CHO and CHO-T cells. The VIP score plot for the PLS-DA model constructed is shown in Figure 3.d. The peaks with VIP scores that exceed the threshold at unity, which is shown as a red-dashed line, are most important for identification [38]. These important peaks include 695 cm−1 (protein), 859 cm−1 (tyrosine, collagen and PA gel), 926 cm−1 (protein band), 987 cm−1 (protein C-C stretching), 1097 (C-N in lipids)-1120 cm−1 (C-O band of ribose), 1374 cm−1 (DNA/RNA bases), 1453 cm−1 (lipids and protein band) and 1655 cm−1 (protein, amide I). Most of these peaks are attributed to cellular proteins and lipids, and they have been observed by others in CHO cell spectra [24, 39–42]. Comparison of the VIP plot to the baseline corrected and normalized spectra (Figure 3.c) reveals that the peaks with high VIP scores are not necessarily the peaks with the highest intensity in the spectra or those that vary most between the two cell types (e.g., other variations observed at 781, 1236, 1257 cm−1). This demonstrates that visual identification of the peaks with intensities that differ the most between the baseline corrected and normalized spectra of CHO and CHO-T cells is insufficient for phenotypic identification. Instead, modeling with PLS-DA is needed to identify the sets of peaks that are most important for assigning cell type, regardless of their intensity.
Having demonstrated that low identification errors can be obtained using laboratory cell lines cultured on custom Raman-compatible substrates functionalized with a fibronectin-coated PA gel, we next assessed whether the phenotypes of freshly isolated LT-HSCs and ST-HSCs seeded on these substrates could be accurately identified. Unlike cells from the CHO cell lines, the LT-HSCs and ST-HSCs are weakly adherent, and settle on, but do not attach to the gel surface. We acquired Raman spectra from individual living LT-HSCs and ST-HSCs seeded on the custom Raman-compatible substrates functionalized with a fibronectin-coated PA gel that was either soft or stiff. Figure 4.a shows the average background-subtracted, baseline-corrected, and normalized spectra from the living LT-HSCs and ST-HSCs. A modified background-subtraction algorithm [34] was applied to these cell spectra to minimize potential differences in the spectra that resulted from the difference in the stiffness of the fibronectin-coated PA gels, autofluorescence, and the intensity of the gel peaks in the spectra due to differences in the proximity of the weakly adherent HSCs to the gel. Notably, flow cytometry of the LT-HSCs on both the soft and stiff PA gels following spectral acquisition showed that cell viability was not adversely affected by exposure to the 785 nm Raman laser (Figure S3).
Figure 4.

Average Raman spectra of individual living HSCs and the identification plots for the PLS-DA model. (a) Average Raman spectra of individual living LT-HSCs (blue, n = 143) and ST-HSCs (purple, n = 126) on soft and stiff PA gels functionalized with fibronectin. Spectra were background subtracted, baseline corrected using a weighted-least-squares method, normalized, and offset for clarity. Identification plots for the PLS-DA model generated using Raman spectra of calibration LT-HSCs (n = 73) and ST-HSCs (n = 63) that were seeded on soft and stiff PA gels used to classify a test set of spectra from 70 LT-HSCs and 63 ST-HSCs. Cells located above the classification threshold (red dashed line) were identified as (b) LT-HSCs (blue, circles) and (c) ST-HSCs (purple, hexagons). (d) VIP score plot for the PLS-DA models represented in (b) and (c) reveals which peaks have high scores, and thus, are most important for discriminating the LT-HSCs from ST-HSCs. The prominent peaks that exceed the red-dashed line (threshold at unity) are labeled in black and correspond to the black-labeled peaks in Figure S4.
To identify the differentiation states of the individual cells based on their spectra, a PLS-DA model was constructed using a calibration set containing 73 spectra from LT-HSCs and 63 spectra from ST-HSCs; for each cell type, a nearly equal number of spectra were acquired from cells on soft and stiff gels. The resulting PLS-DA model consisted of 5 latent variables that captured 84.25% of the total variation in the calibration set, and it was applied to a separate test set containing 70 spectra from LT-HSCs and 63 spectra from ST-HSCs. The cells that exceed the classification threshold represented by the red dashed line in the identification plot shown in Figure 4.b and Figure 4.c were identified as belonging to the population indicated on the y-axis. The differentiation states of the individual living HSCs were identified with high sensitivity and specificity for both the calibration (1.00) and test set (>0.93). The identification error for the LT-HSC and ST-HSC is 0% for the calibration set and 5.3% for the test set. This means the PLS-DA model distinguished between the live LT-HSCs and ST-HSCs seeded on fibronectin-coated soft and stiff PA gels attached to the custom Raman-compatible substrates with 95% accuracy. Again, we evaluated our PLS-DA model performance by means of a cross-validation assessment. Combining both calibration and test data (randomly distributed) and using the Venetian blinds method for cross-validation, we obtained errors of cross-validation of 7.2%, 4.1%, and 3.7% for 2, 5 and 10 splits, respectively (refer to Table S2). These errors agree with the 5.3% identification error obtained using a separate calibration and validation set. Overall, these results suggest that the quality of the spectra acquired from cells on functionalized custom substrates is sufficient for the accurate identification (error ≤ 10%) of LT-HSCs and ST-HSCs.
To investigate the spectral and biochemical components that were important for discriminating LT-HSCs from ST-HSCs, we analyzed the VIP score plot shown in Figure 4.d. The peaks with the highest VIP scores (> 2), and thus, most importance for identification, were 845 cm−1 (PA gel), 886 cm−1 (PA gel and proteins), 1051 cm−1 (protein) and 1378 cm−1 (DNA/RNA bases). The peaks at 664 cm−1 (DNA bases), 789 cm−1 (DNA), 1288 cm−1 (nucleic acids), 1449 cm−1 (lipids and protein band), 1534 cm−1 (protein), and 1693 cm−1 (protein, amide I) were also important for identification (VIP > 1.5, gray labels, Figure 4.d), though to a lesser extent. Comparison of the peaks with high VIP scores to the background subtracted, baseline corrected and normalized spectra (Figure S4) demonstrates that these peaks are also present in the spectra from the HSCs. This is consistent with previously reported PLS-DA models constructed of Raman spectra from chemically fixed cells for the identification of the differentiation stages of cells from primitive and mature hematopoietic cell populations [15].
All together, these studies show that Raman spectra can be acquired from cells on our Raman-compatible substrates, and the quality of the spectra is sufficient to permit accurately identifying the population each living cell belongs to using PLS-DA models of the Raman spectra. Moving forward, the development of a label-free imaging that can separate closely related hematopoietic populations will be a valuable tool in deciphering the role of extrinsic cues in stem cell fate decisions.
Conclusion
Here we developed an inexpensive substrate that is compatible with both single-cell Raman spectroscopy and the chemistries that are often used for biomaterial microarray fabrication. The Raman spectra of cells on functionalized PA gels attached to our custom substrates were comparable to those acquired from commercial protected gold mirrors. The quality of the Raman spectra acquired from individual, living cells on these custom substrates allowed us to accurately identify the differentiation states of primary murine cells from the two most immature HSC populations using PLS-DA of single-cell Raman spectra. Thus, the inexpensive custom Raman-compatible substrate developed herein brings us a step closer to the construction of a microarray screening platform for the non-invasive screening of stem cell fate decisions elicited by extrinsic cues. Such a platform would likely facilitate the expansion of HSCs in vitro for clinical applications. These substrates may also be employed to construct microarray platforms for noninvasively screening the dynamic responses of other types of stem cells to stimuli using Raman spectroscopy. Overall, the ability to trace stem cell response to the environment over time may yield information that complements that acquired with existing approaches used to study stem cell biology.
Supplementary Material
Acknowledgments
Thermal evaporation deposition for custom Raman-compatible substrates was carried out in part of the Materials Research Laboratory Central Research Facilities, University of Illinois at Urbana-Champaign (UIUC), and the authors thank Dr. Xiaoli Wang for assistance with that process. Plasma-enhanced chemical vapor deposition for Raman-compatible substrates was carried out in the Holonyak Micro and Nanotechnology Lab Facilities (UIUC). Raman spectroscopy was performed in the Microscopy Suite at the Beckman Institute for Advanced Science and Technology (UIUC) and the authors thank Dr. Dianwen Zhang for technical assistance. Flow cytometry was performed in the Roy J. Carver Biotechnology Center (Flow Cytometry Facility, UIUC), and the authors thank Dr. Barbara Pilas for assistance with bone marrow cell isolation and technical assistance. This work was supported by the National Institutes of Health under R21 HL132642 (M.L.K.), R01 CA197488 (B.A.C.H), R01 DK099528 (B.A.C.H), R21 EB018481 (B.A.C.H.), F31 DK117514 (A.E.G.), and T32 EB019944 (A.E.G.). The content is solely the responsibility of the authors and does not necessarily represent the official views of the NIH. Portions of this work were also supported by the U.S. National Science Foundation under CHE-1508662. Any opinions, findings, and conclusions or recommendations expressed in this material are those of the authors and do not necessarily reflect the views of the National Science Foundation. The authors want to acknowledge additional institutional and financial assistance provided by the Department of Chemical and Biomolecular Engineering at UIUC.
Footnotes
Publisher's Disclaimer: Accepted Manuscripts are published online shortly after acceptance, before technical editing, formatting and proof reading. Using this free service, authors can make their results available to the community, in citable form, before we publish the edited article. We will replace this Accepted Manuscript with the edited and formatted Advance Article as soon as it is available.
Disclosure Statement
No competing financial interests exist.
References
- 1.Rezza A, Sennett R, and Rendl M, Chapter Twelve - Adult Stem Cell Niches: Cellular and Molecular Components, in Current Topics in Developmental Biology, Rendl M, Editor. 2014, Academic Press, p. 333–372. [DOI] [PubMed] [Google Scholar]
- 2.Dellatore SM, Garcia AS, and Miller WM, Mimicking stem cell niches to increase stem cell expansion. Current Opinion in Biotechnology, 2008. 19(5): p. 534–540. [DOI] [PMC free article] [PubMed] [Google Scholar]
- 3.Choi JS and Harley BAC, Marrow-inspired matrix cues rapidly affect early fate decisions of hematopoietic stem and progenitor cells. Science Advances, 2017. 3(1): p. e1600455. [DOI] [PMC free article] [PubMed] [Google Scholar]
- 4.Wilson A and Trumpp A, Bone-marrow haematopoietic-stem-cell niches. Nature Reviews Immunology, 2006. 6(2): p. 93–106. [DOI] [PubMed] [Google Scholar]
- 5.Mendez-Ferrer S, et al. , Mesenchymal and haematopoietic stem cells form a unique bone marrow niche. Nature, 2010. 466(7308): p. 829–834. [DOI] [PMC free article] [PubMed] [Google Scholar]
- 6.Crane GM, Jeffery E, and Morrison SJ, Adult haematopoietic stem cell niches. Nature Reviews Immunology, 2017. 17(9): p. 573–590. [DOI] [PubMed] [Google Scholar]
- 7.Mirshafiee V, Harley BAC, and Kraft ML, Visualizing Intrapopulation Hematopoietic Cell Heterogeneity with Self-Organizing Maps of SIMS Data. Tissue Engineering Part C: Methods, 2018. 24(6): p. 322–330. [DOI] [PMC free article] [PubMed] [Google Scholar]
- 8.Morrison SJ and Spradling AC, Stem Cells and Niches: Mechanisms That Promote Stem Cell Maintenance throughout Life. Cell, 2008. 132(4): p. 598–611. [DOI] [PMC free article] [PubMed] [Google Scholar]
- 9.Passegue E, et al. , Normal and leukemic hematopoiesis: Are leukemias a stem cell disorder or a reacquisition of stem cell characteristics? Proceedings of the National Academy of Sciences, 2003. 100(suppl 1): p. 11842. [DOI] [PMC free article] [PubMed] [Google Scholar]
- 10.Choi JS, Mahadik BP, and Harley BAC, Engineering the hematopoietic stem cell niche: Frontiers in biomaterial science. Biotechnology Journal, 2015. 10(10): p. 1529–1545. [DOI] [PMC free article] [PubMed] [Google Scholar]
- 11.Talari ACS, et al. , Raman Spectroscopy of Biological Tissues. Applied Spectroscopy Reviews, 2015. 50(1): p. 46–111. [Google Scholar]
- 12.Ilin Y and Kraft ML, Identifying the lineages of individual cells in cocultures by multivariate analysis of Raman spectra. Analyst, 2014. 139(9): p. 2177–2185. [DOI] [PMC free article] [PubMed] [Google Scholar]
- 13.Suhito IR, et al. , In situ label-free monitoring of human adipose-derived mesenchymal stem cell differentiation into multiple lineages. Biomaterials, 2018. 154: p. 223–233. [DOI] [PubMed] [Google Scholar]
- 14.Downes A, et al. , Raman spectroscopy and CARS microscopy of stem cells and their derivatives. Journal of Raman Spectroscopy, 2011. 42(10): p. 1864–1870. [DOI] [PMC free article] [PubMed] [Google Scholar]
- 15.Ilin Y, et al. , Identifying States along the Hematopoietic Stem Cell Differentiation Hierarchy with Single Cell Specificity via Raman Spectroscopy. Analytical Chemistry, 2015. 87(22): p. 11317–11324. [DOI] [PMC free article] [PubMed] [Google Scholar]
- 16.Ballabio D and Consonni V, Classification tools in chemistry. Part 1: linear models. PLS-DA. Analytical Methods, 2013. 5(16): p. 3790–3798. [Google Scholar]
- 17.Ramoji A, et al. , Characterization of different substrates for Raman spectroscopic imaging of eukaryotic cells. Journal of Raman Spectroscopy, 2016. 47(7): p. 773–786. [Google Scholar]
- 18.Butler HJ, et al. , Using Raman spectroscopy to characterize biological materials. Nature Protocols, 2016. 11(4): p. 664–687. [DOI] [PubMed] [Google Scholar]
- 19.Fullwood LM, et al. , Effect of substrate choice and tissue type on tissue preparation for spectral histopathoiogy by Raman microspectroscopy. Analyst, 2014. 139(2): p. 446–454. [DOI] [PubMed] [Google Scholar]
- 20.Wehbe K, et al. , The effect of optical substrates on micro-FTIR analysis of single mammalian cells. Analytical and Bioanalytical Chemistry, 2013. 405(4): p. 1311–1324. [DOI] [PMC free article] [PubMed] [Google Scholar]
- 21.Tse JR and Engler AJ, Preparation of Hydrogel Substrates with Tunable Mechanical Properties. Current Protocols in Cell Biology, 2010. 47(1): p. 10.16.1–10.16.16. [DOI] [PubMed] [Google Scholar]
- 22.Mikoliunaite L, et al. , The substrate matters in the Raman spectroscopy analysis of cells. Scientific Reports, 2015. 5(1): p. 13150. [DOI] [PMC free article] [PubMed] [Google Scholar]
- 23.Konorov SO, et al. , Silicon-Gold-Silica Lamellar Structures for Sample Substrates That Provide an Internal Standard for Raman Microspectroscopy. Analytical Chemistry, 2014. 86(19): p. 9399–9404. [DOI] [PubMed] [Google Scholar]
- 24.Georg Schulze H, et al. , Empirical Factors Affecting the Quality of Non-Negative Matrix Factorization of Mammalian Cell Raman Spectra. Applied Spectroscopy, 2017. 71(12): p. 2681–2691. [DOI] [PubMed] [Google Scholar]
- 25.Choi JS, et al. , Tracing Hematopoietic Progenitor Cell Neutrophilic Differentiation via Raman Spectroscopy. Bioconjugate Chemistry, 2018. 29(9): p. 3121–3128. [DOI] [PMC free article] [PubMed] [Google Scholar]
- 26.Flaim CJ, Chien S, and Bhatia SN, An extracellular matrix microarray for probing cellular differentiation. Nature Methods, 2005. 2(2): p. 119–125. [DOI] [PubMed] [Google Scholar]
- 27.Kaylan KB, Kourouklis AP, and Underhill GH, A High-throughput Cell Microarray Platform for Correlative Analysis of Cell Differentiation and Traction Forces. Journal of visualized experiments : JoVE, 2017(121): p. 55362. [DOI] [PMC free article] [PubMed] [Google Scholar]
- 28.Vancea J, et al. , Substrate effects on the surface topography of evaporated gold films—A scanning tunnelling microscopy investigation. Surface Science, 1989. 218(1): p. 108–126. [Google Scholar]
- 29.Szunerits S, Das MR, and Boukherroub R, Short- and Long-Range Sensing on Gold Nanostructures, Deposited on Glass, Coated with Silicon Oxide Films of Different Thicknesses. The Journal of Physical Chemistry C, 2008. 112(22): p. 8239–8243. [Google Scholar]
- 30.Challen GA, et al. , Mouse hematopoietic stem cell identification and analysis. Cytometry Part A, 2009. 75A(1): p. 14–24. [DOI] [PMC free article] [PubMed] [Google Scholar]
- 31.Yang L, et al. , Identification of Lin−Sca1+kit+CD34+Flt3− short-term hematopoietic stem cells capable of rapidly reconstituting and rescuing myeloablated transplant recipients. Blood, 2005. 105(7): p. 2717–2723. [DOI] [PubMed] [Google Scholar]
- 32.Okada S, et al. , In vivo and in vitro stem cell function ofc-kit- and Sca-1-positive murine hematopoietic cells. Blood, 1992. 80(12): p. 3044–50. [PubMed] [Google Scholar]
- 33.Gilchrist AE, et al. , Soluble Signals and Remodeling in a Synthetic Gelatin-Based Hematopoietic Stem Cell Niche. Advanced Healthcare Materials, 2019. 8(20): p. 1900751. [DOI] [PMC free article] [PubMed] [Google Scholar]
- 34.Beier BD and Berger AJ, Method for automated background subtraction from Raman spectra containing known contaminants. Analyst, 2009. 134(6): p. 1198–1202. [DOI] [PubMed] [Google Scholar]
- 35.AHERN A and GARRELL R, Characterization of polyacrylamide gel formation and structure by surface-enhanced Raman spectroscopy. Langmuir, 1988. 4(5): p. 1162–1168. [Google Scholar]
- 36.Gupta MK and Bansil R, Laser Raman spectroscopy of polyacrylamide. Journal of Polymer Science: Polymer Physics Edition, 1981. 19(2): p. 353–360. [Google Scholar]
- 37.Rintoul L, Lepage M, and Baldock C, Radiation Dose Distribution in Polymer Gels by Raman Spectroscopy. Applied Spectroscopy, 2003. 57(1): p. 51–57. [DOI] [PubMed] [Google Scholar]
- 38.Musumarra G, et al. , Potentialities of multivariate approaches in genome-based cancer research: identification of candidate genes for new diagnostics by PLS discriminant analysis. Journal of Chemometrics, 2004. 18(3-4): p. 125–132. [Google Scholar]
- 39.Li B, et al. , Rapid characterization and quality control of complex cell culture media solutions using raman spectroscopy and chemometrics. Biotechnology and Bioengineering, 2010. 107(2): p. 290–301. [DOI] [PubMed] [Google Scholar]
- 40.Rodaite-Riseviciene R, Snopok B, and Snitka V. In situ confocal Raman spectroscopy of single living Chinese hamster ovary cells grown on different substrates, in The 7th IEEE International Conference on Nano/Molecular Medicine and Engineering 2013. [Google Scholar]
- 41.Zhang X, et al. , Characterization of cellular chemical dynamics using combined microfluidic and Raman techniques. Analytical and Bioanalytical Chemistry, 2008. 390(3): p. 833–840. [DOI] [PMC free article] [PubMed] [Google Scholar]
- 42.Rangan S, et al. , Types of cell death and apoptotic stages in Chinese Hamster Ovary cells distinguished by Raman spectroscopy. Biotechnology and Bioengineering, 2018. 115(2): p. 401–412. [DOI] [PubMed] [Google Scholar]
Associated Data
This section collects any data citations, data availability statements, or supplementary materials included in this article.